biogas from anaerobic digestion of fruit and vegetable wastes: experimental results on pilot-scale...
TRANSCRIPT

Energy Conversion and Management 77 (2014) 22–30
Contents lists available at ScienceDirect
Energy Conversion and Management
journal homepage: www.elsevier .com/locate /enconman
Biogas from anaerobic digestion of fruit and vegetable wastes:Experimental results on pilot-scale and preliminary performanceevaluation of a full-scale power plant
0196-8904/$ - see front matter � 2013 Elsevier Ltd. All rights reserved.http://dx.doi.org/10.1016/j.enconman.2013.09.004
⇑ Corresponding author. Tel.: +39 070 6755720; fax: +39 070 6755717.E-mail address: [email protected] (D. Cocco).
Efisio Antonio Scano a,b, Carla Asquer a, Agata Pistis a, Luca Ortu a, Valeria Demontis a, Daniele Cocco b,⇑a Biofuels and Biomass Laboratory, Sardegna Ricerche, Z.I. Macchiareddu, 09010 Uta, CA, Italyb Department of Mechanical, Chemical and Materials Engineering, University of Cagliari, Via Marengo, 2 09123 Cagliari, Italy
a r t i c l e i n f o a b s t r a c t
Article history:Received 29 June 2013Accepted 5 September 2013
Keywords:Anaerobic digestionFruit and vegetable wasteBiogas productionMesophilic digestion
This paper presents the experimental results obtained through an anaerobic digestion pilot plant by usingfruit and vegetable wastes as single substrate. The substrate materials were sampled from the wastesproduced by the Fruit and Vegetable Wholesale Market of Sardinia (Italy).
The experimental study was carried out over a period of about 6 months to evaluate the most suitableoperating parameters of the process depending on the availability of different kinds of fruit and vegetablewastes over the different periods of the year. Overall, the optimum daily loading rate of wastes was35 kg/d, with a corresponding hydraulic residence time of 27 days. The optimum organic loadingrate ranged from 2.5 to 3.0 kgVS/m3 d and the average specific biogas production was about0.78 Nm3/kgVS, with a specific methane yield of about 0.43 Nm3/kgVS.
The results of the experimental investigation were used for a preliminary performance evaluationof a full-scale anaerobic digestion power plant for treating all the fruit and vegetable wastes producedby the Wholesale Market of Sardinia (9 t/d). The estimate of daily methane production (290 Nm3/d) leadsto a CHP unit with a power output of about 42 kW and an annual electrical production of about300 MW h/year (about 25% of the wholesale market electrical consumption). The AD power plant alsoshows interesting economic features, since its energy production cost (about 150 €/MW h) is slightlylower than the energy purchase cost of the wholesale market (about 200 €/MW h) and a Pay-Back Timeof about 7.25 years can be achieved in the case of dispatching the electrical energy to the national grid.The PBT decreases to about 5.4 years if 50% of the available thermal energy is used to substitute heatproduction from fossil fuel boilers.
� 2013 Elsevier Ltd. All rights reserved.
1. Introduction
Anaerobic digestion (AD) is a biochemical degradation processthat is widely used for the treatment and energy recovery frommany kinds of biomass, especially agricultural products andagro-industrial wastes [1–5]. The spread of this technology duringthe last decades is in accordance with the environmental and sus-tainability policies adopted by European Member States and withthe increasing use of low-cost feedstock in energy production fromrenewable sources.
The main product of the anaerobic digestion process is a gasmixture (biogas) mainly composed of methane (CH4) and carbondioxide (CO2) that is used as fuel for power and heat production.A secondary product of the process is a sludge residue (digestate)that can be directly used as soil amendment [6,7] or as starting
material for high quality compost preparation [8–10]. Since thedigestate contains significant amounts of unconverted organicmatter, it could be used as fuel for energy production after a dryingtreatment.
Fruit and vegetable wastes (FVWs) are a very important class ofresidues because they are produced in very large amounts in all thewholesale markets and in other activities in the world and theirlandfill disposal is quite difficult due to their very high perishabil-ity [11,12].
Fruits and vegetables are quickly degraded by contaminatingmicroorganisms and this takes place even faster when they exhibitsigns of mechanical damage or are excessively ripe. This generateshigh environmental complications even for short-term disposal.Moreover, the production of FVWs increases the operating costsof the markets due to both sales losses and transport and disposalcosts.
Scientific literature contains several studies on anaerobic diges-tion of FVWs [6,13–18]. However, just in a few studies have the

Nomenclature
Cp specific heat (J/kg K)CO&M operation and maintenance cost (€)CT total annual costs (€)EAUX auxiliary consumption energy (kW h)EN net energy production (kW h)h specific enthalpy (J/kg)H utilization factor (–)m mass (kg)PM mechanical power (W)QF substrate feeding heat (J)QH reactor electrical heat (J)QL reactor heat losses (J)QR biochemical reaction heat (J)S reactor outer surface (m2)t time (s)TA ambient temperature (�C)TR reactor temperature (�C)U overall heat transfer coefficient (W/m2 K)gM mechanical efficiency (–)
SubscriptsB biogasD digestateF feedstock
AcronymsAD anaerobic digestionCCR Capital Charge RateCHP Combined Heat and PowerCoE Cost of EnergyFOS/TAC ratio of volatile organic acid to alkaline buffer capacityFVWs fruit and vegetable wastesGPR Gas Production RateHHV Higher Heating ValueHRT Hydraulic Residence TimeLHV Lower Heating ValueOLR Organic Loading RateTCI Total Capital InvestmentTS Total SolidVS Volatile Solid
E.A. Scano et al. / Energy Conversion and Management 77 (2014) 22–30 23
results been obtained using FVWs as single substrate and, to theauthors’ knowledge, most of these experiments were performedin laboratory scale reactors (maximum size around 20 l). The onlyexperiments performed on pilot and industrial scale reactors usedfruit and vegetable wastes in co-digestion with other materials[19–21].
The aforementioned literature shows that anaerobic digestionof FVWs without any co-substrate is a challenging task becausetheir high simple sugars content often promotes fast acidificationof the biomass with a resulting inhibition of methanogenic bacteriaactivity. To reduce the effect of acidification and bacteria inhibitionprocesses, other substrates are often added for co-digestion (suchas manure and sewage sludge). In fact, the addition of suitable sub-strates ensures a better process stability by keeping almost con-stant the volatile solids content and by avoiding the increase ofeasily degradable substances. Unfortunately, most of the time itis very difficult to guarantee the availability of suitable amountsof other kinds of substrates for co-digestion of FVWs.
A better solution to reduce the effects of the acidification pro-cess is to feed the reactor with well-balanced mixtures of fruitand vegetable wastes to reduce the amount of fruit with high sim-ple sugars content. Moreover, the adoption of a two-stage AD reac-tor allows to improve the process stability, even though it requiresmore complex and expensive treatment plants [22,23].
Proper design of a full-scale FVWs treatment plant requires anextensive knowledge of the entire AD process and in particular ofthe effects produced by the chemical composition of the substrateboth on the biogas production rate and the overall energy balanceof the system. For this reason, the main experimental results of apilot-scale anaerobic digestion reactor (1.13 m3 of volume) fed byFVWs single substrates are presented in this paper. In particular,the substrate materials were sampled from the wastes of the Fruitand Vegetable Wholesale Market of Sardinia (Mercato Ortofrutti-colo della Sardegna – Italy). This market, the largest of the island,receives around 150,000 t/year of fruit and vegetables and pro-duces 8–10 t/d of wastes. The experiment was carried out over aperiod of about 6 months to assess the effects produced by theavailability of different kinds of fruit and vegetable wastes overthe different periods of the year and to find the optimum operatingparameters of the process. The results of the experimental investi-
gation were then used for a preliminary performance evaluation ofa full-scale anaerobic digestion power plant for treating all theFVWs produced by the Wholesale Market of Sardinia.
2. Materials and methods
2.1. Pilot-scale anaerobic digestion system
Fig. 1 shows the pilot scale anaerobic digestion plant used forthe experimental investigation. The plant is equipped as follows:a cutter for substrate pre-treatment, a feeding hopper, a tubularhorizontal reactor, a pneumatic feeding pump, a pneumatic dige-state discharge pump, a biogas measuring and treatment unit, adigestate storage tank, an air compression unit, a gas holder anda control and supervision system. As shown in Fig. 1, the mainpieces of equipment of the process are allocated inside a container.
After cutting, the biomass is delivered to the feeding hopper,where it is mixed by means of a vertical stirrer before beingpumped inside the reactor. The feeding hopper is mounted on loadcells, it is thermally insulated and can be heated through an elec-tric heater. The tubular horizontal reactor has an overall volumeof 1.13 m3, it is partially insulated with a polymeric layer andequipped with a radial stirrer and an electrical heating systemwhich guarantees an operating temperature up to 60 �C. The tem-perature is automatically monitored and regulated by means ofthree resistance temperature sensors (Pt 100) placed along thereactor and connected to the heating system. Reactor internal pres-sure is measured by means of a pressure transducer.
The biogas collection system includes a condensation trap formoisture removal, a flow meter and a polymeric gas holder. Thedigestate is removed from the reactor through a pneumatic dis-charge pump and conveyed to the digestate tank placed on loadcells. Table 1 reports the technical specifications of the main piecesof equipment.
The pilot plant is controlled by a PLC system that receives sig-nals from the different sensors and drives the main electrical andpneumatic pieces of equipment (pumps, stirrers, heaters, etc.).The following parameters are continuously measured, controlledand recorded by the PLC system: mass of feeding biomass and dig-estate, volume of produced biogas, temperature along the reactor

Fig. 1. Anaerobic digestion pilot scale system.
Table 1Main technical specifications of the pilot plant equipment.
Cutter 200 kg/h, 4.5 kWFeeding hopper volume 0.25 m3
Feeding hopper heaters 1 kWBiomass pneumatic feeding pump 360 kg/hTubular reactor operating volume 0.95 m3
Tubular reactor insulation thickness 30 mmTubular reactor insulation thermal conductivity 0.004 W/mK (40 �C)Tubular reactor heaters 5 kWDigestate pneumatic discharge pump 360 kg/hDigestate tank volume 0.20 m3
Compressed air unit 2.2 kW, 235 l/minGas holder volume 0.65 m3
24 E.A. Scano et al. / Energy Conversion and Management 77 (2014) 22–30
(acquired in three different positions), outlet gas pressure, state ofsecurity sensors. The other chemical/physical parameters requiredfor an effective monitoring of the anaerobic digestion process weredaily characterized in the laboratory, as explained in the followingsection.
2.2. FVWs sampling, preparation and characterization
The substrate materials used for the experimental assessmentwere sampled twice a week in the Fruit and Vegetable WholesaleMarket of Sardinia (Mercato Ortofrutticolo della Sardegna – Italy)for the full duration of the experiment. The samples were preparedas a mixture of different fruits and vegetables to reproduce themean composition of the whole wastes produced by the wholesalemarket.
Once received in the laboratory, every sample was ground andhomogenized by means of the cutter. If not immediately processed,the samples were stored in a refrigerator at 4 �C for a few days orfrozen and stored at �18 �C for later use.
All samples were characterized in terms of chemical and phys-ical properties. In particular, the Total Solid (TS) content, the Vola-tile Solid (VS) content, the ash content, the Higher Heating Value(HHV) and the ultimate composition (C, H, N, and S content) weredetermined. The TS and VS content of the substrate were deter-mined with a LECO TGA701 Thermo Gravimetric Analyzer accord-ing to the ASTM D5142 Moisture Volatile Ash method. The sameinstrument was used for the determination of TS and VS contentin the digestate. The HHV of both substrate and digestate was mea-sured according to the UNI EN 14918:2009 method with LECOAC500 Isoperibolic Calorimeter. The content of C, H, N and S wasdetermined by means of LECO TRUSPEC CHN according to theASTM D5373 method. The biogas composition (amount of meth-ane, carbon dioxide, oxygen, hydrogen sulfide and ammonia) was
determined with Geotech GA2000 Gas Analyzer, while its HHVwas simply calculated starting from the methane content and itsHHV (55.5 MJ/kg or 39.62 MJ/Nm3).
2.3. Operating procedures and process monitoring
The experiment was started by inoculating the reactor with950 kg of digestate from anaerobic digestion of pig manure to pro-vide the starting population of microorganisms. The chemical com-position of this inoculum is shown in Table 2. The temperature ofthe reactor was then gradually raised up to mesophilic conditions(35 ± 0.5 �C) and this temperature was kept constant for the dura-tion of the experiment. To allow good adaptation of the microbialpopulation to the feeding substrate, the initial volume of inoculumwas gradually substituted with FVWs. The start-up phase lastedabout 44 days, during which the complete substitution of the ini-tial pig manure digestate with FVWs was achieved. Overall, themonitoring period lasted 174 days, including the start-up period.
After the start-up period, three other cycles of complete substi-tution of the biomass inside the reactor were carried out. In thispaper we refer to these cycles as phase 1, phase 2 and phase 3.The start-up period took place during winter (the average ambienttemperature was 15 �C), phase 1 during spring (19 �C average tem-perature) and phases 2 and 3 during summer (26 �C average tem-perature). As better discussed later in this work, the FVWssubstrates used during the various phases of the experiment haddifferent properties, depending on the seasonality of the differentwholesale wastes.
The goal of the experimental study was to identify the optimumoperating parameters of the AD process to achieve the efficientconversion of FVWs into biogas. Control of the process was carriedout by monitoring the reactor mass content and the most impor-tant operating parameters, such as: TS and VS of both substrateand digestate, Organic Loading Rate (OLR), FOS/TAC ratio, pH, bio-gas composition, Gas Production Rate (GPR), Hydraulic ResidenceTime (HRT).
2.4. Mass and energy balance
For a given operating period, the mass balance of the AD pilotplant was checked through the following simple equation:
mF ¼ mB þmD ð1Þ
where mF, mB and mD are the mass of feeding substrate, the mass ofthe biogas produced and the mass of the discharged digestate,respectively. The mass balance does not include the mass of waterremoved from the biogas by means of the condensation trap. In fact,

Table 2Chemical composition of the digestate used as inoculum.
Inoculum TS (% wb) VS (% TS) C % TS H % TS N % TS S % TS
Pig manure digestate 9.15 76.7 47.13 5.37 2.54 0.45
E.A. Scano et al. / Energy Conversion and Management 77 (2014) 22–30 25
in comparison to the main mass flows, the amount of condensatewater can be neglected (the water content in the produced biogasis lower than 0.1% of mB).
The energy balance of the system was evaluated by means ofthe following equation:
mF � ðHHVþ hÞF þ Q H þ Q R þ EAUX
¼ mB � ðHHVþ hÞB þmD � ðHHVþ hÞD þ Q L ð2Þ
where h is the specific enthalpy of inlet and outlet flows, QH is thethermal energy supplied by means of the electrical heaters, QR is theheat released by the exothermic biochemical reactions, QL are thethermal losses (due to the temperature difference between the di-gester and the external air) and EAUX is the overall electrical energyconsumption for the plant auxiliaries (cutter, stirrer, pumps andother instrumentation).
For the evaluation of the different terms of Eq. (2), severalassumptions were made. In particular, reaction heat QR was ne-glected because it gives only a minor contribution to the overallenergy balance. In the case of mesophilic digestion, the tempera-ture of inlet and outlet flows is very close to the reference temper-ature (25 �C) so that the enthalpy contribution can be neglected.Thermal energy QH is required to keep the reactor temperatureconstant and includes two different contributions: the energy QF
required to heat the feeding substrate from ambient temperatureto the digester temperature and the energy required to balancethermal losses QL. Overall, QH was evaluated by means of the fol-lowing equation:
Q H ¼ Q F þ Q L ¼ mF � Cp � ðTR � TAÞ þ U � S � ðTR � TAÞ ð3Þ
where TR is the reactor temperature (35 �C), TA is the air tempera-ture, Cp is the specific heat capacity of the substrate (here assumedequal to 4187 J/kg K), U is the overall heat transfer coefficient and Sis the outer surface of the reactor. In particular, owing to the verylow substrate velocity inside the reactor, the overall heat transfercoefficient U was evaluated by neglecting the heat convection be-tween substrate and internal reactor wall. Therefore, only the heatconduction through the reactor wall and the insulation layer andthe natural heat convection from the reactor outer surface to theambient air was considered [24].
To calculate overall energy consumption EAUX, the electrical en-ergy consumption of each piece of equipment was evaluated bymeans of the following general equation:
EE ¼PM
gM� K � t ð4Þ
where PM and gM are the mechanical power and the efficiency of theelectric motor, K is the utilization factor and t is the operating time.
The energy content of biomass feedstock, biogas and digestatewas evaluated starting from data recorded by the PLC (amountsof inlet and outlet flows) and from the laboratory analysis (HHVof feedstock, digestate and biogas). In the same way, QH and EAUX
were evaluated starting from the main technical specification ofthe different components (Table 1), as well as from data recordedby the PLC (reactor temperature, operating time, etc.).
3. Results and discussion
3.1. Physical–chemical characterization of FVW
As mentioned, the experimental period can be virtually splitinto four phases, during which four complete substitution cyclesof the biomass inside the reactor are achieved. According to theseasonality of the wastes produced by the Fruit and VegetableWholesale Market of Sardinia, the sample mixes used as feedingmaterial for the AD process showed a different composition duringthe whole experimental period.
Table 3 reports the main composition of the sample mixes usedin the experimental study. In particular, it shows that during thestart-up phase as well as in phases 1 and 2, the sample mixes weremainly composed of vegetable wastes (the fruit percentage wasabout one third), while during phase 3 the sample mixes consistedmainly of fruit wastes. It is very important to point out that the useof substrates with a high content of fruit wastes strongly affectsthe anaerobic digestion process. In fact, fruit contains a largeamount of simple sugars that increase the CO2 content of the bio-gas and therefore reduce its methane content.
3.2. Pilot scale experimental results
Fig. 2a–d summarizes the most important results of the studyin terms of daily loading rate and volatile solid content of thesubstrate (Fig. 2a), organic loading rate (Fig. 2b), FOS/TAC ratioand pH (Fig. 2c), biogas production rate and methane content(Fig. 2d).
As shown in Fig. 2a, the mass flow rate was increased constantlyduring the whole start-up phase to achieve a complete substitutionof the initial inoculum. In the following three phases fluctuationsin the daily loading rate were caused by the corrective actions re-quired to control the organic loading rate (OLR), in accordance withthe different composition of the sample mixes.
As is well known, the organic loading rate is one of the mostinfluential parameters of anaerobic reactors as well as one ofthe most important design parameters of full-scale AD plants.For this reason, the experimental study mainly aimed at identify-ing the optimum OLR value able to achieve the best performancein terms of biogas production rate and methane content. More-over, to collect additional information about process evolution,the FOS/TAC ratio and the pH inside the reactor were continu-ously monitored. As is well known, the FOS/TAC parameter isthe ratio between volatile organic acid (measured in mg/l ofequivalent acetic acid) and alkaline buffer capacity (measured inmg/l of CaCO3) and it is a commonly used parameter for the prac-tical monitoring of anaerobic digestion processes [25,26].
As shown in Fig. 2b, in the start-up phase the OLR was increasedup to about 3 kgVS/d m3, with a corresponding increase of the FOS/TAC ratio. Literature studies report that as a general rule the FOS/TAC ratio of anaerobic digestion processes should be in the rangeof 0.3–0.4 and that FOS/TAC ratios above 0.4 could result in unsuit-able operating conditions for the microbial population with a de-crease in biogas production [27]. For this reason, at the end ofthe start-up phase, once the FOS/TAC ratio reached values above0.4, the OLR was reduced to about 1.5–2.0 kgVS/d m3. Fig. 2c dem-onstrates that, after an intermediate operating period in which the
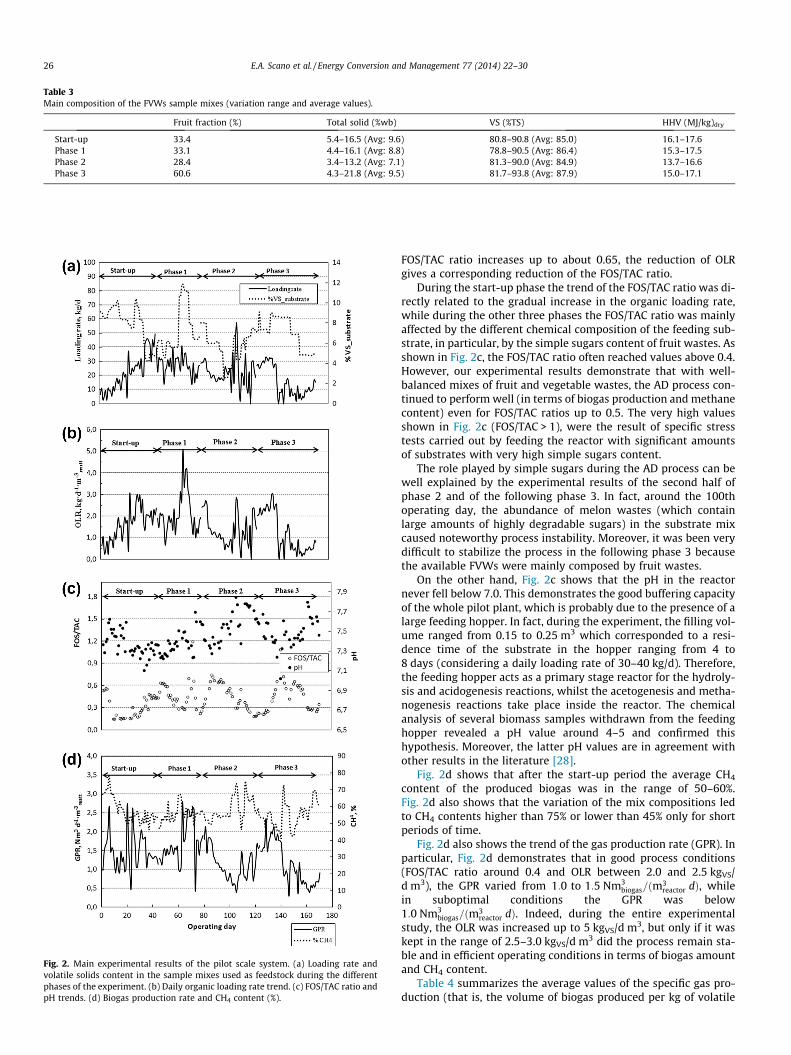
Table 3Main composition of the FVWs sample mixes (variation range and average values).
Fruit fraction (%) Total solid (%wb) VS (%TS) HHV (MJ/kg)dry
Start-up 33.4 5.4–16.5 (Avg: 9.6) 80.8–90.8 (Avg: 85.0) 16.1–17.6Phase 1 33.1 4.4–16.1 (Avg: 8.8) 78.8–90.5 (Avg: 86.4) 15.3–17.5Phase 2 28.4 3.4–13.2 (Avg: 7.1) 81.3–90.0 (Avg: 84.9) 13.7–16.6Phase 3 60.6 4.3–21.8 (Avg: 9.5) 81.7–93.8 (Avg: 87.9) 15.0–17.1
Fig. 2. Main experimental results of the pilot scale system. (a) Loading rate andvolatile solids content in the sample mixes used as feedstock during the differentphases of the experiment. (b) Daily organic loading rate trend. (c) FOS/TAC ratio andpH trends. (d) Biogas production rate and CH4 content (%).
26 E.A. Scano et al. / Energy Conversion and Management 77 (2014) 22–30
FOS/TAC ratio increases up to about 0.65, the reduction of OLRgives a corresponding reduction of the FOS/TAC ratio.
During the start-up phase the trend of the FOS/TAC ratio was di-rectly related to the gradual increase in the organic loading rate,while during the other three phases the FOS/TAC ratio was mainlyaffected by the different chemical composition of the feeding sub-strate, in particular, by the simple sugars content of fruit wastes. Asshown in Fig. 2c, the FOS/TAC ratio often reached values above 0.4.However, our experimental results demonstrate that with well-balanced mixes of fruit and vegetable wastes, the AD process con-tinued to perform well (in terms of biogas production and methanecontent) even for FOS/TAC ratios up to 0.5. The very high valuesshown in Fig. 2c (FOS/TAC > 1), were the result of specific stresstests carried out by feeding the reactor with significant amountsof substrates with very high simple sugars content.
The role played by simple sugars during the AD process can bewell explained by the experimental results of the second half ofphase 2 and of the following phase 3. In fact, around the 100thoperating day, the abundance of melon wastes (which containlarge amounts of highly degradable sugars) in the substrate mixcaused noteworthy process instability. Moreover, it was been verydifficult to stabilize the process in the following phase 3 becausethe available FVWs were mainly composed by fruit wastes.
On the other hand, Fig. 2c shows that the pH in the reactornever fell below 7.0. This demonstrates the good buffering capacityof the whole pilot plant, which is probably due to the presence of alarge feeding hopper. In fact, during the experiment, the filling vol-ume ranged from 0.15 to 0.25 m3 which corresponded to a resi-dence time of the substrate in the hopper ranging from 4 to8 days (considering a daily loading rate of 30–40 kg/d). Therefore,the feeding hopper acts as a primary stage reactor for the hydroly-sis and acidogenesis reactions, whilst the acetogenesis and metha-nogenesis reactions take place inside the reactor. The chemicalanalysis of several biomass samples withdrawn from the feedinghopper revealed a pH value around 4–5 and confirmed thishypothesis. Moreover, the latter pH values are in agreement withother results in the literature [28].
Fig. 2d shows that after the start-up period the average CH4
content of the produced biogas was in the range of 50–60%.Fig. 2d also shows that the variation of the mix compositions ledto CH4 contents higher than 75% or lower than 45% only for shortperiods of time.
Fig. 2d also shows the trend of the gas production rate (GPR). Inparticular, Fig. 2d demonstrates that in good process conditions(FOS/TAC ratio around 0.4 and OLR between 2.0 and 2.5 kgVS/d m3), the GPR varied from 1:0 to 1:5 Nm3
biogas=ðm3reactor dÞ, while
in suboptimal conditions the GPR was below1:0 Nm3
biogas=ðm3reactor dÞ. Indeed, during the entire experimental
study, the OLR was increased up to 5 kgVS/d m3, but only if it waskept in the range of 2.5–3.0 kgVS/d m3 did the process remain sta-ble and in efficient operating conditions in terms of biogas amountand CH4 content.
Table 4 summarizes the average values of the specific gas pro-duction (that is, the volume of biogas produced per kg of volatile

Table 4Average values of the specific gas production and the biogas composition.
Experimental period Biogas production (Nm3/kgsv) Average biogas composition
CH4 (%vol) CO2 (%vol) O2 (%vol) NH3 (ppm) H2S (ppm) H2O (ppm)
Start-up 0.81 58.2 41.6 0.2 170 444 0.3Phase 1 0.72 54.4 45.4 0.2 99 395 0.1Phase 2 0.76 58.2 41.5 0.3 11 262 0.1Phase 3 0.84 55.0 44.8 0.2 – 43 0.1
E.A. Scano et al. / Energy Conversion and Management 77 (2014) 22–30 27
solids fed to the pilot plant) and the biogas composition during thefour main experimental phases.
Overall, the experimental study allowed us to highlight that theoptimum daily loading rate of FVWs for the pilot plant was 35 kg/d,which leads to an average HRT of 27 days. For higher values of thedaily loading rate several stress signals of the AD process were de-tected, such as low pH values, high FOS/TAC ratios, low biogas pro-duction rates and low CH4 contents of the biogas produced. Theoptimal organic loading rate ranged from 2.5 to 3.0 kgVS/m3 dand the average specific biogas production was 0.78 Nm3/kgVS,with a specific methane yield of 0.43 Nm3/kgVS. It is noteworthythat these values are quite high if compared to other literature re-sults obtained in mesophilic conditions with FVWs or similar res-idues [13,29].
As is well known, the utilization of biogas in internal combus-tion engines is a well established technology. However, the useof biogas with high H2S contents leads to acidification of the engineoil and therefore to a shorter oil service life. Moreover, H2S andcondensate can cause corrosion in the gas line. For this reason,AD power plants often includes a biogas cleaning process upstreamthe internal combustion engine [30]. Nevertheless, as shown by Ta-ble 4, the contents of hydrogen sulfide and water in the biogas pro-duced during the experimental study are lower than the limitvalues (about 1000 ppm) suggested for the use in internal combus-tion engines [31] and therefore a biogas cleaning process may notbe strictly required.
3.3. Mass and energy balance
In the experimental period the AD pilot plant treated about3550 kg of FVWs, with an overall biogas production of 246 kg(216 m3). Actually, a cumulative feedstock mass of 4500 kg wasused, but the 950 kg of pig manure digestate cannot be includedin the balance of the feeding substrate, because it was used onlyas inoculum for the AD process.
Throughout the experiment, the cumulative mass of digestatewas about 3250 kg and was essentially composed of water. Thisis because biogas originates from the total solids fraction (and inparticular from volatile solids) of the substrate. The analysis ofsome samples of digestate showed an average TS content of 2%and a HHV of 13 MJ/kg (dry basis). Therefore, during the overalloperating period, about 76% of TS content of the feeding substratewas converted into biogas, while the average conversion of VS wasabout 82.5%.
Table 5Cumulative mass and energy balance of FVWs, biogas and digestate.
Experimental period FVWs Biogas production Digestate
(kg) (MJ) (Nm3) (MJ) (kg) (MJ)
Start-up 943 1829 55 229.5 861 215Phase 1 941 1458 51 189.9 863 216Phase 2 952 1189 43 173.5 883 221Phase 3 715 1018 46 172.5 643 161
Table 5 summarizes the mass and energy balance of FVWs, bio-gas and digestate during the four phases of the experimental per-iod. During the start-up phase and the first two phases the totalamount of treated substrate was quite similar whereas duringPhase 3 the pilot plant was able to treat a smaller amount of FVWsdue to the impossibility of achieving process stability. In fact, dueto the substrate composition, not only was the loading rate verylow but also the hydraulic retention time reached high values com-pared to the average value of 27 days.
Table 6 summarizes the main energy performance parametersof the pilot plant during the four operating phases. It shows thatthe electricity consumption of the main auxiliaries was quite sim-ilar for all four operating phases because the operating conditionsand the amount of feeding FVWs were almost the same throughoutthe experimental study. Most of the electrical consumption of thepilot plant was due to the pumping system (58% on the average)and the cutter (40%), while the two stirrers had a slight impacton overall energy consumption (only 2%). With reference to theheat balance of the pilot plant, Table 6 shows that the thermal en-ergy requirement of the pilot plant decreased during the experi-mental period due to the increasing ambient temperature.Moreover, the large portion of heat consumption (about 80–90%)was due to reactor losses owing to its poor insulation, while theheat consumption for substrate heating only accounts for only asmall fraction (10–20%) of the overall thermal energyrequirements.
Table 6 also shows a rough estimate of the electrical and ther-mal energy that could be produced by feeding the biogas to a ded-icated Combined Heat and Power (CHP) plant. In particular,according to the mass flow of produced biogas, the electricity pro-duction was estimated by considering a CHP plant based on aninternal combustion engine with 1 kWe of net power output. Ta-ble 6 also reports an estimate of electrical and thermal energy pro-duced by the CHP plant, by assuming 20% of electrical efficiencyand 65% of thermal efficiency.
The potential electrical energy production of the pilot plantwas estimated at 0.06 kW h/kg. The comparison of the latter va-lue with the average electrical energy required by plant auxilia-ries (about 0.05 kW h/kg) leads to a positive electrical balanceof the overall system. Only during phase 2 was the electricalbalance of the system slightly negative due to the lower valueof the gas production rate caused by the use of FVWs with highsugar content (see Fig. 2d). Moreover, Table 6 shows that thethermal energy balance was largely positive during the entirestudy.
It is noteworthy that the pilot plant was specifically designedonly for experimental purposes and not for energy production.For this reason, the specific electrical and thermal energy con-sumptions were higher than those of full-scale AD plants. The en-ergy requirements for FVWs treatment can be significantly reducedin industrial-scale plants thanks to the optimized design of the dif-ferent plant auxiliaries, the better insulation of the reactor and thehigher electrical conversion efficiency of the power generationsection.

Table 6Main energy performance of the AD pilot plant.
Experimental period Electrical energy Thermal energy
Consumption Production Consumption Production
(kW h) (kW h/kg) (kW h) (kW h/kg) (kW h) (kW h/kg) (kW h) (kW h/kg)
Start-up 47.4 0.050 63.8 0.067 76.5 0.081 207.2 0.220Phase 1 45.5 0.048 52.8 0.056 47.3 0.050 180.8 0.186Phase 2 48.3 0.051 48.2 0.049 30.2 0.032 156.7 0.160Phase 3 37.6 0.053 47.9 0.071 27.4 0.038 155.8 0.232
Fig. 3. Process flow diagram of the full scale biogas power plant.
Table 7Main design data for the full-scale anaerobic digestion power plant.
Daily FVW production 9 t/dFVW composition TS = 8.7%wb VS = 86%TSProcess temperature 35 �COrganic loading rate 2.5 kgVS/(m3d)Specific biogas production 0.78 Nm3/kgVS
Specific methane production 0.43 Nm3/kgVS
HRT 1st and 2nd stage 5/25 daysCHP electrical/thermal efficiency 35%/50%Auxiliaries electrical consumption 10 kW h/tFVW
CHP utilization factor 92%
28 E.A. Scano et al. / Energy Conversion and Management 77 (2014) 22–30
4. Preliminary performance evaluation of a full-scale AD powerplant
The results obtained on the pilot scale were used for a prelimin-ary performance evaluation of a full-scale anaerobic digestionplant for the treatment of all wastes produced by the Fruit andVegetable Wholesale Market of Sardinia. Fig. 3 shows the simpli-fied process flow diagram of the full-scale biogas power plant.
The full-scale plant is based on a two-stage AD reactor to sepa-rate the hydrolysis and acidogenesis phases from the methanogen-esis phase, as suggested by the results of the experimental study(Section 3.2). Moreover, the plant includes a FVWs storage sectionbased on two separate tanks for fruit wastes and vegetable wastesto ensure, if possible, a proper balance of the feeding mix. The pro-duced biogas feeds a CHP unit based on an internal combustion en-gine integrated with a heat recovery section. The thermal energyrequirement of the AD process is provided by a portion of thehot water produced by the CHP unit. Similarly, the CHP unit alsoprovides the electricity for the plant auxiliaries (shredders, pumps,stirrers, biogas compressors and other instrumentation).
The main assumptions of the preliminary performance evalua-tion of the full-scale AD power plant are summarized in Table 7.In accordance with to the results of the experimental study, theAD power plant was designed for an average FVWs production of9 t/d, an organic loading rate of 2.5 kgVS/m3 d, an overall HRT of30 days and a specific methane production of 0.43 Nm3/kgVS. Theassumptions concerning the electrical and thermal efficiencies ofthe CHP unit were based on typical values for commercial units.The thermal energy requirements of the AD process were calcu-lated on a daily basis as the sum of the heat required to raise thefeedstock temperature to the process temperature and to compen-sate reactor heat losses. The specific electrical consumption of
plant auxiliaries (10 kW h/t) was assumed in agreement with theperformance of commercial systems. It is interesting to point outthat these values are much lower than those of the pilot plant(about 50 kW h/t) due to the optimized design.
The overall working volumes of the first (45 m3) and secondstage (225 m3) reactors were estimated on the basis of daily wasteproduction and the corresponding HRT. Moreover, an aspect ratioof 0.4 and an insulation layer of 0.1 m was considered for bothreactors. The gross electrical and thermal yields were calculatedstarting from biogas production and the electrical and thermal effi-ciencies of the CHP unit (both referred to the fuel LHV). The netelectrical production was therefore estimated by subtracting inter-nal consumptions from the gross energy production.
Table 8 summarizes the main performance estimated for thefull-scale AD plant. According to the average LHV of the biogas pro-duced (19.6 MJ/Nm3), a first estimate of daily methane production(290 Nm3/d) suggests a CHP unit with a power output of about42 kW. The net electrical energy production is about 911 kW h/d,with a corresponding annual production of 306 MW h/year, which
Table 8Main performance for the full-scale AD power plant.
Overall (1st + 2nd stage) digester volume 270 m3
Average biogas production 525.2 Nm3/dMethane production 289.6 Nm3/dBiogas primary energy production 2859.6 kW h/dCHP power output 41.7 kWGross electrical energy production 1000.9 kW h/dGross thermal energy production 1429.8 kW h/dElectrical energy consumption 90 kW h/dThermal energy consumption 86.4 kW h/dNet electrical energy production 910.9 kW h/dThermal energy available 1343.4 kW h/d
E.A. Scano et al. / Energy Conversion and Management 77 (2014) 22–30 29
is enough to cover almost 25% of wholesale market electrical con-sumption. Since the heat requirements of the AD process are verylow, almost all the thermal energy production of the CHP unit(1343 kW h/d) is available for other users (either inside or outsidethe wholesale market itself.
As mentioned, the electrical energy produced by the AD plantcan be used to cover a portion of the overall internal consumptionof the wholesale market. For this reason, a preliminary economicanalysis to evaluate the energy production cost is included in thispaper. In particular, the equivalent Cost of Energy (CoE) was calcu-lated here through the ratio between the total annual costs CT andthe annual electrical energy production EN:
CoE ¼ CT
EN¼ TCI � CCR þ CO&M
ENð5Þ
where TCI is the Total Capital Investment, CCR is the Capital ChargeRate and CO&M are the annual operating and maintenance costs. TheCapital Charge Rate depends on the annual interest rate (7% in thiscase) and the operating lifetime (20 years). On the basis of a marketanalysis, the Total Capital Investment was estimated to be300,000 €, while the annual operating and maintenance costs areassumed to be equal to 6% of the TCI.
The economic analysis shows that the equivalent energy pro-duction cost of the full-scale AD power plant is about 151 €/MW h, which is lower than the energy purchase cost of the whole-sale market (about 200 €/MW h). Obviously, lower CoE valuesshould be achieved if at least a portion of the available thermal en-ergy is effectively used. For example, the CoE decreases to about100 €/kW h if 50% of the available thermal energy is used to substi-tute fossil fuels for heat production in conventional boilers (assum-ing a boiler efficiency of 90%, fuel oil with an LHV of 41 MJ/kg and acost of 0.65 €/kg).
However, on the basis of current Italian legislation, an interest-ing option is represented by the dispatch to the national grid of theelectrical energy produced by the AD power plant. In fact, the mostrecent Italian policy for renewable sources supports energy pro-duction from small-size biogas power plants (from 1 to 300 kWe)through a feed-in tariff of 236 €/MW h [32]. In this case, the eco-nomic analysis carried out with the same assumptions (interestrate, operating lifetime, Total Capital Investment, operating andmaintenance cost, etc.) shows a Net Present Value of about274,000 € and a Pay-Back Time of about 7.25 years. Once again,better results can be achieved if the available thermal energy isused. In particular, the PBT decreases to about 5.4 years if 50% ofthe available thermal energy is used to substitute heat productionfrom fossil fuel boilers.
5. Conclusions
The results of the experimental study presented in this papershow that the use of fruit and vegetable wastes as a single sub-strate for biogas production is a challenging process and that
substrate composition has a great influence on overall perfor-mance. In fact, to maximize the yield of biogas and to improveits quality (high methane content and low H2S content) differentstrategies can be followed. Firstly, the daily organic loading ratemust be kept constant. Secondly, the use of a well balanced mixof fruit and vegetable wastes in the feeding substrate is required.In particular, the use of substrates with contents of simple sugarslower than 40% ensures process stability and a good methane pro-duction rate. Thirdly, a two stage process to separate the hydrolysisand acidogenesis phases from the methanogenesis phase is sug-gested. Moreover, the plant should include a FVWs storage sectionbased on two separate tanks for fruit and vegetable wastes, to en-sure a suitable balance of the feeding mix. Finally, to reduce theH2S content of the produced biogas and therefore the correspond-ing biogas upgrading costs, the use of leafy vegetables (which arecharacterized by significant sulfur contents) must be carefullymanaged.
During the entire experimental period, the AD pilot plant trea-ted about 3550 kg of FVWs, with an overall biogas production of246 kg (216 m3). Therefore, about 76% of the total solid contentof the feeding substrate was converted into biogas, while the aver-age conversion of volatile solids was about 82.5%. Overall, the opti-mum daily loading rate of wastes was 35 kg/d, with acorresponding hydraulic residence time of 27 days. For higher val-ues of the daily loading rate several stress signals of the AD processwere detected, such as high FOST/TAC ratios, low biogas produc-tion rates and low CH4 content of the produced biogas. The opti-mum organic loading rate ranged from 2.5 to 3.0 kgVS m�3d�1
and the average specific biogas production was about 0.78 Nm3/kgVS, with a specific methane yield of about 0.43 Nm3/kgVS.
The experimental results obtained on the pilot scale were usedfor a preliminary performance evaluation of a full-scale anaerobicdigestion plant for the treatment of all the wastes produced bythe Fruit and Vegetable Wholesale Market of Sardinia. A two-stageAD reactor was considered for separating the hydrolysis and acido-genesis phases from the methanogenesis phase. Moreover, theplant includes a FVWs storage section based on two separate tanksfor fruit wastes and vegetable wastes to ensure a suitable balanceof the feeding mix.
Assuming a daily supply of 9 t/d of FVWs, the biogas producedby the AD process can be used to feed a combined heat and powergeneration plant rated at 42 kWe, which is able to cover almost25% of the wholesale market’s electrical consumption.
The economic analysis shows that the energy production cost ofthe full-scale AD power plant (about 150 €/MW h) is lower thanthe energy purchase cost of the wholesale market (about 200 €/MW h). Furthermore, another interesting option is representedby the dispatch to the national grid of the electrical energy pro-duced by the AD power plant, since a Pay-Back Time of about7.25 years can be achieved. Lower PBT values would be achievedin the case of effective use of thermal energy.
Acknowledgements
The authors wish to thank Prof. Antonio Lallai for useful discus-sions. This work was carried out in the framework of an agreementprotocol between the Fruit and Vegetable Wholesale Market ofSardinia and Sardegna Ricerche – Technology Park of Sardinia.
References
[1] Ward AJ, Hobbs PJ, Holliman PJ, Jones DL. Optimisation of the anaerobicdigestion of agricultural resources. Biores Technol 2008;99:7928–40.
[2] Álvarez JA, Otero L, Lema JM. A methodology for optimising feed compositionfor anaerobic co-digestion of agro-industrial wastes. Biores Technol2010;101:1153–8.

30 E.A. Scano et al. / Energy Conversion and Management 77 (2014) 22–30
[3] Murto M, Björnsson L, Mattiasson B. Impact of food industrial waste onanaerobic co-digestion of sewage sludge and pig manure. J Environ Manage2007;70:101–7.
[4] Yangin-Gomec C, Ozturc I. Effect of maize silage addition on biomethanerecovery from mesophilic co-digestion of chicken and cattle manure tosuppress ammonia inhibition. Energy Convers Manage 2013;71:92–100.
[5] Di Maria F, Sordi A, Micale C. Energy production from mechanical biologicaltreatment and composting plants exploiting solid anaerobic digestion batch:an Italian case study. Energy Convers Manage 2012;56:112–20.
[6] Tambone F, Scaglia B, D’Imporzano G, Schievano A, Orzi V, Salati S, et al.Assessing amendment and fertilizing properties of digestates from anaerobicdigestion through a comparative study with digested sludge and compost.Chemosphere 2010;81:577–83.
[7] Abubaker J, Risberg K, Pell M. Biogas residues as fertilizers – effects on wheatgrowth and soil microbial activities. Appl Energy 2012;99:126–34.
[8] Teglia C, Tremier A, Martel J-L. Characterization of solid digestates: Part 2,Assessment of the quality and suitability for composting of six digestedproducts. Waste Biomass Valoriz 2011;2(2):113–26.
[9] Holm-Nielsen JB, Al Seadi T, Oleskowicz-Popiel P. The future of anaerobicdigestion and biogas utilization. Biores Technol 2009;100:5478–84.
[10] Yazdani R, Barlaz MA, Augenstein D, Kayhanian M, Tchobanoglous G.Performance evaluation of an anaerobic/aerobic landfill-based digester usingyard waste for energy and compost production. Waste Manage2012;32:912–9.
[11] Viswanath P, Sumithra Devi S, Krishna Nand S. Anaerobic digestion of fruit andvegetable processing wastes for biogas production. Biores Technol1992;40:43–8.
[12] Viturtia MA, Mata-Alvarez J, Cecchi F. Two-phase continuous anaerobicdigestion of fruit and vegetable wastes. Resour Conserv Recycl1995;13:257–67.
[13] Khalid Azeem, Arshad Muhammad, Anjum Muzammil, Mahmood Tariq,Dawson Lorna. The anaerobic digestion of solid organic waste. WasteManage 2011;31:1737–44.
[14] Bouallagui H, Torrijos M, Godon JJ, Moletta R, Ben Cheikh R, Touhami Y, et al.Two-phases anaerobic digestion of fruit and vegetable wastes: bioreactorsperformance. Biochem Eng J 2004;21:193–7.
[15] Bouallagui H, Haouari O, Touhami Y, Ben Cheikh R, Marouani L, Hamdi M.Effect of temperature on the performance of an anaerobic tubular reactortreating fruit and vegetable waste. Process Biochem 2004;39:2143–8.
[16] Garcia-Peña EI, Parameswaran P, Kang DW, Canul-Chan M, Krajmalnik-BrownR. Anaerobic digestion and co-digestion processes of vegetable and fruit
residues: process and microbial ecology. Bioresour Technol2011;102:9447–55.
[17] Jiang Y, Heaven S, Banks CJ. Strategies for stable anaerobic digestion ofvegetable waste. Renew Energy 2012;44:206–14.
[18] Sharma VK, Testa C, Cornacchia G, Lastella G, Farina R. Anaerobic digestion ofsemi-solid organic waste available from orthofruit market: preliminaryexperimental results. Energy Convers Manage 1999;40:287–304.
[19] Macias-Corral M, Samani Z, Hansona A, Smith G, Funk P, Yu H, et al.Anaerobic digestion of municipal solid waste and agricultural waste andthe effect of co-digestion with dairy cow manure. Bioresour Technol2008;99:8288–93.
[20] Lastella G, Testa C, Cornacchia G, Notornicola M, Voltasio F, Sharma VK.Anaerobic digestion of semi-solid organic waste: biogas production and itspurification. Energy Convers Manage 2002;43(1):63–75.
[21] Sharma VK, Testa C, Lastella G, Cornacchia G, Comparato MP. Inclined-plug-flow type reactor for anaerobic digestion of semi-solid waste. Appl Energy2000;65:173–85.
[22] Bouallagui H, Touhami Y, Ben Cheikh R, Hamdi M. Bioreactor performance inanaerobic digestion of fruit and vegetable wastes. Process Biochem2005;40:989–95.
[23] Demirel B, Yenigun O. Two-phase anaerobic digestion processes: a review. JChem Technol Biotechnol 2002;77(7):743–55.
[24] Incropera FP, DeWitt DP. Fundamentals of heat and mass transfer. John Wiley& Sons; 2002.
[25] Hinken L, Vos E, Weichgrebe D, Rosenwinkel KH. FOS/TAC-Herleitung,Methodik, Anwendung und Aussagekraft. Biogas J 2012;6:94–100.
[26] Brambilla M, Araldi F, Marches M, Bertazzoni B, Zagni M, Navarotto P.Monitoring of the startup phase of one continuous anaerobic digester at pilotscale level. Biomass Bioenergy 2012;36:439–46.
[27] Lossie U, Pütz P. Targeted control of biogas plants with the help of FOS/TAC,(practice report). Hach Lange; 2008.
[28] Gosh A, Conrad JR, Klass L. Anaerobic acidogenesis of wastewater sludge.JWPCF 1975;47(1):30–44.
[29] Bohn I, Björnsson L, Mattiasson B. The energy balance in farm scale anaerobicdigestion of crop residues at 11–37 C. Process Biochem 2007;42:57–64.
[30] Rasi S, Läntelä J, Rintala J. Trace compounds affecting biogas energy utilisation– a review. Energy Convers Manage 2011;52:3369–75.
[31] IEA Bioenergy. Task 37 energy from biogas and landfill gas. Biogas upgradingto vehicle fuel standards and grid injection; 2006.
[32] Decreto ministeriale 6 luglio 2012. Incentivi per energia da fonti rinnovabilielettriche non fotovoltaiche.