farm-scale anaerobic digestion plant efficiency
TRANSCRIPT
March 2011
Project for DECC Lucy Hopwood Head of Biomass & Biogas
Farm-Scale Anaerobic Digestion Plant Efficiency

The NNFCC Building sustainable supply chains
The NNFCC is the UK’s national centre for renewable fuels, materials & technologies
We help bring products to market by building and strengthening supply chains
We support decision making with comprehensive independent advice NNFCC Biocentre, York Science Park, Innovation Way, Heslington York YO10 5DG, UK Tel: +44 (0)1904 435182 [email protected] www.nnfcc.co.uk
Farm-Scale AD Plant Efficiency, March 2011
2
1. Executive Summary The Coalition Agreement, published in May 2010, stated ‘We will introduce measures to promote a huge increase in energy from waste through AD’ with the focus therefore on maximising the efficient use of available waste. While on-farm AD plants can theoretically operate using only manures and slurries, stakeholders have informed DECC that, in order to operate efficiently and cost-effectively, a certain amount of ‘energy crop’ is required. This project seeks to determine how much, if any, energy crop is required to ensure that on-farm AD plants using slurry or manure as the primary feedstock are able to operate effectively and the amount required, where necessary, to make the plant cost-effective. The operations and economics of farm-based AD projects vary dependent on the existing farming-system, availability and seasonality of feedstocks, labour and capital, and the output requirements of the operator. A number of scenarios have been modelled in this project to illustrate the impact on costs and returns of including energy crop material in a dairy slurry-based AD system. Three ‘typical’ farm sizes, combined with a range of slurry to crop ratios and three crop types were modelled. The crops most appropriate for production in the UK as a supplementary feedstock for AD are maize silage, grass silage and wholecrop cereals. Grass silage is the most productive, with annual yields around 45 fresh tonnes per hectare, compared with 40t/ha for maize and 28t/ha for wholecrop wheat. Production systems are quite different; maize and wheat are annuals that are harvested only once in their lifetime and therefore require more intensive labour input to cultivate and sow the crop each year but minimal input at harvest; grass on the other hand is a perennial with a lifetime of 7 – 10 years, requiring less frequent cultivation and sowing but will be harvested up to three times per year. Production costs for grass and maize silage are comparable, with annualised costs for grass being slightly lower at £24.85 per tonne compared with £28.95 per tonne for maize. Wholecrop cereals are more costly, at £40.64 per tonne. Methane yields of grass silage are lower than for maize and wholecrop wheat, so a larger area and thus volume would be required to give the same energy output. The economic modelling has been carried out using the NNFCC’s Calculator1, developed by The Andersons Centre. The tool has not been used to determine capital costs and project viability as this is dependent on site specific factors relating to scale, access and existing infrastructure. Capital costs have been estimated based on stakeholder engagement, understanding and involvement in current projects and previously documented evidence. At the small-scale, assuming 130 dairy cows with followers, the option generating the most favourable Internal Rate of Return (IRR) under the current support system is the slurry only-plant, primarily due to the cost of feedstock impacting on the overall profitability. If however the aim is to increase energy output to warrant heat and power generation then some crop material should be added, ideally grass or maize silage, as slurry alone has such a low energy value. A high proportion of crop material, typically above 50% inclusion, would require different AD technology due to the high dry matter content of the feedstock mix, or for water to be added or recirculated through the
1 The Anaerobic Digestion Economic Assessment Tool (Version 2.2) available from www.biogas-info.co.uk
Farm-Scale AD Plant Efficiency, March 2011
3
system, thus increasing the size of the digester tank(s) required and hence increasing investment costs. At the medium-scale, assuming 250 dairy cows with followers, the most attractive option from an economic perspective is again the slurry-only model, followed closely by the 70:30 ratio; however in the former the energy output is very low. Although a higher proportion of crop material continues to increase the biogas output of the system, as for the smaller scale system the technology demands would differ or a significant volume of water would need to be introduced to the tanks, thus increasing capacity and hence cost. This example shows that inclusion of a relatively small volume of crop material can increase energy output tenfold for only three times the capital cost. There is however a point, beyond 70:30 slurry to crop inclusion, where the cost of crop production outweighs the additional energy output and thus the returns start to decrease. Although the cost of production and the energy yield remains constant, the capital and operational costs do not increase proportionate to scale of plant. Finally, the most attractive option at the large scale, assuming 500 dairy cows with followers housed year-round, is a higher crop to slurry ratio of 60:40, whilst remaining under the 500kWe threshold for the higher FIT payment, maximising both economic returns and energy output. Although there is interest from the UK farming community to be involved in AD, little progress has been made to date. The technology is fully flexible, so can be designed to accommodate any mix of feedstocks, determined by the combined dry matter content and methane generating potential. The diet of an AD plant can be adjusted to accommodate changes in feedstock availability or seasonality of supply; any changes need to be made slowly to give the bacteria time to adapt within the tank. The bacteria will colonise according to the content of the tank if given time, so the diet remains flexible throughout operation. Beyond 50:50, slurry to crop ratio, although the IRR appears more attractive the contents of the tank would increase above 15%DM so additional moisture requirements need to be considered and the technology suitability assessed. It may be more appropriate to operate a ‘dry’ plant with a higher dry matter manure element in the mix; this would require a longer retention time in the tank and would therefore reduce throughput, require larger capacity and thus increase costs. An alternative would be to add water or recirculate dirty water from the digestate through the system; this would however increase the capacity requirements of the tank(s) and significantly increase the capital investment costs. Based on this modelling exercise, the best IRR that can be achieved currently through farm-scale AD, remaining under the higher rate FITs threshold of 500kWe, is just above 12%. At the small and medium scale returns are typically negative, or at best below 2%. Although for a project of this nature in the commercial sector an IRR of 12% would only be marginally attractive, 10 – 15% would typically be acceptable for an agricultural lender where collateral can be secured against the loan. To avoid securing land and other farm assets against the loan an IRR of 15% and above would be required; however, this would be uncommon in a farm situation where loans are typically secured against land or property. The two greatest sensitivities for farm-scale AD are cost of feedstock and capital cost of plant. The former cannot be avoided unless waste is imported into the plant to supplement slurry-systems and a gate-fee potentially charged. This would not be a practical option for a farm-based system where the biosecurity risk would be increased and the pre-treatment, handling and storage requirements of any imported feedstocks would significantly increase the capital cost and complexity of the plant.
Farm-Scale AD Plant Efficiency, March 2011
4
The latter, the capital cost of the plant, cannot be reduced much below the figures proposed here as it has been assumed the farm would already be using lower-specification, often manual systems, as opposed to highly sophisticated fully automated systems analogous to larger scale operations. Using the heat can improve returns marginally, but this is not always possible in rural locations analogous with farm-scale AD. An incentive is therefore required to encourage utilisation of heat and to support the associated infrastructure required to pipe and distribute the heat as necessary. At the time of writing the details of the RHI were not available and this has not therefore been taken into consideration in the calculations. In order to maximise energy potential from AD it is essential to supplement slurry with vegetative material; either crops or residues. Growing crops specifically for the purpose of digestion through an AD plant clearly impacts on running costs when the costs of producing such materials are taken into consideration. Crop only plants are technically possible, but require a different technology and longer retention times, thus often greater capital investment and are expected to be uncommon in the UK.
Farm-Scale AD Plant Efficiency, March 2011
5
Contents
1. Executive Summary ....................................................................................... 2
Contents.............................................................................................................. 5
2. Aims and Objectives ...................................................................................... 7
2.1 Objectives ...................................................................................................................... 7
3. Background................................................................................................... 8
3.1 Feed-in-Tariff (FIT) ........................................................................................................ 8
4. Technology Summary .................................................................................. 10
4.1 Input Options ............................................................................................................... 10
4.2 Technology Options ...................................................................................................... 11
4.2.1 Wet or Dry ........................................................................................................... 11
4.2.2 Mesophilic or Thermophilic .................................................................................... 12
4.2.3 Continuous or Batch Flow ...................................................................................... 12
4.2.4 Single or Multiple Digesters ................................................................................... 12
4.2.5 Vertical or Horizontal Plug Flow .............................................................................. 12
4.2.6 Retention Time ..................................................................................................... 12
4.2.7 Pre-Treatment Options .......................................................................................... 12
4.3 Output Options ............................................................................................................ 13
5. Agriculture in the United Kingdom ................................................................ 14
5.1 Livestock production systems ........................................................................................ 14
5.2 Crop production systems .............................................................................................. 15
5.2.1 Maize silage .......................................................................................................... 16
5.2.2 Grass silage .......................................................................................................... 17
5.2.3 Wholecrop wheat .................................................................................................. 18
6. Methodology ............................................................................................... 20
6.1 Farm size ..................................................................................................................... 20
6.2 Slurry to Crop Ratio ...................................................................................................... 20
6.3 Crop type ..................................................................................................................... 21
7. Results ....................................................................................................... 22
7.1 Small Farm-Scale.......................................................................................................... 22
7.1.1 Sensitivity Analysis ................................................................................................ 23
7.2 Medium Farm-Scale ...................................................................................................... 24
7.2.1 Sensitivity Analysis ................................................................................................ 26
7.3 Large Farm-Scale ......................................................................................................... 27
7.3.1 Sensitivity Analysis ................................................................................................ 28
8. Conclusions ................................................................................................. 29
9. Appendix .................................................................................................... 32
9.1 Assumptions ................................................................................................................ 32

Farm-Scale AD Plant Efficiency, March 2011
6
Disclaimer: This report was carried out on behalf of DECC but the views and conclusions reached are those of the authors and are not necessarily endorsed by DECC.
Farm-Scale AD Plant Efficiency, March 2011
7
2. Aims and Objectives The Coalition Agreement, published in May 2010, stated ‘We will introduce measures to promote a huge increase in energy from waste through AD’ with the focus therefore on maximising the efficient use of available waste. While on-farm AD plants can theoretically operate using only manures and slurries, stakeholders have informed DECC that, in order to operate efficiently and cost-effectively, a certain amount of ‘energy crop’ is required. Figures quoted to DECC range from 20% to 80% of crop material inclusion. In part this is suggested to ensure the bacterial balance within the plant remains healthy and the seasonality of manures and slurries, when cattle are housed over winter and out to pasture through the summer, is considered. This project will seek to determine how much, if any, energy crop is required to ensure that on-farm AD plants using slurry or manure as the primary feedstock are able to operate effectively and the amount required, where necessary, to make the plant cost-effective.
2.1 Objectives The objectives of this project are;
To determine the amount and type of ‘energy crop’ required to ensure on-farm AD plants using slurry as the primary feedstock operate efficiently and cost-effectively.
To determine the energy crop production system that would be required, the area involved
and the cost of production associated with such systems.
Farm-Scale AD Plant Efficiency, March 2011
8
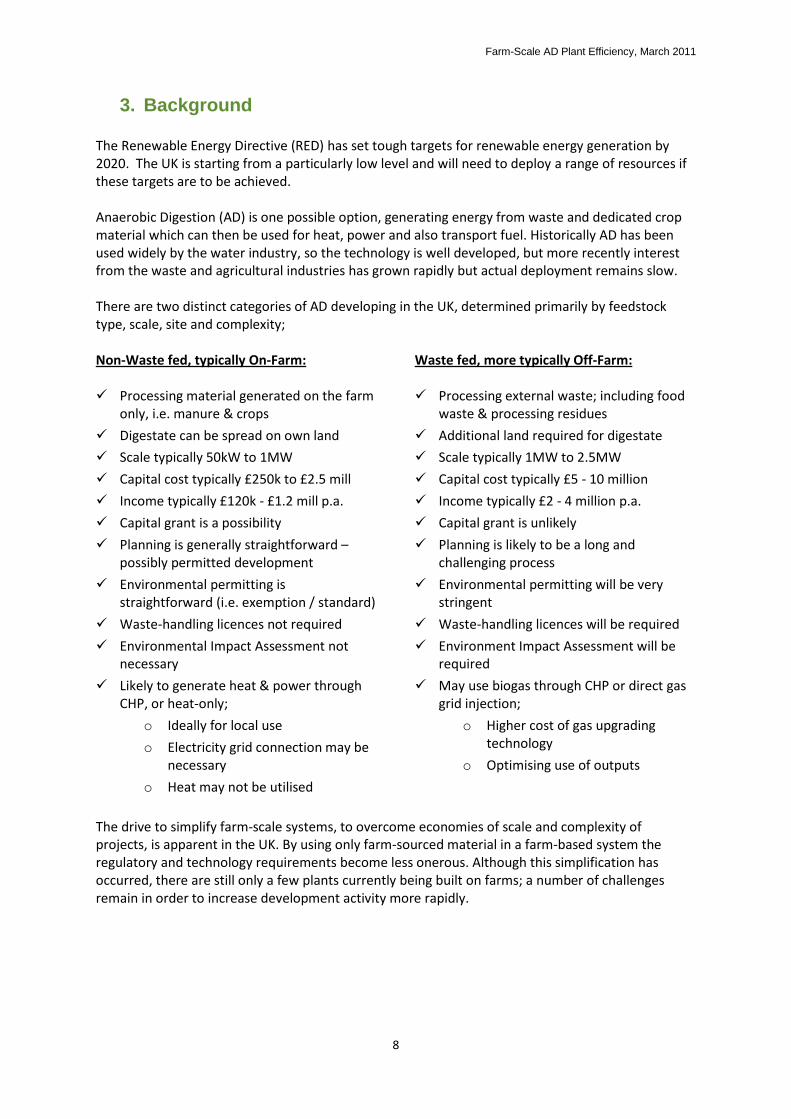
3. Background The Renewable Energy Directive (RED) has set tough targets for renewable energy generation by 2020. The UK is starting from a particularly low level and will need to deploy a range of resources if these targets are to be achieved. Anaerobic Digestion (AD) is one possible option, generating energy from waste and dedicated crop material which can then be used for heat, power and also transport fuel. Historically AD has been used widely by the water industry, so the technology is well developed, but more recently interest from the waste and agricultural industries has grown rapidly but actual deployment remains slow. There are two distinct categories of AD developing in the UK, determined primarily by feedstock type, scale, site and complexity; Non-Waste fed, typically On-Farm: Processing material generated on the farm
only, i.e. manure & crops
Digestate can be spread on own land
Scale typically 50kW to 1MW
Capital cost typically £250k to £2.5 mill
Income typically £120k - £1.2 mill p.a.
Capital grant is a possibility
Planning is generally straightforward –possibly permitted development
Environmental permitting is straightforward (i.e. exemption / standard)
Waste-handling licences not required
Environmental Impact Assessment not necessary
Likely to generate heat & power through CHP, or heat-only;
o Ideally for local use
o Electricity grid connection may be necessary
o Heat may not be utilised
Waste fed, more typically Off-Farm: Processing external waste; including food
waste & processing residues
Additional land required for digestate
Scale typically 1MW to 2.5MW
Capital cost typically £5 - 10 million
Income typically £2 - 4 million p.a.
Capital grant is unlikely
Planning is likely to be a long and challenging process
Environmental permitting will be very stringent
Waste-handling licences will be required
Environment Impact Assessment will be required
May use biogas through CHP or direct gas grid injection;
o Higher cost of gas upgrading technology
o Optimising use of outputs
The drive to simplify farm-scale systems, to overcome economies of scale and complexity of projects, is apparent in the UK. By using only farm-sourced material in a farm-based system the regulatory and technology requirements become less onerous. Although this simplification has occurred, there are still only a few plants currently being built on farms; a number of challenges remain in order to increase development activity more rapidly.
Farm-Scale AD Plant Efficiency, March 2011
8
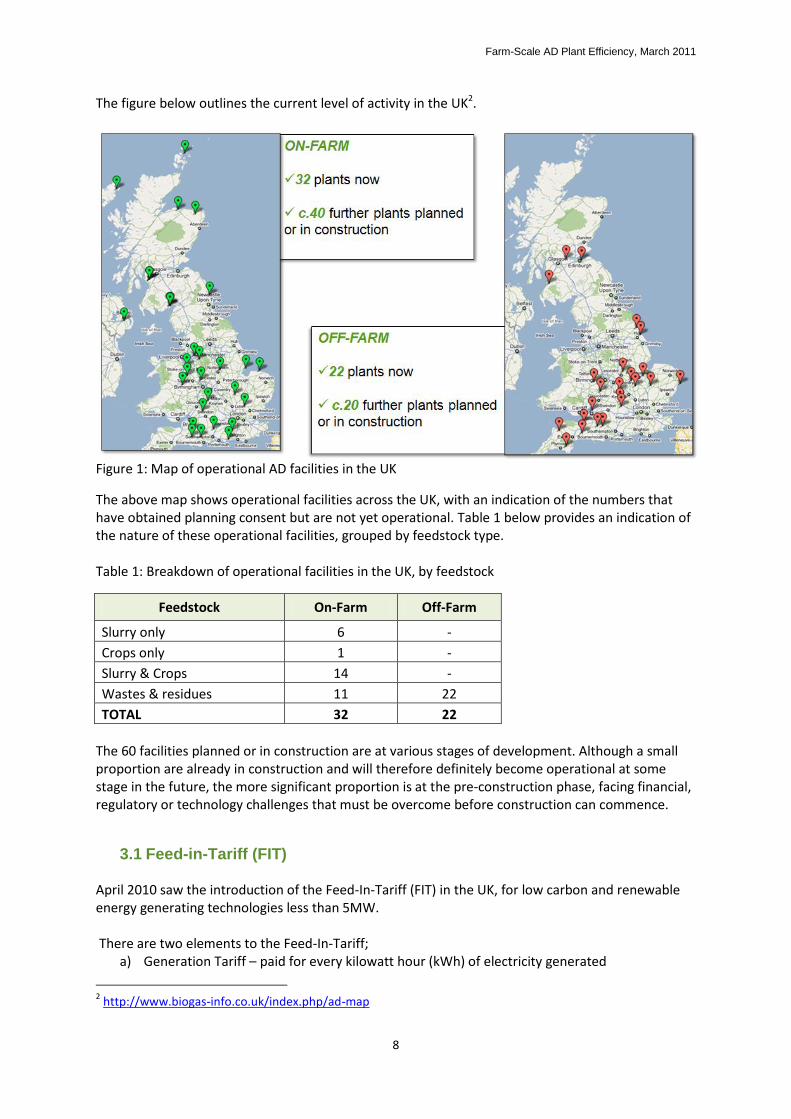
The figure below outlines the current level of activity in the UK2.
Figure 1: Map of operational AD facilities in the UK
The above map shows operational facilities across the UK, with an indication of the numbers that have obtained planning consent but are not yet operational. Table 1 below provides an indication of the nature of these operational facilities, grouped by feedstock type. Table 1: Breakdown of operational facilities in the UK, by feedstock
Feedstock On-Farm Off-Farm
Slurry only 6 -
Crops only 1 -
Slurry & Crops 14 -
Wastes & residues 11 22
TOTAL 32 22
The 60 facilities planned or in construction are at various stages of development. Although a small proportion are already in construction and will therefore definitely become operational at some stage in the future, the more significant proportion is at the pre-construction phase, facing financial, regulatory or technology challenges that must be overcome before construction can commence.
3.1 Feed-in-Tariff (FIT) April 2010 saw the introduction of the Feed-In-Tariff (FIT) in the UK, for low carbon and renewable energy generating technologies less than 5MW. There are two elements to the Feed-In-Tariff;
a) Generation Tariff – paid for every kilowatt hour (kWh) of electricity generated
2 http://www.biogas-info.co.uk/index.php/ad-map
Farm-Scale AD Plant Efficiency, March 2011
9
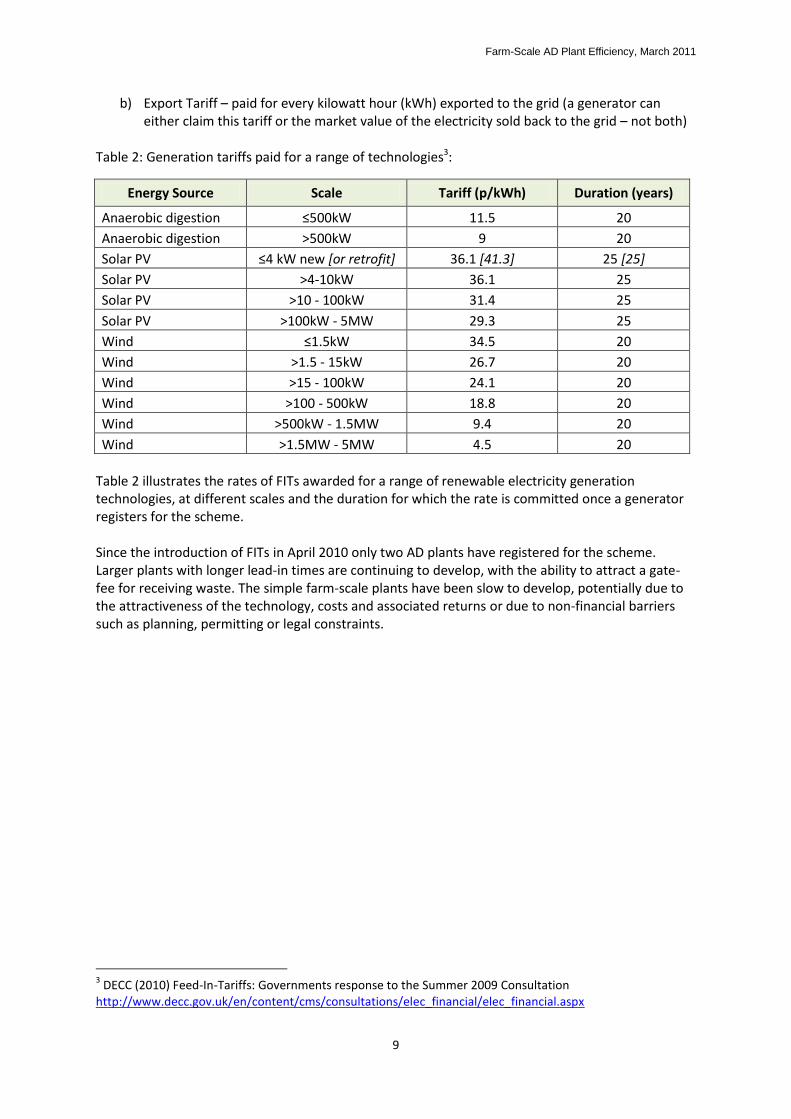
b) Export Tariff – paid for every kilowatt hour (kWh) exported to the grid (a generator can either claim this tariff or the market value of the electricity sold back to the grid – not both)
Table 2: Generation tariffs paid for a range of technologies3:
Energy Source Scale Tariff (p/kWh) Duration (years)
Anaerobic digestion ≤500kW 11.5 20
Anaerobic digestion >500kW 9 20
Solar PV ≤4 kW new [or retrofit] 36.1 [41.3] 25 [25]
Solar PV >4-10kW 36.1 25
Solar PV >10 - 100kW 31.4 25
Solar PV >100kW - 5MW 29.3 25
Wind ≤1.5kW 34.5 20
Wind >1.5 - 15kW 26.7 20
Wind >15 - 100kW 24.1 20
Wind >100 - 500kW 18.8 20
Wind >500kW - 1.5MW 9.4 20
Wind >1.5MW - 5MW 4.5 20
Table 2 illustrates the rates of FITs awarded for a range of renewable electricity generation technologies, at different scales and the duration for which the rate is committed once a generator registers for the scheme. Since the introduction of FITs in April 2010 only two AD plants have registered for the scheme. Larger plants with longer lead-in times are continuing to develop, with the ability to attract a gate-fee for receiving waste. The simple farm-scale plants have been slow to develop, potentially due to the attractiveness of the technology, costs and associated returns or due to non-financial barriers such as planning, permitting or legal constraints.
3 DECC (2010) Feed-In-Tariffs: Governments response to the Summer 2009 Consultation
http://www.decc.gov.uk/en/content/cms/consultations/elec_financial/elec_financial.aspx
Farm-Scale AD Plant Efficiency, March 2011
10
4. Technology Summary There are a significant number of variables for AD systems, in terms of inputs, technologies and outputs. This section aims to summarise the main options and provide guidance on which technology is more appropriate at the farm scale and why.
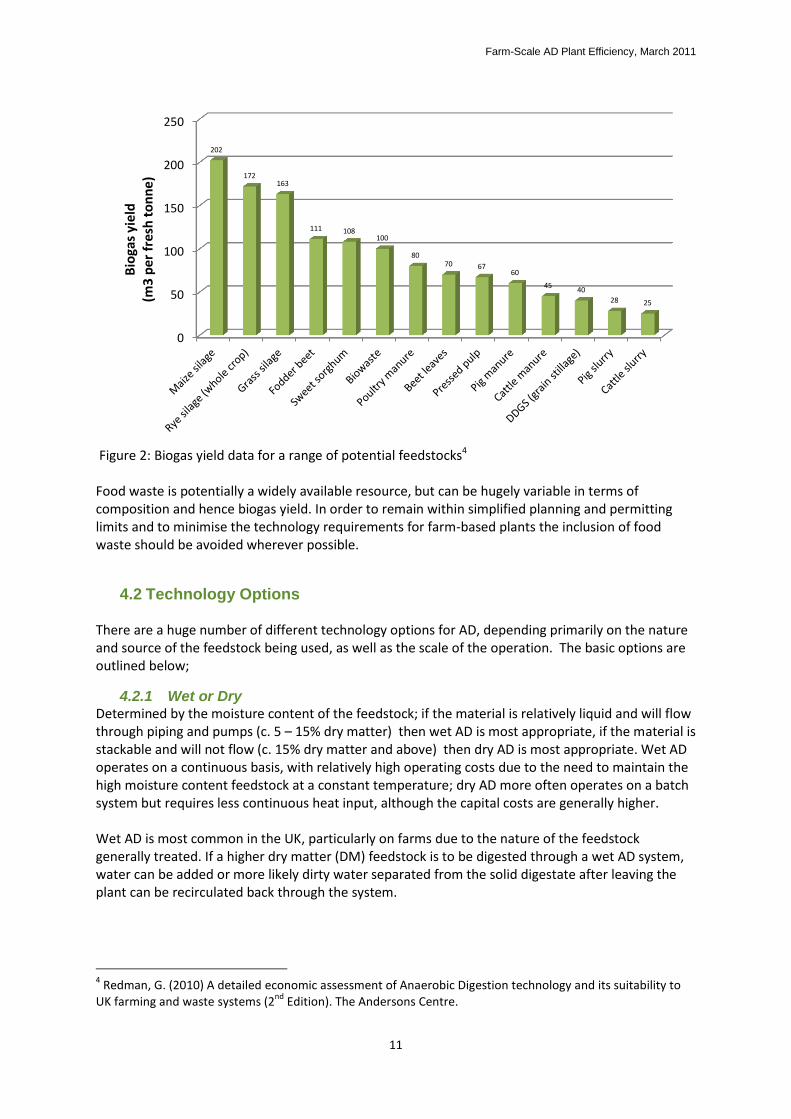
4.1 Input Options The type and nature of the feedstock and digester design is critical to the efficient running of the plant. In order for a plant to run at optimum output, the tank must receive a good consistent mix of feedstock. Any changes to the diet of the plant must be introduced slowly, to allow the bacteria within the digester time to adjust without reducing the productivity. Planning is also essential to the effective running of a plant; long-term feedstock supply contracts or provisions must be in place in order to guarantee a reasonable output over the lifetime of the plant. Seasonal variation in feedstock must be accounted for in advance, so as not to fall short of capacity and to plan changes to the diet accordingly and over time. Feeding a digester is not a simple task and the complexities are often underestimated. The diet should be planned in advance and expert nutritional advice should be sought so as to maximise the outputs of the digester. If a plant is being operated as part of a livestock farming enterprise then the diet of the AD plant should be integrated with that of the livestock unit, to make best use of available feeds on the unit and to control additional costs, labour and storage demands. An inoculum is introduced to the tank during the pre-commissioning phase and given time to colonise accordingly. The bacteria can slowly adapt to the contents and any new feedstock introduced. The critical factors likely to influence the output of the digester are pH, alkalinity, total and volatile solids concentration, volatile fatty acids concentration and composition. Each of these variables needs to be closely monitored to prevent rapid change and disruption to the quality and rate of gas output. The feedstock can be any biodegradable plant or animal matter that is not woody; lignin cannot be broken down by the micro-organisms in an AD plant, so wood-based products, paper and straw will not be digested fully and will reduce the rate of biogas generation, hence their inclusion in any diet should be limited. Different feedstocks generate different rates of biogas output, so the best option is to select a combination of low yielding, low cost (often free) feedstock and high-yielding dedicated feedstock, such as silage for an on-farm plant. Slurries and manures have had most of their energy value removed by digestion in the source animal and can also have very high water content, so co-digestion is important in most cases in order to give a reasonable rate and yield of biogas output. The figure below shows a range of feedstocks and their associated biogas yields, in terms of cubic metres of gas generated per tonne of fresh feedstock fed into the digester.
Farm-Scale AD Plant Efficiency, March 2011
11
Figure 2: Biogas yield data for a range of potential feedstocks4 Food waste is potentially a widely available resource, but can be hugely variable in terms of composition and hence biogas yield. In order to remain within simplified planning and permitting limits and to minimise the technology requirements for farm-based plants the inclusion of food waste should be avoided wherever possible.
4.2 Technology Options There are a huge number of different technology options for AD, depending primarily on the nature and source of the feedstock being used, as well as the scale of the operation. The basic options are outlined below;
4.2.1 Wet or Dry Determined by the moisture content of the feedstock; if the material is relatively liquid and will flow through piping and pumps (c. 5 – 15% dry matter) then wet AD is most appropriate, if the material is stackable and will not flow (c. 15% dry matter and above) then dry AD is most appropriate. Wet AD operates on a continuous basis, with relatively high operating costs due to the need to maintain the high moisture content feedstock at a constant temperature; dry AD more often operates on a batch system but requires less continuous heat input, although the capital costs are generally higher. Wet AD is most common in the UK, particularly on farms due to the nature of the feedstock generally treated. If a higher dry matter (DM) feedstock is to be digested through a wet AD system, water can be added or more likely dirty water separated from the solid digestate after leaving the plant can be recirculated back through the system.
4 Redman, G. (2010) A detailed economic assessment of Anaerobic Digestion technology and its suitability to
UK farming and waste systems (2nd
Edition). The Andersons Centre.
0
50
100
150
200
250
202
172 163
111 108 100
80 70 67
60
45 40
28 25
Bio
gas
yiel
d
(m3
per
fre
sh t
on
ne)
Farm-Scale AD Plant Efficiency, March 2011
12
4.2.2 Mesophilic or Thermophilic This technology option is defined by the digester vessel operating temperature, which is determined by the nature of the feedstock. Mesophilic systems operate at 25 - 45°C and thermophilic at 50 – 60°C. Due to the higher temperature, thermophilic systems have a faster through put with greater biogas production per unit of feedstock and therefore require a smaller capacity digester tank. Thermophilic systems also achieve greater pathogen kill and are therefore better suited for higher risk feedstock components. Mesophilic AD is most common in the UK, due to the nature of the feedstock treated and the lower capital and operating costs of such systems.
4.2.3 Continuous or Batch Flow The most effective AD systems operate on a continuous flow basis, avoiding the peaks and troughs in biogas output seen with batch systems. Variation in batch flow systems can be reduced by operating multiple tanks and loading and operating on a cyclical basis, so as always to be generating a base load of biogas. Most AD systems in the UK operate on a continuous flow basis.
4.2.4 Single or Multiple Digesters Digestion occurs in four stages; hydrolysis, acidogenesis, acetogenesis and methanogenesis. In a single step digester all phases occur within the same tank; it is however possible to have multiple tanks, to encourage different phases in separate tanks, so as to maximise the outputs. The benefit of operating a multiple tank system can be outweighed by the additional capital and operating costs of the system, in particular at small- to medium-scale. Most systems in the UK operate single or double tanks, so as to balance the economics.
4.2.5 Vertical or Horizontal Plug Flow The orientation of the tank will primarily be determined by the nature of the feedstock and the consistency. Vertical tanks generally pump fresh feedstock in at the bottom and displace the equivalent volume of digestate from the top of the tank. Horizontal flow systems take feedstock from one end, through to the other with the more solid feedstock at the feed end acting as a plug to prevent back-flow of material. Horizontal tanks are more capital intensive, but provide a better guarantee of achieving optimum output – however, vertical tanks are more common in the UK.
4.2.6 Retention Time The retention time of material in the digester is dependent upon the feedstock type and composition and the output requirements of the system. Generally, although most wet AD plants operate on a continuous basis, the aim would be for the material to remain within the tank for 20 – 40 days. Longer retention times are possible, but require greater tank capacity and see a reduction in biogas output over time. As a greater proportion of solid material, such as crops, is added the retention time needs to be increased to achieve optimum biogas output and material throughput.
4.2.7 Pre-Treatment Options Dependent on the feedstock, it may be necessary to pre-treat the material before it enters the digester, for bio security, safety or technical reasons. High dry matter content feedstocks such as crops will need to be shredded or macerated, especially if required to flow through pumps and pipes to a wet AD plant. Food waste or high-risk (Animal By-
Farm-Scale AD Plant Efficiency, March 2011
13
Product) material would need to be pasteurised, to ensure the digestate is safe for use once it leaves the digester. This is done by heating the feedstock to 72°C for a period of 1-hour prior to entering the digestion process.
4.3 Output Options The two key outputs from an AD plant are biogas, which is a mix of 60% methane (CH4) and 40% carbon dioxide (CO2), and digestate, an organic fertiliser similar to compost. Biogas can be used in a number of ways to generate heat, power or transport fuel. Biogas can be burned through a simple boiler or engine and generator, to generate heat or power respectively. The most common option is to burn the biogas through a combined heat and power (CHP) engine, to generate both heat and power. Heat is most effectively used on-site or locally whereas power can be used on-site or connected to the main electricity grid and used at the point of off-take. Losses are incurred during heat and power production, either due to downtime or inefficient operation of plant. Alternatively biogas can be upgraded, the carbon dioxide and other contaminant gases removed, to generate biomethane. Biomethane can be injected into the natural gas distribution network, for conversion to heat or power at the point of off-take, or used as a transport fuel in a similar way to LPG or CNG. The latter options may be more efficient but they are also significantly more costly and not really viable options for farm-scale systems.
Farm-Scale AD Plant Efficiency, March 2011
14
5. Agriculture in the United Kingdom The UK farming industry has experienced volatility and change in recent years. In 2009 the Total Income from Farming (TIFF) fell by 6.2% in real terms5. Farm incomes for arable and dairy farms have fallen significantly through 2009/10, due to productivity, market prices, input costs and exchange rates. In contrast incomes for other livestock farms have increased, primarily due to demand and productivity. According to Defra5 periods of price volatility are likely to occur for the foreseeable future and sterling exchange rates will continue to have a significant impact on the fortunes of UK farmers. It is because of this and volatility in input costs that farmers are considering means of diversification, with the added benefits of becoming more self-sufficient in energy and fertiliser terms. According to Defra6 the dairy herd in the UK fell by 2.7% between 2008 and 2009 to 1.9 million animals. There are currently 17,000 dairy units in the UK. The beef herd also fell by 2.7% to 1.6 million animals. The size of the total sheep flock fell by 3.3% over the same period, to 32 million animals, with lamb numbers falling by 2.4% to 16.2 million. In contrast the female pig breeding herd has increased by 5.9% to 445,000 animals in June 2009 and the poultry breeding flock increased by 6.0% to 9.6 million birds.
Defra’s latest agricultural statistics publication3 also indicates that in June 2009 the total area of agricultural land in the UK was 18 million hectares. Of this land 35% was under crops, bare fallow or temporary grassland with 50% of the cropped land being cereals. The total area of cereals in the UK decreased by 4.3% between June 2008 and June 2009, to 3.1 million hectares. The decrease in cereals was offset by increases in other break crops and an increase of 31% in the area of uncropped arable land.
5.1 Livestock production systems Dairy production systems vary significantly in the UK. A typical dairy herd is made up of milking cows and followers. Followers are young cattle that are intended to replace milking cows in order to maintain good productivity in the herd. Typically 25% of a herd is replaced each year. The average UK dairy herd size is currently 106 milking cows, plus followers (c. 130 cattle)7. Cattle can be housed for all or part of the year. Most cattle in small- to medium-sized herds in the UK are housed over winter (c. 200 days) and are out at pasture for the summer period. During the summer months cows will be brought inside for milking 2 or 3 times per day. Slurry is generated in a dairy unit from the main housing and milking areas. Manure, comprising straw from bedding, will also be generated. Typically a higher proportion of slurry to manure will be generated in a dairy unit. In the summer months only slurry will be generated as an area of straw will not be provided for the cattle to lie down inside. It is indeed possible and becoming more common in the UK for a zero-grazing system to be operated where cows are housed all year. This is more typical of larger herds in arable areas where grazing area is limited. Grass will be harvested and brought to the cows rather than allowing the cows to forage for themselves outside. Such units are operated on a high-welfare basis, in order to meet
5 Defra (2009) Agriculture in the United Kingdom – Farm Incomes
6 Defra (2009) Agriculture in the United Kingdom – Structure of the Industry
Farm-Scale AD Plant Efficiency, March 2011
15
strict health and welfare controls imposed by the Animal Health Department and associated regulatory bodies. The average area of a UK dairy farm is 95ha7; some of which will be for grazing and some for cereal or alternative fodder production. Typically a dairy cow requires 0.5ha of land; 55% of which is required for grazing and 45% for forage, such as silage or other fodder crops8. For the average UK dairy herd this equates to 65 hectares being required for grazing and fodder. The remaining 30 hectares will typically be arable land, growing cereals to generate straw for bedding or additional produce for sale off the farm. Beef production systems are typically smaller than dairy units; the average beef herd size in the UK is currently 55 cattle9. Beef cattle will be housed for all or part of the year as with dairy cattle, but only manure will be generated, as bedding will be provided throughout the unit. Beef units do not typically generate slurry. Beef cattle require less forage than dairy cattle, in particular during the housed period over winter. Therefore, a beef herd would require less land than an equivalent sized dairy herd. Requirements can be up to 30 – 40% lower for beef cattle10. Pigs and sheep are typically bedded on straw. Pigs are most likely to be housed all year, aside from specifically outdoor reared herds. Sheep on the other hand are more likely to remain outdoors throughout the year; only some breeding units will house the sheep and lambs for the winter. Poultry units vary dependent on the production system; typically birds are provided sawdust or shavings for bedding and the waste from a poultry unit, referred to as litter, is very dry with a high concentration of ammonia and wood shavings.
5.2 Crop production systems Cereals (incl. wheat, barley and oats) are the main crop grown in the UK, followed by oilseed rape, pulses, root crops and forage. A typical UK arable or mixed farm grows a number of different crops on a rotational basis so as to avoid build up of pests and diseases in the soil and to replenish nutrients which can be lost through intensive production. Theoretically it would be possible to grow cereals on the same area of land every year; however, this would not be economically or environmentally feasible as large quantities of pesticides and fertiliser would be required to maintain a healthy and productive crop. For this reason it is essential to introduce a ‘break crop’ to the rotation; this can be anything other than cereals and is generally decided by the land type, location and demand. Oilseed rape is the largest area break crop grown in the UK, followed by pulses and root crops. The latter require specialised equipment and husbandry systems, and are thus not suited to many farm enterprises. Forage crops provide an alternative option, currently limited by demand from farmers with livestock or local access to markets. AD offers an opportunity to introduce a new break crop to the rotation as well as the benefit of generating digestate, which can be spread as organic fertiliser on such crops.
7 Dairy Co (2007) Datum: Average Dairy Farm Size in the UK
8 DARDNI (2010) Winter Feeding of Ruminant Livestock
9 Defra (2009) Agriculture in the United Kingdom – Structure of the Industry
Farm-Scale AD Plant Efficiency, March 2011
16
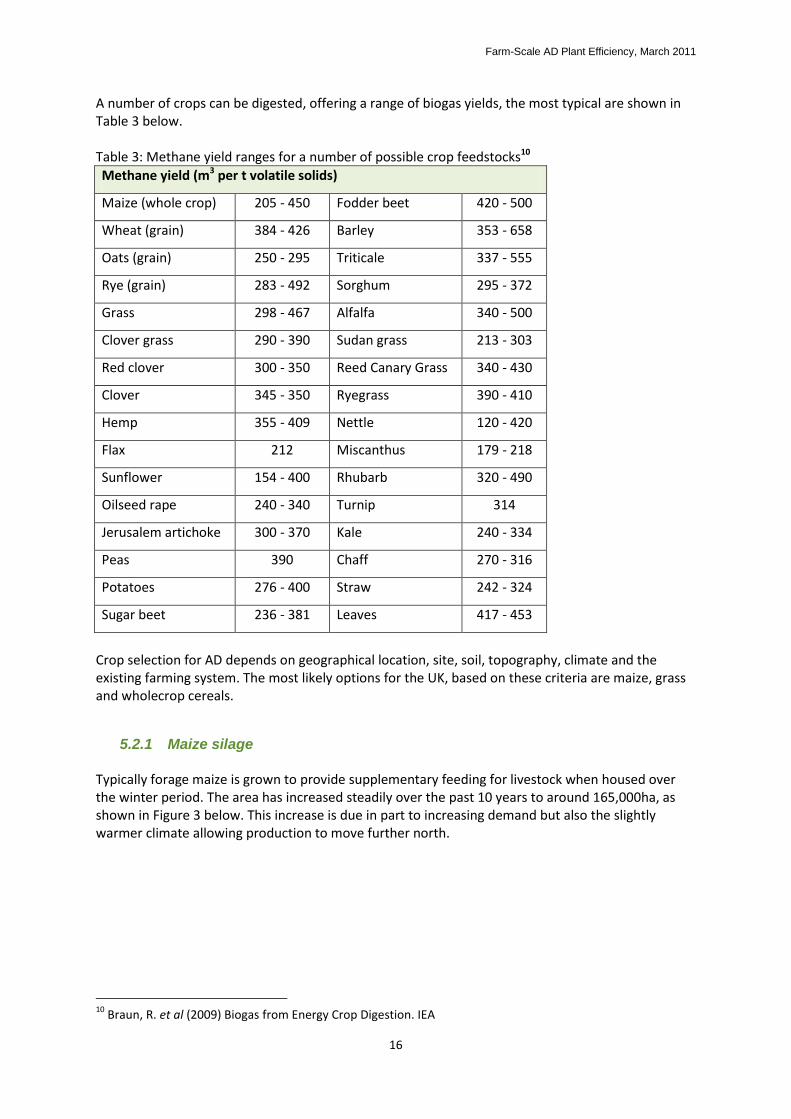
A number of crops can be digested, offering a range of biogas yields, the most typical are shown in Table 3 below. Table 3: Methane yield ranges for a number of possible crop feedstocks10
Methane yield (m3 per t volatile solids)
Maize (whole crop) 205 - 450 Fodder beet 420 - 500
Wheat (grain) 384 - 426 Barley 353 - 658
Oats (grain) 250 - 295 Triticale 337 - 555
Rye (grain) 283 - 492 Sorghum 295 - 372
Grass 298 - 467 Alfalfa 340 - 500
Clover grass 290 - 390 Sudan grass 213 - 303
Red clover 300 - 350 Reed Canary Grass 340 - 430
Clover 345 - 350 Ryegrass 390 - 410
Hemp 355 - 409 Nettle 120 - 420
Flax 212 Miscanthus 179 - 218
Sunflower 154 - 400 Rhubarb 320 - 490
Oilseed rape 240 - 340 Turnip 314
Jerusalem artichoke 300 - 370 Kale 240 - 334
Peas 390 Chaff 270 - 316
Potatoes 276 - 400 Straw 242 - 324
Sugar beet 236 - 381 Leaves 417 - 453
Crop selection for AD depends on geographical location, site, soil, topography, climate and the existing farming system. The most likely options for the UK, based on these criteria are maize, grass and wholecrop cereals.
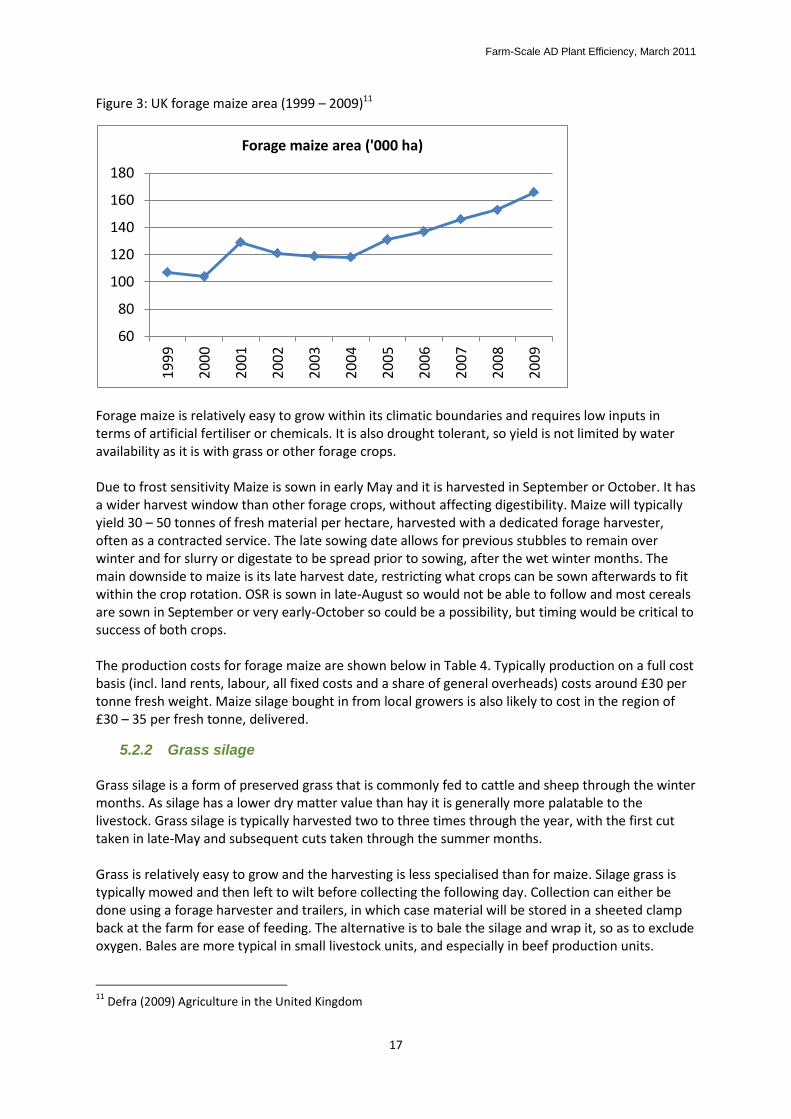
5.2.1 Maize silage Typically forage maize is grown to provide supplementary feeding for livestock when housed over the winter period. The area has increased steadily over the past 10 years to around 165,000ha, as shown in Figure 3 below. This increase is due in part to increasing demand but also the slightly warmer climate allowing production to move further north.
10
Braun, R. et al (2009) Biogas from Energy Crop Digestion. IEA
Farm-Scale AD Plant Efficiency, March 2011
17
Figure 3: UK forage maize area (1999 – 2009)11
Forage maize is relatively easy to grow within its climatic boundaries and requires low inputs in terms of artificial fertiliser or chemicals. It is also drought tolerant, so yield is not limited by water availability as it is with grass or other forage crops. Due to frost sensitivity Maize is sown in early May and it is harvested in September or October. It has a wider harvest window than other forage crops, without affecting digestibility. Maize will typically yield 30 – 50 tonnes of fresh material per hectare, harvested with a dedicated forage harvester, often as a contracted service. The late sowing date allows for previous stubbles to remain over winter and for slurry or digestate to be spread prior to sowing, after the wet winter months. The main downside to maize is its late harvest date, restricting what crops can be sown afterwards to fit within the crop rotation. OSR is sown in late-August so would not be able to follow and most cereals are sown in September or very early-October so could be a possibility, but timing would be critical to success of both crops. The production costs for forage maize are shown below in Table 4. Typically production on a full cost basis (incl. land rents, labour, all fixed costs and a share of general overheads) costs around £30 per tonne fresh weight. Maize silage bought in from local growers is also likely to cost in the region of £30 – 35 per fresh tonne, delivered.
5.2.2 Grass silage Grass silage is a form of preserved grass that is commonly fed to cattle and sheep through the winter months. As silage has a lower dry matter value than hay it is generally more palatable to the livestock. Grass silage is typically harvested two to three times through the year, with the first cut taken in late-May and subsequent cuts taken through the summer months. Grass is relatively easy to grow and the harvesting is less specialised than for maize. Silage grass is typically mowed and then left to wilt before collecting the following day. Collection can either be done using a forage harvester and trailers, in which case material will be stored in a sheeted clamp back at the farm for ease of feeding. The alternative is to bale the silage and wrap it, so as to exclude oxygen. Bales are more typical in small livestock units, and especially in beef production units.
11
Defra (2009) Agriculture in the United Kingdom
60
80
100
120
140
160
1801
99
9
20
00
20
01
20
02
20
03
20
04
20
05
20
06
20
07
20
08
20
09
Forage maize area ('000 ha)
Farm-Scale AD Plant Efficiency, March 2011
18
Grass fields can be harvested for silage for several years, with 7 – 10 year leys being typical. After this, cultivation and re-seeding will be necessary to maintain productivity. Intensively cut grass leys require the addition of significant nitrogen or organic fertiliser input to maintain reasonable yields – this could also be an opportunity for using digestate generated through an AD unit. Grass typically yields around 45 tonnes of fresh material per hectare per year. The first cut will be the most productive with subsequent cuts achieving lower yields. The production costs for grass silage are shown below in Table 4. Production costs are in the region of £25 per tonne fresh weight. Establishment costs are annualised over the lifetime of the crop, in this case a 7-year ley. Buying in grass silage can cost from £30 – 50 per tonne dependent on location and availability.
5.2.3 Wholecrop wheat Wholecrop cereals, and more specifically wholecrop wheat is being fed to livestock as a supplementary feed to grass silage. A range of cereals can be grown, such as wheat, barley, rye, triticale and oats. Wheat is the most suitable in terms of production, costs, palatability and composition, for the UK. Wholecrop wheat is grown in the same way as conventional cereals, but timing of harvest differs significantly. The crop will be planted in autumn, to achieve maximum yields. Spring planted varieties are available but dry matter yields would be lower. The timing of harvest of wholecrop wheat is crucial to its success as a feed. The crop must be harvested when the dry matter content is between 35 – 45%, for the grain to contain optimum levels of starch whilst the straw remains digestible. Harvest is carried out with a conventional forager, potentially adapted with a combine header to maintain crop quality. The crop is typically harvested in June – July. It is possible to undersow a wholecrop cereal with grass, so once the cereal has been harvested the grass continues to grow and it is possible to get a harvest of grass silage later in the season. This is not practiced widely in the UK and would restrict herbicide options, but it is a possible option for increasing productivity in the future. Once harvested the silage will be stored in clamps on the farm, as with maize and grass silage. The production costs for wholecrop wheat are shown below in Table 4. Costs are typically higher than for grass and maize, due to the annual cultivations and chemical input required and the higher fertiliser costs compared with maize. The production costs for the above three forage crops are detailed in Table 4.
Farm-Scale AD Plant Efficiency, March 2011
19
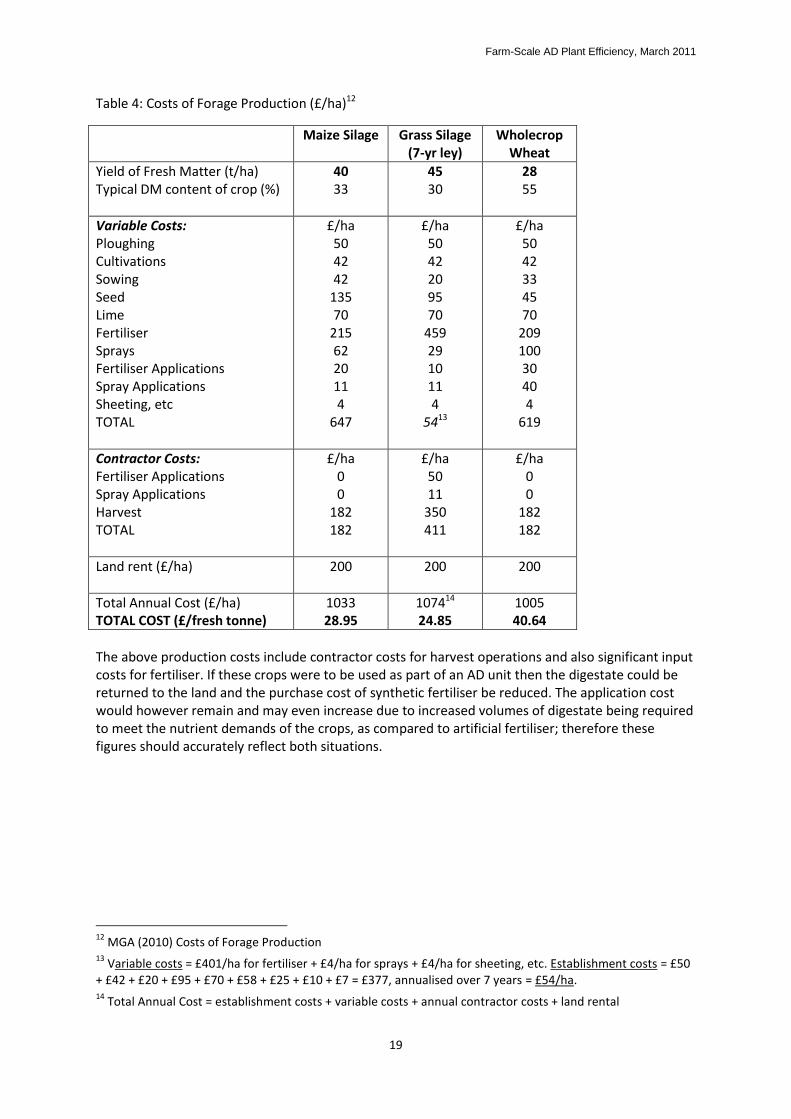
Table 4: Costs of Forage Production (£/ha)12
Maize Silage Grass Silage (7-yr ley)
Wholecrop Wheat
Yield of Fresh Matter (t/ha) Typical DM content of crop (%)
40 33
45 30
28 55
Variable Costs: Ploughing Cultivations Sowing Seed Lime Fertiliser Sprays Fertiliser Applications Spray Applications Sheeting, etc TOTAL
£/ha 50 42 42
135 70
215 62 20 11 4
647
£/ha 50 42 20 95 70
459 29 10 11 4
5413
£/ha 50 42 33 45 70
209 100 30 40 4
619
Contractor Costs: Fertiliser Applications Spray Applications Harvest TOTAL
£/ha 0 0
182 182
£/ha 50 11
350 411
£/ha 0 0
182 182
Land rent (£/ha)
200 200 200
Total Annual Cost (£/ha) TOTAL COST (£/fresh tonne)
1033 28.95
107414 24.85
1005 40.64
The above production costs include contractor costs for harvest operations and also significant input costs for fertiliser. If these crops were to be used as part of an AD unit then the digestate could be returned to the land and the purchase cost of synthetic fertiliser be reduced. The application cost would however remain and may even increase due to increased volumes of digestate being required to meet the nutrient demands of the crops, as compared to artificial fertiliser; therefore these figures should accurately reflect both situations.
12
MGA (2010) Costs of Forage Production 13
Variable costs = £401/ha for fertiliser + £4/ha for sprays + £4/ha for sheeting, etc. Establishment costs = £50 + £42 + £20 + £95 + £70 + £58 + £25 + £10 + £7 = £377, annualised over 7 years = £54/ha. 14
Total Annual Cost = establishment costs + variable costs + annual contractor costs + land rental
Farm-Scale AD Plant Efficiency, March 2011
20
6. Methodology The operations and economics of farm-based AD projects vary dependent on the existing farming-system, availability and seasonality of feedstocks, labour and capital, and the output requirements of the operator. In order to address the aims of this project a number of assumptions have been made around background, operations and outputs of such systems. The assumptions are presented clearly in 9.1. The economic modelling has been carried out using the NNFCC’s Calculator15, developed by The Andersons Centre which was updated in 2010. The Calculator requires the user to input feedstock and efficiency data for the proposed scale of AD unit and projected income to be calculated. The tool has not been used to determine capital costs and project viability as this is dependent on site specific factors relating to scale, location and existing infrastructure. Capital costs have been estimated based on stakeholder engagement, understanding and involvement in current projects and previously documented evidence. A number of scenarios have been modelled to illustrate the impact on costs and returns of including purposely grown crop material in a dairy slurry-based AD system.
6.1 Farm size Three farm sizes were modelled, typical of the UK;
i. Small dairy farm – running an average size dairy herd, comprising 130 cows with followers with small areas of land available to grow crops for an AD plant. The cows are housed for 200 days over winter and are out to pasture for the remaining time, through the summer months.
ii. Medium-size mixed farm – running an above average size dairy herd, comprising 250 cows with followers and an average size arable enterprise. As in the first scenario, cattle are housed for 200 days over winter when maximum volumes of slurry are generated, for the remainder of the year a reduced volume of slurry is generated and collected.
iii. Large mixed farm or co-operative – a large dairy herd comprising 500 cows with followers
and a large arable enterprise, or supplementary crop material being sourced from neighbouring farms. The cows are farmed on a zero-grazing, high welfare unit typical of this scale of enterprise in the UK; therefore slurry is consistent in volume all year round.
6.2 Slurry to Crop Ratio Slurry-based systems are a significant focus in the UK and offer opportunities for farms subject to the Nitrates Directive, and located within Nitrate Vulnerable Zones (NVZs). Within these designated areas, slurry storage must be provided on-farm for at least 180 days to avoid spreading on the land at times when risk of run-off and pollution of water courses is particularly high, i.e. through late autumn and winter. Manure does not pose such a problem as it can be stacked in fields, away from water courses, and is not subject to such stringent storage controls. Manure is also heavily straw-
15
The Anaerobic Digestion Economic Assessment Tool (Version 2.2) available from www.biogas-info.co.uk
Farm-Scale AD Plant Efficiency, March 2011
21
based and therefore not an optimum feedstock for AD. Therefore, the focus of this study is on slurry-based systems as opposed to straw-based manures. A number of ratios were modelled; ranging from 100% slurry, as a base case for each farming system, through to 50:50 slurry to crop ratio. Changing the ratio of slurry to crop varied the scale of biogas output significantly, allowing a number of scales to be modelled. Most models remained below the 500kW threshold, so as to remain eligible for the higher level FITs. The ratio of crop material to slurry for each farm type was modelled to examine;
i. The balance required to ensure the bacterial mix remains healthy within the AD plant; ii. The proportion of energy crop required to warrant consideration of energy generation;
iii. The amount of energy crop inclusion required to improve the level of biogas production such that is maximises the potential economic return on investment.
6.3 Crop type The bulk of the modelling was done using maize silage as the energy crop element as this is most typical of AD systems and offers good biogas outputs. Maize is however not the only crop and not always the best crop to be digested in an AD plant dependent on location and existing farming system, so for each farm size two further scenarios were modelled, for comparison, using grass silage or wholecrop wheat as the energy crop element. The impact of changing the crop type can be seen in the outputs from the financial modelling.
Farm-Scale AD Plant Efficiency, March 2011
22
7. Results A large number of scenarios have been modelled through the NNFCC Calculator and a summary of the outputs is provided below. All assumptions are detailed in Section 9.1.
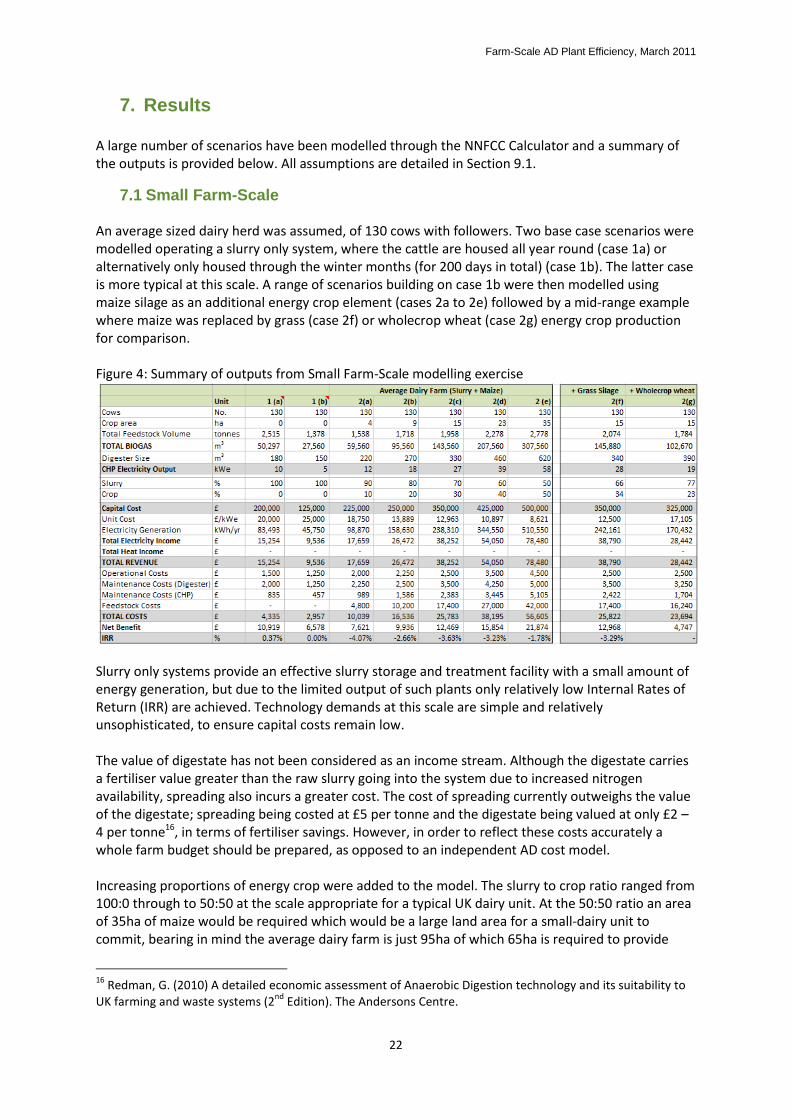
7.1 Small Farm-Scale An average sized dairy herd was assumed, of 130 cows with followers. Two base case scenarios were modelled operating a slurry only system, where the cattle are housed all year round (case 1a) or alternatively only housed through the winter months (for 200 days in total) (case 1b). The latter case is more typical at this scale. A range of scenarios building on case 1b were then modelled using maize silage as an additional energy crop element (cases 2a to 2e) followed by a mid-range example where maize was replaced by grass (case 2f) or wholecrop wheat (case 2g) energy crop production for comparison. Figure 4: Summary of outputs from Small Farm-Scale modelling exercise
Slurry only systems provide an effective slurry storage and treatment facility with a small amount of energy generation, but due to the limited output of such plants only relatively low Internal Rates of Return (IRR) are achieved. Technology demands at this scale are simple and relatively unsophisticated, to ensure capital costs remain low. The value of digestate has not been considered as an income stream. Although the digestate carries a fertiliser value greater than the raw slurry going into the system due to increased nitrogen availability, spreading also incurs a greater cost. The cost of spreading currently outweighs the value of the digestate; spreading being costed at £5 per tonne and the digestate being valued at only £2 – 4 per tonne16, in terms of fertiliser savings. However, in order to reflect these costs accurately a whole farm budget should be prepared, as opposed to an independent AD cost model. Increasing proportions of energy crop were added to the model. The slurry to crop ratio ranged from 100:0 through to 50:50 at the scale appropriate for a typical UK dairy unit. At the 50:50 ratio an area of 35ha of maize would be required which would be a large land area for a small-dairy unit to commit, bearing in mind the average dairy farm is just 95ha of which 65ha is required to provide
16
Redman, G. (2010) A detailed economic assessment of Anaerobic Digestion technology and its suitability to UK farming and waste systems (2
nd Edition). The Andersons Centre.

Farm-Scale AD Plant Efficiency, March 2011
23
grazing and forage for the cattle. This scale of AD plant may have to buy-in supplementary crop material from adjacent farms, so as not to compromise the summer grazing for the dairy herd. Following the methodology of this exercise, the constant in the model is the size of the dairy herd and therefore slurry provision. In considering different slurry to crop ratios, the biogas output will vary significantly. The scale of the CHP unit required to accommodate the biogas output ranged from 5 to just under 60kWe. At this scale the likelihood is that the heat output would be utilised entirely on-site along with some of the power, with the surplus being exported via a local network connection. At the lower end of the scale, a heat-only system may be more appropriate, whereby gas is burned through a standard boiler system to generate heat for the farmhouse and adjacent buildings. As a guide a standard domestic dwelling would utilise 20kW of heat and a large farmhouse with additional heat demand in adjacent buildings up to 150kWth. This model assumes zero income from heat sales as the opportunity to sell or displace heat varies on a case by case basis. Parasitic demand is included in the economic modelling. Energy crop will be added to small-scale systems manually, whereby a batch of material will be fed on a daily basis at the same time as feeding the cattle. The labour input is therefore likely to be low. Grass and wholecrop wheat were modelled as alternatives to use of maize at the middle of the range of scenarios examined, assuming 130 cows and 15ha of energy crop (i.e. to compare against case 2c). If grass were to be added as the energy crop rather than maize the economics would improve slightly as the cost of production is slightly lower, although yields would be more variable in dry years. This would also make the farm less reliant on contractors, requiring specialist equipment for the maize harvest. However, labour requirements would be increased as grass is harvested three times per year as opposed to maize only once. Wholecrop wheat is likely to be less suited to a small dairy farm due to both the economics and the limited availability of suitable land. At the small-scale the most economically attractive option under the current support system is the slurry-only plant, primarily due to the cost of feedstock impacting on the overall profitability when crops are introduced. If however the aim is to increase energy output then purposely grown crop material or residues should be added, ideally grass or maize silage. The optimum crop would be determined by the existing production system on farm; production costs are slightly higher for maize but so too is biogas yield per tonne and therefore the IRR for a maize mix is slightly higher. If however the farm did not already grow maize, due to location, land type or machinery availability then grass would remain the favourable option. By adding vegetative material and increasing the biogas output, the unit cost of investment reduces significantly, from £25,000 to £8,621 per kWe installed capacity in these scenarios. However, due to the cost of producing the crop material this also increases the running costs of the system and in turn reduces the IRRs. Higher proportions of vegetative material, typically above 50:50 would require different technology, due to the high dry matter content of the feedstock mix, or for water to be added or recirculated, thus increasing the size of the digester tank(s) required and hence increasing capital costs.
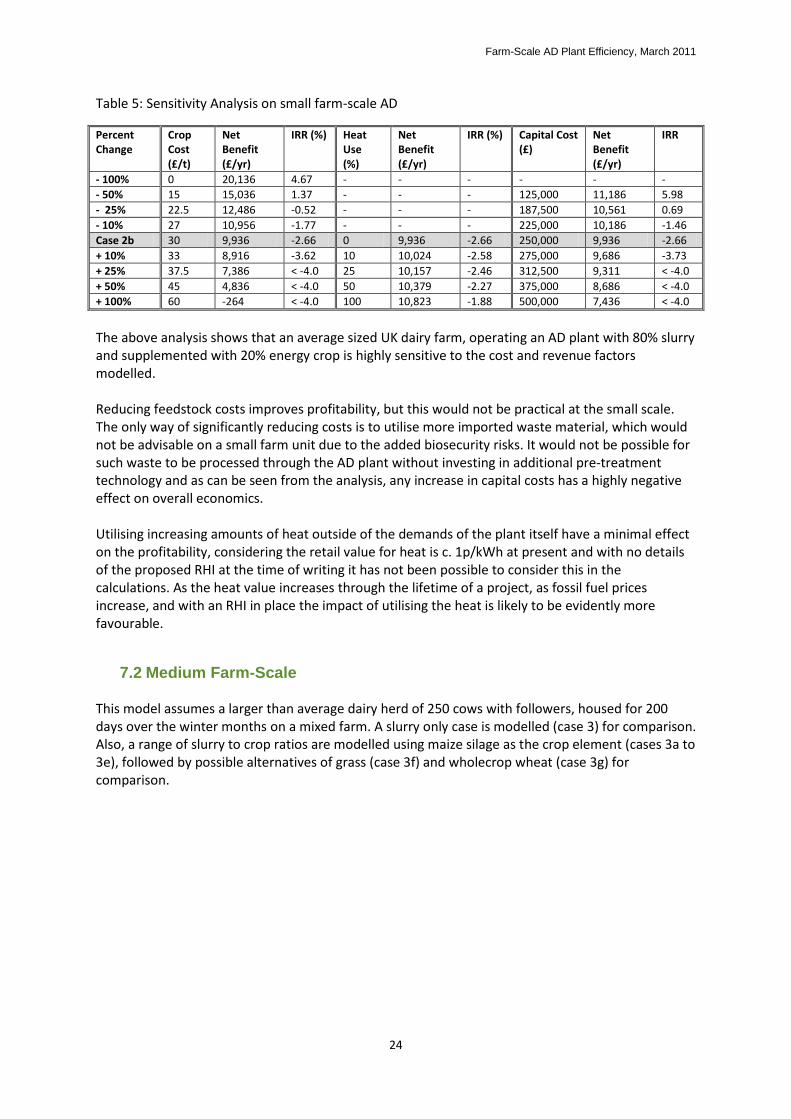
7.1.1 Sensitivity Analysis The moving economics of agriculture, energy and finance, expose AD to significant variation in potential returns. This sensitivity is illustrated in the table below, using the 80:20 slurry to crop scenario (case 2b) as an example.
Farm-Scale AD Plant Efficiency, March 2011
24
Table 5: Sensitivity Analysis on small farm-scale AD
Percent Change
Crop Cost (£/t)
Net Benefit (£/yr)
IRR (%) Heat Use (%)
Net Benefit (£/yr)
IRR (%) Capital Cost (£)
Net Benefit (£/yr)
IRR
- 100% 0 20,136 4.67 - - - - - -
- 50% 15 15,036 1.37 - - - 125,000 11,186 5.98
- 25% 22.5 12,486 -0.52 - - - 187,500 10,561 0.69
- 10% 27 10,956 -1.77 - - - 225,000 10,186 -1.46
Case 2b 30 9,936 -2.66 0 9,936 -2.66 250,000 9,936 -2.66
+ 10% 33 8,916 -3.62 10 10,024 -2.58 275,000 9,686 -3.73
+ 25% 37.5 7,386 < -4.0 25 10,157 -2.46 312,500 9,311 < -4.0
+ 50% 45 4,836 < -4.0 50 10,379 -2.27 375,000 8,686 < -4.0
+ 100% 60 -264 < -4.0 100 10,823 -1.88 500,000 7,436 < -4.0
The above analysis shows that an average sized UK dairy farm, operating an AD plant with 80% slurry and supplemented with 20% energy crop is highly sensitive to the cost and revenue factors modelled. Reducing feedstock costs improves profitability, but this would not be practical at the small scale. The only way of significantly reducing costs is to utilise more imported waste material, which would not be advisable on a small farm unit due to the added biosecurity risks. It would not be possible for such waste to be processed through the AD plant without investing in additional pre-treatment technology and as can be seen from the analysis, any increase in capital costs has a highly negative effect on overall economics. Utilising increasing amounts of heat outside of the demands of the plant itself have a minimal effect on the profitability, considering the retail value for heat is c. 1p/kWh at present and with no details of the proposed RHI at the time of writing it has not been possible to consider this in the calculations. As the heat value increases through the lifetime of a project, as fossil fuel prices increase, and with an RHI in place the impact of utilising the heat is likely to be evidently more favourable.
7.2 Medium Farm-Scale This model assumes a larger than average dairy herd of 250 cows with followers, housed for 200 days over the winter months on a mixed farm. A slurry only case is modelled (case 3) for comparison. Also, a range of slurry to crop ratios are modelled using maize silage as the crop element (cases 3a to 3e), followed by possible alternatives of grass (case 3f) and wholecrop wheat (case 3g) for comparison.
Farm-Scale AD Plant Efficiency, March 2011
25
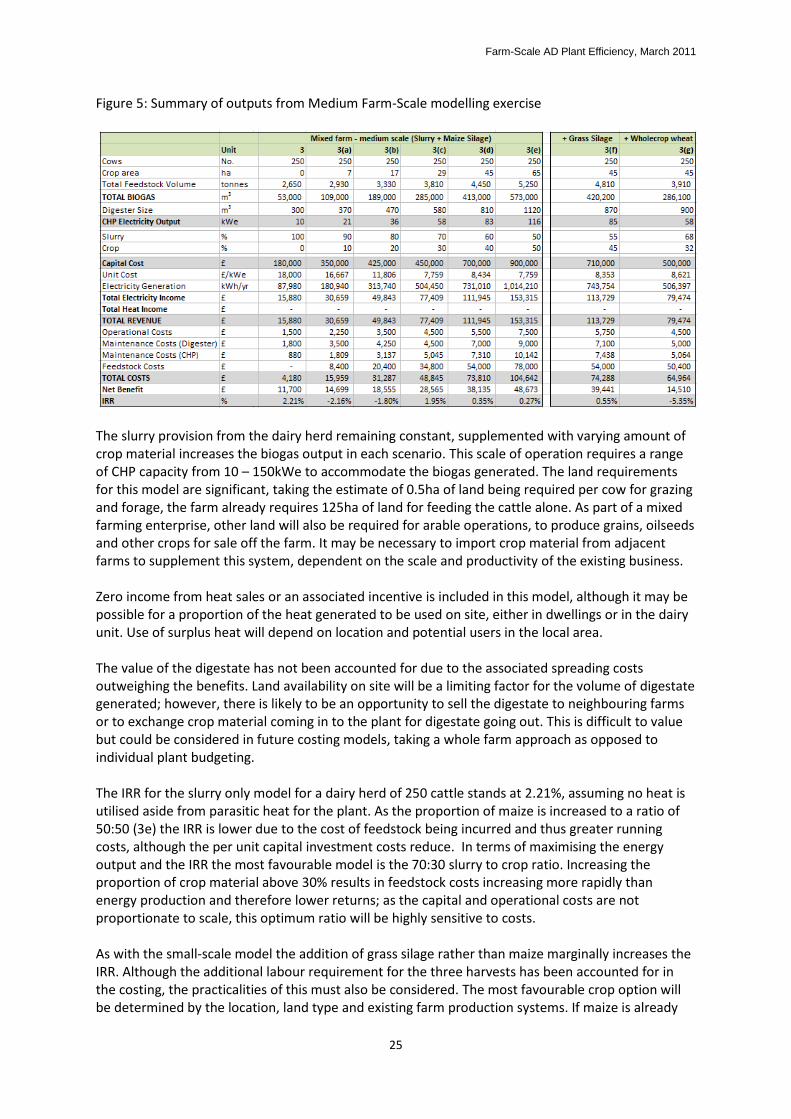
Figure 5: Summary of outputs from Medium Farm-Scale modelling exercise
The slurry provision from the dairy herd remaining constant, supplemented with varying amount of crop material increases the biogas output in each scenario. This scale of operation requires a range of CHP capacity from 10 – 150kWe to accommodate the biogas generated. The land requirements for this model are significant, taking the estimate of 0.5ha of land being required per cow for grazing and forage, the farm already requires 125ha of land for feeding the cattle alone. As part of a mixed farming enterprise, other land will also be required for arable operations, to produce grains, oilseeds and other crops for sale off the farm. It may be necessary to import crop material from adjacent farms to supplement this system, dependent on the scale and productivity of the existing business. Zero income from heat sales or an associated incentive is included in this model, although it may be possible for a proportion of the heat generated to be used on site, either in dwellings or in the dairy unit. Use of surplus heat will depend on location and potential users in the local area. The value of the digestate has not been accounted for due to the associated spreading costs outweighing the benefits. Land availability on site will be a limiting factor for the volume of digestate generated; however, there is likely to be an opportunity to sell the digestate to neighbouring farms or to exchange crop material coming in to the plant for digestate going out. This is difficult to value but could be considered in future costing models, taking a whole farm approach as opposed to individual plant budgeting. The IRR for the slurry only model for a dairy herd of 250 cattle stands at 2.21%, assuming no heat is utilised aside from parasitic heat for the plant. As the proportion of maize is increased to a ratio of 50:50 (3e) the IRR is lower due to the cost of feedstock being incurred and thus greater running costs, although the per unit capital investment costs reduce. In terms of maximising the energy output and the IRR the most favourable model is the 70:30 slurry to crop ratio. Increasing the proportion of crop material above 30% results in feedstock costs increasing more rapidly than energy production and therefore lower returns; as the capital and operational costs are not proportionate to scale, this optimum ratio will be highly sensitive to costs. As with the small-scale model the addition of grass silage rather than maize marginally increases the IRR. Although the additional labour requirement for the three harvests has been accounted for in the costing, the practicalities of this must also be considered. The most favourable crop option will be determined by the location, land type and existing farm production systems. If maize is already
Farm-Scale AD Plant Efficiency, March 2011
26
grown on the farm and suitable additional land is available this is likely to be the favourable option. Although the production cost is slightly higher compared to grass, at £30 per tonne as opposed to £25 per tonne, the biogas output is also higher. If however maize is not already grown on site then this would suggest the area or land are not suitable and the machinery is not available to the grower, therefore grass will be more favourable. At the medium-scale the most financially attractive option, based solely on the IRR, is the slurry-only model followed closely by the 70:30 ratio; however, in the former the energy output is very low by comparison. Inclusion of crop material can increase energy output tenfold for less than three times the capital cost. If maximum energy output is to be achieved with the most favourable IRR, the most attractive option at this scale is 70% slurry, 30% crop.
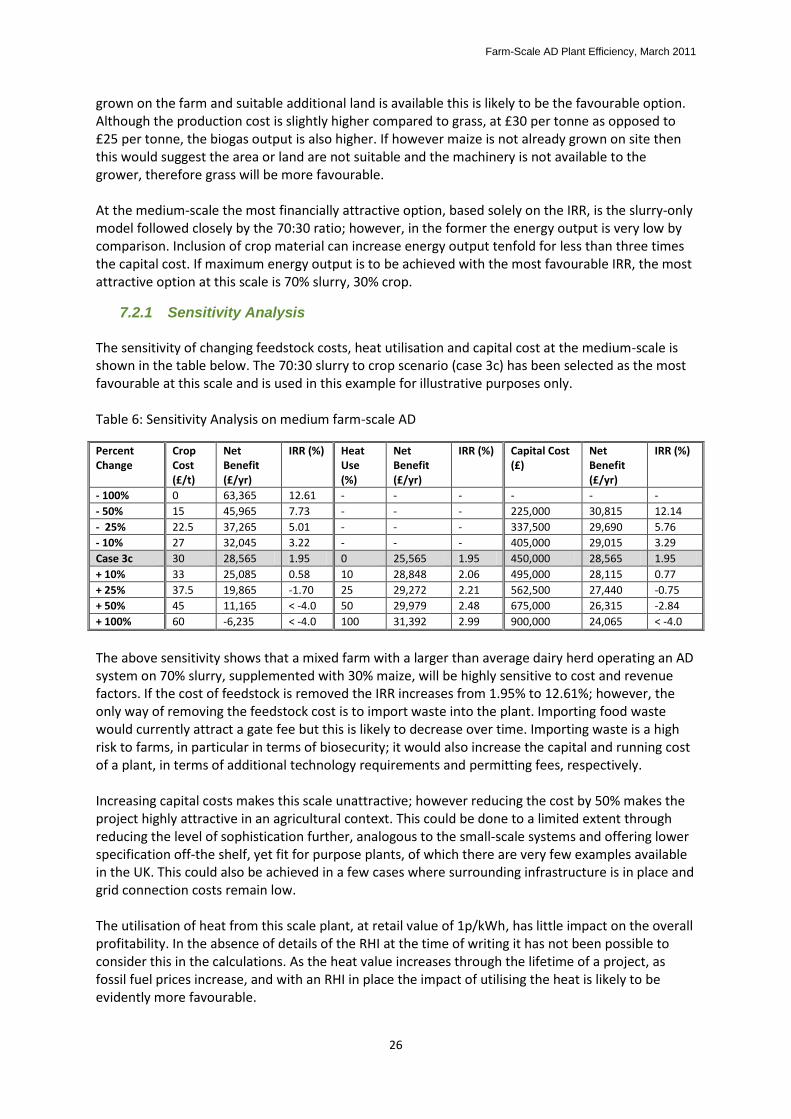
7.2.1 Sensitivity Analysis The sensitivity of changing feedstock costs, heat utilisation and capital cost at the medium-scale is shown in the table below. The 70:30 slurry to crop scenario (case 3c) has been selected as the most favourable at this scale and is used in this example for illustrative purposes only. Table 6: Sensitivity Analysis on medium farm-scale AD
Percent Change
Crop Cost (£/t)
Net Benefit (£/yr)
IRR (%) Heat Use (%)
Net Benefit (£/yr)
IRR (%) Capital Cost (£)
Net Benefit (£/yr)
IRR (%)
- 100% 0 63,365 12.61 - - - - - -
- 50% 15 45,965 7.73 - - - 225,000 30,815 12.14
- 25% 22.5 37,265 5.01 - - - 337,500 29,690 5.76
- 10% 27 32,045 3.22 - - - 405,000 29,015 3.29
Case 3c 30 28,565 1.95 0 25,565 1.95 450,000 28,565 1.95
+ 10% 33 25,085 0.58 10 28,848 2.06 495,000 28,115 0.77
+ 25% 37.5 19,865 -1.70 25 29,272 2.21 562,500 27,440 -0.75
+ 50% 45 11,165 < -4.0 50 29,979 2.48 675,000 26,315 -2.84
+ 100% 60 -6,235 < -4.0 100 31,392 2.99 900,000 24,065 < -4.0
The above sensitivity shows that a mixed farm with a larger than average dairy herd operating an AD system on 70% slurry, supplemented with 30% maize, will be highly sensitive to cost and revenue factors. If the cost of feedstock is removed the IRR increases from 1.95% to 12.61%; however, the only way of removing the feedstock cost is to import waste into the plant. Importing food waste would currently attract a gate fee but this is likely to decrease over time. Importing waste is a high risk to farms, in particular in terms of biosecurity; it would also increase the capital and running cost of a plant, in terms of additional technology requirements and permitting fees, respectively. Increasing capital costs makes this scale unattractive; however reducing the cost by 50% makes the project highly attractive in an agricultural context. This could be done to a limited extent through reducing the level of sophistication further, analogous to the small-scale systems and offering lower specification off-the shelf, yet fit for purpose plants, of which there are very few examples available in the UK. This could also be achieved in a few cases where surrounding infrastructure is in place and grid connection costs remain low. The utilisation of heat from this scale plant, at retail value of 1p/kWh, has little impact on the overall profitability. In the absence of details of the RHI at the time of writing it has not been possible to consider this in the calculations. As the heat value increases through the lifetime of a project, as fossil fuel prices increase, and with an RHI in place the impact of utilising the heat is likely to be evidently more favourable.
Farm-Scale AD Plant Efficiency, March 2011
27
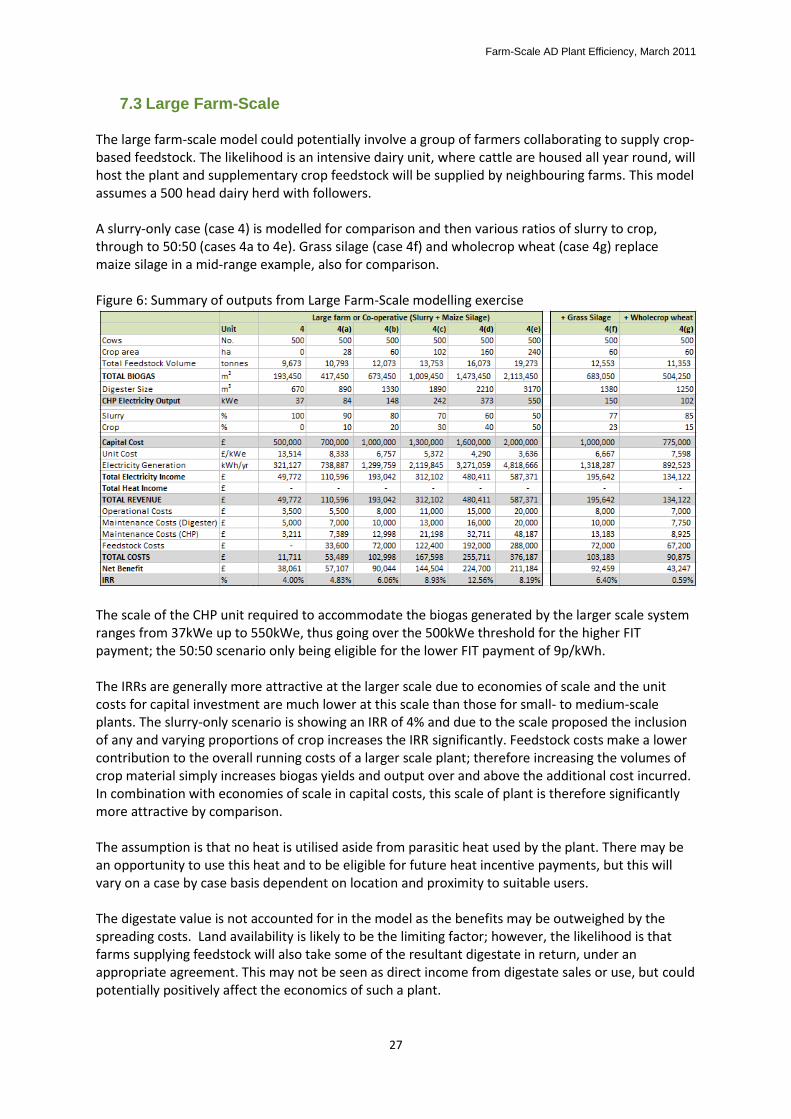
7.3 Large Farm-Scale The large farm-scale model could potentially involve a group of farmers collaborating to supply crop-based feedstock. The likelihood is an intensive dairy unit, where cattle are housed all year round, will host the plant and supplementary crop feedstock will be supplied by neighbouring farms. This model assumes a 500 head dairy herd with followers. A slurry-only case (case 4) is modelled for comparison and then various ratios of slurry to crop, through to 50:50 (cases 4a to 4e). Grass silage (case 4f) and wholecrop wheat (case 4g) replace maize silage in a mid-range example, also for comparison. Figure 6: Summary of outputs from Large Farm-Scale modelling exercise
The scale of the CHP unit required to accommodate the biogas generated by the larger scale system ranges from 37kWe up to 550kWe, thus going over the 500kWe threshold for the higher FIT payment; the 50:50 scenario only being eligible for the lower FIT payment of 9p/kWh. The IRRs are generally more attractive at the larger scale due to economies of scale and the unit costs for capital investment are much lower at this scale than those for small- to medium-scale plants. The slurry-only scenario is showing an IRR of 4% and due to the scale proposed the inclusion of any and varying proportions of crop increases the IRR significantly. Feedstock costs make a lower contribution to the overall running costs of a larger scale plant; therefore increasing the volumes of crop material simply increases biogas yields and output over and above the additional cost incurred. In combination with economies of scale in capital costs, this scale of plant is therefore significantly more attractive by comparison. The assumption is that no heat is utilised aside from parasitic heat used by the plant. There may be an opportunity to use this heat and to be eligible for future heat incentive payments, but this will vary on a case by case basis dependent on location and proximity to suitable users. The digestate value is not accounted for in the model as the benefits may be outweighed by the spreading costs. Land availability is likely to be the limiting factor; however, the likelihood is that farms supplying feedstock will also take some of the resultant digestate in return, under an appropriate agreement. This may not be seen as direct income from digestate sales or use, but could potentially positively affect the economics of such a plant.
Farm-Scale AD Plant Efficiency, March 2011
28
As in the other two models, replacing maize with grass silage has a positive effect on the IRR due to the lower cost of production. Grass silage may be less suitable at this scale as the crop would not fit within an arable rotation, it would more likely be a mid- to long-term crop option, and would require three harvests as opposed to one, thus increasing labour demands. This model would be more appropriate in the arable areas of the UK, where maize could be grown as a break crop on an annual basis. Wholecrop wheat is again more expensive, so less attractive economically. However, some arable farms may have capacity to increase their wheat area, making maximum use of existing machinery and resources and spreading the harvest over a longer period, gathering the wholecrop whilst still green before harvesting the mature wheat several weeks later. The most attractive option at the large scale is a higher crop to slurry ratio, whilst remaining under the 500kWe threshold for the higher FIT payment (case 4d), maximising both economic returns and energy output. Above 50:50 ratio there is a need to assess technology suitability, as the volume of water to be added or recycled will become significant. At a higher ratio dry AD may be more appropriate, however this may limit the use of slurry, especially in this model where cattle are housed all year round and thus slurry provision is not seasonal.
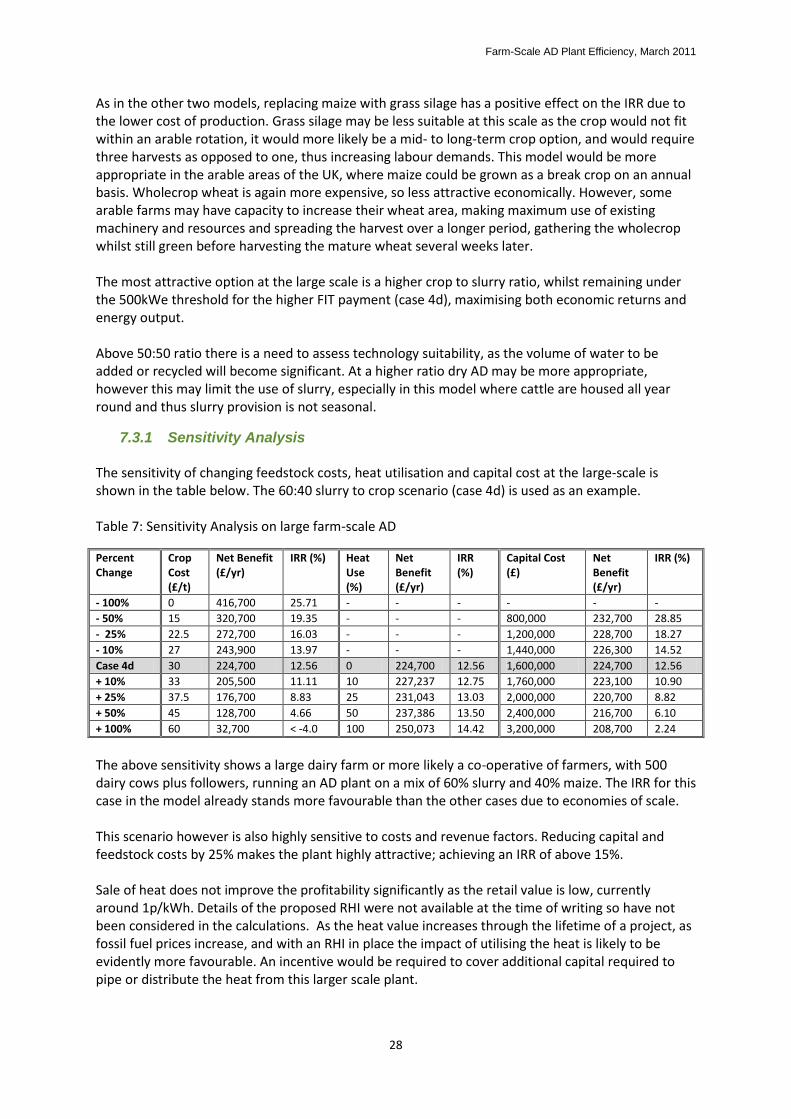
7.3.1 Sensitivity Analysis The sensitivity of changing feedstock costs, heat utilisation and capital cost at the large-scale is shown in the table below. The 60:40 slurry to crop scenario (case 4d) is used as an example. Table 7: Sensitivity Analysis on large farm-scale AD
Percent Change
Crop Cost (£/t)
Net Benefit (£/yr)
IRR (%) Heat Use (%)
Net Benefit (£/yr)
IRR (%)
Capital Cost (£)
Net Benefit (£/yr)
IRR (%)
- 100% 0 416,700 25.71 - - - - - -
- 50% 15 320,700 19.35 - - - 800,000 232,700 28.85
- 25% 22.5 272,700 16.03 - - - 1,200,000 228,700 18.27
- 10% 27 243,900 13.97 - - - 1,440,000 226,300 14.52
Case 4d 30 224,700 12.56 0 224,700 12.56 1,600,000 224,700 12.56
+ 10% 33 205,500 11.11 10 227,237 12.75 1,760,000 223,100 10.90
+ 25% 37.5 176,700 8.83 25 231,043 13.03 2,000,000 220,700 8.82
+ 50% 45 128,700 4.66 50 237,386 13.50 2,400,000 216,700 6.10
+ 100% 60 32,700 < -4.0 100 250,073 14.42 3,200,000 208,700 2.24
The above sensitivity shows a large dairy farm or more likely a co-operative of farmers, with 500 dairy cows plus followers, running an AD plant on a mix of 60% slurry and 40% maize. The IRR for this case in the model already stands more favourable than the other cases due to economies of scale. This scenario however is also highly sensitive to costs and revenue factors. Reducing capital and feedstock costs by 25% makes the plant highly attractive; achieving an IRR of above 15%. Sale of heat does not improve the profitability significantly as the retail value is low, currently around 1p/kWh. Details of the proposed RHI were not available at the time of writing so have not been considered in the calculations. As the heat value increases through the lifetime of a project, as fossil fuel prices increase, and with an RHI in place the impact of utilising the heat is likely to be evidently more favourable. An incentive would be required to cover additional capital required to pipe or distribute the heat from this larger scale plant.
Farm-Scale AD Plant Efficiency, March 2011
29
8. Conclusions Although there is significant interest from the UK farming community to be involved in AD, little progress has been made to date. The technology is fully flexible, so can be designed to accommodate any mix of feedstocks, determined by the combined dry matter content and methane generating potential. The bacteria are also flexible and over time can adapt to dietary changes in the plant. The critical factors likely to influence the health of the bacteria and thus the output of the digester are pH, alkalinity, total and volatile solids concentration, volatile fatty acids concentration and composition. Each of these variables needs to be closely monitored to prevent rapid change and disruption to the quality and rate of gas output. Once operational it is possible to vary the diet of a digester within certain technical parameters, although this must be done slowly so as not to affect the bacteria operating within the plant. Based on this modelling exercise, IRRs up to just above 12% can be achieved currently through farm-scale AD, remaining under the lower FITs threshold of 500kWe. Although in the commercial sector an IRR of 12% would only be marginally attractive, 10 – 15% would typically be acceptable for an agricultural lender where collateral can be secured against the loan. To avoid securing land and other farm assets against the loan an IRR of 15% and above would be required; however, this would be uncommon in a farm situation where loans are typically secured against land or property. The two greatest sensitivities for farm-scale AD are cost of feedstock and capital cost of plant. The former cannot be avoided unless waste is imported into the plant and this would not be a practical option for a farm-based plant where the biosecurity risk would be increased. Additional capital would also be required for the pre-treatment, handling and storage facilities, which would make such a scale plant even less desirable. It may be possible to reduce crop production costs further through improved management of the crops, increased productivity and incorporation of the digestate into the production cycle; however, this is likely to take time. The land areas required for feeding the digester are not insignificant; on an average dairy farm over 70% of the land area is already committed to providing grazing and forage for the cattle, leaving relatively small areas to produce other products and to supply crops for the AD plant. At all scales the likelihood is that supplementary feed, either for the plant or the dairy herd, will have to be bought in from local suppliers or neighbouring farms. The latter sensitivity, the capital cost of the plant, cannot be reduced much below the figures proposed here as it has been assumed that the farm would already be using lower-specification, often manual systems, as opposed to highly sophisticated fully automated systems analogous to larger scale waste-fed operations. As more plants are built in the UK and more UK-suppliers become established there is scope for reductions in capital cost over time. In addition farmers should be encouraged to undertake aspects of the project management, procurement or groundwork’s themselves to further reduce costs. Using the heat can improve returns marginally, but this is not always possible in rural location analogous with farm-scale AD. An added incentive is required to encourage utilisation of heat and to support the associated infrastructure required to pipe and distribute the heat as necessary and at the time of writing details of the RHI have not been published and hence cannot be factored into the calculations. In order to view AD as a renewable energy plant rather than a slurry management facility, to warrant energy generation and to maximise outputs it is essential to supplement slurry with vegetative
Farm-Scale AD Plant Efficiency, March 2011
30
material; either from purposely grown crops or residues. This clearly impacts on running costs when the production costs of such materials are taken into consideration and as the capital cost does not increase proportionately with the scale of plant, nor is it standardised due to varying levels of existing infrastructure on-farm, the optimum ratio of slurry to crop is difficult to define across all scales. At the small scale the cost of crop production outweighs the additional energy output and thus returns, and therefore slurry-only is the most economically attractive model. At the medium scale the balance is around 70:30 slurry to crop input, before the cost of crop production outweighs the additional energy output. At the large scale although the energy output continues to increase beyond 50:50 slurry to crop input, the step change in the FIT tariff for electricity generation (>500kW) means the greatest financial returns are achieved at the 60:40 slurry to crop ratio. The optimum ratios defined here at the three scales are clearly highly sensitive to changes in capital and operational costs, so should always be reconsidered on a case by case basis. All of these ratios are technically and biologically possible. The technology can be adapted and the moisture content within the tank adjusted by recycling dirty water back through the system. The bacteria will adapt to the mix within the tank and will colonise from first introduction at the pre-commissioning stage; this is not affected by the mix within the tank as long as any changes are made slowly to allow the bacteria time to adapt. Crop-only plants are technically possible, but require a different technology and longer retention times, thus greater capital investment. Crop-only plants are appropriate in some instances in the UK, where slurry supply is not a possibility, land is not suitable for food production, or to avoid biosecurity or health risks associated with importing waste material. It is unlikely that farms will use crops above a level that optimises the economics of the system due to such projects being highly sensitive to changes in feedstock costs over time.
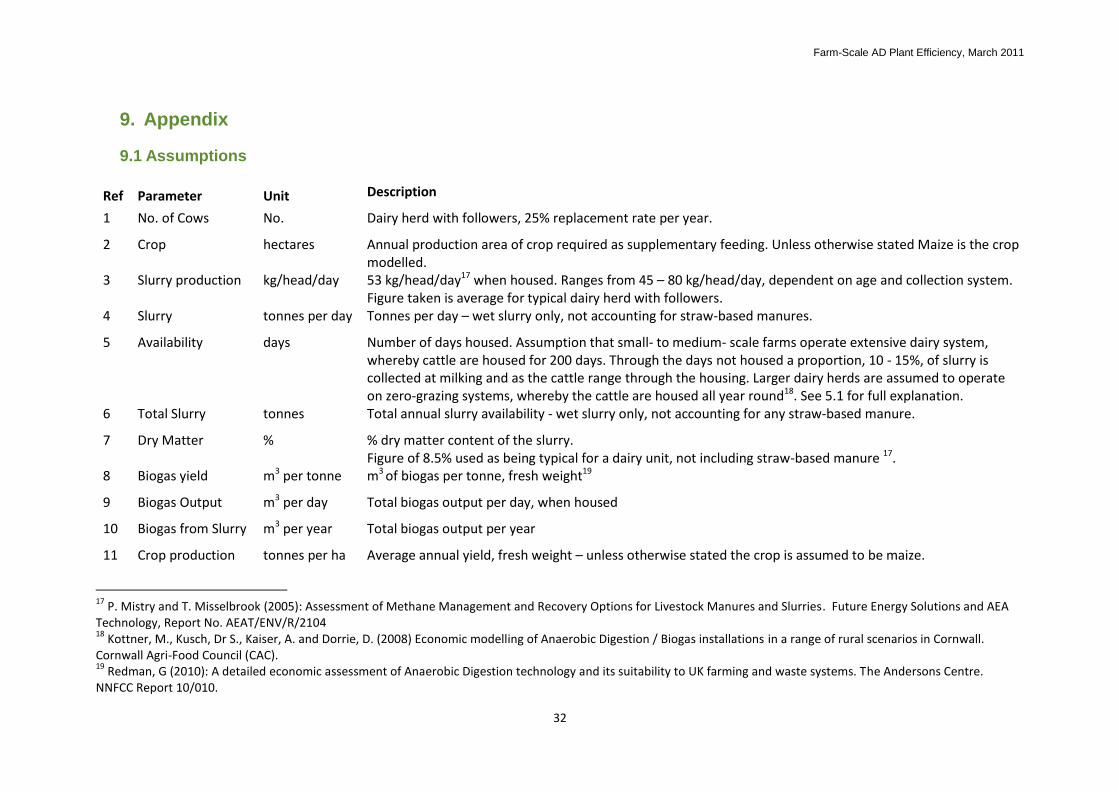
Farm-Scale AD Plant Efficiency, March 2011
32
9. Appendix
9.1 Assumptions
Ref Parameter Unit Description
1 No. of Cows No. Dairy herd with followers, 25% replacement rate per year.
2 Crop hectares Annual production area of crop required as supplementary feeding. Unless otherwise stated Maize is the crop modelled.
3 Slurry production kg/head/day 53 kg/head/day17 when housed. Ranges from 45 – 80 kg/head/day, dependent on age and collection system. Figure taken is average for typical dairy herd with followers.
4 Slurry tonnes per day Tonnes per day – wet slurry only, not accounting for straw-based manures.
5 Availability days Number of days housed. Assumption that small- to medium- scale farms operate extensive dairy system, whereby cattle are housed for 200 days. Through the days not housed a proportion, 10 - 15%, of slurry is collected at milking and as the cattle range through the housing. Larger dairy herds are assumed to operate on zero-grazing systems, whereby the cattle are housed all year round18. See 5.1 for full explanation.
6 Total Slurry tonnes Total annual slurry availability - wet slurry only, not accounting for any straw-based manure.
7 Dry Matter % % dry matter content of the slurry. Figure of 8.5% used as being typical for a dairy unit, not including straw-based manure 17.
8 Biogas yield m3 per tonne m3 of biogas per tonne, fresh weight19
9 Biogas Output m3 per day Total biogas output per day, when housed
10 Biogas from Slurry m3 per year Total biogas output per year
11 Crop production tonnes per ha Average annual yield, fresh weight – unless otherwise stated the crop is assumed to be maize.
17
P. Mistry and T. Misselbrook (2005): Assessment of Methane Management and Recovery Options for Livestock Manures and Slurries. Future Energy Solutions and AEA Technology, Report No. AEAT/ENV/R/2104 18
Kottner, M., Kusch, Dr S., Kaiser, A. and Dorrie, D. (2008) Economic modelling of Anaerobic Digestion / Biogas installations in a range of rural scenarios in Cornwall. Cornwall Agri-Food Council (CAC). 19
Redman, G (2010): A detailed economic assessment of Anaerobic Digestion technology and its suitability to UK farming and waste systems. The Andersons Centre. NNFCC Report 10/010.
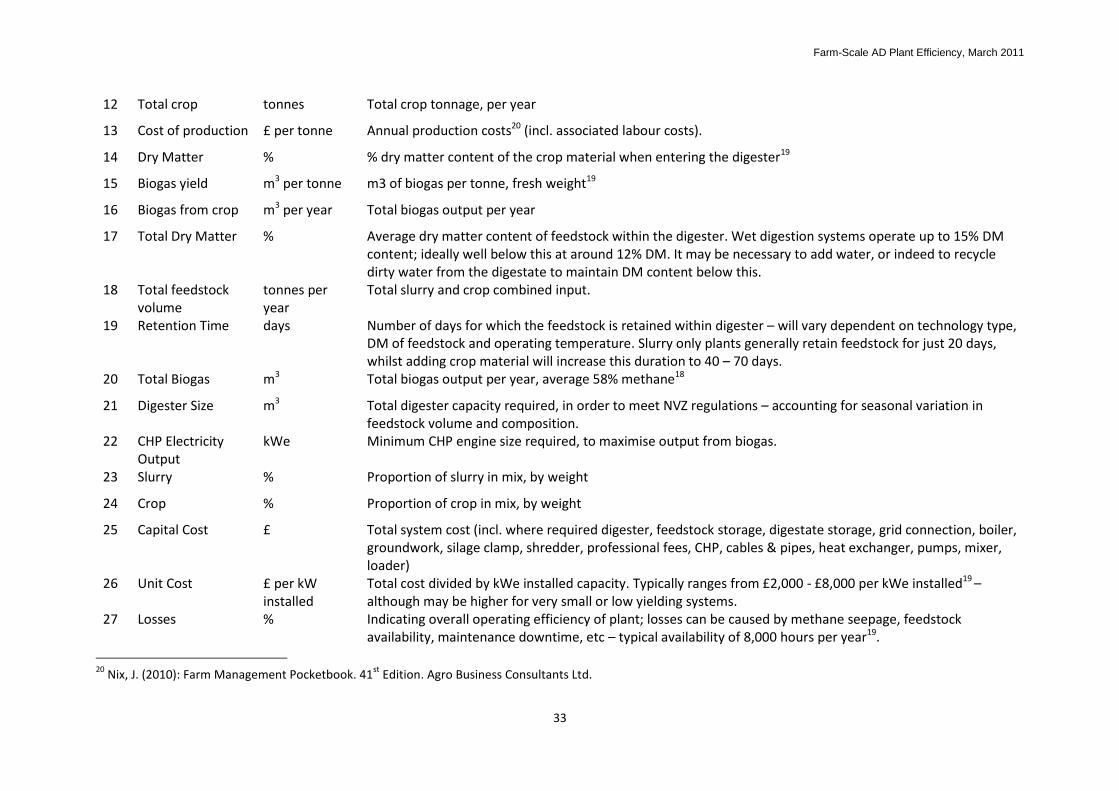
Farm-Scale AD Plant Efficiency, March 2011
33
12 Total crop tonnes Total crop tonnage, per year
13 Cost of production £ per tonne Annual production costs20 (incl. associated labour costs).
14 Dry Matter % % dry matter content of the crop material when entering the digester19
15 Biogas yield m3 per tonne m3 of biogas per tonne, fresh weight19
16 Biogas from crop m3 per year Total biogas output per year
17 Total Dry Matter % Average dry matter content of feedstock within the digester. Wet digestion systems operate up to 15% DM content; ideally well below this at around 12% DM. It may be necessary to add water, or indeed to recycle dirty water from the digestate to maintain DM content below this.
18 Total feedstock volume
tonnes per year
Total slurry and crop combined input.
19 Retention Time days Number of days for which the feedstock is retained within digester – will vary dependent on technology type, DM of feedstock and operating temperature. Slurry only plants generally retain feedstock for just 20 days, whilst adding crop material will increase this duration to 40 – 70 days.
20 Total Biogas m3 Total biogas output per year, average 58% methane18
21 Digester Size m3 Total digester capacity required, in order to meet NVZ regulations – accounting for seasonal variation in feedstock volume and composition.
22 CHP Electricity Output
kWe Minimum CHP engine size required, to maximise output from biogas.
23 Slurry % Proportion of slurry in mix, by weight
24 Crop % Proportion of crop in mix, by weight
25 Capital Cost £ Total system cost (incl. where required digester, feedstock storage, digestate storage, grid connection, boiler, groundwork, silage clamp, shredder, professional fees, CHP, cables & pipes, heat exchanger, pumps, mixer, loader)
26 Unit Cost £ per kW installed
Total cost divided by kWe installed capacity. Typically ranges from £2,000 - £8,000 per kWe installed19 – although may be higher for very small or low yielding systems.
27 Losses % Indicating overall operating efficiency of plant; losses can be caused by methane seepage, feedstock availability, maintenance downtime, etc – typical availability of 8,000 hours per year19.
20
Nix, J. (2010): Farm Management Pocketbook. 41st
Edition. Agro Business Consultants Ltd.
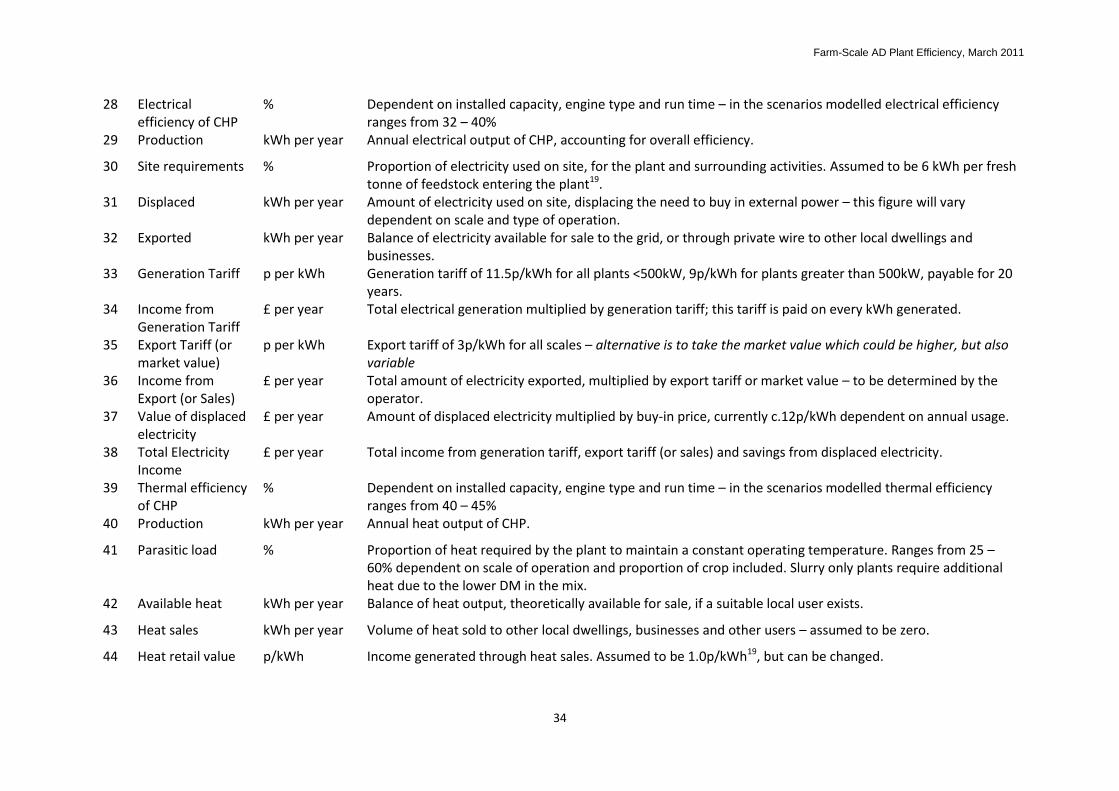
Farm-Scale AD Plant Efficiency, March 2011
34
28 Electrical efficiency of CHP
% Dependent on installed capacity, engine type and run time – in the scenarios modelled electrical efficiency ranges from 32 – 40%
29 Production kWh per year Annual electrical output of CHP, accounting for overall efficiency.
30 Site requirements % Proportion of electricity used on site, for the plant and surrounding activities. Assumed to be 6 kWh per fresh tonne of feedstock entering the plant19.
31 Displaced kWh per year Amount of electricity used on site, displacing the need to buy in external power – this figure will vary dependent on scale and type of operation.
32 Exported kWh per year Balance of electricity available for sale to the grid, or through private wire to other local dwellings and businesses.
33 Generation Tariff p per kWh Generation tariff of 11.5p/kWh for all plants <500kW, 9p/kWh for plants greater than 500kW, payable for 20 years.
34 Income from Generation Tariff
£ per year Total electrical generation multiplied by generation tariff; this tariff is paid on every kWh generated.
35 Export Tariff (or market value)
p per kWh Export tariff of 3p/kWh for all scales – alternative is to take the market value which could be higher, but also variable
36 Income from Export (or Sales)
£ per year Total amount of electricity exported, multiplied by export tariff or market value – to be determined by the operator.
37 Value of displaced electricity
£ per year Amount of displaced electricity multiplied by buy-in price, currently c.12p/kWh dependent on annual usage.
38 Total Electricity Income
£ per year Total income from generation tariff, export tariff (or sales) and savings from displaced electricity.
39 Thermal efficiency of CHP
% Dependent on installed capacity, engine type and run time – in the scenarios modelled thermal efficiency ranges from 40 – 45%
40 Production kWh per year Annual heat output of CHP.
41 Parasitic load % Proportion of heat required by the plant to maintain a constant operating temperature. Ranges from 25 – 60% dependent on scale of operation and proportion of crop included. Slurry only plants require additional heat due to the lower DM in the mix.
42 Available heat kWh per year Balance of heat output, theoretically available for sale, if a suitable local user exists.
43 Heat sales kWh per year Volume of heat sold to other local dwellings, businesses and other users – assumed to be zero.
44 Heat retail value p/kWh Income generated through heat sales. Assumed to be 1.0p/kWh19, but can be changed.
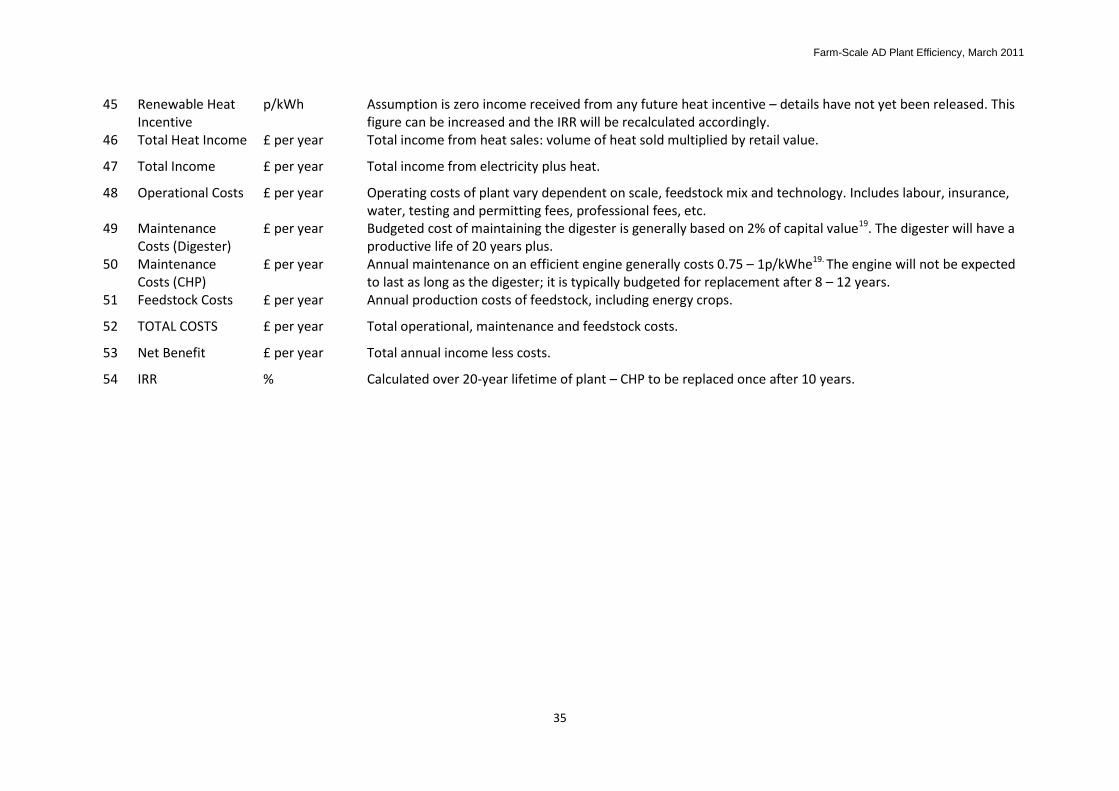
Farm-Scale AD Plant Efficiency, March 2011
35
45 Renewable Heat Incentive
p/kWh Assumption is zero income received from any future heat incentive – details have not yet been released. This figure can be increased and the IRR will be recalculated accordingly.
46 Total Heat Income £ per year Total income from heat sales: volume of heat sold multiplied by retail value.
47 Total Income £ per year Total income from electricity plus heat.
48 Operational Costs £ per year Operating costs of plant vary dependent on scale, feedstock mix and technology. Includes labour, insurance, water, testing and permitting fees, professional fees, etc.
49 Maintenance Costs (Digester)
£ per year Budgeted cost of maintaining the digester is generally based on 2% of capital value19. The digester will have a productive life of 20 years plus.
50 Maintenance Costs (CHP)
£ per year Annual maintenance on an efficient engine generally costs 0.75 – 1p/kWhe19. The engine will not be expected to last as long as the digester; it is typically budgeted for replacement after 8 – 12 years.
51 Feedstock Costs £ per year Annual production costs of feedstock, including energy crops.
52 TOTAL COSTS £ per year Total operational, maintenance and feedstock costs.
53 Net Benefit £ per year Total annual income less costs.
54 IRR % Calculated over 20-year lifetime of plant – CHP to be replaced once after 10 years.
