energetic conversion of ofmsw by anaerobic codigestion ... · anaerobic codigestion (acod) is a...
TRANSCRIPT
0
UNIVERSITÀ DEGLI STUDI DI UDINE
DOTTORATO DI RICERCA IN
TECNOLOGIE CHIMICHE ED ENERGETICHE
ENERGETIC CONVERSION OF ORGANIC FRACTION OF MUNICIPAL SOLID WASTE BY ANAEROBIC
CODIGESTION WITH SEWAGE SLUDGE
Ing. Valentina Cabbai
COMMISSION Prof. Linda Weavers REVIEWER Dr. Cristina Cavinato REVIEWER Prof. Carla de Leitenburg REFEREE Dr. Frederic Meunier REFEREE Dr. Fabio Tatano REFEREE Prof. Daniele Goi SUPERVISOR Prof. Alfredo Soldati DIRECTOR OF PH.D. PROGRAM

Energetic conversion of OFMSW by anaerobic codigestion with sewage sludge
1
INTRODUCTION ........................................................................................................ 5
ORGANIC SUBSTRATES CHARACTERIZATION .................................... 9 1
1.1 INTRODUCTION.......................................................................................... 9 1.2 MATERIAL AND METHODS ..................................................................... 9
1.2.1 ORGANIC WASTES AND INOCULA ................................................. 9 1.2.2 ANALYTICAL METHODS ................................................................. 10
1.3 RESULTS&DISCUSSION ........................................................................... 10 1.3.1 WASTES CHARACTERISTICS .......................................................... 10
1.4 CONCLUSIONS .......................................................................................... 16
BIOCHEMICAL METHANE POTENTIAL TESTS (BMP) ........................ 17 2
2.1 INTRODUCTION........................................................................................ 17 2.2 MATERIAL AND METHODS ................................................................... 17
2.2.1 EXPERIMENTAL SET-UP AND PROCEDURE .............................. 17 2.2.2 INOCULUM TO SUBSTRATE RATIO (ISR) .................................... 19 2.2.3 ANALYTICAL METHODS ................................................................. 19
2.3 RESULTS&DISCUSSION ........................................................................... 19 2.3.1 INOCULA CHARACTERISTICS ........................................................ 19 2.3.2 BMP OF SwS AT DIFFERENT ISR .................................................... 20 2.3.3 BMP OF MONO-SUBSTRATES ........................................................ 21 2.3.4 BMP OF MIXED SUBSTRATES IN AcoD REGIME ........................ 23 2.3.5 BMP ANALYTICAL PARAMETERS RESULTS ............................... 25
2.4 CONCLUSIONS .......................................................................................... 27
PILOT PLANT TEST ......................................................................................... 29 3
3.1 INTRODUCTION........................................................................................ 29 3.2 MATERIAL AND METHODS ................................................................... 29
3.2.1 PILOT PLANT CONFIGURATION ................................................... 29 3.2.1.1 Substrates pre-treatment ............................................................................. 29 3.2.1.2 AD unit.......................................................................................................... 30
3.2.1.2.1 Feeding tank ........................................................................................... 31 3.2.1.2.2 Loading pump ........................................................................................ 31 3.2.1.2.3 Internal recirculation pump and heat exchanger ............................... 31 3.2.1.2.4 Anaerobic Digester ................................................................................ 32 3.2.1.2.5 External recirculation pump ................................................................. 33 3.2.1.2.6 Discharging pump ................................................................................. 33

2
3.2.1.3 Biogas line ..................................................................................................... 34 3.2.1.3.1 Water condensation column ................................................................. 34 3.2.1.3.2 Silica gel adsorption column ................................................................. 34 3.2.1.3.3 Activated carbon adsorption column .................................................. 34 3.2.1.3.4 Flow meter and non-return valve ........................................................ 34
3.2.1.4 Pilot plant technical drownings ................................................................. 35 3.2.2 ANALYTICAL METHODS ................................................................. 35 3.2.3 ORGANIC SUBSTRATES ................................................................... 38 3.2.4 EXPERIMENTAL PROCEDURE ....................................................... 38
3.3 RESULTS&DISCUSSION ........................................................................... 40 3.3.1 TOTAL AND VOLATILE SOLIDS ..................................................... 41 3.3.2 TOTAL AND SOLUBLE COD ............................................................ 44 3.3.3 TKN AND AMMONIA ....................................................................... 46 3.3.4 C,N......................................................................................................... 47 3.3.5 SULPHATES, PHOSPHORUS AND POTASSIUM ......................... 48 3.3.6 HEAVY METALS ................................................................................ 50 3.3.7 CONTROL PARAMETERS ................................................................ 51 3.3.8 BIOGAS MONITORING ..................................................................... 53 3.3.9 EFFICIENCY PARAMETERS ............................................................. 55 3.3.10 CONCLUSIONS ................................................................................... 57
MATHEMATICAL MODELING OF THE ANAEROBIC DIGESTION 4PROCESS BY ADMNO°1 ........................................................................................ 61
4.1 INTRODUCTION ....................................................................................... 61 4.2 MATERIAL AND METHODS ................................................................... 65
4.2.1 FULL-SCALE AD UNIT ...................................................................... 65 4.2.2 ANALYTICAL METHODS ................................................................. 65 4.2.3 EXPERIMENTAL PROCEDURE ....................................................... 65 4.2.4 MODEL IMPLEMENTATION ........................................................... 66
4.3 RESULTS&DISCUSSION ........................................................................... 67 4.3.1 SwS AD PROCESS SIMULATION .................................................... 67
4.3.1.1 Bmp tests modelling with COPP Interface adoption .............................. 67 4.3.1.2 Full-scale AD reactor ................................................................................... 71
4.3.1.2.1 Full-scale AD reactor simulation with COPP Interface adoption .... 72 4.3.1.2.2 Full-scale AD reactor simulation with modified ADM1 ................... 74
4.3.2 AcoD SIMULATION ............................................................................ 75 4.3.2.1 Pilot plant ...................................................................................................... 75

Energetic conversion of OFMSW by anaerobic codigestion with sewage sludge
3
4.3.2.2 Full-scale AD reactor ................................................................................... 76 4.4 CONCLUSIONS .......................................................................................... 77
FEASIBILITY STUDY OF ACOD PLANT UP-GRADE ............................. 79 5
5.1 INTRODUCTION........................................................................................ 79 5.2 SCENARIO 1 ................................................................................................ 81
5.2.1 Energy balance ....................................................................................... 82 5.2.2 Digestate ................................................................................................ 82 5.2.3 Economic evaluation .............................................................................. 84
5.2.3.1 Investment .................................................................................................... 84 5.2.3.2 Economic feasibility .................................................................................... 85
5.3 SCENARIO 2 ................................................................................................ 85 5.3.1 Energy balance ....................................................................................... 89 5.3.2 Digestate ................................................................................................ 90 5.3.3 Economic evaluation .............................................................................. 91
5.3.3.1 Investment .................................................................................................... 91 5.3.3.2 Economic feasibility .................................................................................... 92
5.4 SCENARIOS COMPARISON AND CONCLUSIONS ............................ 92
CONCLUSIONS ................................................................................................. 95 6
REFERENCES ............................................................................................................. 99
APPENDIX ................................................................................................................ 111

4

5
Introduction To decrease the environmental pressure caused by landfill disposal, sustainable management practices for the organic fraction of municipal solid waste (OFMSW) consist nowadays in composting or wet and dry anaerobic digestion. Anaerobic digestion (AD) is a biological process that involves the degradation of organic matter and the production of biogas, a mix of methane and carbon dioxide in variable percentage. Biogas is a renewable energy source and a key factor for a future fossil fuels independent society. AD technology, combined with digestate composting, allows energy recovery and nutrient soil replacement. Anaerobic codigestion (AcoD) is a challenging technology applied for both treatment of solid and liquid organic wastes (Alatriste-Mondragón et al., 2006) when the AD process of these mixtures is sustainable. AcoD of sewage sludge (SwS) with OFMSW may be one of the most viable solutions to optimize the oversized digesters efficiency in wastewater treatment plants (WWTPs): the typical free capacity of existing, traditionally designed, municipal SwS digesters can be well used adding the appropriate amount of OFMSW in AD process supply (Sosnowski et al., 2008). The substrate mixtures treated in AcoD process must be well balanced in all chemical-physical properties to allow positive interactions, to avoid inhibitions and to optimize methane production (Mata Alvarez et al., 2011). The quality of organic wastes used in this process affects both the reactor operations and the subsequent use of the digestate as fertilizer on agricultural soils (Capela et al., 2008), likewise AD system management is strictly bound to the inlet waste mixture. An interesting study (Yoshida et al. 2012) reports greenhouse gas (GHG) emission analysis evaluation performed by different organic waste management practices in the City of Madison, Wisconsin (USA). Using Life Cycle Assessment (LCA) they found SwS and OFMSW AcoD process is a good practice not only for a general GHG emission reduction but also for the potential to save capital cost respect composting and mono-substrate digestion. The payback period of the investment for the up-grade to SwS-

Introduction
6
OFMSW AcoD process is usually short (Mata Alvarez et al., 2011): existing AD reactors and WWTP operational facilities can be utilize, saving most part of initial and operational costs (Yoshida et al., 2012). Various studies are reported on AcoD process operating with SwS and OFMSW or fruit and vegetables solid wastes (FVW) on lab scale (Stroot et al., 2001; Kim et al., 2003; Murto et al. 2004; Gómez et al., 2006; Gomez-Lahoz et al., 2007; Scaglione et al., 2009), pilot scale (Sosnowski et al., 2003; Caffaz et al., 2008; Liu et al., 2012; Cavinato et al., 2013) and full-scale plants (Rintala and Järvinen et al.,1996; Edelmann et al., 2000; Bolzonella et al., 2006; Zupančic et al., 2008; Zitomer et al., 2008). The main results show that SwS characteristics play an important role in AcoD with OFMSW: the nitrogen content of secondary sludge can remedy a possible lack of nutrients in OFMSW co-substrate as well as primary sludge (rich in lipids) can increase methane production yield of the AcoD process (Mata Alvarez et al., 2011). Similarly, the rate and the extent of anaerobic degradation and solid stabilization are functions of the intrinsic properties of the wastes and the microorganism involved (Gunaseelan et al., 2007), where the composition of organic matter depends greatly on the source of the organic fraction (Chen et al., 2008). A way to understand accurately the properties of the substrate to be treated is to perform BMP assays (Raposo et al. 2011b), likewise macromolecular composition analysis in terms of carbohydrates, proteins, lipids and volatile fatty acids (VFA) allows a good characterization of the organic features of substrates involved in the AD process. All these studies lead to the statement that the nexus between wastewater treatment and organic waste management is strictly related to the need of reaching an environmental sustainable economic system able to provide treated water, bioenergy and biofertilizer: integrated solid waste and wastewater treatment management could play a fundamental role in this challenge. Whereas approximately 120 to 140 million tonnes of biowaste are produced every year in the EU, this corresponds to approximately 300 kg of biowaste produced per EU citizen per year (Communication from the commission to the council and the European parliament on future steps in biowaste management in the European Union COM(2010)235). The management of biowaste is covered by several pieces of EU legislation: according to the EU Landfill Directive (1999/31/EC) Member States shall reduce the amount of

Energetic conversion of OFMSW by anaerobic codigestion with sewage sludge
7
biodegradable municipal waste landfilled, the Waste Framework Directive (2008/98/EC) encourages Member States to collect separately and recycle biowaste and enables the setting of EU minimum requirements for biowaste management and quality criteria for biowaste compost and digestate (end-of-waste criteria). Moreover the Directive on Renewable Energy Sources (2009/28/EC) promotes the biowaste use to replace fossil fuels. The biowaste separate collection and biological treatment with energy and matter recovery, represents an optimal solution to fulfil the European waste management strategy. The PhD project is focused on the creation of an applicative protocol to optimize the WWTP anaerobic digesters up-grade and the project of new ones, basing the design on biochemical process equations rather than on classical empirical methods. To reach this purpose, a complete analysis of the whole anaerobic digestion process is designed, scaling up from micro to macro parameters. The research work was divided in the following four steps:
• Organic substrates characterization (measuring classic chemical-physical parameters and AD key macromolecular compounds such as carbohydrates, proteins, lipids and VFA);
• Biochemical methane potential (BMP) tests (to measure organic substrates methane yields);
• Pilot plant test (to investigate in a CSTR regime, the interaction between the substrates with increasing organic loading rates);
• Anaerobic Digestion Model no°1 (ADM1, Batstone et al., 2006) implementation.
The applicative case study regards the up-grade, of an existing anaerobic digestion unit within WWTP of the city of Udine (Italy), to lead to sewage sludge codigestion with organic fraction of municipal solid wastes. Different OFMSW streams, coming from an appropriate waste collection basin, were characterized as a perspective of the AD unit up-grade to AcoD. The waste collection basin was set considering an essential OFMSW management, built on the most productive and clean material streams reaching anaerobic digester. Source selected OFMSW (SS-OFMSW) selection criterion was fixed to conciliate minor distance to WWTP and higher quality waste, to avoid AD unit maintenance problems and to obtain the maximum biogas production. The organic substrates characterization was accomplished basing on traditional
Introduction
8
physicochemical parameters (commonly used in the past to design anaerobic digesters), elemental analysis and macromolecular compounds. In BMP tests SwS and the more representative substrates for AD unit process, within the waste collection basin, were analysed. Further BMP tests on different SwS and SS-OFMSW mixing ratio were carried out to compare codigestion methane yields. Pilot plant test were performed at 2.3m3 reactor. After start-up procedure, experimental loading cycles were applied to understand biomass behaviour in codigestion regime. The ADM no°1 model was used to simulate the process in both bench-top and pilot plant tests with the aim of create a calibrated and validated model to optimize the AD unit up-grade. A feasibility study complete the PhD project: basing on results obtained in the experimental phase, two upgrade scenarios were defined considering the local substrates availability.
9
Organic substrates 1characterization
1.1 INTRODUCTION
The organic substrate characterization plays a fundamental role in the treatment process evaluation and in the mathematical modelling implementation. Classical chemical-physical analysis constituted, in the past, the basis for anaerobic reactor design. Elemental analysis on feeding substrates is an easy tool to control nutrient ratio in the supply and macromolecular compounds analysis such as carbohydrates, proteins, lipids and volatile fatty acids allows to rich the information about the quality of organic matter and to understand the possible degradation paths in the bacteria metabolism. The sum of all these analysis allows to perform the COD fractionation procedure that is the first step to mathematical model implementation. A complete substrate characterization has the potential to base the AD design on biochemical process equations rather than on classical empirical methods.
1.2 MATERIAL AND METHODS
1.2.1 ORGANIC WASTES AND INOCULA
OFMSW samples were obtained by source selected producers in a 30 liters bins. The SS-OFMSW sampling has regarded the organic residues collected from two canteens (Canteen 1, Canteen 2), two supermarkets (Supermarket 1, Supermarket 2), one restaurant, one household, two fruit and vegetable markets (FVW 1, FVW 2) and one bakery. Household wastes were withdrawn before truck collection to avoid sample squeeze.

Organic substrates characterization
10
The SwS was drawn from the sludge thickener of Udine WWTP, Italy. SwS was a mixture of primary sludge and waste activated sludge.
1.2.2 ANALYTICAL METHODS
Total Solids (TS), Volatile Solids (VS), Chemical Oxygen Demand (COD), Total Kjeldahl Nitrogen (TKN), ammonium nitrogen (N-NH4+), total phosphorus, sulfate SO42-, pH and alkalinity were measured according to Standard Methods (APHA et al., 2005). Soluble fractions of samples were obtained passing slurries through 0.45 μm cellulose filter. Volatile Fatty Acids (VFA) concentrations were determined by gas-chromatography with mass spectrometer (Agilent 6890Plus/5973N) equipped with capillary column (Agilent HP-5MS). Carbohydrates were analyzed using Dubois method (Dubois et al., 1956) with glucose as standard. Total proteins were estimated multiplying organic nitrogen (TKN - N-NH4+) by 6.25. Lipids were measured by gravimetric analysis after acetone-hexane extraction. Elemental analysis (C,H,N) was carried out by Flash EA 1112 Elemental Analyzer (Thermo Finnigan, Italy).
1.3 RESULTS&DISCUSSION
1.3.1 WASTES CHARACTERISTICS
SS-OFMSW samples showed different composition: canteens and restaurant residues were the most heterogeneous with vegetables peels, rice, pasta, bread, meet and other scraps types. Supermarkets wastes were exclusively constituted by fruit and vegetables because all other organic wastes produced took ways of reuse and recycling. Bakery residues were almost pastry refuses and sweet creams. Inert materials in all samples were negligible. TS in raw wastes, after grinding, ranged from 8 and 70% TS, the lowest concentration for vegetable samples and the highest for bakery residues. Canteens, restaurant and household wastes showed the typical values of 30%TS, similar values were obtained for domestic and commercial food waste by other authors (Banks et al.
Energetic conversion of OFMSW by anaerobic codigestion with sewage sludge
11
2011). In table 1.1 substrates characterization data are reported. VS/TS ratio of SS-OFMSW highlights the high organic transformation potential of these substrates in AD process respect SwS one. Methane yield in AD process depends by the amount of biodegraded VS as well as by the nature of the solid (Buffiere et al. 2006), so it’s fundamental to distinguish the biochemical compounds that form VS in the various substrates. No mapped VS could be in part related to fibre fractions that weren’t analysed in the samples. SS-OFMSW from fruit and vegetable markets, household, canteens, restaurant and bakery had elevate carbohydrate load. SwS samples showed higher protein concentration than OFMSW samples, this is also confirmed by elemental analysis and C/N calculated ratios. High lipid concentrations were measured in bakery, canteens and restaurants wastes. Lipids must be considered very important macromolecular components related to methane productive fraction in organic substrates, an increment in lipid concentration could enhance methane production in anaerobic digestion but, at the same time, lipid charge in the matrices can lead to inhibitory effects caused by long chain fatty acids arising from lipid hydrolysis (Chen et al., 2008). VFA concentration in fresh samples showed the advanced state of fermentation of SwS, probably due to presence of anaerobiosis zone in the thickener of the WWTP. In SS-OFMSW samples, VFA are mainly made by acetic acid fraction, which is directly available to methanogens populations.
Organic substrates characterization
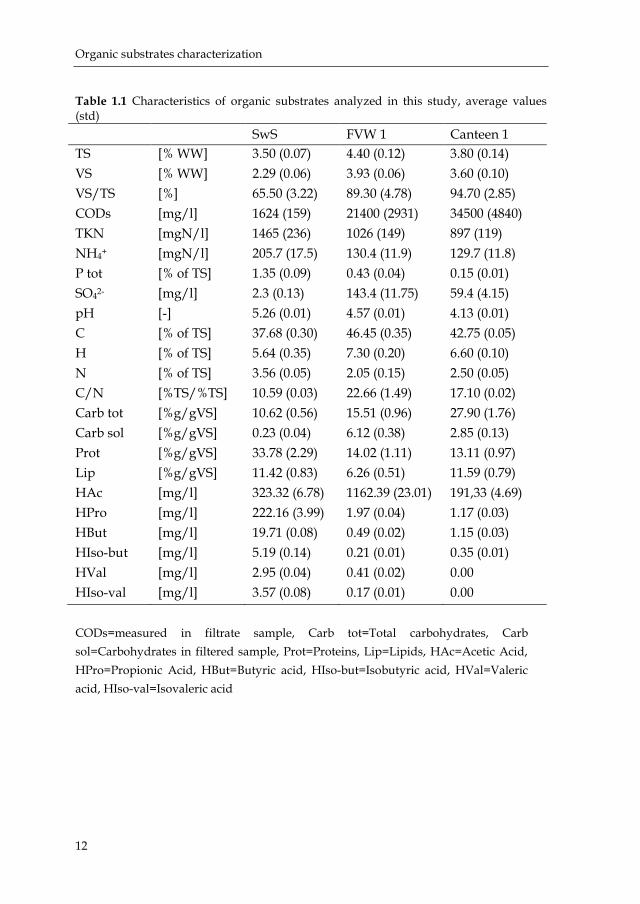
12
Table 1.1 Characteristics of organic substrates analyzed in this study, average values (std) SwS FVW 1 Canteen 1 TS [% WW] 3.50 (0.07) 4.40 (0.12) 3.80 (0.14) VS [% WW] 2.29 (0.06) 3.93 (0.06) 3.60 (0.10) VS/TS [%] 65.50 (3.22) 89.30 (4.78) 94.70 (2.85) CODs [mg/l] 1624 (159) 21400 (2931) 34500 (4840) TKN [mgN/l] 1465 (236) 1026 (149) 897 (119) NH4+ [mgN/l] 205.7 (17.5) 130.4 (11.9) 129.7 (11.8) P tot [% of TS] 1.35 (0.09) 0.43 (0.04) 0.15 (0.01) SO42- [mg/l] 2.3 (0.13) 143.4 (11.75) 59.4 (4.15) pH [-] 5.26 (0.01) 4.57 (0.01) 4.13 (0.01) C [% of TS] 37.68 (0.30) 46.45 (0.35) 42.75 (0.05) H [% of TS] 5.64 (0.35) 7.30 (0.20) 6.60 (0.10) N [% of TS] 3.56 (0.05) 2.05 (0.15) 2.50 (0.05) C/N [%TS/%TS] 10.59 (0.03) 22.66 (1.49) 17.10 (0.02) Carb tot [%g/gVS] 10.62 (0.56) 15.51 (0.96) 27.90 (1.76) Carb sol [%g/gVS] 0.23 (0.04) 6.12 (0.38) 2.85 (0.13) Prot [%g/gVS] 33.78 (2.29) 14.02 (1.11) 13.11 (0.97) Lip [%g/gVS] 11.42 (0.83) 6.26 (0.51) 11.59 (0.79) HAc [mg/l] 323.32 (6.78) 1162.39 (23.01) 191,33 (4.69) HPro [mg/l] 222.16 (3.99) 1.97 (0.04) 1.17 (0.03) HBut [mg/l] 19.71 (0.08) 0.49 (0.02) 1.15 (0.03) HIso-but [mg/l] 5.19 (0.14) 0.21 (0.01) 0.35 (0.01) HVal [mg/l] 2.95 (0.04) 0.41 (0.02) 0.00 HIso-val [mg/l] 3.57 (0.08) 0.17 (0.01) 0.00 CODs=measured in filtrate sample, Carb tot=Total carbohydrates, Carb sol=Carbohydrates in filtered sample, Prot=Proteins, Lip=Lipids, HAc=Acetic Acid, HPro=Propionic Acid, HBut=Butyric acid, HIso-but=Isobutyric acid, HVal=Valeric acid, HIso-val=Isovaleric acid

Energetic conversion of OFMSW by anaerobic codigestion with sewage sludge
13
FVW 2 Supermarket 1 Household TS [% WW] 4.50 (0.26) 4.50 (0.18) 3.60 (0.15) VS [% WW] 4.01 (0.23) 3.96 (0.12) 3.30 (0.07) VS/TS [%] 89.10 (4.03) 87.90 (2.97) 91.80 (4.96) CODs [mg/l] 35104 (3440) 33000 (3739) 21604 (2594) TKN [mgN/l] 1108 (165) 1159 (169) 863 (127) NH4+ [mgN/l] 196.4 (16.7) 189.5 (14.9) 77.6 (6.8) P tot [% of TS] 0.41 (0.05) 0.45 (0.04) 0.21 (0.02) SO42- [mg/l] 213.5 (20.01) 315.9 (29.76) 47.7 (4.34) pH [-] 3.68 (0.01) 3.86 (0.01) 3.54 (0.01) C [% of TS] 39.05 (0.55) 42.40 (0.30) 37.60 (0.60) H [% of TS] 5.80 (0.10) 6.50 (0.05) 5.60 (0.50) N [% of TS] 2.40 (0.10) 1.80 (0.30) 2.75 (0.35) C/N [%TS/%TS] 16.27 (0.91) 23.56 (3.87) 13.67 (1.55) Carb tot [%g/gVS] 34.00 (1.73) 10.72 (0.64) 35.04 (2.21) Carb sol [%g/gVS] 3.66 (0.21) 2.34 (0.16) 4.77 (0.32) Prot [%g/gVS] 13.98 (1.25) 15.07 (0.14) 14.61 (0.17) Lip [%g/gVS] 5.95 (0.54) 5.82 (0.43) 6.09 (0.36) HAc [mg/l] 311.38 (9.40) 2109.79 (57.81) 389.05 (8.95) HPro [mg/l] 9.73 (0.26) 19.21 (0.52) 10.73 (0.30) HBut [mg/l] 2.77 (0.07) 1.89 (0.05) 1.74 (0.05) HIso-but [mg/l] 0.21 (0.03) 0.17 (0.01) 0.20 (0.01) HVal [mg/l] 0.00 0.00 0.00 HIso-val [mg/l] 0.39 (0.01) 1.39 (0.02) 0.15 (0.03)
Organic substrates characterization
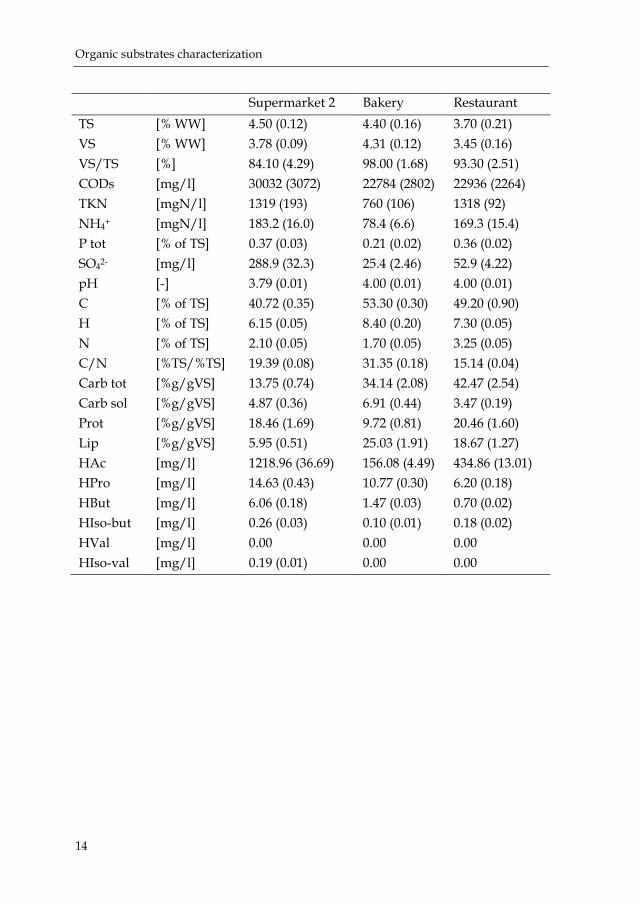
14
Supermarket 2 Bakery Restaurant TS [% WW] 4.50 (0.12) 4.40 (0.16) 3.70 (0.21) VS [% WW] 3.78 (0.09) 4.31 (0.12) 3.45 (0.16) VS/TS [%] 84.10 (4.29) 98.00 (1.68) 93.30 (2.51) CODs [mg/l] 30032 (3072) 22784 (2802) 22936 (2264) TKN [mgN/l] 1319 (193) 760 (106) 1318 (92) NH4+ [mgN/l] 183.2 (16.0) 78.4 (6.6) 169.3 (15.4) P tot [% of TS] 0.37 (0.03) 0.21 (0.02) 0.36 (0.02) SO42- [mg/l] 288.9 (32.3) 25.4 (2.46) 52.9 (4.22) pH [-] 3.79 (0.01) 4.00 (0.01) 4.00 (0.01) C [% of TS] 40.72 (0.35) 53.30 (0.30) 49.20 (0.90) H [% of TS] 6.15 (0.05) 8.40 (0.20) 7.30 (0.05) N [% of TS] 2.10 (0.05) 1.70 (0.05) 3.25 (0.05) C/N [%TS/%TS] 19.39 (0.08) 31.35 (0.18) 15.14 (0.04) Carb tot [%g/gVS] 13.75 (0.74) 34.14 (2.08) 42.47 (2.54) Carb sol [%g/gVS] 4.87 (0.36) 6.91 (0.44) 3.47 (0.19) Prot [%g/gVS] 18.46 (1.69) 9.72 (0.81) 20.46 (1.60) Lip [%g/gVS] 5.95 (0.51) 25.03 (1.91) 18.67 (1.27) HAc [mg/l] 1218.96 (36.69) 156.08 (4.49) 434.86 (13.01) HPro [mg/l] 14.63 (0.43) 10.77 (0.30) 6.20 (0.18) HBut [mg/l] 6.06 (0.18) 1.47 (0.03) 0.70 (0.02) HIso-but [mg/l] 0.26 (0.03) 0.10 (0.01) 0.18 (0.02) HVal [mg/l] 0.00 0.00 0.00 HIso-val [mg/l] 0.19 (0.01) 0.00 0.00

Energetic conversion of OFMSW by anaerobic codigestion with sewage sludge
15
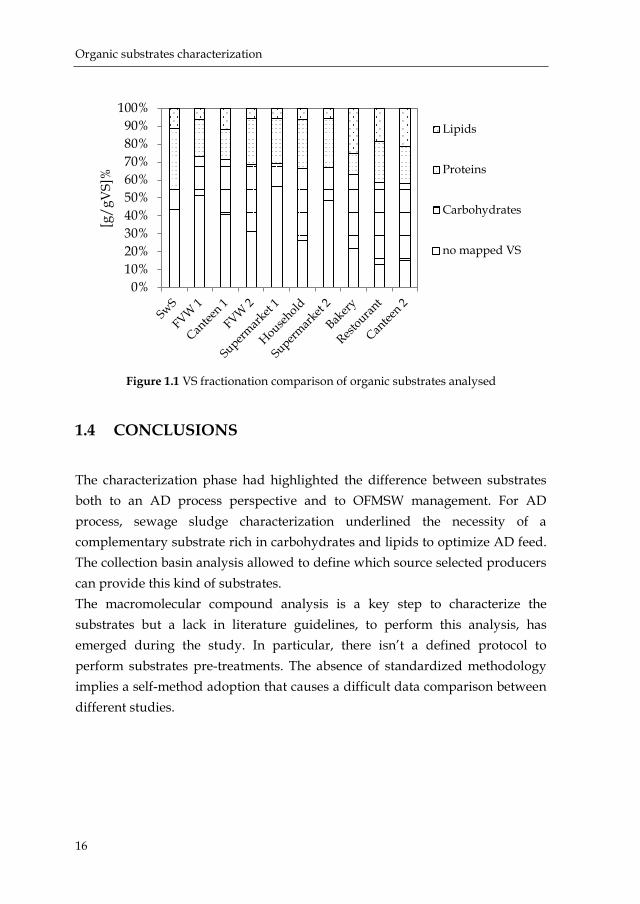
Canteen 2 TS [% WW] 3.00 (0.18) VS [% WW] 2.87 (0.16) VS/TS [%] 95.80 (4.32) CODs [mg/l] 10772 (1475) TKN [mgN/l] 903 (131) NH4+ [mgN/l] 104.8 (9.7) P tot [% of TS] 0.32 (0.03) SO42- [mg/l] 22.8 (2.03) pH [-] 4.10 (0.01) C [% of TS] 56.50 (0.60) H [% of TS] 8.80 (0.209 N [% of TS] 2.80 (0.10) C/N [%TS/%TS] 20.18 (0.94) Carb tot [%g/gVS] 34.24 (2.32) Carb sol [%g/gVS] 8.73 (0.65) Prot [%g/gVS] 17.08 (1.64) Lip [%g/gVS] 21.45 (1.80) HAc [mg/l] 29.95 (0.89) HPro [mg/l] 12.51 (0.33) HBut [mg/l] 0.14 (0.01) HIso-but [mg/l] 0.02 (0.01) HVal [mg/l] 0.00 HIso-val [mg/l] 0.00 VS fractionation comparison, related to macromolecular compounds analysed, is reported in figure 1.1 to visually highlight the different organic characteristics.
Organic substrates characterization
16
Figure 1.1 VS fractionation comparison of organic substrates analysed
1.4 CONCLUSIONS
The characterization phase had highlighted the difference between substrates both to an AD process perspective and to OFMSW management. For AD process, sewage sludge characterization underlined the necessity of a complementary substrate rich in carbohydrates and lipids to optimize AD feed. The collection basin analysis allowed to define which source selected producers can provide this kind of substrates. The macromolecular compound analysis is a key step to characterize the substrates but a lack in literature guidelines, to perform this analysis, has emerged during the study. In particular, there isn’t a defined protocol to perform substrates pre-treatments. The absence of standardized methodology implies a self-method adoption that causes a difficult data comparison between different studies.
0%10%20%30%40%50%60%70%80%90%
100%[g
/gV
S]%
Lipids
Proteins
Carbohydrates
no mapped VS

17
Biochemical methane potential 2tests (BMP)
2.1 INTRODUCTION
The biochemical methane potential test (BMP) allows to determine the methane yield of an organic substrate by monitoring the biomass degradation activity in a lab reactor. BMP tests are influenced by several variables and the lack of international guidelines determines the absence of a clear procedure to apply. A wide literature is present and the last efforts done by the scientific community (Raposo et al., 2011a; Raposo et al., 2011b) enable to set reliable experimentation. The main factors affecting BMP test are linked to the inoculum characteristics (source, storage, activity), the gas measurement system (volumetric or manometric methods), the operational conditions (reactor volume, temperature, mixing system, trial duration), the chemical operational conditions (headspace gas, pH and alkalinity adjustment, mineral medium) and the inoculum to substrate ratio (ISR) choice (Raposo et al. 2011b).
2.2 MATERIAL AND METHODS
2.2.1 EXPERIMENTAL SET-UP AND PROCEDURE
BMP tests were carried out following guidelines proposed by two recent studies (Raposo et al., 2011b; Angelidaki et al., 2009). BMP tests were performed in two experimental phases: in the first one, tests were carried out on SwS and SS-OFMSW mono-substrates and in the second phase on SwS and SS-OFMSW mixture (OFMSW-MIX) in AcoD regime (these tests were named CO-DIG1 and CO-DIG2). In the first experimental session, glass bottles with a working volume of 400ml and headspace volume of 100ml were used. Bottles were

Biochemical methane potential tests (BMP)
18
maintained at mesophilic temperatures (37°C) in a thermostatic bath for 30 days and stirred by mechanical mixing at 40 rpm for 10 seconds every 1 minute. Before starting anaerobic digestion, each bottle headspace was flushed by N2 gas. Methane measurements were performed by a volumetric device (AMPTS II, Bioprocess Control, Sweden) with alkaline solution for biogas washing (figure 2.1).
Figure 2.1 AMPTS II device, Bioprocess Control, Sweden.
No pH and alkalinity adjustments were performed due to high buffer capacity of sewage sludge seed and also to check process behaviour without any chemical interference (Sosnowsky et al. 2008). No any mineral medium was added to the mixture with the hypothesis that the lack in micronutrient and trace elements is offset by the inoculum. Blank controls were conducted to obtain the residual biogas production by inoculum alone. Particle size can affect process kinetics, due to the amount of available specific surface area for microorganism action (Lesteur et al. 2010). Accordingly, OFMSW samples were ground by a mincer, diluted with tap water and shredded by a kitchen mixer obtaining a common optimal ≤ 10mm particle size (Raposo et al., 2011b) in the mixture, in which Total Solids (TS) were maintained below 3÷4.5%TS. Inocula and substrates were stored for 3 days at 4°C before tests. BMP tests were carried out in triplicate. In the second experimental session, glass bottles working volume was increased to 1600 ml with an headspace volume of 400 ml, with the aim to supply significative amounts of substrates to AcoD. The same procedure previously described was followed. The net methane production of organic substrates in BMP test, was obtained detracting the inoculum contribution of the blank control. Methane and biogas yields were referred, together to specific methane production rates, to Standard Temperature and Pressure (STP) conditions. The results reported are expressed as average of three samples.

Energetic conversion of OFMSW by anaerobic codigestion with sewage sludge
19
2.2.2 INOCULUM TO SUBSTRATE RATIO (ISR)
In literature experimental data demonstrated that the ultimate methane yield as well as the methane production rates are dependent on the specific substrates and inoculum (Eskicioglu et al., 2011). Large inoculations volumes ensure high microbial activity, low risk for overloading and low risk of inhibition (Angelidaki and Sanders, 2004). Some researchers (Raposo et al., 2011a) considering that an ISR≥2, on VS basis, has never been reported as inhibitory, suggest this ratio as mandatory for standardized tests. In this study, BMP tests were conducted at a safe ISR of 3 (on VS basis), which was chosen to prevent any inhibitory effect, bound to OFMSW anaerobic digestion. Only for BMP tests on SwS, different ISR (1, 1.5, 2 and 3) were adopted to verify the influence of this parameter on the biomass degradation activity. The inoculum was extracted by the primary mesophilic anaerobic digester by the Udine WWTP, Italy.
2.2.3 ANALYTICAL METHODS
The analytical methods used are the same described in the chapter 1.
2.3 RESULTS&DISCUSSION
2.3.1 INOCULA CHARACTERISTICS
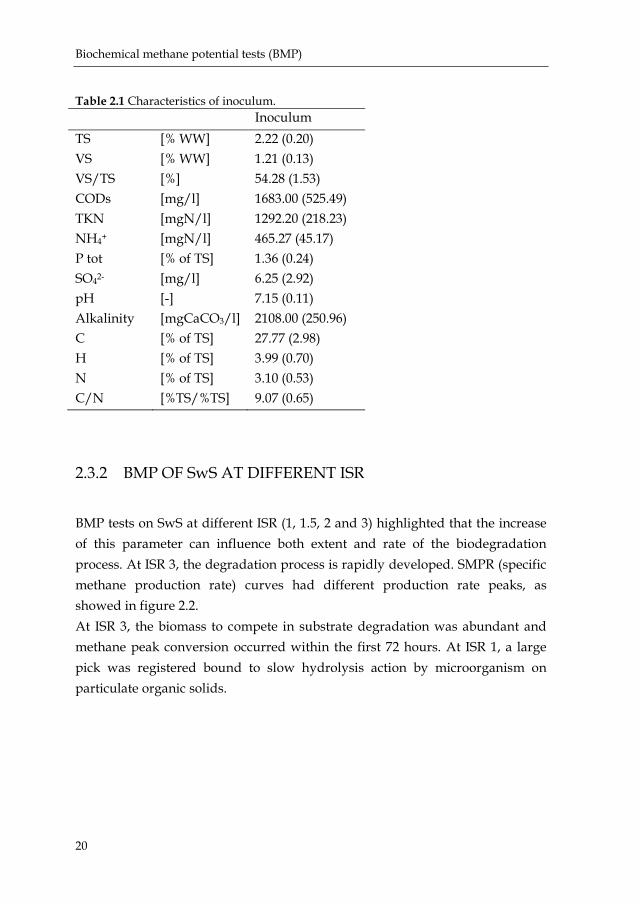
Inoculum characterization was performed for each BMP trial. In table 2.1 the analyzed parameters results are reported as average values of all inocula used. Blank methane production was 84.52±12.98NmlCH4/gVS add.
Biochemical methane potential tests (BMP)
20
Table 2.1 Characteristics of inoculum. Inoculum TS [% WW] 2.22 (0.20) VS [% WW] 1.21 (0.13) VS/TS [%] 54.28 (1.53) CODs [mg/l] 1683.00 (525.49) TKN [mgN/l] 1292.20 (218.23) NH4+ [mgN/l] 465.27 (45.17) P tot [% of TS] 1.36 (0.24) SO42- [mg/l] 6.25 (2.92) pH [-] 7.15 (0.11) Alkalinity [mgCaCO3/l] 2108.00 (250.96) C [% of TS] 27.77 (2.98) H [% of TS] 3.99 (0.70) N [% of TS] 3.10 (0.53) C/N [%TS/%TS] 9.07 (0.65)
2.3.2 BMP OF SwS AT DIFFERENT ISR
BMP tests on SwS at different ISR (1, 1.5, 2 and 3) highlighted that the increase of this parameter can influence both extent and rate of the biodegradation process. At ISR 3, the degradation process is rapidly developed. SMPR (specific methane production rate) curves had different production rate peaks, as showed in figure 2.2. At ISR 3, the biomass to compete in substrate degradation was abundant and methane peak conversion occurred within the first 72 hours. At ISR 1, a large pick was registered bound to slow hydrolysis action by microorganism on particulate organic solids.

Energetic conversion of OFMSW by anaerobic codigestion with sewage sludge
21
Figure 2.2 SMPR curves of SwS BMP tests at different ISR.
2.3.3 BMP OF MONO-SUBSTRATES
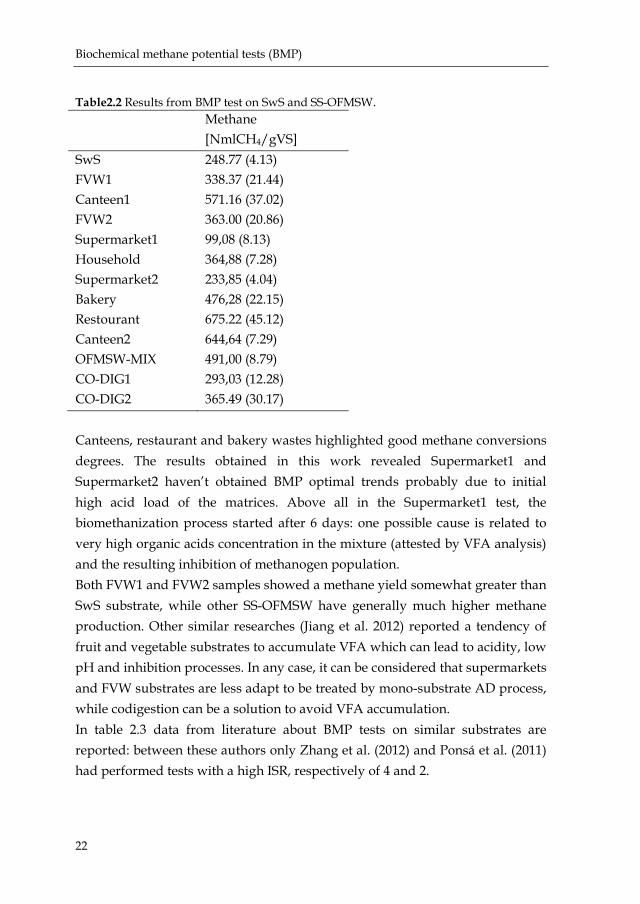
Cumulative methane yields trends are shown in figure 2.3. In table 2.2 results of mono-substrates testes are reported.
Figure 2.3 Cumulative methane yields curves of SS-OFMSW and SwS.
0,0
0,5
1,0
1,5
2,0
2,5
3,0
3,5
0 24 48 72 96 120
SMRP
[Nm
l/gV
S h]
Hours
BLANK
ISR 3
ISR 2
ISR 1.5
ISR 1
0
100
200
300
400
500
600
700
800
0 2 4 6 8 10 12 14 16 18 20 22
Met
hane
yie
lds
[Nm
l/gV
S ad
d]
Days
Supermarket 1
Supermarket 2
SwS
FVW 2
Household
FVW 1
Bakery
Canteen 1
Canteen 2
Restourant
Biochemical methane potential tests (BMP)
22
Table2.2 Results from BMP test on SwS and SS-OFMSW. Methane [NmlCH4/gVS] SwS 248.77 (4.13) FVW1 338.37 (21.44) Canteen1 571.16 (37.02) FVW2 363.00 (20.86) Supermarket1 99,08 (8.13) Household 364,88 (7.28) Supermarket2 233,85 (4.04) Bakery 476,28 (22.15) Restourant 675.22 (45.12) Canteen2 644,64 (7.29) OFMSW-MIX 491,00 (8.79) CO-DIG1 293,03 (12.28) CO-DIG2 365.49 (30.17) Canteens, restaurant and bakery wastes highlighted good methane conversions degrees. The results obtained in this work revealed Supermarket1 and Supermarket2 haven’t obtained BMP optimal trends probably due to initial high acid load of the matrices. Above all in the Supermarket1 test, the biomethanization process started after 6 days: one possible cause is related to very high organic acids concentration in the mixture (attested by VFA analysis) and the resulting inhibition of methanogen population. Both FVW1 and FVW2 samples showed a methane yield somewhat greater than SwS substrate, while other SS-OFMSW have generally much higher methane production. Other similar researches (Jiang et al. 2012) reported a tendency of fruit and vegetable substrates to accumulate VFA which can lead to acidity, low pH and inhibition processes. In any case, it can be considered that supermarkets and FVW substrates are less adapt to be treated by mono-substrate AD process, while codigestion can be a solution to avoid VFA accumulation. In table 2.3 data from literature about BMP tests on similar substrates are reported: between these authors only Zhang et al. (2012) and Ponsá et al. (2011) had performed tests with a high ISR, respectively of 4 and 2.
Energetic conversion of OFMSW by anaerobic codigestion with sewage sludge
23
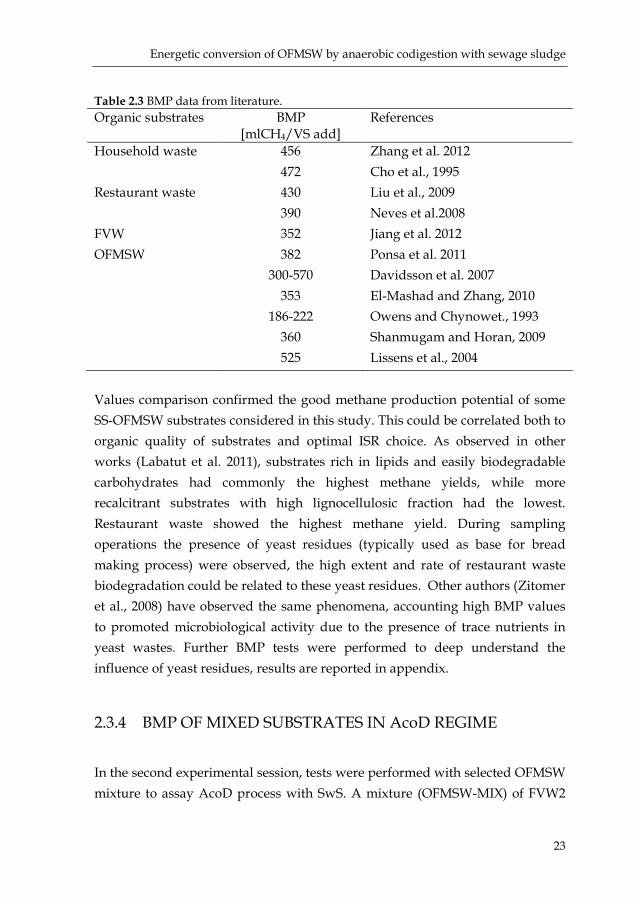
Table 2.3 BMP data from literature. Organic substrates BMP
[mlCH4/VS add] References
Household waste 456 Zhang et al. 2012 472 Cho et al., 1995 Restaurant waste 430 Liu et al., 2009 390 Neves et al.2008 FVW 352 Jiang et al. 2012 OFMSW 382 Ponsa et al. 2011 300-570 Davidsson et al. 2007 353 El-Mashad and Zhang, 2010 186-222 Owens and Chynowet., 1993 360 Shanmugam and Horan, 2009 525 Lissens et al., 2004 Values comparison confirmed the good methane production potential of some SS-OFMSW substrates considered in this study. This could be correlated both to organic quality of substrates and optimal ISR choice. As observed in other works (Labatut et al. 2011), substrates rich in lipids and easily biodegradable carbohydrates had commonly the highest methane yields, while more recalcitrant substrates with high lignocellulosic fraction had the lowest. Restaurant waste showed the highest methane yield. During sampling operations the presence of yeast residues (typically used as base for bread making process) were observed, the high extent and rate of restaurant waste biodegradation could be related to these yeast residues. Other authors (Zitomer et al., 2008) have observed the same phenomena, accounting high BMP values to promoted microbiological activity due to the presence of trace nutrients in yeast wastes. Further BMP tests were performed to deep understand the influence of yeast residues, results are reported in appendix.
2.3.4 BMP OF MIXED SUBSTRATES IN AcoD REGIME
In the second experimental session, tests were performed with selected OFMSW mixture to assay AcoD process with SwS. A mixture (OFMSW-MIX) of FVW2

Biochemical methane potential tests (BMP)
24
and restaurant organic substrates was blended in ratio 1:1 (w/w) and used in AcoD tests. The choice of OFMSW-MIX substrate components was based both on chemical-physical substrate characteristics and on waste management perspective, considering the substrates availability in sufficient quantities near the WWTP for an AcoD upgrade. The first test named CO-DIG1 had an OFMSW-MIX:SwS ratio of 0,23 gVS/gVS. The criteria to select the codigestion ratio CO-DIG1 followed suggestions given for a typical ratio reported in literature (Bolzonella et al., 2006) for AcoD in WWTP (10% of OFMSW in AD supply). A second test (CO-DIG2) was carried out with a ratio of 2,09 gVS/gVS. CO-DIG2 ratio is linked to the maximum additional treatment capacity for the anaerobic digester considered in this study (50% of OFMSW added to supply feed). C/N ratio of CO-DIG1 and CO-DIG2 substrates increased, compared to SwS, respectively of 4.6% and 25.3%. The C/N ratio is a key parameter to understand the nutrient balance of AD supply, in this study the C/N ratio improvement was within the range 6÷15.4, a typical range as reported by other studies for OFMSW addition in SwS digestion (Iacovidou et al., 2012). In literature there are only few studies regarding batch AcoD in similar test conditions: Sosnowski et al. (2008) in AcoD regime with sewage sludge 75%vol. and OFMSW 25%vol. had registered a 38% methane yield increase respect sewage sludge only. Kim et al. (2011), had conducted test on OFMSW from kitchen residues and thickened sludge in a VS mixing ratio 40:60 obtaining a BMP of 240 mlCH4/gVSadd. Li et al. (2011) observed that AcoD of waste activated sludge with synthetic kitchen waste enhanced methane production from 117±2.02 mL/gVS to 324±13.7 mL/gVS. BMP values for CO-DIG1 and CO-DIG2 are reported in table 2.2. CO-DIG1 and CO-DIG2 have highlighted an increase in methane production of 18% and 47% respectively, compared to SwS. Methane yields curves were reported in figure 2.4. Only a minor synergistic effect can be observed in CO-DIG1 test on methane production, where a little increase (+6.9%) was registered respect absolute quantity calculated from BMP test results on single substrates.

Energetic conversion of OFMSW by anaerobic codigestion with sewage sludge
25
Figure 2.4 Cumulative methane yields curves of mixture: OFMSW-MIX, CO-DIG1 and CO-DIG2.
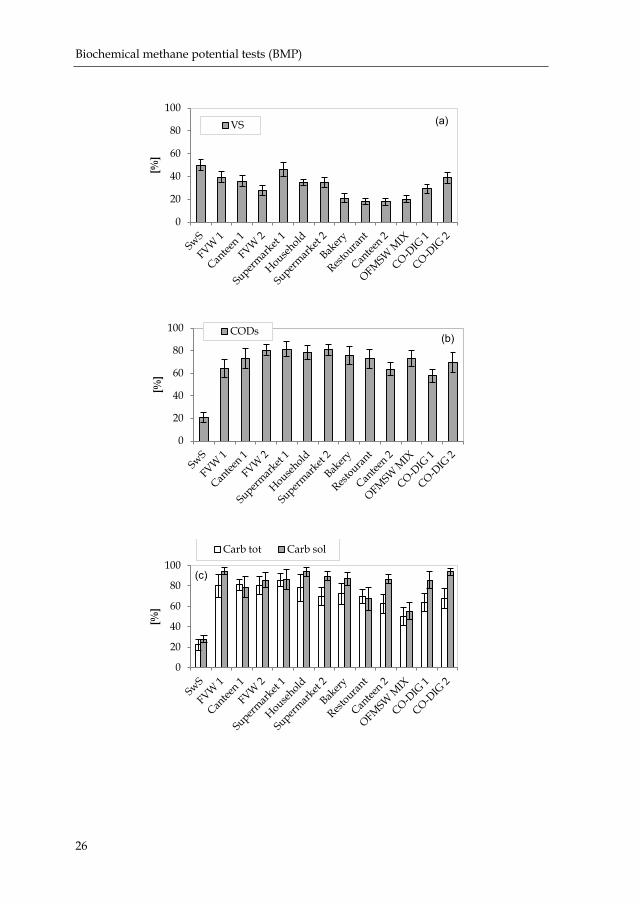
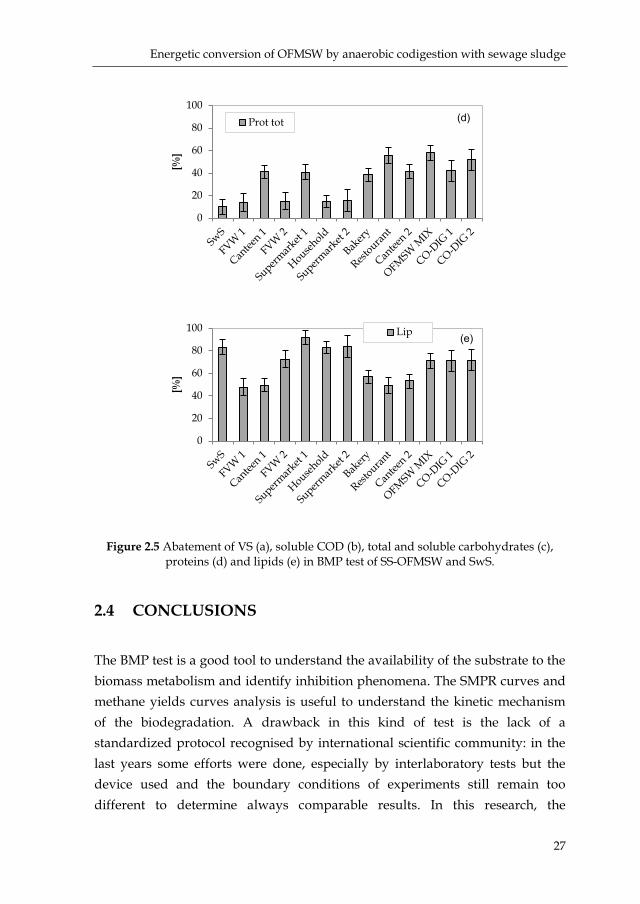
2.3.5 BMP ANALYTICAL PARAMETERS RESULTS
In the BMP samples analyzed, the final sludge concentration was between 2 and 2.4%TS. With an average VS removal efficiency of 33%, the figure 2.5a reports the VS decrease in each trial. A good abatement in soluble COD was registered (Fig.2.5b) with an average value of 69%. Total and soluble carbohydrates (Fig.2.5c) were consumed in AD process with an average percentage respectively of 74% and 84%, while breakdown of total proteins concentration reach about of 40% on average (Fig.2.5d). Lipids percent removal was near 61% (Fig.2.5e). Final alkalinity in all samples ranged from 2047 to 2949 mgCaCO3/l and pH from 7,27 to 7,96. Final SO42- concentrations were included in the range 5÷21mg/l with an average abatement of 70%, due to sulfate reducing bacteria metabolism action.
0
100
200
300
400
500
600
0 2 4 6 8 10 12 14 16 18 20 22 24 26 28 30
Met
hane
yie
lds
[Nm
l/gV
S ad
d]
Days
SwS
CO-DIG 1
CO-DIG 2
OFMSWMIX
Biochemical methane potential tests (BMP)
26
0
20
40
60
80
100
[%]
VS (a)
0
20
40
60
80
100
[%]
CODs(b)
0
20
40
60
80
100
[%]
Carb tot Carb sol
(c)
Energetic conversion of OFMSW by anaerobic codigestion with sewage sludge
27
Figure 2.5 Abatement of VS (a), soluble COD (b), total and soluble carbohydrates (c), proteins (d) and lipids (e) in BMP test of SS-OFMSW and SwS.
2.4 CONCLUSIONS
The BMP test is a good tool to understand the availability of the substrate to the biomass metabolism and identify inhibition phenomena. The SMPR curves and methane yields curves analysis is useful to understand the kinetic mechanism of the biodegradation. A drawback in this kind of test is the lack of a standardized protocol recognised by international scientific community: in the last years some efforts were done, especially by interlaboratory tests but the device used and the boundary conditions of experiments still remain too different to determine always comparable results. In this research, the
0
20
40
60
80
100
[%]
Prot tot (d)
0
20
40
60
80
100
[%]
Lip (e)
Biochemical methane potential tests (BMP)
28
experimental conditions during trials were fixed in terms of ISR, measurement device, inoculum source, temperature, mixing, no mineral medium or trace elements additions. BMP values of different OFMSW substrates from the collection basin, had allowed to identify the best substrates to consider in the AcoD process.
29
Pilot plant test 3
3.1 INTRODUCTION
Pilot plant tests are performed to conduct processes in a comparable scale to real reactors. In this study, the aim was to reproduce in the pilot plant, the WWTP AD reactor behaviour and test the up-grade to codigestion by increasing the organic loading conditions. These types of trials in CSTR regime allows to stress biomass and verify the response, obtaining reliable result for the process application to full-scale reactors.
3.2 MATERIAL AND METHODS
3.2.1 PILOT PLANT CONFIGURATION
The pilot plant is designed to implement the AD process in a 1:1000 scale respect the AD existing unit in Udine WWTP. The pilot plant is formed by 3 sections:
- Substrates pre-treatment; - AD unit; - Biogas line.
3.2.1.1 Substrates pre-treatment
The substrates pre-treatment section has to guarantee the optimal size level of the incoming material. The shredding tank is designed with a volume able to contain the substrate load to fill the feeding tank. Inside the shredding tank a moving bulkhead allows to create the optimal free surface height for the shredding circuit. In the shredding circuit, a pump sends the substrates mixture to a perforated plate shredder: the substrate mixture is recirculated to achieve

Pilot plant test
30
the optimal material size. From the shredding tank, a pipe allows to direct the mixture to the feeding tank. With the aim of define the correct substrates amounts required, the piping lines of the circuit volumes were considered and calculated as 48 liters. In table 3.1 technical data ara listed. In figure 3.1 a photo of the pre-treatment section is reported. Shredding times were defined in function of the material size: they ranged from 10 to 30 minutes. During experimentation a 5mm filtering mesh was inserted in the shredding circuit to intercept fibrous materials (abundant in sewage sludge) to protect the downstream pumps of the pilot plant.
Table 3.1 Pre-treatment section technical data. Section unit Shredding tank Total volume
540 Liters L 1,5m x W 0,6m x H 0,6m
Partial volume with moving bulkhead inserted
150 Liters L 0,5m x W 0,5m x 0,6m
Shredder n° holes 16 (ø 14mm) Power 2,2 kW
Figure 3.1 Substrates pre-tratment section.
3.2.1.2 AD unit
The AD unit is formed by: - Feeding tank; - Loading pump; - Internal recirculation pump and heat exchanger; - Anaerobic digester; - External recirculation pump; - Discharging pump.

Energetic conversion of OFMSW by anaerobic codigestion with sewage sludge
31
3.2.1.2.1 Feeding tank
The feeding tank has a cylindrical shape and is equipped with a vertical mixing system in order to avoid material sedimentation. A pipe, connected to the tank bottom, allows the connection to the loading pump. In table 3.2 technical data are listed. In figure 3.2 a photo of the feeding tank is reported. Table 3.2 Pre-treatment section technical data.
Section unit Feeding tank
Total volume
294 Liters ø 0,19m x H 2,4m
Mixer Power 0,55 kW
Figure 3.2 Feeding tank.
3.2.1.2.2 Loading pump
The loading pump it’s a monoscrew pump able to dose flow in the range 40÷70 ml/min of substrate necessary to perform the experimental phases. During the experimentation, the strong wear determined by sands and the obstruction due to the accumulation of fibrous materials present in the substrate, led to frequent rotor and stator replacements of the loading pump. This was partially solved by the adoption of the filtering mesh previously described. The incoming substrate is pumped into the load pipe of the internal recirculation pump, in order to convey the charge to the heat exchanger.
3.2.1.2.3 Internal recirculation pump and heat exchanger
The internal circulation pump sends to the heat exchanger an amount equal to 150 l/h of sludge from AD reactor together with the incoming substrate. This flow rate was chosen in order to maintain the correct process temperature of 37°C. The double-pipe heat exchanger receives hot water from a boiler with a maximum temperature of 45°C, controlled by the temperature regulation
Pilot plant test
32
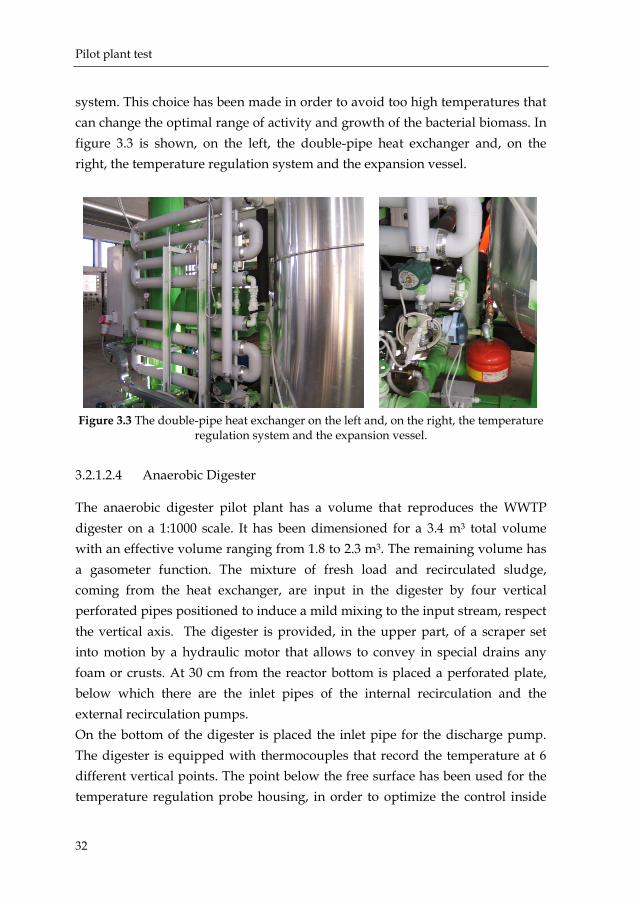
system. This choice has been made in order to avoid too high temperatures that can change the optimal range of activity and growth of the bacterial biomass. In figure 3.3 is shown, on the left, the double-pipe heat exchanger and, on the right, the temperature regulation system and the expansion vessel.
Figure 3.3 The double-pipe heat exchanger on the left and, on the right, the temperature
regulation system and the expansion vessel.
3.2.1.2.4 Anaerobic Digester
The anaerobic digester pilot plant has a volume that reproduces the WWTP digester on a 1:1000 scale. It has been dimensioned for a 3.4 m3 total volume with an effective volume ranging from 1.8 to 2.3 m3. The remaining volume has a gasometer function. The mixture of fresh load and recirculated sludge, coming from the heat exchanger, are input in the digester by four vertical perforated pipes positioned to induce a mild mixing to the input stream, respect the vertical axis. The digester is provided, in the upper part, of a scraper set into motion by a hydraulic motor that allows to convey in special drains any foam or crusts. At 30 cm from the reactor bottom is placed a perforated plate, below which there are the inlet pipes of the internal recirculation and the external recirculation pumps. On the bottom of the digester is placed the inlet pipe for the discharge pump. The digester is equipped with thermocouples that record the temperature at 6 different vertical points. The point below the free surface has been used for the temperature regulation probe housing, in order to optimize the control inside

Energetic conversion of OFMSW by anaerobic codigestion with sewage sludge
33
the digester. The reactor is also equipped with 6 lateral taps to withdraw samples and control biomass concentration. In figure 3.4 the anaerobic digester is shown, on the right there are the scrapers internal detail and the piping extraction system.
Figure 3.4 On the left the anaerobic digester and, on the right, the scrapers internal detail
and the piping extraction system.
3.2.1.2.5 External recirculation pump
The external recirculation pump, installed during the start-up phase, has allowed to increase the W/m3 dedicated to digester mixing. The DVTT (Digester Volume Turnover Time) was decreased to 4 hours with a recirculation rate of 450 liters per hour. This up-grade was performed to limit the internal temperature stratification phenomena and the develop of dead volumes.
3.2.1.2.6 Discharging pump
The discharging pump is, as the loading pump, a monoscrew pump. The digestate stream is direct in the discharging foams pipe. This pipe is U-bend pipe to avoid the biogas leakage.

Pilot plant test
34
3.2.1.3 Biogas line
The biogas flow is sent to the gas line, which is composed of: - water condensation column; - silica gel adsorption column; - activated carbon adsorption column; - flow meter and non-return valve.
3.2.1.3.1 Water condensation column
The water condensation column is a chamber surrounded by a cold water jacket. The contact between gas at 37°C and cold chamber walls allows to condense the water vapor, which is discharged manually through a bottom chamber valve.
3.2.1.3.2 Silica gel adsorption column
The silica gel eliminates the residual biogas humidity from the water condensate column downstream. The adsorption column design was carried out assuming the silica gel renewal once a month with a 5 liters working volume.
3.2.1.3.3 Activated carbon adsorption column
The activated carbons adsorb acid gases such as H2S in order to protect the downstream equipment. The column volume was designed to contain 1 kg of active carbon to cover one year of biogas pilot plant work, under process conditions considered in the project.
3.2.1.3.4 Flow meter and non-return valve
The biogas production is monitored by a flow meter. A non-return valve is placed downstream of the flow meter to maintain the gas line at 20mbar pressure. In figure 3.5 are shown the pictures relative, on the left, to the biogas line columns and on the right of the flow meter.

Energetic conversion of OFMSW by anaerobic codigestion with sewage sludge
35
Figure 3.5 The biogas line columns and, on the right, the flow meter.
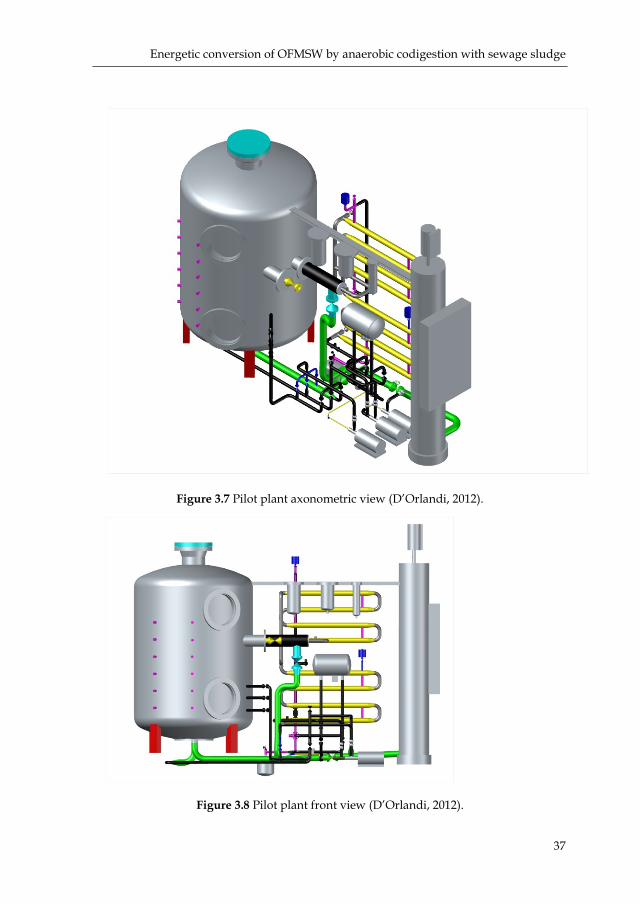
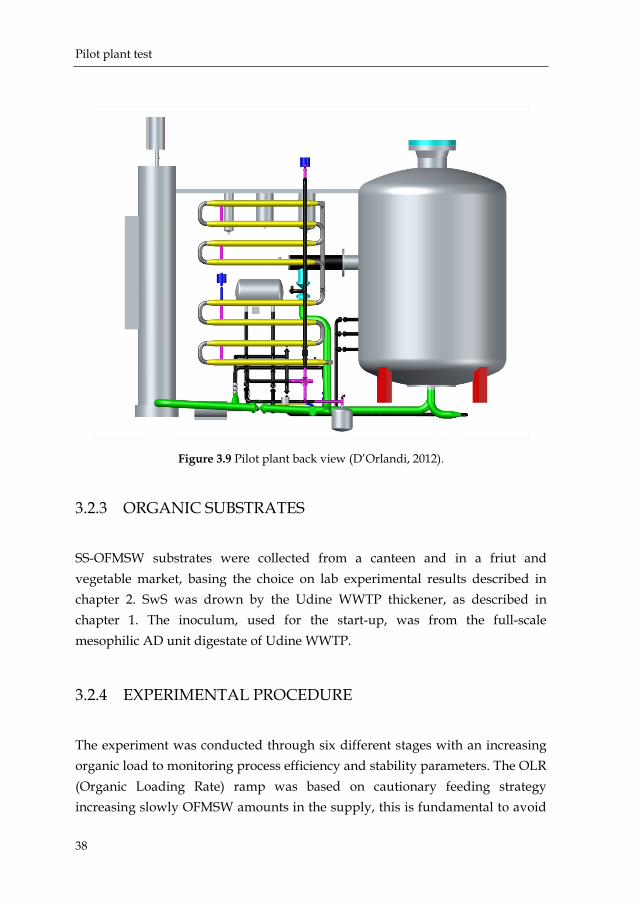
3.2.1.4 Pilot plant technical drownings
In figure 3.6 is reported the pilot plant process flow diagram without the substrate pre-tratment section and in figure 3.7 the axonometric view is depicted. In figure 3.8 and in figure 3.9 the pilot plant technical drowning of, respectively the front and the back view are shown.
3.2.2 ANALYTICAL METHODS
The analytical methods used are the same described in the chapter 1. Methane, carbon dioxide and hydrogen sulfide content in the biogas were mesuered according to ISO 6974-6:2002/COR1:2003 method. Potassium, lead, cadmium, zinc, nickel and total chromium analysis were performed using EPA 2015A 2007 and EPA 6020A 2007. Mercury and its compounds were measured by CNR IRSA Q 64 1985 and CNR IRSA 3080 B1 Q 100:1994 methods. FOS parameter, for volatile organic acids as mgHAc/l, and TAC parameter, for alkaline buffer capacity as mg CaCO3/l, were determined following HachLange tritation procedure. The analysis were performed 3 times per week.

Pilot plant test
36
LEG
END
: (1)
AD
reac
tor
(2) f
eedi
ng ta
nk (3
) ele
ctri
cal p
anel
(4) b
oile
r (5)
hea
t exc
hang
er (6
) exp
ansi
on v
esse
l (7
) fe
edin
g pu
mp
(8)
reci
rcul
atio
n pu
mp
(9) d
isch
argi
ng p
ump
(10)
boi
ler p
ump
(11)
mix
ing
mot
or (1
2) w
ater
con
dens
atio
n co
lum
n (1
3) s
ilica
gel
ads
orpt
ion
colu
mn
(14)
act
ivat
ed c
arbo
n a
dsor
ptio
n co
lum
n.
Figu
re 3
.6 P
ilot p
lant
pro
cess
flow
dia
gram
Energetic conversion of OFMSW by anaerobic codigestion with sewage sludge
37
Figure 3.7 Pilot plant axonometric view (D’Orlandi, 2012).
Figure 3.8 Pilot plant front view (D’Orlandi, 2012).
Pilot plant test
38
Figure 3.9 Pilot plant back view (D’Orlandi, 2012).
3.2.3 ORGANIC SUBSTRATES
SS-OFMSW substrates were collected from a canteen and in a friut and vegetable market, basing the choice on lab experimental results described in chapter 2. SwS was drown by the Udine WWTP thickener, as described in chapter 1. The inoculum, used for the start-up, was from the full-scale mesophilic AD unit digestate of Udine WWTP.
3.2.4 EXPERIMENTAL PROCEDURE
The experiment was conducted through six different stages with an increasing organic load to monitoring process efficiency and stability parameters. The OLR (Organic Loading Rate) ramp was based on cautionary feeding strategy increasing slowly OFMSW amounts in the supply, this is fundamental to avoid
Energetic conversion of OFMSW by anaerobic codigestion with sewage sludge
39
overload phenomena as reported by Cavinato et al. (2013). The AD reactor was operated under mesophilic conditions (37-38°C) and constantly mixed. The feeding and discharging operations were continuously carried out by pumps. The operation phase was 1 or 2 times the related HRT, phase 5 and 6 was conducted without achieve a complete HRT to test the biomass by a rapidly OLR increase. In the start-up phase pilot plant digester was inoculated with 1.8m3 of biomass. After the start-up, stable conditions were reached by the sewage sludge digestion in phase 1 applying an OLR of 0.80 KgVS/m3d with a HRT (Hydraulic Retention Time) of 24.3 days, to reproduce the full scale AD unit operational conditions. At the end of phase 1, the system was switched to AcoD increasing OLR and decreasing HRT to 20 days. The SS-OFMSW substrates were mixed, in equal proportions respect to the collection source, and the SS-OFMSW mixture amount was increased in the feeding mixture during the experimental phases: from 0.9 kg per day per m3 of active reactor volume in the phase 2, to 17Kg/m3d in phase 6. Table 3.3 reports substrates percentages (weight based) in the feed during the experimental phases. In order to maintain the substrate in the fixed range in terms of the total solids concentration (to achieve the correct OLR increase and to not exceed the wet regime), treated wastewater was used to dilute and create the proper mixture. In Figure 3.10 the graph shows the OLR values applied: the bars indicate the minimum and maximum parameter value registered during each phase. In some phases, strong parameter variability was registered due to the sewage sludge daily variation, characterized by uncontrolled solids content, which has altered the final mixture properties of the pilot plant feed. Phase 3 has been particularly affected by this problem. OLR ranged from 0.80 KgVS/m3d, in the first phase, up to 3.20 KgVS/m3d in the last phase, in which the maximum loading conditions for the full scale AD unit were tested. (Figure 3.10). Table 3.3 Substrates percentages (weight based) in the feed during the experimental phases. Phase 1 2 3 4 5 6 SwS 100% 90,9% 90,9% 66,7% 66,7% 41,3% SS-OFMSW - 1,5% 3,0% 11,1% 16,7% 29,3% Treated waste water - 7,6% 6,1% 22,2% 16,6% 29,4%

Pilot plant test
40
Figure 3.10 OLR values during the experimental phases, bars indicates parameter
variability registerd in each phase.
3.3 RESULTS&DISCUSSION
The experimental pilot plant test was characterized by intensive parameters monitoring in order to control the process and establish its efficiency. The physical-chemical parameters were measured both of input and output process substrates. A different set of analysis was performed in the substrate process withdrawn from the middle lateral digester taps (Table 3.4). Table 3.4 Chemical-physical parameters analysed in each sample point. Sample point Feeding tank AD reactor Discharging pump Parameters pH pH pH TS,VS Alkalinity TS,VS Soluble COD FOS/TAC Soluble COD TKN VFA TKN Ammonia Ammonia Sulphates Sulphates Phosphorus Phosphorus C,N Heavy metals
0,80 1,10 0,94 1,23
1,74
3,20
0,00
0,50
1,00
1,50
2,00
2,50
3,00
3,50
1 2 3 4 5 6
OLR
[KgV
S/m
3d]
Phase

Energetic conversion of OFMSW by anaerobic codigestion with sewage sludge
41
In the following sections, monitoring results are illustrated. Graphs highlight average parameter value in each phase and the standard deviation.
3.3.1 TOTAL AND VOLATILE SOLIDS
The TS content was measured in each sample point. TS concentration ranged in the feeding mixture from 33mg/l to 75mg/l from phase 1 to phase 6 respectively (figure 3.11). Due to the high TS concentration variability of thickened sludge, as previously introduced, the TS feeding mixture concentration control was difficult in some phases: in particular phase 3 has been particularly affected by this problem. In the digestate, total solids concentrations were measured in a variable range between 20 and 40mg/l, as shown in figure 3.11. The SS-OFMSW biodegradability contribution is highlighted in figure 3.12 by VS data. The VS contraction has tripled compared from phase 1 to phase 6 in the extent of 20 to 64mg/l. The VS output values were registered in a range between 10 and 20mg/l during all phases, this underlines the good adaptability of the biomass to treat more concentrated loads, as tested in phase 5 and 6 where VS concentrations in substrate input were 35 and 65mg/l respectively.
Figure 3.11 TS values during the experimental phases, in input substrate and digestate.
01020304050607080
1 2 3 4 5 6
TS [m
g/L]
Phase
TS in TS out

Pilot plant test
42
Figure 3.12 VS values during the experimental phases, in input substrate and digestate.
The VS/TS ratio increased from 61% of SwS digestion phase, up to 85% in phase 6 (figure 3.13). The linear interpolation on the average input shows the trend of increasing VS/TS ratio, highlighting the SS-OFMSW greater contribution to mixture biodegradability, whose typical TS/VS values is generally close to 90%, as reported in chapter 1.
Figure 3.13 VS/TS ratio values in input substrate and digestate.
Data collected (table 3.5) from AD reactor sample point (tap n°3) analysis showed that TS were about 4mg/l reaching a minimum during the difficult management of phase 3.
01020304050607080
1 2 3 4 5 6
VS
[mg/
L]
Phase
VS in VS out
60,9 66,8 68,6 73,8 81,4
85,4
0102030405060708090
100
1 2 3 4 5 6
VS/
TS [%
]
Phase VS/TS in VS/TS out
Energetic conversion of OFMSW by anaerobic codigestion with sewage sludge
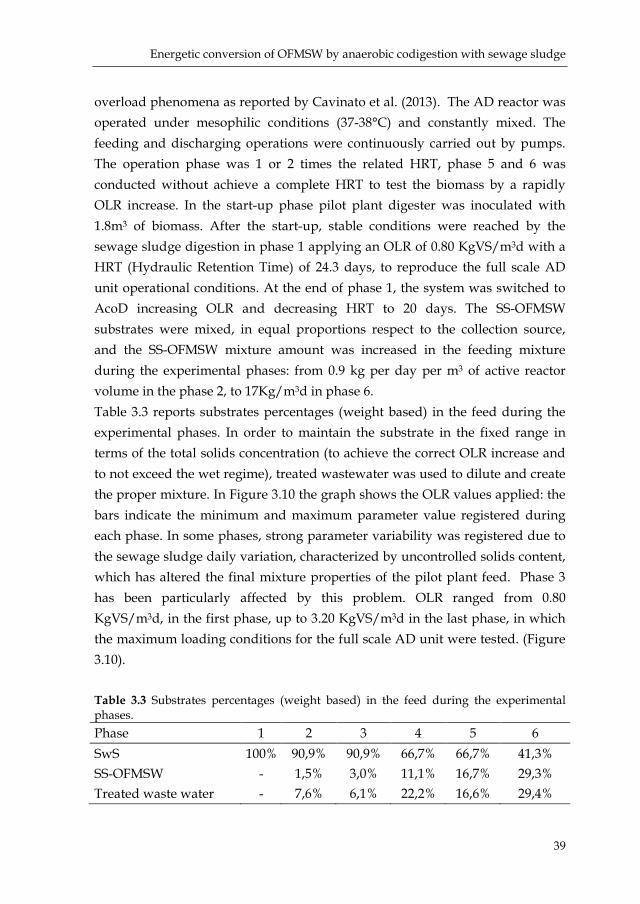
43
These data underlined the substrate dilution in the central section of the active volume due to stratification phenomena. These data were confirmed by two samples extra campaigns performed, in which each lateral digester tap was sampled. Results are reported in figure 3.14: the stratification phenomena were limited to the 40 cm upper the reactor bottom and didn’t influence negatively the process thanks to the high DDVT time imposed. Table 3.5 TS, VS and TS/VS ratio values measured in each phase in relation to the sample point.
Sample point Phase Feeding tank 1 2 3 4 5 6 TS [mg/l] 33,2 (9,4) 33,4 (8,8) 28,1 (9,9) 38,3 (12,7) 45,5 (6,7) 75,0 (4,1) VS [mg/l] 20,0 (5,4) 22,1 (5,0) 18,7 (5,3) 28,3 (9,5) 37,1 (6,3) 64,1 (4,0) VS/TS [%] 60,9 (6,2) 66,8 (5,6) 68,6 (8,7) 73,8 (1,0) 81,4 (1,8) 85,4 (1,0) Disharging pump TS [mg/l] 28,6 (9,1) 32,9 (9,0) 28,0 (4,8) 29,7 (2,9) 24,5 (0,5) 35,0 (3,3) VS [mg/l] 15,2 (5,0) 17,9 (2,7) 15,6 (2,4) 15,2 (1,0) 13,7 (0,8) 21,0 (3,5) VS/TS [%] 53,2 (2,9) 55,7 (5,1) 55,7 (5,1) 51,4 (1,7) 56,1 (2,1) 59,9 (1,5) AD reactor TS [mg/l] 4,3 (1,8) 3,2 (0,8) 2,7 (0,5) 3,0 (0,3) 4,5 (0,5) 4,0 (0,5) VS [mg/l] 2,5 (1,0) 1,8 (0,5) 1,4 (0,3) 1,2 (0,1) 2,1 (0,3) 1,9 (0,3) VS/TS [%] 58,9 (2,3) 58,0 (1,9) 52,8 (4,3) 39,9 (2,7) 46,5 (3,1) 48,6 (2,3)
Figure 3.14 TS values registered in the extra sample campaigns in each lateral digester
tap and in the discharge.
0 10 20 30 40 50
TAP 1TAP 2TAP 3TAP 4TAP 5
Discharge
TS [mg/l]
1st campaign 2nd campaign

Pilot plant test
44
The VS reduction registered in phase 1 was 33%, similar to full-scale AD unit performance. In phase 2 a little decrease was registered, but in phase 3 the AcoD regime effect is visible: the VS breakdown value was 41,3% and increased in relation to OLR increase until reaching 67,3% in phase 6 (figure 3.15). This indicates that the biomass metabolism, in conditions of readily biodegradable substrate availability, is stimulated increasing the conversion efficiency. Similar results are reported in literature (Caffaz et al., 2008; Capela et al., 2008), Liu et al. (2012b) shown a VS reduction rate above 60% (from 61.7÷69.9) increasing OLR from 1.2 to 8 KgVS/m3d, using as feed substrate a mixture composed of 50% food waste, 25% FVW and 25 of WAS.
Figure 3.15 VS reduction values in each experimental phase.
3.3.2 TOTAL AND SOLUBLE COD
Total and soluble COD was measured in feeding substrate and in digestate (table 3.6). The total COD concentration increased of 53% from phase 1 to phase 6, with abtment percentages comprised between 18 and 48%. Soluble COD parameter was measured on 0.45μm filtered sample, it allows to identify the ready biodegradable substrate fraction. Figure 3.16 shows the concentration trend of this parameter in each phase and reduction by the AD process. The values ranged from 2220mg/l in phase 1,
33,0 28,8 41,3
46,4
63,0 67,3
0
25
50
75
100
1 2 3 4 5 6
[%]
Phase
η VS

Energetic conversion of OFMSW by anaerobic codigestion with sewage sludge
45
typical of sewage sludge, up to 28530mg/l in phase 6. The figure 3.16 highlights the remarkable increase of the biodegradable load directly available in the bacterial metabolism, thanks to OFMSW addition. In the AcoD regime, the CODs reduction percentage is comprised between 67 to 95%, confirming the biomass degradation capability at higher loadings.
Table 3.6 COD values measured in each phase in relation to the sample point. Sample point Phase Feeding tank 1 2 3 4 5 6 CODtot [mg/gTS] 936,7
(231,1) 1104
(205,6) 1168,6 (233,2)
1090,5 (156,0)
1217,0 (315,4)
1469,3 (298,6)
CODs [mg/l] 2220 (1082)
2767 (1224)
3939 (1928)
7210 (1238)
10319 (2126)
28530 (1200)
Disharging pump CODtot [mg/gTS] 761,9
(97,8) 746,9
(200,2) 950,4
(205,9) 832,1
(190,5) 735,4
(131,9) 744,9
(150,5) CODs [mg/l] 912
(340) 918
(266) 1267 (584)
1223 (182)
1320 (206)
1435 (190)
Figure 3.16 CODs values during the experimental phases, in input substrate and
digestate.
0
20
40
60
80
100
0
5000
10000
15000
20000
25000
30000
1 2 3 4 5 6
[%]
CO
Ds
[mg/
L]
Phase CODs in CODs out COD reduction

Pilot plant test
46
3.3.3 TKN AND AMMONIA
Nitrogen rich organic substrates can induce high concentrations of ammonia in the AD process causing biomass inhibition phenomena. Moreover it’s essential to know ammonia concentration in the outflow to properly size the post process treatments or to estimate the supernatant impact on the wastewater treatment line inside WWTP. Ammonia inhibition usually cause methane production rate decrease and VFA intermediates increase: ammonia levels in the range 200÷1000mgNH4-N have no antagonistic effect, while inhibition phenomena are reported from 1500 to 3000 mgNH4-N/l (especially at higher pH values) and a complete inhibition, at any pH, above 3000 mgNH4-N/l (Rajagopal et al., 2013). During the experimentation, ammonia levels were measured in the soluble phase of input and output process substrates (Table 3.7). As it can be seen from Figure 3.17, in the input substrate the concentration varied between 120 and 300 mgNH4+/l.
Figure 3.17 Ammonia values during the experimental phases, in input substrate and
digestate.
Digestate concentration values were generally above 450 mgNH4+/l with an increasing trend along phases until the value of 618 mgNH4+/l in phase 6. It’s possible to observe that the organic nitrogen of the feeding substrates was metabolized by biomass producing ammonia but the levels were maintained in
0100200300400500600700800
1 2 3 4 5 6
Am
mon
ia [m
gNH
4+ /l]
Phase
NH4 in NH4 out

Energetic conversion of OFMSW by anaerobic codigestion with sewage sludge
47
a safe range for process stability. The average TKN in each phase is reported in table 3.7: in same phases, outflow higher values, respect incoming substrate, were measured probably due to lab technical problems. Consequently, TKN recovery percentages, taking in account precipitation losses, are difficult to estimate.
Table 3.7 Ammonia values measured in each phase in relation to the sample point.
Sample point Phase Feeding tank 1 2 3 4 5 6
NH4+ [mg/l] 229(116) 157 (63) 183 (65) 127 (35) 156 (12) 278 (15) TKN [mg/l] 1254(434) 1205(260) 1147(361) 1460(191) 1939(139) 2947(180)
Disharging pump NH4+ [mg/l] 522(130) 488 (33) 458 (104) 517 (88) 582 (43) 618 (41) TKN [mg/l] 1420(379) 1597(347) 1590(160) 1455(67) 1431 (243) 1620 (135)
3.3.4 C,N
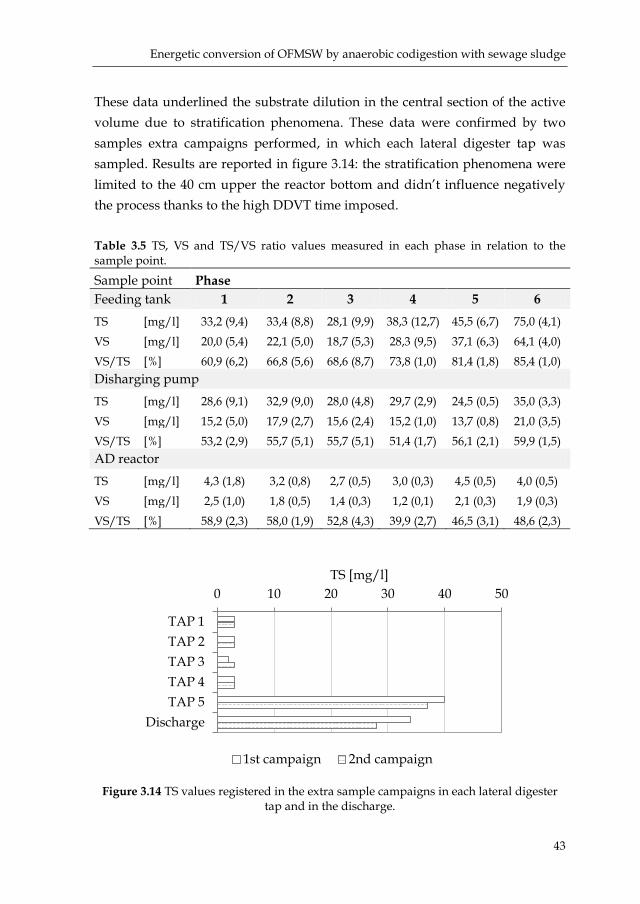
The elemental analysis was performed to identify carbon and nitrogen concentrations. The analysis allowed to calculate the C/N ratio, this ratio is a primary parameter in a proper AD process management. The C/N ratio feedstock control is one of the fundamental control strategies: the optimisation of the C/N ratio by AcoD is one of the cost-effective and easiest to implement technique to avoid ammonia toxicity (Rajagopal et al., 2013). In figure 3.18 it’s possible to highlight the C/N ratio positive trend thanks to AcoD regime: from 10,11 in phase 1 (only sewage sludge digestion) to 13,57 in phase 6. The higher N content in SwS is balanced by higher C content in SS-OFMSW, promoting AcoD methane yields (Sosnowsky et al., 2003). The typical range for OFMSW addition in SwS digestion is 6÷15.4 (Iacovidou et al., 2012), Sosnowski et al. (2003) reported a C/N ratio improvement from 9 to 14 by the addition of OFMSW (25% vol.) to sewage sludge (75% vol.). In Table 3.8 C/N ratio of feeding substrates and C/N digestate percentages are reported.
Pilot plant test
48
Figure 3.18 C/N values during the experimental phases in input process substrates.
Table 3.8 C/N ratio values measured in each phase in relation to the sample point.
Sample point Phase Feeding tank 1 2 3 4 5 6
C/N [-] 10,1(1,8) 10,6(0,7) 11,3(1,0) 12,8 (0,5) 12,9 (0,9) 13,6 (0,8)
Disharging pump C [%] 30,4 (3,2) 30,4 (3,2) 32,0 (2,2) 31,1(3,5) 39,3 (1,2) 32,0 (1,4) N [%] 3,4(0,2) 3,2(0,5) 3,2 (0,1) 3,2(0,2) 3,9 (0,2) 4,2 (0,1)
3.3.5 SULPHATES, PHOSPHORUS AND POTASSIUM
Sulfates are metabolized by sulfate-reducing bacteria (SRB) that compete with the AD biomass for the organic substrate degradation. The byproduct of the metabolism of the SRB bacteria is hydrogen sulphide (H2S), which accumulates in the biogas. This phenomenon involves the installation in the gas line of a H2S treatment device, in order to protect downstream unit. Sulfates concentrations were measured in input and output substrate samples to understand the impact of AcoD to SRB bacteria. In figure 3.19 the sulfates concentration are shown. The OFMSW addition has determined sulfates increase up to about 38 mg/l in phase 6, against a value of 16 mg/l in SwS phase. The output values follow the input trend, indicating that SRB activity hasn’t had increments along the experimentation. In table 3.9 sulfates data are listed.
02468
1012141618
1 2 3 4 5 6
C/N
[-]
Phase

Energetic conversion of OFMSW by anaerobic codigestion with sewage sludge
49
Figure 3.19 Sulfate values during the experimental phases in input substrate and
digestate.
Table 3.9 Sulfate values measured in each phase in relation to the sample point. Sample point Phase
Feeding tank 1 2 3 4 5 6 SO42- [mg/l] 16,1(12,3) 24,1 (7,7) 21,8(13,2) 19,8 (4,4) 24,8 (4,6) 37,6 (5,1)
Disharging pump SO42- [mg/l] 17,7(9,4) 22,9 (13,0) 16,0 (7,1) 14,6 (3,1) 21,8 (5,0) 25,2 (4,5)
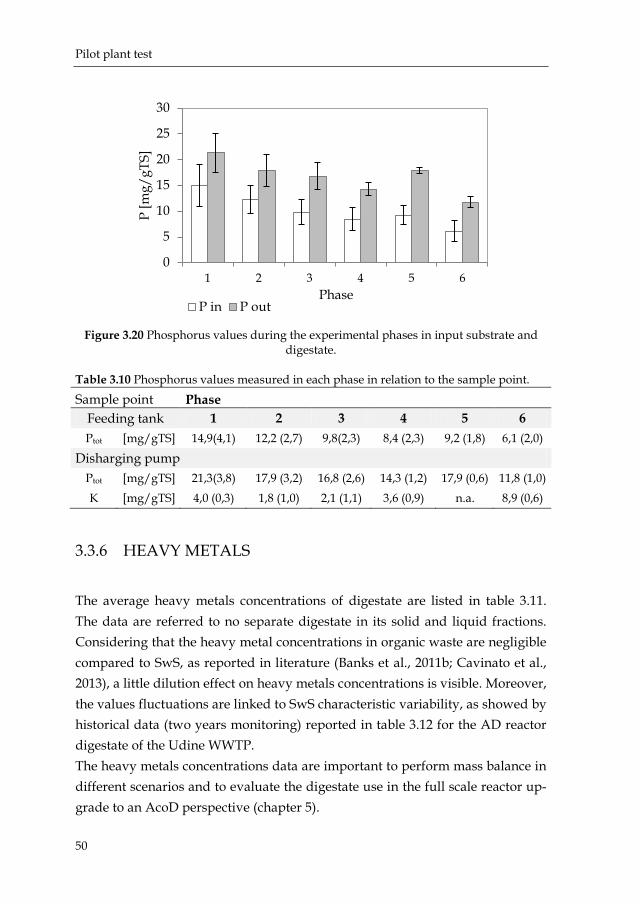
Total phosphorus concentration is shown in figure 3.20. The OFMSW addition decreased the total phosphorus concentrations in substrates, since it had a lower content compared to SwS. The increase of phosphorus concentration in the output substrates, could be due to ferric phosphate precipitates release in anaerobic conditions in accord to Ge et al. (2013) hypothesis that iron salts added in the wastewater line (in the typical dose of 5-20 mgFe/l) can be utilized for sulfide control in anaerobic process. In the AD reactor ferric ions Fe3+ are released and utilized by sulfide precipitation, due to relatively low solubility of FeS respect ferric phosphate precipitates (Ge et al. ,2013) causing a phosphorus release. In Udine WWTP, FeCl3 is add in activated sludge tank to phosphorus removal with a dose of 8,2 mg Fe3+/l and this support, within H2S data in subsequent paragraph 3.2.8, the Ge et al. (2013) hypothesis. In table 3.10 data related to phosphorus and potassium in digestate are reported, these value have a great importance to evaluate supernatant post treatment and solid fraction digestate characteristic as potential fertilizer.
0
10
20
30
40
1 2 3 4 5 6
Sulfa
te [m
g/L]
Phase
SO4 in SO4 out
Pilot plant test
50
Figure 3.20 Phosphorus values during the experimental phases in input substrate and
digestate.
Table 3.10 Phosphorus values measured in each phase in relation to the sample point.
Sample point Phase Feeding tank 1 2 3 4 5 6 Ptot [mg/gTS] 14,9(4,1) 12,2 (2,7) 9,8(2,3) 8,4 (2,3) 9,2 (1,8) 6,1 (2,0)
Disharging pump Ptot [mg/gTS] 21,3(3,8) 17,9 (3,2) 16,8 (2,6) 14,3 (1,2) 17,9 (0,6) 11,8 (1,0) K [mg/gTS] 4,0 (0,3) 1,8 (1,0) 2,1 (1,1) 3,6 (0,9) n.a. 8,9 (0,6)
3.3.6 HEAVY METALS
The average heavy metals concentrations of digestate are listed in table 3.11. The data are referred to no separate digestate in its solid and liquid fractions. Considering that the heavy metal concentrations in organic waste are negligible compared to SwS, as reported in literature (Banks et al., 2011b; Cavinato et al., 2013), a little dilution effect on heavy metals concentrations is visible. Moreover, the values fluctuations are linked to SwS characteristic variability, as showed by historical data (two years monitoring) reported in table 3.12 for the AD reactor digestate of the Udine WWTP. The heavy metals concentrations data are important to perform mass balance in different scenarios and to evaluate the digestate use in the full scale reactor up-grade to an AcoD perspective (chapter 5).
0
5
10
15
20
25
30
1 2 3 4 5 6
P [m
g/gT
S]
Phase P in P out

Energetic conversion of OFMSW by anaerobic codigestion with sewage sludge
51
Table 3.11 Heavy metals values measured in each phase.
Sample point Phase Disharging pump 1 2 3 4 5 6 Pb [mg/gTS] 85,2
(1,9) 93,9
(30,9) 82,3 (3,1)
84,6 (1,2) n.a. 85,01
(4,6) Cd [mg/gTS] 1,6
(0,1) 1,16 (0,4)
0,6 (0,3)
1,9 (0,5) n.a. 1,25
(0,2) Ni [mg/gTS] 55,6
(33,4) 79,3
(46,8) 42,1 (3,6)
34,6 (5,1) n.a. 67,6
(10,4) Zn [mg/gTS] 1031,5
(169,4) 1057,8 (310,79
1058,5 (118,1)
935,8 (120,3) n.a. 1425,6
(106,8) Cu [mg/gTS] 308,5
(94,6) 261,8 (63,5)
299,0 (30,1)
300,2 (34,7) n.a. 386,4
(52,8) Hg [mg/gTS] 3,7
(2,2) 1,3
(0,6) 2,2
(0,5) 1,2
(0,7) n.a. 2,1 (0,6)
Table 3.12 Heavy metals values measured in AD ful- scale unit digestate.
AD full scale unit digestate Average STD min max Pb [mg/gTS] 106,6 34,8 29,0 237,1 Cd [mg/gTS] 1,5 0,6 1,2 3,0 Ni [mg/gTS] 33,3 27,1 9,8 188,2 Zn [mg/gTS] 1265,3 343,4 275,9 1942,2 Cu [mg/gTS] 319,7 98,5 77,2 514,6 Hg [mg/gTS] n.a. n.a. n.a. n.a.
3.3.7 CONTROL PARAMETERS
The fundamental process control parameters were monitored: pH was measured in the feeding substrate, inside the AD reactor and in the digestate. In figure 3.21, it’s possible to note the input substrate acidification increase within the biowaste amounts in the mixture charge: from pH 5,9 of SwS to pH 4 in phase 6. The figure also highlights the buffering capacity of the system: it’s sufficient to compensate the input substrate acidity, in fact the pH inside the reactor was between 7.13 and 7.30 in all experimental phases, in the optimal range for the AD process.

Pilot plant test
52
Figure 3.21 pH values during the experimental phases.
The alkalinity values are reported in table 3.13: along the experimental phases alkalinity increases from 1447,9 mgCaCO3/l of SwS digestion to 2764,7 mgCaCO3/l in phase 6, a similar trend was also reported in the study performed by Bolzanella et al. (2006) increasing OLR from 1.02 to 1.21 KgVS/m3d in AcoD regime in Viareggio experiment. VFAs values are listed in table 3.13, VFA are considered a key parameter in AD control: they’re intermediates metabolites between hydrolytic-acidogenic bacteria and methanogenic microorganism, a VFAs accumulation in AD reactor is considered a process inhibition signal. Measured VFAs had very low values, only a light pick could be reported passing from SwS digestion to AcoD. Table 3.13 Alkalinity and VFA values measured in each phase in relation to the sample point.
Sample point Phase AD reactor 1 2 3 4 5 6 ALK [mgCaCO3/l] 1447,9
(289,5) 1578,6 (145,9)
1453,4 (133,8)
1323,3 (253,3)
2088,5 (600,5)
2764,7 (161,3)
VFA [mgCOD/l] 21,8 (8,2)
30,2 (16,7)
11,5 (5,1)
3,0 (2,8)
5,1 (4,8)
4,1 (2,7)
These values indicate no medium VFAs accumulation and they’re similar to other results reported in literature (Bolzonella et al., 2006; Cavinato et al. 2013). It’s important to consider the lack of standardized methods to perform VFAs analysis, this aspect was underlined by Raposo et al. (2013): the literature data
012345678
1 2 3 4 5 6
pH [-
]
Phase
pH in pH reactor pH out
Energetic conversion of OFMSW by anaerobic codigestion with sewage sludge
53
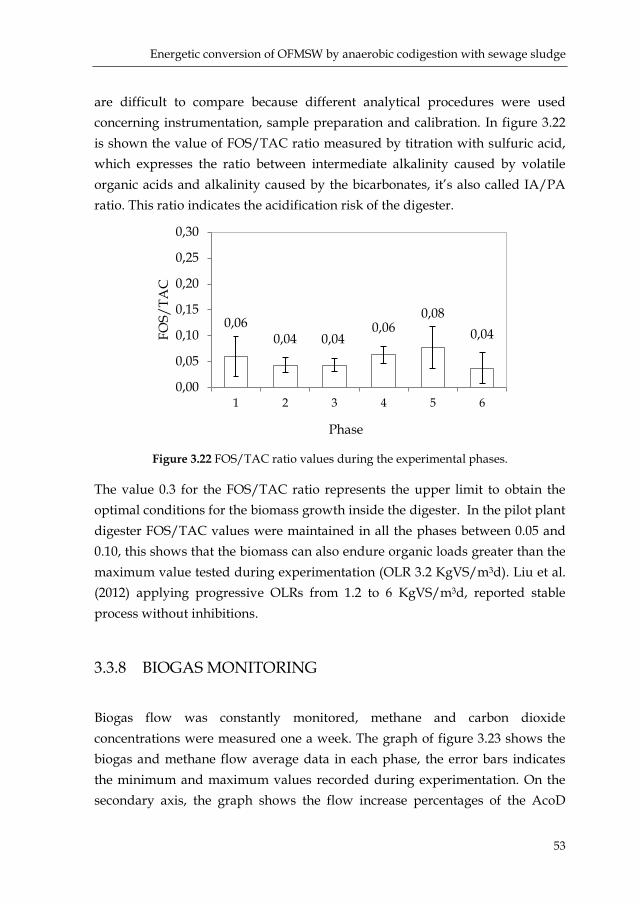
are difficult to compare because different analytical procedures were used concerning instrumentation, sample preparation and calibration. In figure 3.22 is shown the value of FOS/TAC ratio measured by titration with sulfuric acid, which expresses the ratio between intermediate alkalinity caused by volatile organic acids and alkalinity caused by the bicarbonates, it’s also called IA/PA ratio. This ratio indicates the acidification risk of the digester.
Figure 3.22 FOS/TAC ratio values during the experimental phases.
The value 0.3 for the FOS/TAC ratio represents the upper limit to obtain the optimal conditions for the biomass growth inside the digester. In the pilot plant digester FOS/TAC values were maintained in all the phases between 0.05 and 0.10, this shows that the biomass can also endure organic loads greater than the maximum value tested during experimentation (OLR 3.2 KgVS/m3d). Liu et al. (2012) applying progressive OLRs from 1.2 to 6 KgVS/m3d, reported stable process without inhibitions.
3.3.8 BIOGAS MONITORING
Biogas flow was constantly monitored, methane and carbon dioxide concentrations were measured one a week. The graph of figure 3.23 shows the biogas and methane flow average data in each phase, the error bars indicates the minimum and maximum values recorded during experimentation. On the secondary axis, the graph shows the flow increase percentages of the AcoD
0,06 0,04 0,04
0,06 0,08
0,04
0,00
0,05
0,10
0,15
0,20
0,25
0,30
1 2 3 4 5 6
FOS/
TAC
Phase

Pilot plant test
54
phase respect phase 1 of SwS mono digestion. In phase 6 an increment of 190% in biogas production, compared to phase 1, was registered. The methane and carbon dioxide content analysis has allowed to identify the biogas composition: methane percentage ranged between 64 and 71% during the AcoD, against a 63% value registered in phase 1. Due to technical problems methane percentages data aren’t available for phase 5 and 6. Data are listed in table 3.14. Hydrogen sulphide values were under 100 ppm in all experimental phases. These results could confirm the hypothesis of Ge et al. (2013) that find, as previously introduced, that H2S control in biogas can be achieved with the typical iron salt dosage rates applied in WWTP and, in this study, also in AcoD regime with S rich substrates like OFMSW in the AD supply.
Figure 3.23 Biogas and methane flows during the experimental phases.
Table 3.14 Biogas and methane average flow and standard deviation, the increment is calculated respect phase 1.
Gas flows Phase
1 2 3 4 5 6 Biogas [Nm3/d] 0,59
(0,11) 0,69
(0,09) 0,86
(0,17) 0,84
(0,04) 1,21
(0,19) 1,72
(0,25) Increment [%] - 17,6 46,81 43,6 106,5 192,2 Methane [Nm3/d] 0,39
(0,07) 0,48
(0,08) 0,61
(0,12) 0,62
(0,03) n.a. n.a.
Increment [%] - 25,3 58,4 59,2
0
50
100
150
200
250
300
0,000,200,400,600,801,001,201,401,601,802,00
1 2 3 4 5 6
[%]
[Nm
3 /d]
Phase Biogas Methane % increment Biogas % increment Methane
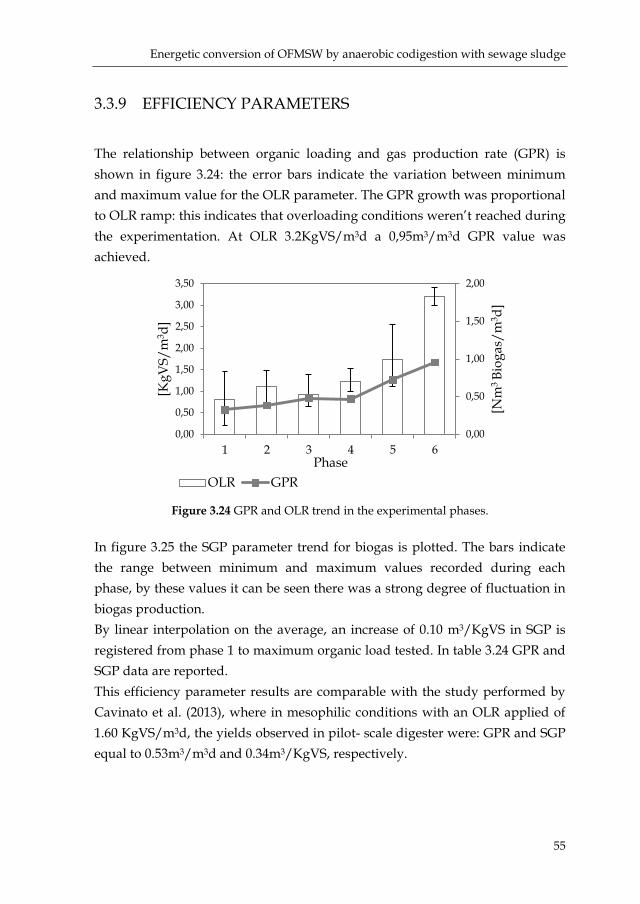
Energetic conversion of OFMSW by anaerobic codigestion with sewage sludge
55
3.3.9 EFFICIENCY PARAMETERS
The relationship between organic loading and gas production rate (GPR) is shown in figure 3.24: the error bars indicate the variation between minimum and maximum value for the OLR parameter. The GPR growth was proportional to OLR ramp: this indicates that overloading conditions weren’t reached during the experimentation. At OLR 3.2KgVS/m3d a 0,95m3/m3d GPR value was achieved.
Figure 3.24 GPR and OLR trend in the experimental phases.
In figure 3.25 the SGP parameter trend for biogas is plotted. The bars indicate the range between minimum and maximum values recorded during each phase, by these values it can be seen there was a strong degree of fluctuation in biogas production. By linear interpolation on the average, an increase of 0.10 m3/KgVS in SGP is registered from phase 1 to maximum organic load tested. In table 3.24 GPR and SGP data are reported. This efficiency parameter results are comparable with the study performed by Cavinato et al. (2013), where in mesophilic conditions with an OLR applied of 1.60 KgVS/m3d, the yields observed in pilot- scale digester were: GPR and SGP equal to 0.53m3/m3d and 0.34m3/KgVS, respectively.
0,00
0,50
1,00
1,50
2,00
0,00
0,50
1,00
1,50
2,00
2,50
3,00
3,50
1 2 3 4 5 6
[Nm
3 Bi
ogas
/m3 d
]
[KgV
S/m
3 d]
Phase OLR GPR

Pilot plant test
56
Figure 3.25 SGP trend in the experimental phases.
Table 3.24 GPR and SGP values in the experimental phases
EFFICIENCY PARAMETERS Phase
1 2 3 4 5 6 OLR [kgVS/m3d] 0,80 1,10 0,94 1,23 1,74 3,20 GPR [Nm3 Biogas/m3d] 0,33 0,38 0,48 0,47 0,72 0,95 [Nm3 Methane/m3d] 0,21 0,27 0,34 0,34 n.a. n.a. SGP [Nm3 Biogas/KgVS feed] 0,39 0,36 0,44 0,44 0,37 0,49 [Nm3 Methane/KgVS feed] 0,25 0,26 0,32 0,32 n.a. n.a.
In table 3.25 results of other studies related to AcoD experimentation, with similar type of organic substrate in CSTR mode, are listed: the comparison shows a good performance of the pilot plant reactor of this study, higher load could be implement as verify by Liu et al. (2012).
0,00
0,10
0,20
0,30
0,40
0,50
0,60
0,70
1 2 3 4 5 6
[Nm
3 Bio
gas/
Kg
VS
feed
]
Phase

Energetic conversion of OFMSW by anaerobic codigestion with sewage sludge
57
Table 3.25 GPR, SGP values in similar studies
COMPOSITION HRT OLR SGP [d] [KgVSm3/d] Gómez et al. (2006)
Pilot scale 22%d.w.PS; 78%d.w. FVW
37 - 0,4 [l/gVS]
Bolzonella et al. (2006)
Viareggio WWTP 15,7%olrOFMSW 84,3%olrWAS Treviso WWTP 41%olrOFMSW 59%olrWAS
19,8
22
1,21
0,78
0,26 [m3/KgVS]
0,43
[m3/KgVS]
Zupančic et al. (2008)
Full scale SwS OFMSW
20 1,1 (as VSS)
0,60 [m3/KgVSS]
Caffaz et al. (2008)
Pilot scale 23%olr FVW+KW 77%olr TAS
34 1.13 0,38 [Nm3biogas/KgVS]
Liu et al. (2012)
Pilot scale 50%w.w.OFMSW 25%w.w.FVW 25%w.w.DSS
20 6,0 0,72 [m3/KgVS]
Cavinato et al. (2013)
Pilot scale OFMSW WAS Full scale OFMSW WAS
23,5
1,60
1,62
0,34 [m3/KgVS]
0,35
[m3/KgVS]
Huyard et al. (2013)
Pilot scale 39%olrFWP 61/olrWAS
20 1,8 0,25 [Nm3/KgVS]
PS=primary sludge; KW=kitchen waste;TAS=thickened activated sludge; DSS=dewatered SwS; FWP=food waste pulp
3.3.10 CONCLUSIONS
SS-OFMSW substrates confirmed their high biodegradable content and the low inert presence, but some efforts could be performed to prevent the conferment of bones, shells and little plastic pieces.

Pilot plant test
58
The switching in AcoD regime was conduct with a slow OLR increasing strategy. The AcoD process was stable in each phase, no inhibition phenomena were registered: the early indicators used (VFAs, FOS/TAC and biogas production) didn’t revealed process imbalances. The process efficiency achieved was comparable with other experience reported in literature, as observed by Sosnowsky et al. (2003) the biogas production of the AcoD mixture increase with increasing proportions of OFMSW. It’s possible to hypothesize, thanks to the results of recent studies (Facchin et al., 2013; De Vrieze et al., 2013), that AcoD process with SwS and OFMSW benefits of heavy metals presents in SwS that act like micronutrients in the AD process. Feeding problems, due to SwS TS content variability, had determined management criticism in the first experimentation stages. These events caused an unstable feeding regime, especially in the early stages. In spite of this, the good process stability, that had characterize the experimentation, opens to the idea that unstable feeding regime, during low OLR steps, could have determined a microbial communities selection to more adaptive microorganism to increasing supply loads. This hypothesis has to be confirmed by deep experimental analysis. Digestate management is very important issue, the analysis performed had allows to quantify nutrients contents (C, N, P, K) and polluting compounds like heavy metals. These data were used to perform mass balance and technical and economic evaluation in chapter 5 for the full-scale application study. The sulphide and phosphorus importance in WWTP management arised in the experimentation, confirming the hypothesis of Ge et al. (2013) of ferric ion release by ferric phosphate precipitates and it recycle in AD sulfide precipitation. The phosphorus release in AD process implies the phosphorus return in wastewater line by the supernatant digestate: to avoid an overloading, special treatment units have to be insert before supernatant discharge. The dose of iron salt has to be managed and optimized by a WWTP integrate approach to perform the H2S control. In table 3.26 the summary data of pilot plant experimentation are reported.

Energetic conversion of OFMSW by anaerobic codigestion with sewage sludge
59
Table 3.26 Summury data of pilot plant experimentation.
Parameters Phase
1 2 3 4 5 6
TS in [mg/l] 33,2 (9,4)
33,4 (8,8)
28,1 (9,9)
38,3 (12,7)
45,5 (6,7)
75,0 (4,1)
VS/TS [%] 60,9 (6,2)
66,8 (5,6)
68,6 (8,7)
73,8 (1,0)
81,4 (1,8)
85,4 (1,0)
sCOD in [mg/l] 2220 (1082)
2767 (1224)
3939 (1928)
7210 (1238)
10319 (2126)
28530 (1200)
C/N [-] 10,11 (1,79)
10,63 (0,76)
11,26 (1,02)
12,87 (0,46)
12,94 (0,93)
13,57 (0,80)
OLR [KgVS/m3d] 0,80 (0,27)
1,10 (0,25)
0,94 (0,27)
1,23 (0,22)
1,74 (0,52)
3,20 (0,20)
HRT [d] 24,3 20 20 20 20 20 pH [-] 7,15 7,30 7,26 7,13 7,33 7,30 VFAs [mgCOD/l] 21,8
(8,2) 30,2
(16,7) 11,5 (5,1)
3,0 (2,8)
5,1 (4,8)
4,1 (2,7)
ALK [mgCaCO3/l] 1447,9 (289,5)
1578,6 (145,9)
1453,4 (133,8)
1323,3 (253,3)
2088,5 (600,5)
2764,7 (161,3)
NH4+ [mg/l] 522 (130)
488 (33)
458 (104)
517 (88)
582 (43)
618 (41)
P tot out [mg/kgTS] 21,3 (3,8)
17,9 (3,16)
16,8 (2,6)
14,3 (1,2)
17,9 (0,6)
11,8 (1,0)
ηVS [%] 33,0 28,7 41,3 46,4 62,9 67,3 GPR [Nm3/m3d] 0,33 0,38 0,48 0,47 0,72 0,95 SGP [Nm3/KgVS feed] 0,39 0,36 0,44 0,44 0,37 0,49

Pilot plant test
60
61
Mathematical modeling of the 4anaerobic digestion process by
ADMno°1
4.1 INTRODUCTION
Mathematical modelling, based on biochemical process equations, could be an useful instrument to optimize digesters design, the operating conditions and to better understand the biomass behaviour. Several mathematical models of AD have been proposed in the last three decades (Donoso-Bravo et al., 2011b), in 2002 the IWA Task Group for Mathematical Modelling of Anaerobic Digestion Processes has developed the Anaerobic Digestion Model no.1 (ADM1, Batstone et al., 2002), as a general start point for AD modelling. The ADM1 components are expressed in terms of their COD (kgCOD/m3). ADM1 has a five steps structure (figure 4.1) to represent disintegration, hydrolysis, acidogenesis, acetogenesis and methanogenesis processes for a total of 32 dynamic state variables (or 26 depending on method chosen to implement equations), 6 acid-base kinetic processes, 19 biochemical processes and 3 gas-liquid transfer processes. Extracellular steps are assumed to be of first order kinetic, Monod-type kinetics are used to describe substrate uptake and biomass growth. Inhibition phenomena are also included: pH for all microbial groups, hydrogen for acetogenic bacteria and free ammonia for acetoclastic methanogens. Thanks to the multi-step kinetic structure and the physico-chemical pathways described, ADM1 allows to assess HRT, basic biochemical overload and carbon dioxide concentration (Batstone et al., 2013).
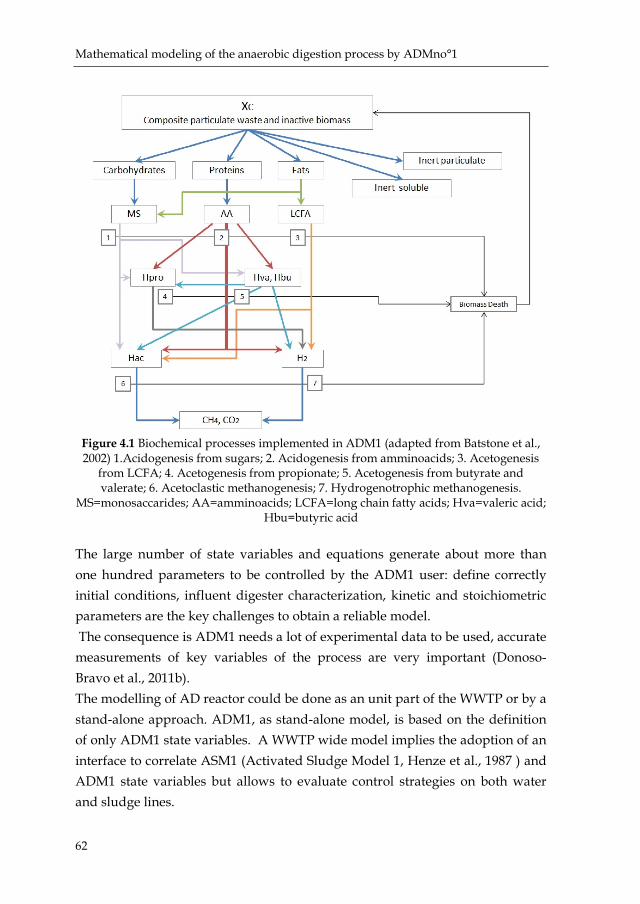
Mathematical modeling of the anaerobic digestion process by ADMno°1
62
Figure 4.1 Biochemical processes implemented in ADM1 (adapted from Batstone et al., 2002) 1.Acidogenesis from sugars; 2. Acidogenesis from amminoacids; 3. Acetogenesis
from LCFA; 4. Acetogenesis from propionate; 5. Acetogenesis from butyrate and valerate; 6. Acetoclastic methanogenesis; 7. Hydrogenotrophic methanogenesis.
MS=monosaccarides; AA=amminoacids; LCFA=long chain fatty acids; Hva=valeric acid; Hbu=butyric acid
The large number of state variables and equations generate about more than one hundred parameters to be controlled by the ADM1 user: define correctly initial conditions, influent digester characterization, kinetic and stoichiometric parameters are the key challenges to obtain a reliable model. The consequence is ADM1 needs a lot of experimental data to be used, accurate measurements of key variables of the process are very important (Donoso-Bravo et al., 2011b). The modelling of AD reactor could be done as an unit part of the WWTP or by a stand-alone approach. ADM1, as stand-alone model, is based on the definition of only ADM1 state variables. A WWTP wide model implies the adoption of an interface to correlate ASM1 (Activated Sludge Model 1, Henze et al., 1987 ) and ADM1 state variables but allows to evaluate control strategies on both water and sludge lines.

Energetic conversion of OFMSW by anaerobic codigestion with sewage sludge
63
The open challenges in ADM1 use are: • the substrate characterization and translation in state variables; • the calibration procedure to estimate the most sensitive parameter of
the model (Giroult et al., 2012); • the physicochemical modelling (to include P and S cycles in a plant
wide domestic modelling); • the application of multidimensional modelling (Batstone D.J., 2013).
The substrate characterization for ADM1 application is challenging (Lauwers et al., 2013). ADM1 requires a detailed characterization to identify the concentrations of soluble and particulate carbohydrates, proteins, lipids and VFAs that strongly influence the data quality of model output (Kleerebezem and Van Loosdrecht; 2006). Different approaches to modelling were developed at lab-scale to define substrate composition based on elemental analysis and biochemical fractionation (Huete et al., 2006; Kleerebezem and Van Loosdrecht, 2006; Yasui et al., 2006; Zaher et al., 2009; De Gracia et al., 2011; Giroult et al., 2012, Astals et al., 2013), but still a lack of standardized methodology remains. The interface approach defines the mapping compounds between ASM1 and ADM1 models (figure 4.2), different interfaces were proposed in literature. In this study Copp interface (Copp et al., 2003) was considered and its up-grade performed by Nopens et al. (2009).
Figure 4.2 Interface approach scheme (adapted from Batstone et al., 2013)
Characterisation and interface models based on Xc state variable, used as main input variable to ADM1, have key limitations due to the applicability problems. In fact the ADM1 state variable Xc represents the pool of complexes substrates that have to be disgregate to primary substrate components like proteins, carbohydrates, lipids and inerts. Xc have a fixed COD:mass ratio and this can

Mathematical modeling of the anaerobic digestion process by ADMno°1
64
cause incorrect model predictions because, in this way, also the input COD type is fixed (Nopens et al., 2009). Another problem with the use of Xc state variable is the creation of correlation between influent particulate materials and biomass decay by-products with very different characteristics. This kind of approach doesn’t account for changes in degradability or oxidation state with upstream plant operation (Batstone D.J., 2013). In WWTP application this problem is partially addressed using the Nopens interface (Nopens et al., 2013) but still remain the need to define a methodology for a systematic approach based on substrate type (Batstone D.J., 2013). The Nopens interface is based on Copp interface avoiding the use of Xc: the disintegration step is bypassed and the influent conversion is made directly into carbohydrates, proteins and lipids, avoiding secondary kinetics. The disintegration step remains active only for biomass decay products (Nopens et al., 2009). Another fundamental point regards the kinetic and stoichiometric parameters calibration. Different approaches are reported in literature using anaerobic tests in batch, CSTR or by combination of these techniques (Batstone et al. 2009; Donoso-Bravo et al., 2011a; Giroult et al., 2011; Souza et al., 2013). The use of BMP tests as source data for ADM1 hydrolysis parameter calibration for full-scale application is an open issue. To simulate complex substrate, the ADM1 limiting step is the disintegration/hydrolysis step. Souza et al. (2013) find BMP tests suitable data source for ADM1 calibration, providing adequate fit quality. Batstone et al. (2009) reported consistent differences between simulation using BMP testing and full-scale parameters: the evidence from this work was that BMP test are useful data source for project feasibility analysis but the values obtained should not be used for dynamic modelling. A solution to solve the key issues of substrate characterization and model calibration could be the defining of a procedure that uses a combination of BMP test, macromolecular analysis and numerical optimization by ADM1. A method based on these assumptions was developed by Giroult et al. (2012) using the technique of anaerobic respirometry. In this study, the feasibility of using BMP test, macromolecular substrate composition data and numerical optimization to calibrate ADM1 was analysed to simulate the pilot and full-scale reactor AD process in two regimes: sewage sludge digestion and AcoD process with SS-OFMSW.

Energetic conversion of OFMSW by anaerobic codigestion with sewage sludge
65
4.2 MATERIAL AND METHODS
4.2.1 FULL-SCALE AD UNIT
The AD unit is located in Udine’s WWTP, Italy. WWTP has a treatment capacity of 100000 P.E., sewage sludge is formed by a mixture of primary and secondary sludge. The AD unit is a two-step process with an anaerobic mesophilic digester (2800 m3 total volume) used for sewage sludge stabilization and biogas production and a secondary anaerobic digester for sewage sludge thickening. In this study, only the primary digester has been considered for the sampling and the ADM1 modelling.
4.2.2 ANALYTICAL METHODS
To obtain substrates characterization, the classic chemical-physical parameters and key macromolecular compounds for anaerobic biodegradability were measured in each sample by the methods identified in the previous chapters. Flow in, biogas flow and temperature were monitored daily at digester unit. To refer data analysis in terms of COD, the following data were chosen: COD content of carbohydrates is 1,19 gCOD/g carbohydrate based on (C6H10O5)n,
COD content of proteins is 1,42 gCOD/g protein based on (C5H7NO2), COD content of lipids is 2,90 gCOD/g lipid based on (C57H104O6), COD content of acetic acid is 1,07 gCOD/g acetic acid, COD content of propionic acid is 1,51 gCOD/g propionic acid, COD content of butyric acid is 1,82 gCOD/g butyric acid, COD content of valeric acid is 2,04 gCOD/g valeric acid.
4.2.3 EXPERIMENTAL PROCEDURE
In the first step, the simulation by ADM1 of the full-scale AD unit, in Udine WWTP, operating only with sewage sludge was performed. Two months monitoring period was carried out: two samples of thickened sewage sludge and digestate were collected weekly and analysed to implement the model.
Mathematical modeling of the anaerobic digestion process by ADMno°1
66
COD fractions in input substrates were defined basing on macromolecular compounds analysis. Moreover, data coming from one year of AD unit running were examined to check the model. The simulation was performed using two different approaches: a plant-wide model with an ASM1/ADM1 interface (Copp interface) and a stand-alone model with a modified ADM1 version (as described in Batstone et al., 2009) based on Nopens approach to Xc state variable. BMP tests and macromolecular analysis on sewage sludge and digestate were used to optimize COD fractionation and estimate kinetic and stoichiometric parameters to use the Copp interface. Macromolecular analysis were also used to define biodegradable COD fractions to apply modified ADM1. In the second step, ADM1 was used to simulate the AcoD process in pilot plant and to predict AcoD process applied to full-scale WWTP unit.
4.2.4 MODEL IMPLEMENTATION
ADM1 plant-wide model was implemented in GPS-X® 6.1 (Hydromantis Inc., Canada) according to the ADM1 COST benchmark (Rosen, 2006) using an ASM1/ADM1 interface (Copp’s interface, Copp et al., 2003). In the COST version, to overcome the inorganic C and N imbalance of STR-13 version, stoichiometric coefficients, biomass degradation equations and composition parameters were adjust (Lauwers et al., 2013). ADM1 stand-alone model was implement in Aquasim 2.1 (Reichert P., 1994) using a modified form of the Nopens interface that translates total influent COD to proteins, carbohydrates, lipids and inerts through the key parameters: fd degradability parameter and a single khyd parameter. This modification overcame the Xc problem definition and isolates the disintegration process only to the biomass decay products. The key difference between Nopens and COPP interfaces is the way of XI definition: in Nopens interface XI is mapped in relation of fd degradability parameter (Batstone et al., 2009).
Energetic conversion of OFMSW by anaerobic codigestion with sewage sludge
67
4.3 RESULTS&DISCUSSION
4.3.1 SwS AD PROCESS SIMULATION
Due to the complexity of ADM1, an accurate application of the model requires a detailed characterization of the sludge composition: the feed stream should be well characterized with respect to its COD content and the biodegradable fraction of its material (Parker W.J., 2005). Macromolecular analysis is a fundamental step to understand the sludge properties in AD process and to estimate biodegradable COD. Moreover ammonia and TKN concentrations present in the feed need to be well characterized because of their impact on pH buffering and inhibition functions (Parker W.J., 2005).
4.3.1.1 Bmp tests modelling with COPP Interface adoption
In table 4.1 the sewage sludge input in BMP tests and initial inoculum characteristics are reported, these values were used to define state variables and initial values of ADM1. The use of ASM1/ADM1 interface allows an easy insertion of the ADM1 model in a general WWTP model for a valuation of global WWTP performances and, as consequence, shifts the state variables definition problem on ASM1 fractions. Yasui et al. (2008b) found that in general ASM state variables were well correlated to the state variables of ADM1, the composite variable Xc could be considered as sum of state variables XS and XH, while XI in both the models showed direct correspondence. Creating the input data based on ASM1 state variables, the subsequent hypothesis were made: input oxygen is zero, only XB,H is considered in secondary sludge, XP is set to zero because all inerts are included in XI.

Mathematical modeling of the anaerobic digestion process by ADMno°1
68
Table 4.1. Sewage sludge and inoculum characteristics.
Parameters Units Sewage Sludge Inoculum CODTOT CODS TS VS TKN NH4+ pH ALK Carbohydrates TOT Carbohydrates S
Proteins TOT
Proteins S
Lipids Acetic acid Propionic acid Butyric Acid Valeric Acid
[mgCOD/l] [mgCOD/l] [g/l] [g/l] [mgN/l] [mgN/l] [-] [mgCaCO3/l] [mgCOD/l] [mgCOD/l] [mgCOD/l] [mgCOD/l] [mgCOD/l] [mgCOD/l] [mgCOD/l] [mgCOD/l] [mgCOD/l]
36444 1624
35 22,9 1465 206 5,26 1295
2900,80 63,80
11144,01 77,09
7593,65 344,87 336,24 35,84 6,02
20640 1304
20 10,4 1341 478 7,01 2506
1249,07 107,40
7641,51 181,21
4785,29 2,78 2,89 0,53 0,03
In this study, in order to implement ADM1 model by an ASM1 state variables characterization, an applicative procedure to characterize sewage sludge was proposed: as a first step particulate fraction in terms of COD was quantified, basing on the measurement on total and soluble phase of substrates (eq.4.1). 𝐶𝑂𝐷𝑋 = 𝐶𝑂𝐷𝑇𝑂𝑇 − 𝐶𝑂𝐷𝑆 (4.1) Soluble fraction CODS is the sum of SI and SS as (eq.4.2), where the latter parameter could be considered as the sum of biodegradable soluble ADM1 state variables, as in eq.4.3. 𝐶𝑂𝐷𝑆 = 𝑆𝐼 + 𝑆𝑆 (4.2) 𝑆𝑆 = 𝑆𝑆𝑈 + 𝑆𝑉𝐹𝐴 + 𝑆𝐹𝐴 + 𝑆𝐴𝐴 (4.3)
SSU and SVFA are known by macromolecular analysis: SSU is equal to carbohydrates measured in soluble phase, SVFA is the sum of acetic, propionic, butyric, valeric acids concentrations in samples. SAA can be estimated from proteins measured on soluble phase and converted in COD by ADM1 stoichiometric parameter NAA=0,098gN/gCOD (Batstone et al., 2002). The unknown variable SFA, can be obtained assuming an initial zero value, the maximum value of SI can be approximate by difference (by equations 4.2 and 4.3).
Energetic conversion of OFMSW by anaerobic codigestion with sewage sludge
69
The optimal value of SFA (and as a result SI), can be estimated fitting the model by data coming from BMP test on sewage sludge. The same method based on macromolecular compounds analysis can be applied in the fractionation of particulate COD: eq.4.4 and eq.4.5 lead by difference to estimation of the maximum possible value of XI. The optimal value can be identified by model fitting with experimental data. Concentrations of carbohydrates, proteins and lipids in eq.4.5 are referred only to particulate phase of samples. 𝐶𝑂𝐷𝑋 = 𝑋𝐼 + 𝑋𝑆 + 𝑋𝐵 (4.4) 𝑋𝑆 + 𝑋𝐵 = 𝐶𝑎𝑟𝑏𝑜ℎ𝑦𝑑𝑟𝑎𝑡𝑒𝑠 + 𝑃𝑟𝑜𝑡𝑒𝑖𝑛𝑠 + 𝐿𝑖𝑝𝑖𝑑𝑠 (4.5) Nitrogen parameters can be quantified in the soluble phase: SNH as the ammonium concentration and SND represents the soluble biodegradable organic nitrogen that is identifiable with SAA.
The particulate organic biodegradable nitrogen XND represents the nitrogen associated to XS, it has to be calculated in order to obtain a consistent input influent. Eq.4.6 shows how to perform this calculation, where NI,Xi= 0,06 gN/gCOD and NI,Xb= 0,086 gN/gCOD are the stoichiometric ASM1 parameters for inert fraction in XB and XI.
𝑋𝑁𝐷 = 𝑇𝐾𝑁 − 𝑆𝑁𝐻 − 𝑆𝑁𝐷 − 𝑋𝐼 ∙ 𝑁𝐼,𝑋𝑖 − 𝑋𝐵 ∙ 𝑁𝐼,𝑋𝑏 (4.6) Alkalinity, pH, ammonia and VFA measured data help to resolve charge balance (as the procedure reported by Nopens et al., 2009) for the definition of initial concentrations of ADM1 state variables SCAT, SAN, SIN, SIC. COD/VS ratio was optimized basing on experimental results. BMP tests were realized both on inoculum (as blank) and sewage sludge at ISR 3 to determine the methane production (Chapter 2). Blank BMP test allowed to assess the residual methane production of inoculum: methane production rate (MPR) curve obtained in BMP test was used to fit the model and find correct initial values of ADM1 state variables to be used for modeling BMP test on sewage sludge. In this case no ASM1/ADM1 was adopted because there wasn’t an additional substrate to be degraded by biomass. The analysis performed has permitted to define ADM1 state variables. Default ADM1 values (Batstone et al., 2002) for kinetic parameters were adopted. Figure 4.3 shows the performance of the model. The model had a relative error on cumulate experimental methane production of 11,5%.

Mathematical modeling of the anaerobic digestion process by ADMno°1
70
Figure 4.3 Comparison of real and simulated MPR curve for inoculum.
Characterization of ADM1 state variables for seed sludge has allowed the definition of initial concentration of state variables to be used in the simulation of sewage sludge BMP test. COD fractionations SI and XI were optimized decreasing the values obtained by influent characterization. Using a computational optimization tool of the process simulator GPS-X® (Hydromantis Inc., Canada), calibration of the most sensitive kinetic parameters was performed until best fits were achieved between the simulated and experimental MPR curves. Yield stoichiometric parameters on XC: fch,xc, fpr,xc, fli,xc, fsi,xc, fxi,xc were optimized (Table 4.2). These data are similar to ones obtained by the experimental study of Astals et al. (2013) on seven different sewage sludges. Further gCOD/gVS ratio was changed to improve the model accuracy, this ratio is important when VS measurement is used for digester performance monitoring (Ozkan-Yucel, 2010).
Table 4.2 Yield stoichiometric parameters on XC used in the model and suggested values (Batstone et al., 2002) .
Parameters Units BMP on sewage sludge Suggested values fch,xc fpr,xc fli,xc fsi,xc fxi,xc
[gCOD/gCOD] [gCOD/gCOD] [gCOD/gCOD] [gCOD/gCOD] [gCOD/gCOD]
0,13 0,25 0,21 0,10 0,31
0,20 0,20 0,25 0,10 0,25
0
2
4
6
8
10
12
14
0 24 48 72 96 120
144
168
192
216
240
264
288
312
336
360
384
408
432
456
480
MPR
[Nm
l/h]
[hours]
Experimental model

Energetic conversion of OFMSW by anaerobic codigestion with sewage sludge
71
Figure 4.4 shows experimental MPR curve and simulated ones for BMP test on sewage sludge. Relative errors between experimental data and simulated values by the model at the end of BMP test. Cumulative methane production, total COD, volatile solids and ammonia were simulated successfully by the model with a relative error respectively of 2,3%, 4,5%, 11,8% and 12,8%.
Figure 4.4 Comparison of real and simulated MPR curve for sewage sludge.
4.3.1.2 Full-scale AD reactor
The model was tested by monitoring period performed on full-scale anaerobic digester using dynamic influent data arranged by the on-line registered flow and the sludge characterization performed on sewage sludge samples. The monitoring period has highlighted a strong daily variability of sewage sludge characteristics: average TS content of the influent sludge was 32,5±5,7g/l and VS 22,1±4,5g/l, CODTOT and TKN were respectively 32537±8185mgCOD/l and 1385±189mgN/l. The macromolecular analysis carried out on samples in monitoring period allowed to define the average sewage sludge composition. Organic Loading Rate (OLR) was 0,92±0,16 kgVS/m3day in monitoring time with an hydraulic retention time (HRT) of 24,4±1,54 days.
02468
1012141618
0 24 48 72 96 120
144
168
192
216
240
264
288
312
336
360
384
408
432
456
480
MPR
[Nm
l/h]
[hours]
Experimental model
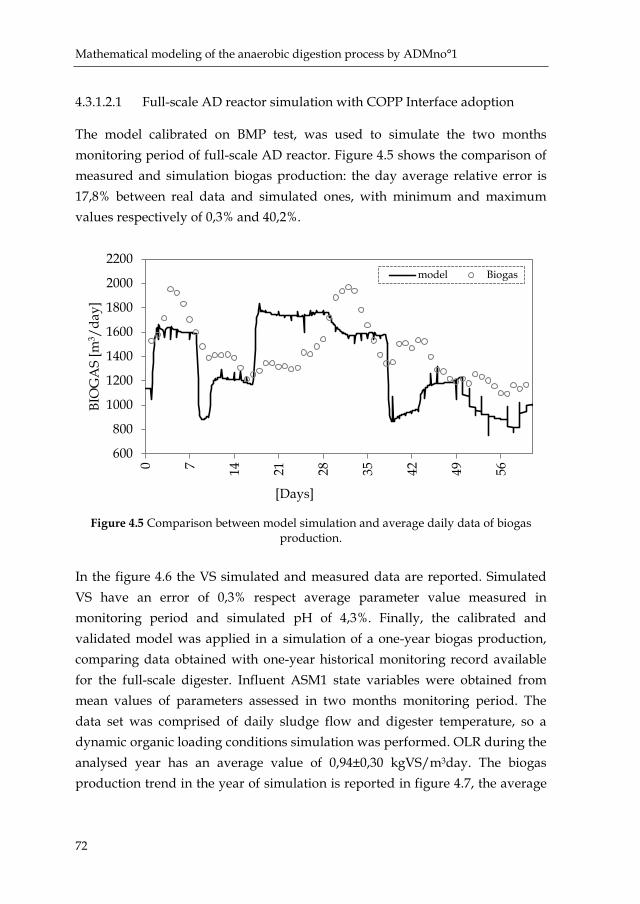
Mathematical modeling of the anaerobic digestion process by ADMno°1
72
4.3.1.2.1 Full-scale AD reactor simulation with COPP Interface adoption
The model calibrated on BMP test, was used to simulate the two months monitoring period of full-scale AD reactor. Figure 4.5 shows the comparison of measured and simulation biogas production: the day average relative error is 17,8% between real data and simulated ones, with minimum and maximum values respectively of 0,3% and 40,2%.
Figure 4.5 Comparison between model simulation and average daily data of biogas
production. In the figure 4.6 the VS simulated and measured data are reported. Simulated VS have an error of 0,3% respect average parameter value measured in monitoring period and simulated pH of 4,3%. Finally, the calibrated and validated model was applied in a simulation of a one-year biogas production, comparing data obtained with one-year historical monitoring record available for the full-scale digester. Influent ASM1 state variables were obtained from mean values of parameters assessed in two months monitoring period. The data set was comprised of daily sludge flow and digester temperature, so a dynamic organic loading conditions simulation was performed. OLR during the analysed year has an average value of 0,94±0,30 kgVS/m3day. The biogas production trend in the year of simulation is reported in figure 4.7, the average
600
800
1000
1200
1400
1600
1800
2000
2200
0 7 14 21 28 35 42 49 56
BIO
GA
S [m
3 /da
y]
[Days]
model Biogas
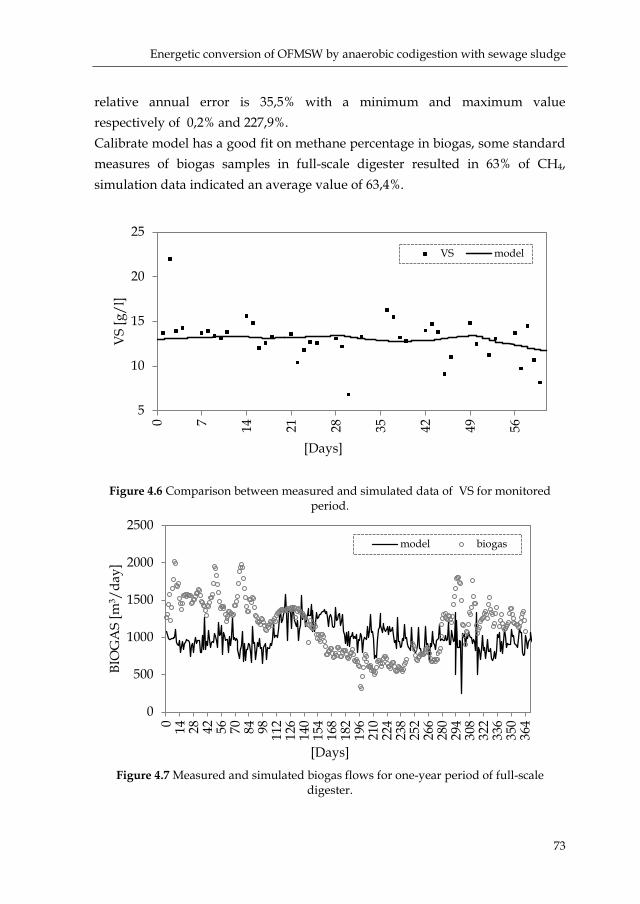
Energetic conversion of OFMSW by anaerobic codigestion with sewage sludge
73
relative annual error is 35,5% with a minimum and maximum value respectively of 0,2% and 227,9%. Calibrate model has a good fit on methane percentage in biogas, some standard measures of biogas samples in full-scale digester resulted in 63% of CH4, simulation data indicated an average value of 63,4%.
Figure 4.6 Comparison between measured and simulated data of VS for monitored period.
Figure 4.7 Measured and simulated biogas flows for one-year period of full-scale
digester.
5
10
15
20
25
0 7 14 21 28 35 42 49 56
VS
[g/l
]
[Days]
VS model
0
500
1000
1500
2000
2500
0 14 28 42 56 70 84 98 112
126
140
154
168
182
196
210
224
238
252
266
280
294
308
322
336
350
364
BIO
GA
S [m
3 /da
y]
[Days]
model biogas

Mathematical modeling of the anaerobic digestion process by ADMno°1
74
4.3.1.2.2 Full-scale AD reactor simulation with modified ADM1
The modified ADM1 model was calibrated on the two months monitoring period and validated on the one year data. Dynamic organic load simulation was implemented as previously described. The fd variable was defined basing on macromolecular compounds expressed in terms of COD: the sum of all biodegradable compounds was related to the total input substrate COD to define the initial fd value. Khyd and fd were optimized by a computational tool using the gas flow and VS data. The fd parameter average value was 0,62 with a minimum at 0,48 end a maximum value at 0,74. The two month simulation result, with calibrated parameters, is reported in figures 4.8 and 4.9 for biogas flow and VS, respectively. The average error in biogas flow prediction was 5,0% (minimum value of 0,1% and maximum value of 12,5%). The VS were estimated with an average error of 3,9%. The calibrate model was tested for the one year data set. Simulation results for biogas flow are reported in figure 4.10. The average error on one year data was 13,0% with a minimum value at 0,4 and a maximum value at 71,8. The fd parameter was adjusted during the one year simulation to account the changes in sewage sludge degradability over the year caused by ambient temperature. This phenomenon is exacerbated during summer season and implies a value of fd near to 0,3.
Figure 4.8 Comparison between model simulation and average daily data of biogas
production.
600
800
1000
1200
1400
1600
1800
2000
2200
0 7 14 21 28 35 42 49 56
BIO
GA
S [m
3 /da
y]
[Days]
model Biogas
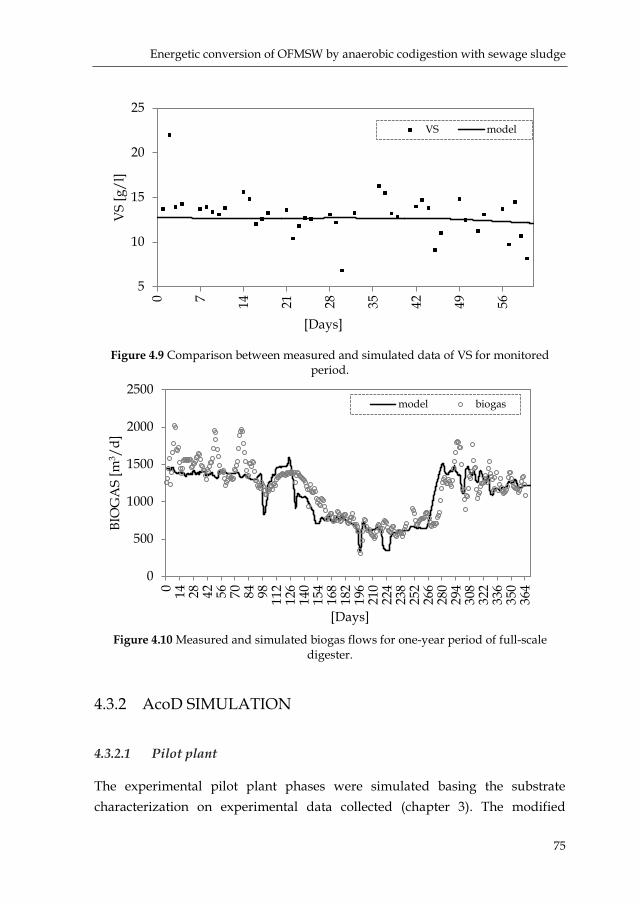
Energetic conversion of OFMSW by anaerobic codigestion with sewage sludge
75
Figure 4.9 Comparison between measured and simulated data of VS for monitored
period.
Figure 4.10 Measured and simulated biogas flows for one-year period of full-scale
digester.
4.3.2 AcoD SIMULATION
4.3.2.1 Pilot plant
The experimental pilot plant phases were simulated basing the substrate characterization on experimental data collected (chapter 3). The modified
5
10
15
20
25
0 7 14 21 28 35 42 49 56
VS
[g/l
]
[Days]
VS model
0
500
1000
1500
2000
2500
0 14 28 42 56 70 84 98 112
126
140
154
168
182
196
210
224
238
252
266
280
294
308
322
336
350
364
BIO
GA
S [m
3 /d]
[Days]
model biogas
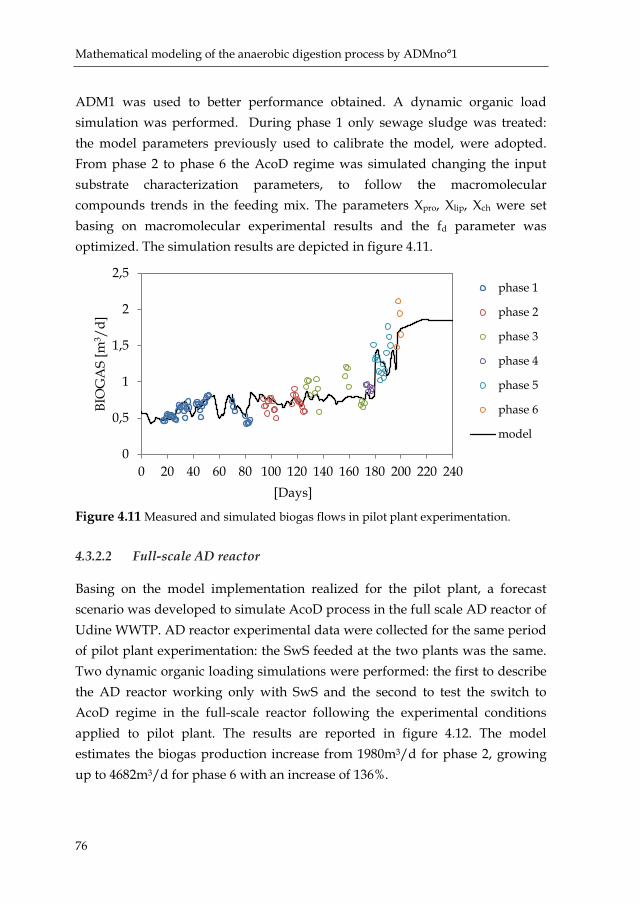
Mathematical modeling of the anaerobic digestion process by ADMno°1
76
ADM1 was used to better performance obtained. A dynamic organic load simulation was performed. During phase 1 only sewage sludge was treated: the model parameters previously used to calibrate the model, were adopted. From phase 2 to phase 6 the AcoD regime was simulated changing the input substrate characterization parameters, to follow the macromolecular compounds trends in the feeding mix. The parameters Xpro, Xlip, Xch were set basing on macromolecular experimental results and the fd parameter was optimized. The simulation results are depicted in figure 4.11.
Figure 4.11 Measured and simulated biogas flows in pilot plant experimentation.
4.3.2.2 Full-scale AD reactor
Basing on the model implementation realized for the pilot plant, a forecast scenario was developed to simulate AcoD process in the full scale AD reactor of Udine WWTP. AD reactor experimental data were collected for the same period of pilot plant experimentation: the SwS feeded at the two plants was the same. Two dynamic organic loading simulations were performed: the first to describe the AD reactor working only with SwS and the second to test the switch to AcoD regime in the full-scale reactor following the experimental conditions applied to pilot plant. The results are reported in figure 4.12. The model estimates the biogas production increase from 1980m3/d for phase 2, growing up to 4682m3/d for phase 6 with an increase of 136%.
0
0,5
1
1,5
2
2,5
0 20 40 60 80 100 120 140 160 180 200 220 240
BIO
GA
S [m
3 /d]
[Days]
phase 1
phase 2
phase 3
phase 4
phase 5
phase 6
model
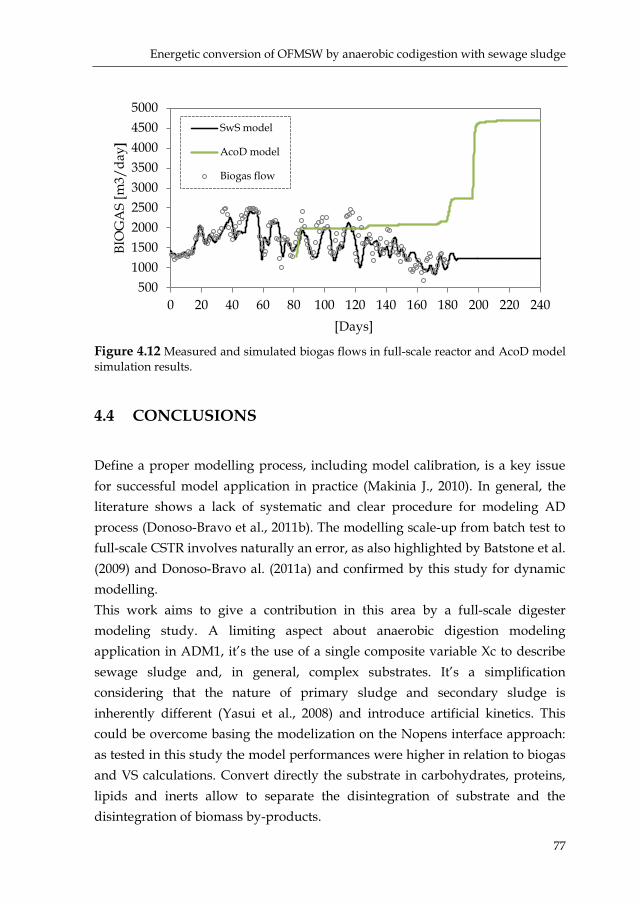
Energetic conversion of OFMSW by anaerobic codigestion with sewage sludge
77
Figure 4.12 Measured and simulated biogas flows in full-scale reactor and AcoD model simulation results.
4.4 CONCLUSIONS
Define a proper modelling process, including model calibration, is a key issue for successful model application in practice (Makinia J., 2010). In general, the literature shows a lack of systematic and clear procedure for modeling AD process (Donoso-Bravo et al., 2011b). The modelling scale-up from batch test to full-scale CSTR involves naturally an error, as also highlighted by Batstone et al. (2009) and Donoso-Bravo al. (2011a) and confirmed by this study for dynamic modelling. This work aims to give a contribution in this area by a full-scale digester modeling study. A limiting aspect about anaerobic digestion modeling application in ADM1, it’s the use of a single composite variable Xc to describe sewage sludge and, in general, complex substrates. It’s a simplification considering that the nature of primary sludge and secondary sludge is inherently different (Yasui et al., 2008) and introduce artificial kinetics. This could be overcome basing the modelization on the Nopens interface approach: as tested in this study the model performances were higher in relation to biogas and VS calculations. Convert directly the substrate in carbohydrates, proteins, lipids and inerts allow to separate the disintegration of substrate and the disintegration of biomass by-products.
500100015002000250030003500400045005000
0 20 40 60 80 100 120 140 160 180 200 220 240
BIO
GA
S [m
3/da
y]
[Days]
SwS model
AcoD model
Biogas flow

Mathematical modeling of the anaerobic digestion process by ADMno°1
78
The input characterization and translation in ADM1 state variables isn’t an easy task and the lack of standardised methodology for complex substrate it’s the major barrier to ADM1 application (Batstone D.J., 2013). The use of an ASM1/ADM1 interface allows a simplified approach to the model implementation in relation to an easier fractionation of feed influent but the parameter identificability problem is an open issue. Macromolecular analysis for COD fractionation helps to reduce the inconsistencies in ADM1 simulations due to poor influent characterization and to contain errors in acceptable range for full-scale reactor simulation, respect literature ranges of approximately 5-15% simulated data difference from measured data (Rieger et al. 2013).

79
Feasibility study of AcoD 5plant up-grade
5.1 INTRODUCTION
Basing on results obtained by pilot plant experimentation, different scenarios for full-scale AD unit up-grade to AcoD were defined developing feasibility studies. Two scenarios were hypothesized:
• Scenario 1: AcoD of SwS and SS-OFMSW in AD WWTP reactor to deplete the spare treatment capacity;
• Scenario 2: AcoD of SwS and OFMSW in AD WWTP unit in existing reactor and in a new one, to treat the amount of OFMSW received by the Udine waste treatment plant.
Wet and semi-dry regimes are considered, achieved with the use of purified water by WWTP. The substrates dilution allows to obtain the correct OLR and the proper TS concentration to avoid mixing problems, clogging pumps phenomena and usury inside the reactor. Energy balance and economic evaluations were performed to define the sustainability of each scenario. The scenario n°2 was considered in relation to an evident constrain condition: Udine WWTP and Udine waste treatment plant are geographically adjacent (as possible to see in figure 5.1) and this opens to the hypothesis of a synergy between the two plants to integrate aerobic and anaerobic treatments of OFMSW. The common assumptions of both scenarios were:
- Cogeneration of all biogas produced; - Solid and liquid digestate fractions separation; - Liquid digestate pre-treatment before the discharge in WWTP water
line; - Composting of the solid digestate fraction.

Feasibility study of AcoD plant up-grade
80
The investments were evaluated for a 20 years, in relation to the actual duration of Italian government feed-in tariffs.
Figure 5.1 WWTP and waste treatment plant aerial photo with in blue circle the OFMSW
collection building and the composting plant, in the green circle the AD unit inside WWTP.
The following conditions were fixed to define the economic model. The waste contribution tariffs were defined analysing the market price: due to the uncertainty link to future price variations, a range was selected and minimum and maximum values tested. The range chosen is 75-85 €/ton for OFMSW and 35-50 €/ton for green waste. No extra transport costs were considered due to the plants proximity. The waste disposal (rejected materials from pre-treatment section) cost was evaluated in 100 €/ton for inert material from waste pre-treatment and 40 €/ton for chemical sewage sludge. The management costs comprise:
• CHP maintenance (25€/MWh year); • General maintenance (3,5% of initial investment cost per year); • Reagents for biogas purification (2,18 €/m3 biogas); • Lab analysis (12000€/year); • Employees (35000€/year person); • Insurance (10000€/year).
Energetic conversion of OFMSW by anaerobic codigestion with sewage sludge
81
Post-treatments of digestate, in its solid and liquid fractions, were considered. Extra management costs in chemicals were accounted for liquid digestate treatment. The composting cost of solid digestate fraction was considered only in scenario n°1, because in scenario n°2 the two plant synergy allows to adsorb this cost. A 10% of extra cost was added for every year on total expenses, to consider administrative and extra technical costs. The revenues from biogas use to produce electric energy (EE) and thermal energy (TE) were evaluated basing on “D.M. 6 luglio 2012”of the Italian government. The feed in tariffs are:
• Power 600÷1000 kW: 216€/MWh; • Power 1000÷5000 kW: 109€/MWh.
Moreover it’s possible to consider 10€/MWh as bonus for high-performance cogeneration. The savings on the energy bill were defined considering the tariff of 150 €/MWh as average grid cost. The calculations on energy production were made considering that from 1 m3 of biogas is possible to generate 1,8KWhEE and 2,8KWhTE. The saving of sewage sludge disposal are fixed at 300 000€/year. The common cost item to both scenario regards the up-grade of the existing AD reactor to AcoD, it’s estimated in 400 000€. The working days per year were fixed at 250.
5.2 SCENARIO 1
In this scenario the overcapacity of the existing AD reactor is exploited. Basing on pilot plant results the calibrated ADM1 allowed to define the AD operative conditions and basing on model results the feasibility study was completed. The total amount of SS-OFMSW to be used is 16,7 ton/d, these quantities could be collected in selected source to avoid intensive pre-treatments: 10% of inerts are hypothesized. The clean SS-OFMSW amount after pre-treatments is 15,0 ton/d at 30%TS. The SwS amount is 115 m3/d at 3%TS. No water dilution is planned to perform the process at the limit of the wet regime, pushing the OLR to maximum possible value. The operative conditions and the biogas production are listed in table 5.1. The evaluation of the biogas production over the year is obtained considering a low biogas production during weekends due to only SwS feeding.
Feasibility study of AcoD plant up-grade
82
Table 5.1 Scenario 1: operative conditions and biogas production Scenario 1 HRT 20 [d] Volume 2800 [m3] Qin 140 [m3/d] Qin_SwS 115 [m3/d] Qin_OFMSW 25 [m3/d] TS_in 7,8 [%] OLR 3,3 [KgVS/m3d] Q Biogas 3640 [m3/d]
5.2.1 Energy balance
The energy balance was performed considering the whole WWTP. The average annual EE consumption is equal to 2200MWhe. The extra-EE consumption due to AcoD up-grade is linked to pre-treatment section and composting, it is evaluate in 80KWhe/ton for incoming waste and in 90KWhe/ton for compost (data from Righi et al., 2013). The actual TE consumption for AD reactor is 4965KWht/d, with a new insolation a consumption of 3200KWht/d can be achieved. The energy balance flows are depicted in figure 5.1.
5.2.2 Digestate
After dewatering process, a production of 51,9m3/d of solid digestate at 20%TS and 81,3 m3/d of liquid digestate is estimated. The solid digestate could be treated with green waste in a composting process to produce organic fertilizer. By the Italian law (D.Lgs 75/2010 and subsequent amendments), SwS has to be present in the starting substrate mix under the limit of 35% w/w and heavy metals has to respect limit concentrations. Basing on heavy metals analysis performed on green waste (Rizzardini et al., 2013) final heavy metal concentrations in compost were calculated (Table 5.2). To achieve a proper starting mixture for composting process the amount of green waste was evaluated in relation to C/N ratio and humidity. From experimental pilot plant data, digestate has a C/N ratio of 9. Green waste is composed by a mixture of
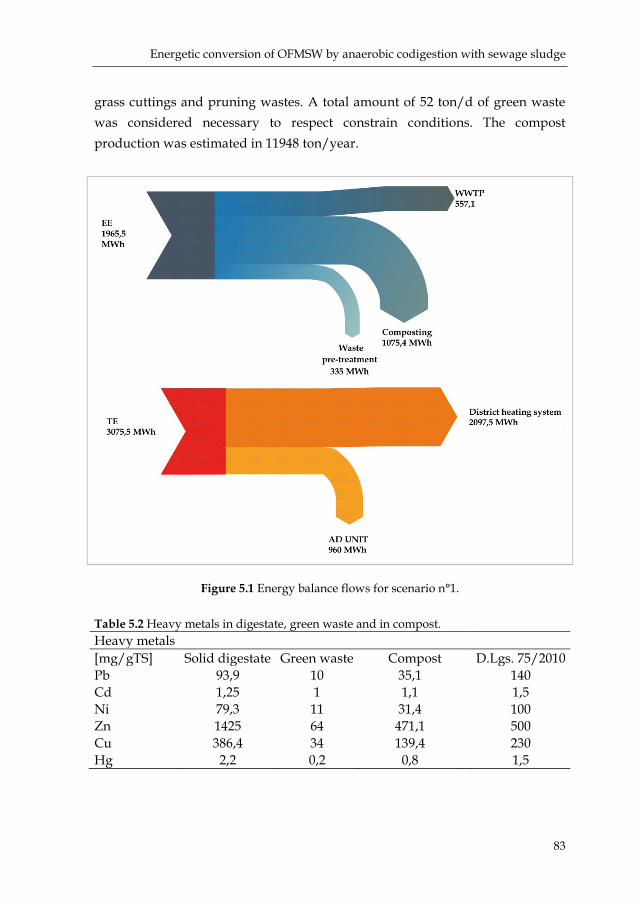
Energetic conversion of OFMSW by anaerobic codigestion with sewage sludge
83
grass cuttings and pruning wastes. A total amount of 52 ton/d of green waste was considered necessary to respect constrain conditions. The compost production was estimated in 11948 ton/year.
Figure 5.1 Energy balance flows for scenario n°1. Table 5.2 Heavy metals in digestate, green waste and in compost. Heavy metals [mg/gTS] Solid digestate Green waste Compost D.Lgs. 75/2010 Pb 93,9 10 35,1
140
Cd 1,25 1 1,1
1,5 Ni 79,3 11 31,4
100
Zn 1425 64 471,1
500 Cu 386,4 34 139,4
230
Hg 2,2 0,2 0,8
1,5

Feasibility study of AcoD plant up-grade
84
5.2.3 Economic evaluation
5.2.3.1 Investment
In table 5.3 the items that compose the total investmet for scenario n°1 are listed. Table 5.3 Total investment of scenario n°1 Item [K€] Civil works
- Pre-treatment shed; - Piping.
400
OFMSW pre-treatment line - Conveyor belts; - Bags opener; - Sieve disc; - Deferizzation unit; - Eddy current separator; - Hydropulper; - Water tank.
800
Up-grade of existing AD reactor - Mixing; - Isolation.
400
Solid digestate fraction treatment: - Centrifuge and Composting plant.
1500
Liquid digestate fraction treatment: - Chemical physical treatment unit.
170
Biogas treatment - Desolforation unit up-grade;
50
Automation and control 30 CHP 250 Technical costs +10%
TOT 3960

Energetic conversion of OFMSW by anaerobic codigestion with sewage sludge
85
5.2.3.2 Economic feasibility
The investment was evaluated calculating the EBITDA (Earnings Before Interest, Taxes, Depreciation and Amortization) and EBIT (Earnings before Interest and Taxes) to define the net income and cash flows over the 20 years. The NPV (net present value), the PB (pay back) and the IRR (internal rate of return) were calculated to evaluate the investment efficiency. The results are listed in table 5.4: the definition of a value ranges is due to the variability accounted for waste treatment contribution tariffs. Table 5.4 Investment parameters for scenario n°1 Investment 3960,00 [K€] Expenses 436,42 [K€/year] Revenues 1537,01÷1773,89 [K€/year] NPV 4735,47÷6477,98 [K€] PB 7÷5 [years] IRR 20÷25 [%]
5.3 SCENARIO 2
Scenario n°2 is based on the synergy of WWTP and waste treatment plant, the feasibility study was build assuming the creation of an integrated waste and wastewater treatment hub. The amount OFMSW treated in this scenario is 22000 ton/year equal to the organic waste collected in all the Udine district in 2012 reported in “Rapporto Rifiuti Urbani 2012” of “Ispra- Istituto Superiore per la Protezione e la Ricerca Ambientale”. It is assumed to realize:
• in the WWTP area: the AD feeding mixture preparation, the AD process and the liquid digestate treatment;
• in the waste treatment plant: the substrate selection and pre-treatment and, after AD process, the solid fraction digestate composting.
Economic and energetic assessment was performed considering the whole hub. It’s necessary to build a new digester to treat the whole amount of OFMSW. To define the optimum reactor volume and operative conditions, mathematical
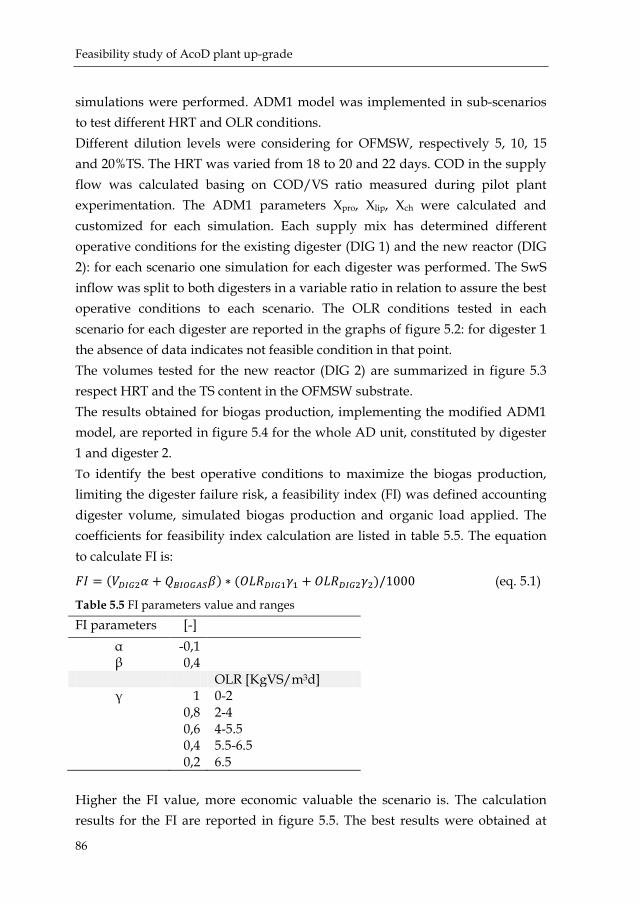
Feasibility study of AcoD plant up-grade
86
simulations were performed. ADM1 model was implemented in sub-scenarios to test different HRT and OLR conditions. Different dilution levels were considering for OFMSW, respectively 5, 10, 15 and 20%TS. The HRT was varied from 18 to 20 and 22 days. COD in the supply flow was calculated basing on COD/VS ratio measured during pilot plant experimentation. The ADM1 parameters Xpro, Xlip, Xch were calculated and customized for each simulation. Each supply mix has determined different operative conditions for the existing digester (DIG 1) and the new reactor (DIG 2): for each scenario one simulation for each digester was performed. The SwS inflow was split to both digesters in a variable ratio in relation to assure the best operative conditions to each scenario. The OLR conditions tested in each scenario for each digester are reported in the graphs of figure 5.2: for digester 1 the absence of data indicates not feasible condition in that point. The volumes tested for the new reactor (DIG 2) are summarized in figure 5.3 respect HRT and the TS content in the OFMSW substrate. The results obtained for biogas production, implementing the modified ADM1 model, are reported in figure 5.4 for the whole AD unit, constituted by digester 1 and digester 2. To identify the best operative conditions to maximize the biogas production, limiting the digester failure risk, a feasibility index (FI) was defined accounting digester volume, simulated biogas production and organic load applied. The coefficients for feasibility index calculation are listed in table 5.5. The equation to calculate FI is:
𝐹𝐼 = (𝑉𝐷𝐼𝐺2𝛼 + 𝑄𝐵𝐼𝑂𝐺𝐴𝑆𝛽) ∗ (𝑂𝐿𝑅𝐷𝐼𝐺1𝛾1 + 𝑂𝐿𝑅𝐷𝐼𝐺2𝛾2)/1000 (eq. 5.1)
Table 5.5 FI parameters value and ranges FI parameters [-]
α -0,1 β 0,4 OLR [KgVS/m3d]
γ 1 0-2 0,8 2-4 0,6 4-5.5
0,4 5.5-6.5 0,2 6.5 Higher the FI value, more economic valuable the scenario is. The calculation results for the FI are reported in figure 5.5. The best results were obtained at

Energetic conversion of OFMSW by anaerobic codigestion with sewage sludge
87
[HRT 18, 10% TS of OFMSW] and at [HRT 20, 15 %TS of OFMSW]. Considering the lower amount of water to use, the option [HRT 20, 15%TS] was chosen.
Figure 5.2 OLR conditins tested in simulation for digester 1 and digester 2.
1820
220,00
2,00
4,00
6,00
8,00
10,00
5 10 15 20
1,92 3,46 1,67 2,96 2,99 2,93
HRT
OLR
[Kgv
s/m
3d]
%TS OFMSW
DIG 1
1820
220
2
4
6
8
10
5 10 15 20
2,27 3,73
6,00
8,83
2,05 3,45 5,40
7,94
1,87 3,13 4,91
7,22
HRT
OLR
[Kgv
s/m
3d]
%TS OFMSW
DIG 2

Feasibility study of AcoD plant up-grade
88
Figure 5.3 Volumes of digester 2 tested in simulations.
Figure 5.4 Simulated biogas production for the whole AD unit.
1820
220
2000
4000
6000
8000
10000
510 15 20 HRT
Vol
ume
[m3]
%TS OFMSW
DIG 2
5
1015
208000
8500
9000
9500
10000
18
20
22%TS OFMSW
Biog
as [m
3/d]
HRT
AD UNIT
8000-8500 8500-9000 9000-9500 9500-10000

Energetic conversion of OFMSW by anaerobic codigestion with sewage sludge
89
Figure 5.5 FI values for the AD unit.
In table 5.6 the operative conditions and the biogas production for each digester in the selected scenario are listed. A daily flow of 72m3 of purified water from WWTP is needed to dilute the OFMSW to 15% of TS content. Table 5.6 Scenario n°2: operative conditions and biogas production Scenario 2 DIG 1 DIG 2 HRT 20 20 [d] Volume 2800 2600 [m3] Qin 140 130 [m3/d] Qin_SwS 90 30 [m3/d] Qin_OFMSW 50 100 [m3/d] TS_in 7,2 12,2 [%] OLR 3,3 5,4 [KgVS/m3d] Q Biogas 3420 5265 [m3/d]
5.3.1 Energy balance
Basing on total biogas production of 8685m3/d, the energy flows were evaluated. To exploit the total amount of biogas for energy production, a new
18
20
22
0
5
10
15
20
5 10 15 20HRT
FI [-
]
%TS OFMSW
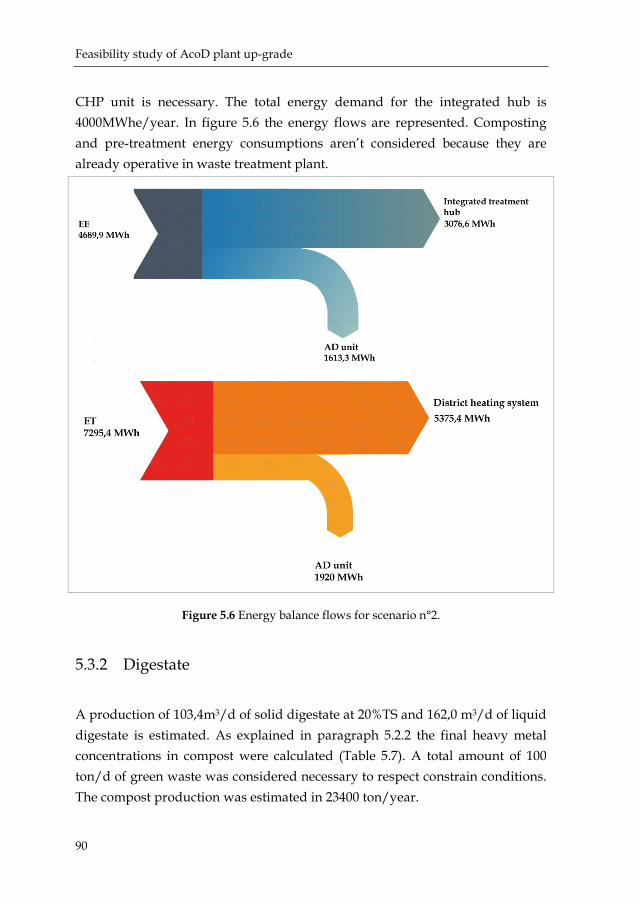
Feasibility study of AcoD plant up-grade
90
CHP unit is necessary. The total energy demand for the integrated hub is 4000MWhe/year. In figure 5.6 the energy flows are represented. Composting and pre-treatment energy consumptions aren’t considered because they are already operative in waste treatment plant.
Figure 5.6 Energy balance flows for scenario n°2.
5.3.2 Digestate
A production of 103,4m3/d of solid digestate at 20%TS and 162,0 m3/d of liquid digestate is estimated. As explained in paragraph 5.2.2 the final heavy metal concentrations in compost were calculated (Table 5.7). A total amount of 100 ton/d of green waste was considered necessary to respect constrain conditions. The compost production was estimated in 23400 ton/year.
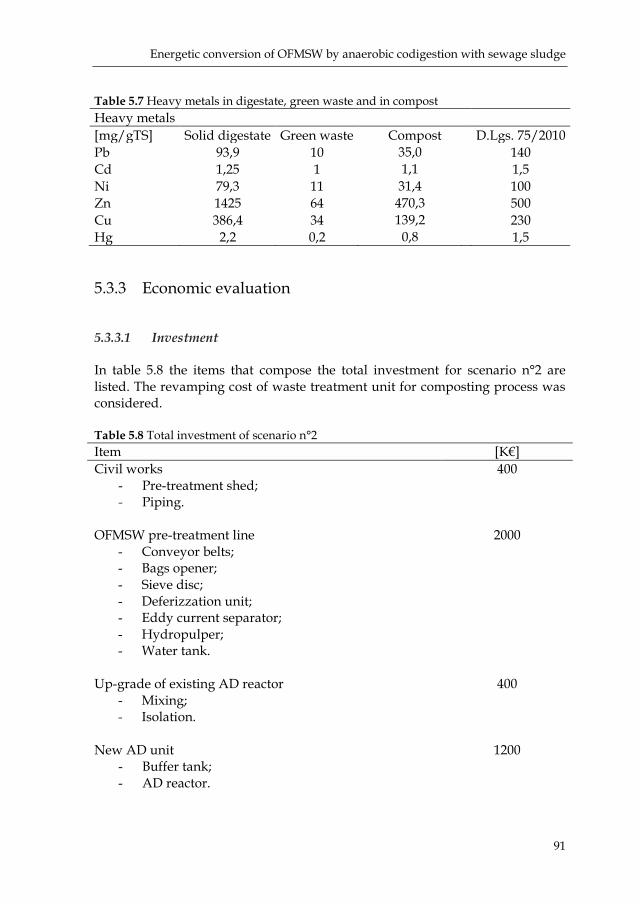
Energetic conversion of OFMSW by anaerobic codigestion with sewage sludge
91
Table 5.7 Heavy metals in digestate, green waste and in compost Heavy metals [mg/gTS] Solid digestate Green waste Compost D.Lgs. 75/2010 Pb 93,9 10 35,0
140
Cd 1,25 1 1,1
1,5 Ni 79,3 11 31,4
100
Zn 1425 64 470,3
500 Cu 386,4 34 139,2
230
Hg 2,2 0,2 0,8
1,5
5.3.3 Economic evaluation
5.3.3.1 Investment
In table 5.8 the items that compose the total investment for scenario n°2 are listed. The revamping cost of waste treatment unit for composting process was considered. Table 5.8 Total investment of scenario n°2
Item [K€] Civil works
- Pre-treatment shed; - Piping.
400
OFMSW pre-treatment line - Conveyor belts; - Bags opener; - Sieve disc; - Deferizzation unit; - Eddy current separator; - Hydropulper; - Water tank.
2000
Up-grade of existing AD reactor - Mixing; - Isolation.
400
New AD unit - Buffer tank; - AD reactor.
1200

Feasibility study of AcoD plant up-grade
92
5.3.3.2 Economic feasibility
The results of the economic evaluation are listed in table 5.9, following the same pattern of scenario n°1 but considering the two treatment plant as an integrated hub. Table 5.9 Investment parameters for scenario n°2 Investment 7040 [K€] Expenses 1283,71 [K€/year] Revenues 3598,82÷4198,82 [K€/year] NPV 11039,14÷15425,06 [K€] PB 6÷4 [years] IRR 24÷30 [%]
5.4 SCENARIOS COMPARISON AND CONCLUSIONS
Scenario n°1 could be a profitable solution considering the substrates amount treated and the PB of the investment. A synergy between the waste treatment plant and WWTP could make this scenario more economically attractive. Scenario n°2 allows to recover the energy need of the WWTP and, partially, of the waste treatment plant. However it requires huge amounts of green waste to make a compost according to law. Both scenarios reveal the availability of extra
Solid digestate fraction treatment: - Centrifuge and Composting plant up-grade.
520
Liquid digestate fraction treatment: - Chemical physical treatment unit.
250
Biogas treatment - Desolforation unit up-grade; - Chiller.
170
Automation and control 60 CHP 1400 Technical costs +10%
TOT 7040
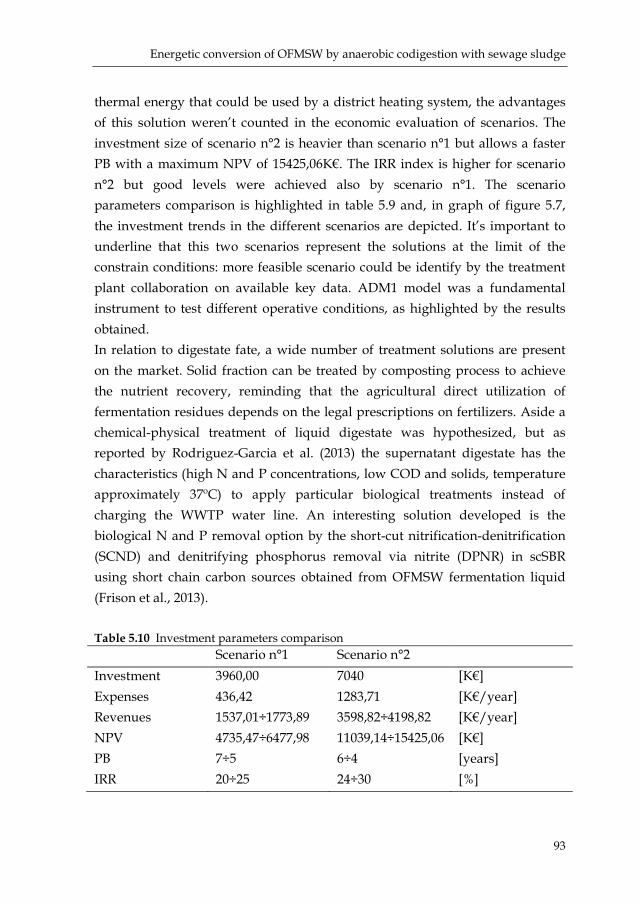
Energetic conversion of OFMSW by anaerobic codigestion with sewage sludge
93
thermal energy that could be used by a district heating system, the advantages of this solution weren’t counted in the economic evaluation of scenarios. The investment size of scenario n°2 is heavier than scenario n°1 but allows a faster PB with a maximum NPV of 15425,06K€. The IRR index is higher for scenario n°2 but good levels were achieved also by scenario n°1. The scenario parameters comparison is highlighted in table 5.9 and, in graph of figure 5.7, the investment trends in the different scenarios are depicted. It’s important to underline that this two scenarios represent the solutions at the limit of the constrain conditions: more feasible scenario could be identify by the treatment plant collaboration on available key data. ADM1 model was a fundamental instrument to test different operative conditions, as highlighted by the results obtained. In relation to digestate fate, a wide number of treatment solutions are present on the market. Solid fraction can be treated by composting process to achieve the nutrient recovery, reminding that the agricultural direct utilization of fermentation residues depends on the legal prescriptions on fertilizers. Aside a chemical-physical treatment of liquid digestate was hypothesized, but as reported by Rodriguez-Garcia et al. (2013) the supernatant digestate has the characteristics (high N and P concentrations, low COD and solids, temperature approximately 37ºC) to apply particular biological treatments instead of charging the WWTP water line. An interesting solution developed is the biological N and P removal option by the short-cut nitrification-denitrification (SCND) and denitrifying phosphorus removal via nitrite (DPNR) in scSBR using short chain carbon sources obtained from OFMSW fermentation liquid (Frison et al., 2013).
Table 5.10 Investment parameters comparison Scenario n°1 Scenario n°2 Investment 3960,00 7040 [K€] Expenses 436,42 1283,71 [K€/year] Revenues 1537,01÷1773,89 3598,82÷4198,82 [K€/year] NPV 4735,47÷6477,98 11039,14÷15425,06 [K€] PB 7÷5 6÷4 [years] IRR 20÷25 24÷30 [%]
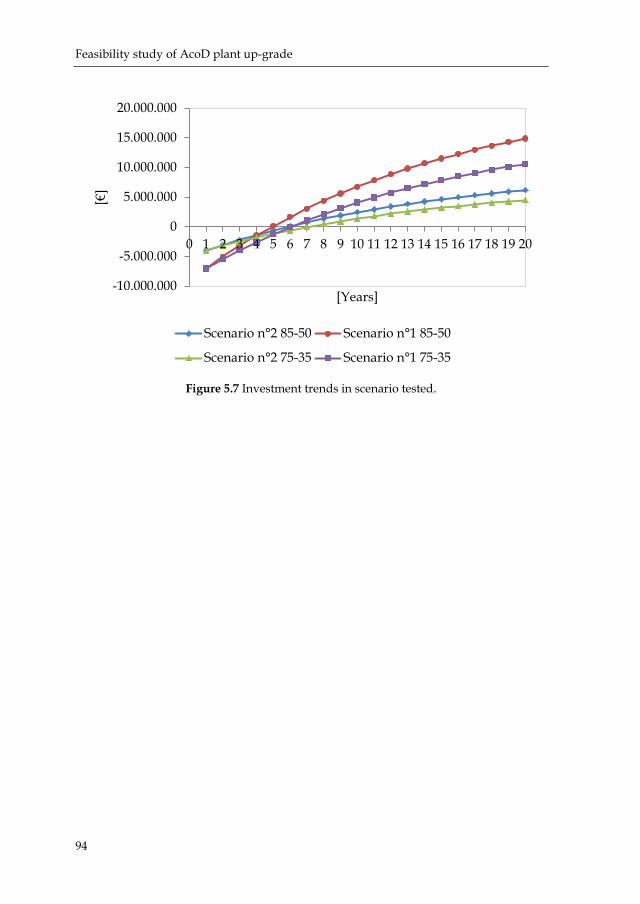
Feasibility study of AcoD plant up-grade
94
Figure 5.7 Investment trends in scenario tested.
-10.000.000
-5.000.000
0
5.000.000
10.000.000
15.000.000
20.000.000
0 1 2 3 4 5 6 7 8 9 10 11 12 13 14 15 16 17 18 19 20
[€]
[Years]
Scenario n°2 85-50 Scenario n°1 85-50
Scenario n°2 75-35 Scenario n°1 75-35
95
Conclusions 6 In this study the analysis of the AD process to optimize an existing plant and design a new one was performed. A multi-level engineering approach was implemented from micro to macro parameters analysis. Every step has highlighted strengths and weaknesses and allowed to define a practical protocol to how define the best process conditions to optimize reactor performances. This protocol can be defined as follow:
• Deep substrate characterization has to be focalized on macromolecular compounds analysis (carbohydrates, proteins, lipids and VFA) and chemical-physical parameters analysis: total COD, soluble COD, TS, VS, TKN, NH4+, pH and alkalinity measurements are mandatory to evaluate the substrate for AD process and to perform COD and nitrogen fractionation. This step implies high lab efforts and a standardized methodology for complex substrate is necessary, nevertheless is essential to obtain reliable data for AD process design.
• BMP tests allow to understand the biomass performance in substrates degradation and to highlight potential inhibition phenomena. The operative conditions of BMP trials, such as mineral medium, trace elements addiction and also the value of ISR, are still under discussion in the scientific community. However complying with the most recent guidelines, comparable results can be obtained. From the results of this study, BMP test can’t be used to calibrate ADM1 model for dynamic simulation but from MPR curves it’s possible to optimize the substrate characterization by mathematical model implementation, as the novel technique of anaerobic respirometry (Giroult et al., 2012).
• Pilot plant experimentation is fundamental to understand the AD process performance under dynamic organic loading conditions: the limits of acceptable operative conditions can be identified. Basing on pilot plant experimental data, ADM1 model can be calibrate to achieve dynamic organic loading simulations. In case of non-conventional
Conclusions
96
substrates or non-conventional operative conditions pilot plant test is mandatory.
• ADM1 modeling allows to test different HRT and OLR scenarios and to define the best operative conditions. ADM1 requires a lot of experimental data and the quality results is strictly linked to substrate characterization. When the ADM1 is calibrated, it can be used in a very wide field of operations: numerous operative scenarios can be tested. It’s fundamental to underline the robustness of this model: due to inhibition pathways described, the AD process failure is hardly forecast by ADM1, engineering control by the user on the results obtained it’s essential for the proper use of the modeling tool.
In relation of obtained results by the applicative case of Udine WWTP, different operative solutions were identified. The SS-OFMSW substrates analysed had highlighted their different characteristics in relation to the source. The OFMSW characterization is highly variable in terms of macromolecular compound, the OFMSW composition can vary widely in relation to the source (Iacovidou et al. 2012). In the entire collection basin several potential sources of SS-OFMSW were identified. To avoid elevate amounts of inerts in the digester feeding mix and high pretreatment costs, an innovative waste management strategy based on SS-OFMSW could be apply. Nevertheless OFMSW delivery and treatment regulations are now a barrier to wastewater management companies to up-grade its facilities: a synergy with waste treatment plant can facilitate legislative procedures. The impact of the different compositions of SS-OFMSW macromolecular compounds was highlighted by BMP tests (Cabbai et al., 2013). As experimental data had confirmed, the mono digestion of SS-OFMSW can be limited by lack of nutrients (N, P and metals) and by VFAs inhibition phenomena (Iacovidou et al., 2012). Moreover, light metal ions are present in many type of food waste and, at high concentrations, can cause toxicity in AD process due to osmosis effect. The AcoD process of sewage sludge and OFMSW can benefit of trace elements carried by sewage sludge, smoothing the inhibition risk. AcoD performances were tested in batch trials and verified in CSTR regime by pilot plant experimentation: after the pilot plant start-up the different phases tested allowed to understand the biomass behaviour switching to AcoD and the

Energetic conversion of OFMSW by anaerobic codigestion with sewage sludge
97
response to an increasing OLR. Process monitoring was fundamental to achieve a good pilot plant start-up and process experimentation management: early indicators like VFAs concentrations, FOS/TAC ratio were constantly controlled: no inhibition or instability phenomena were detected. The feeding strategy adopted was affected by large fluctuation in SwS TS content that led to variable OLR application: in relation to process stability achieve, this may have determined a positive effect on microbial community selection. Digestate quality was monitored and experimental data were crucial for develop feasibility scenario of full-scale AD reactor up-grade. ADM1 model application has allowed to investigate a large set of AcoD implementation scenarios for the full-scale AD unit as a part of WWTP or a part of an integrated waste and waste water treatment hub. ADM1 can be used to determine both optimal reactor design and process control but, as a very robust model, a heavy OLR has to be applied to predict the AD reactor collapse (Jeppsson U., 2007). Different problematic technical aspects are still to be solved: from the definition of a clear applicative procedure to the limited use of the single composite state variable Xc. The feasibility study conducted, based on experimental results, has allowed to evaluate the two scenarios for AD full-scale up-grade. The investment size and management solutions are very different but both respect the conditions for an attractive investment from economical and environmental point of view. Final compost quality was checked by calculations according to Italian law. The liquid digestate fate is an open point and different treatment and use can be further evaluated. AcoD of OFMSW and sewage sludge could become a strategic and cross-sectorial solution based on water industry and waste management synergy where the necessary infrastructures and human resources could be provided (Iacovidiu et al., 2012). A holistic approach to waste and waste water treatment can drag the waste management to more sustainable solutions. Collaboration of all stakeholders can have a direct impact on the application of this technology to overcome the entry barriers. The OFMSW quality in terms of low levels of impurities (<10%) is mandatory for the AD reactors operations. The digestate management must involve the entire supply chain until the farmer use of the final product. Biogas can be used for energy production directly in CHP units or by injection in methane grid or as transport fuel.

Conclusions
98
The solutions, evaluated in this study, are based on CHP adoption and allow to increase the local renewable energy production with benefit for the local community by the potential construction of a district heating system and the application of low public service taxes, thanks to economic benefits guaranteed by the new AD unit.
99
References Alatriste-Mondragón F., Samar P., Cox H.H.J., Ahring B.K., Iranpour R., 2006. Anaerobic codigestion of municipal farm and industrial organic wastes: a survey of recent literature. Water Environ. Res. 78 (6), 607-636. Aldin S., Elbeshbishy E., Nakhla G., Ray M. B. 2010. Modelling the effect of sonication on the anaerobic digestion of biosolids. Energ. Fuel., 24(9), 4703-4711. Angelidaki I., Sanders W., 2004. Assessment of the anaerobic biodegradability of macropollutants. Rev. Environ. Sci. Biotechnol. 3, 117-129. Angelidaki I., Alves M., Bolzonella D., Borzacconi L., Campos J.L., Guwy A.J., Kalyuzhnyi S., Jenicek P., Van Lier J.B., 2009. Defining the biomethane potential (BMP) of solid organic wastes and energy crops: a proposed protocol for batch assays. Water Sci. Technol. 59 (5), 927-934. APHA, 2005. Standard Methods for the Examination of Water and Wastewater, 21st edition. American Public Health Association, America Water Works Association, Water Environment Federation, Washington DC. Astals S., Esteban-Gutiérrez M., Fernández-Arévalo T., Aymerich E., García-Heras J.L., Mata-Alvarez J. 2013. Anaerobic digestion of seven different sewage sludges: A biodegradability and modelling study. Water Res. 47 (16), 6033-6043. Banks C.J., Chesshire M., Heaven S., Arnold R., 2011a. Anaerobic digestion of source-segregated domestic food waste: Performance assessment by mass and energy balance. Bioresour. Technol. 102, 612-620.

References
100
Banks C., Chesshire M., Heaven S., Arnold R., Lewis L. 2011b. Biocycle anaerobic digester: performance and benefits. Waste and Resource Management 164,WR3. Batstone D.J., Keller J., Angelidaki I., Kalyuzhnyi S.V., Pavslostathis S.G., Rozzi A., Sanders W.T.M., Siegrist H., Vavilin V.A., Garcia de las Heras J.L., Lyberatos G., Pullammanappallil P., 2002. Anaerobic Digestion model No.1 (ADM1). IWA publishing, London. Batstone D.J., Tait S., Starrenburg D. 2009. Estimation of hydrolysis parameters in full-scale anaerobic digesters. Biotechnol. Bioeng. 102 (5), 1513-1520. Batstone D.J., 2013. Modeling and control in anaerobic digestion: achievements and challenges. Proceeding of 13th World Congress on Anaerobic Digestion, Santiago de Compostela. Bolzonella D., Battistoni P., Susini C., Cecchi F., 2006. Anaerobic digestion of waste activated sludge and OFMSW: the experiences of Viareggio and Treviso plants (Italy). Water Sci. Technol. 53 (8), 203-211. Buffiere P., Loisel D., Bernet N., Delgenes J-P., 2006. Toward new indicators for the prediction of solid waste anaerobic digestion properties. Water Sci. Technol. 53 (8), 233-241. Cabbai V., Ballico M., Aneggi E., Goi D., 2013. BMP tests of sorce selected OFMSW to evaluate anaerobic codigestion with sewage sludge. Waste manage. 33, 1626-1632. Caffaz S., Bettazzi E., Scaglione D., Lubello C., 2008. An integrated approach in a municipal WWTP: anaerobic codigestion of sludge with organic waste and nutrient removal from supernatant. Water Sci. Technol. 58 (3), 669-676. Capela I., Rodrigues A., Silva F., Nadais H., Arroja L., 2008. Impact of industrial sludge and cattle manure on anerobic digestion of the OFMSW under mesophilic conditions. Biomass Bioenerg. 32, 245-251.

Energetic conversion of OFMSW by anaerobic codigestion with sewage sludge
101
Cavinato C., Bolzonella D., Pavan P., Fatone F., Cecchi F. 2013. Mesophilic and thermophilic anaerobic co-digestion of waste activated sludge and source sorted biowaste in pilot- and full-scale reactors. Renew. Energ. 55, 260-265. Chen Y., Cheng J.J., Creamer K.S., 2008. Inhibition of anaerobic digestion process: A review. Bioresour. Technol. 99, 4044-4064. Cho J.K., Park S.C., Chang H.N., 1995. Biochemical methane potential and solid-state anaerobic-digestion of Korean food wastes. Bioresour. Technol. 52 (3), 245-253. Copp J.B., Jeppsson U., Rosen C., 2003. Towards an ASM1-ADM1 state variable interface for plant-wide wastewater treatment modeling. WEFTEC 2003. Los Angeles, CA, USA. Davidsson A., Gruvberger, C., Christensen, T.H., Hansen, T.H., Jansen, J.l.C., 2007. Methane yield in source-sorted organic fraction of municipal solid waste. Waste Manage. 27, 406-414. De Gracia M., Huete E., Beltrán S., Grau P., Ayesa E., 2011. Automatic characterization of primary, secondary and mixed sludge inflow in terms of mathematical generalized sludge digester model. Water Sci. Technol., 64(3), 557-567. De Vrieze J., De Lathuwer L., Verstraete W., Boon N., 2013. High-rate iron-rich activated sludge as stabilizing agent for the anaerobic digestion of kitchen waste. Water Res. 47, 3732-3741. Donoso-Bravo A., Guzmán G., Pérez-Elvira S., Fdz-Polanco F., 2011a. Initial rates technique as a procedure to predict the anaerobic digester operation. Biochem. Eng. J., 53, 275-280. Donoso-Bravo A., Mailier J., Martin C., Rodríguez J., Aceves-Lara C. A., Wouwer A.V., 2011b. Model selection, identification and validation in anaerobic digestion: A review. Water Res., 45, 5347-5364.
References
102
D’Orlandi S., 2012. Impianto pilota per la codigestione anaerobica dei fanghi di depurazione e FORSU. Tesi di laurea. Università degli Studi di Udine. Dubuois M., Gilles K.A., Hamilton J.K., Rebers P.A., Smith F., 1956. Colorimetric method for determination of sugars and related substances. Anal. Chem. 28, 350-356. Edelmann W., Engeli H., Gradenecker M., 2000. Co-digestion of organic solid waste and sludge from sewage treatment. Water Sci. Technol. 41 (3), 213-221. El-Mashad, H.M., Zhang, R., 2010. Biogas production from co-digestion of dairy manure and food waste. Bioresour. Technol. 101 (3), 4021-4028. Eskicioglu C., Ghorbani M., 2011. Effect of inoculum/substrate ratio on mesophilic anaerobic digestion of bioethanol plant whole stillage in batch mode. Process. Biochem. 46, 1682-1687. Facchin V., Cavinato C., Fatone F., Pavan P., Cecchi F., 2013. Effect of trace element supplementation on the mesophilic anaerobic digestion of food waste in batch trials: The influence of inoculum origin. Biochem. Eng. J. 70, 71-77. Frison N., Di Fabio S., Cavinato C., Pavan P., Fatone F., 2013. Best available carbon sources to enhance the via-nitrite biological nutrients removal from supernatants of anaerobic co-digestion. Chem.Eng.J. 215-216, 15-22. Ge H., Zhang L., Batstone D.J., Keller J, Youn Z., 2013. Impact of iron salt dosage to sewers on downstream anaerobic sludge digesterd: sulphide control and methane production. J. Environ. Eng. 139, 594-601. Giroult R., Rousseau P., Steyer J.P., Bernet N, Béline F., 2011. Combination of batch experiments with continuous reactor data for ADM1 calibration. application to anaerobic digestion of pig slurry. Water Sci. Technol., 63(11), 2575-2582.
Energetic conversion of OFMSW by anaerobic codigestion with sewage sludge
103
Giroult R., Bridoux G., Nauleau F., Poullain C., Buffet J., Steyer J.-P., Sadowski A.G., Bélin F., 2012. A waste characterisation procedure for ADM1 implementation based on degradation kinetics. Water Res. 46, 4099-4110. Gómez X., Cuestos M.J., Cara J., Morán A., García A.I., 2006. Anaerobic co-digestion of primary sludge and the fruit and vegetable fraction of the municipal solid waste Conditions for mixing and evaluation of the organic loading rate. Renew. Energ. 31, 2017-2024. Gomez-Lahoz, C., Fernández-Giménez, B., Garcia-Herruzo, F., Rodriguez-Maroto, J.M., Vereda-Alonso, C., 2007. Biomethanization of mixtures of fruits and vegetables solid wastes and sludge from a municipal wastewater treatment plant. J. Environ. Sci. Heal. A 42, 481-487. Gunaseelan V.N., 2007. Regression models of ultimate methane yield of fruits and vegetable solid wastes, sorghum and napiergrass on chemical composition. Bioresour. Technol. 98, 1270-1277. Henze M., Grady C.P.L., Gujer W., Marais G.V.R., Matsuo T., 1987. Activated Sludge Model No.1. IWA publishing, London. Huete E., De Gracia M., Ayesa E., Garcia-Heras J.L., 2006. ADM1-based methodology for characterization of the influent sludge in anaerobic reactors. Water Sci. Technol., 54(4), 157-166. Huyard A., Treillon T., Beagrand A., Lebars F., Dubrous B., Camacho P. 2013. .Anaerobic co-digestion of wastewaters sludges and a food waste pulp from a “unpacking” process: enhancement of biogas production and co-metabolism. Proceeding of 13th World Congress on Anaerobic Digestion, Santiago de Compostela. Iacovidou, E., Ohandja, D.G., Voulvoulis, N., 2012. Food waste co-digestion with sewage sludge – Realising its potential in the UK. J. Environ. Manage. 112, 267-274.

References
104
Jeppsson U., 2007. Investigation of anaerobic digestion alternatives for Henrikdal’s WWTP – supplemen. Lund University. Jiang, Y., Heaven, S., Banks, C.J., 2012. Strategies for stable anaerobic digestion of vegetable waste. Renew. Energ. 44, 206-214. Kim H-W., Han S-K., Shin H-S., 2003. The optimisation of food waste addition as a co-substrate in anaerobic digestion of sewage sludge. Waste Manage. Res. 21 (6), 515-526. Waste Manage. Res. 21 (6), 515-526. Kim H-W., Nam J-Y., Shin H-S., 2011. A comparison study on the high-rate co-digestion of sewage sludge and food waste using a temperature-phased anaerobic sequencing batch reactor system. Bioresour. Technol. 102, 7272-7279. Kleerebezem R., Van Loosdrecht M.C.M., 2006. Waste characterization for implementation in ADM1 Water Sci. Technol. 54(4), 167-174. Labatut R.A., Angenent L., Scott N.R., 2011. Biochemical methane potential and biodegradability of complex organic substrates. Bioresour. Technol. 102, 2255-2264. Lauwers J., Appels L., Thompson I.P., Degrève J., Van Impe J.F., Dewil R., 2013. Mathematical modelling of anerobic digestion of biomass and waste: Power and limitations. Pro. Energ. Combust. 39, 383-402. Lesteur M., Bellon-Maurel V., Gonzalez. C., Latrille E., Roger J.M., Junqua G., Steyer J.P., 2010. Alternative methods for determining anaerobic biodegradability: A review. Process. Biochem. 45, 431-440. Li C., Champagne P., Anderson B.C., 2011. Evaluating and modeling biogas production from municipal fat, oil, and grease and synthetic kitchen waste in anaerobic co-digestions. Bioresour. Technol. 102, 9471-9480.

Energetic conversion of OFMSW by anaerobic codigestion with sewage sludge
105
Lissens G., Thomsen A.B., De Baere L., Verstraete W., Ahring B.K., 2004. Thermal wet oxidation improves anaerobic biodegradability of raw and digested biowaste. Environ. Sci. Technol. 38 (12), 3418-3424. Liu G., Zhang R., El-Mashad H., Dong R., 2009. Effect of feed to inoculum ratio on biogas yields of food and green wastes. Bioresour. Technol. 100, 5103-5108. Liu X., Gao X., Wang W., Zheng L., Zhou Y., Sun Y., 2012a. Pilot-scale anaerobic co-digestion of municipal biomass waste: Focusing on biogas production and GHG reduction. Renew. Energ. 44, 463-468. Liu X., Wang W., Shi Y., Shi Y., Zheng L., Gao X., Qjao W., Zhou Y., 2012b. Pilot-scale anaerobic co-digestion of municipal biomass waste and waste activated sludge in China: Effect of organic loading rate. Waste Manage. 32, 2056-2060. Makinia J., 2010. Mathematical modelling and computer simulation of activated sludge systems. IWA Publishing, London. Mata-Alvarez J., Dosta J., Macé S., Astals S., 2011. Codigestion of solid wastes: A review of its uses and perspectives including modelling. Crit. Rev. Biotechnol. 31 (2), 99-111. Murto M., Björnsson L., Mattiasson B., 2004. Impact of food industrial waste on anaerobic co-digestion of sewage sludge and pig manure. J. Environ. Manage. 70, 101-107. Neves L., Gonçalo E., Oliveira R., Alves M.M., 2008. Influence of composition on the biomethanation potential of restaurant waste at mesophilic temperatures. Waste Manage. 28, 965-972. Nopens I., Batstone D.J., Copp J.B., Jeppsson U., Volke E., Alex J., Vanrolleghem P.A., 2009. An ASM/ADM model interface for dynamic plant-wide simulation. Water Res., 43, 1913-1923.

References
106
Owens J.M., Chynoweth D.P., 1993. Biochemical methane potential of municipal solid-waste (MSW) components.Water Sci. Technol. 27 (2), 1-14. Ozkan-Yucel U.G., Gökçay C.F., 2010. Application of ADM1 model to a full-scale anaerobic digestr under dynamic organic loading conditions. Environ. Technol., 31 (6), 633-640. Parker W. J. (2005). Application of the ADM1 mdoel to advanced anaerobic digestion. Bioresour. Technol., 96, 1832-1842. Ponsá S., Gea T., Sánchez A., 2011. Anaerobic co-digestion of the organic fraction of municipal solid-waste with several pure organic substrates. Biosystems Eng.. 108, 352-360. Rajagopal R., Massé D.I., Singh G., 2013. A critical review on inhibition of anaerobic digestion process by excess ammonia. Bioresour. Technol.143, 632-641. Raposo F., Fernández-Cegrì V., De la Rubia M.A., Borja R., Béline F., Cavinato C., Demirer G., Fernández B., Fernández-Polanco M., Frigon J.C., Ganesh R., Kaparaju P., Koubova J., Méndez R., Menin G., Peene A., Scherer P., Torrijos M., Uellendahl H., Wierinckm I., De Wilde V., 2011a. Biochemical methane potential (BMP) of solid organic substrates: evaluation of anaerobic biodegradability using data from an international interlaboratory study. J. Chem. Technol. Biotechnol. 86, 1088–1098. Raposo F., De la Rubia M.A., Fernández-Cegrì V., Borja R., 2011b. Anaerobic digestion of solid organic substrates in batch mode: An overview relating to methane yields and experimental procedures. Renew. Sust. Energ. Rev. 16, 861-877. Raposo F., Fernández-Cegri V., Borja R., Mumme J., Cachho J.A., Rodríguez D.C., Kaparaju P., Scherer p., Noguerol J., Dumas C., Nielfa A., García-Mancha N., Méndez R., Picard S., Esteves S., Vermeulen J., Cavinato C., Orupõld K., Aymerich E., Di Berardino S., 2013. Control of VFAs in anaerobic reactors: Is it an easy task? What do we know about off-line analytical performance?.

Energetic conversion of OFMSW by anaerobic codigestion with sewage sludge
107
Proceeding of 13th World Congress on Anaerobic Digestion, Santiago de Compostela. Reichert P. (1994). AQUASIM - A tool for simulation and data analysis of aquatic systems. Water Sci. Tech., 30(2), 21-30, 1994. Rieger L., Gillot s., Langergraber G., Ohtsuki T., Shaw A., Takács I., Winkler S., 2013. Guidelines for using activated sludge models. IWA publishing, London. Righi S., Oliviero L., Pedrini M., Buscaroli A., Della Casa C., 2013. Life Cycle Assessment of management systems for sewage sludge and food waste: centralized and decentralized approaches. J. of clean. Prod. 44, 8-17. Rintala J.A., Järvinen K.T., 1996. Full-scale mesophilic anaerobic co-digestion of municipal solid waste and sewage sludge: methane production characteristics. Waste Manage. Res. 14,163-170. Rizzardini C., Goi D., 2013. Project: sewage sludge revalue. DCFA, University of Udine. Rodriguez-Garcia G., Frison N., Vazquez-Padin J.R., Hospido A., Garrido J., Fatone F., Bolzonella D., Moreira M.T., Feijoo G., 2013. Environmental burdens of nutrient removal technologies for the treatment of anaerobic digestion supernatant and its integration in a sewage treatment plant. Proceeding of 13th World Congress on Anaerobic Digestion, Santiago de Compostela. Rosen C., Vrecko D., Gernaey K.V., Pons M.N., Jeppsson U., 2006. Implementing ADM1 for plant-wide benchmark simulations in Matlab/Simulink. Water Sci. Tech. 54(4), 11-19. Scaglione D., Caffez S., Ficara E., Malpei F., Lubello C., 2008. A simple method to evaluate the short-term biogas yield in anaerobic codigestion of WAS and organic wastes. Water Sci. Technol. 55 (8), 1615-1621.
References
108
Shanmugam P., Horan N.J., 2009. Simple and rapid methods to evaluate methane potential and biomass yield for a range of mixed solid waste. Bioresour. Technol. 100 (1), 471-474. Sosnowsky P., Wieczorek A., Ledakowick S., 2003. Anaerobic co-digestion of sewage sludge and organic fraction of municipal solid wastes. Adv. Environ. Res. 7, 609-616. Sosnowski, P., Klepacz-Smolka, A., Kaczorek, K., Ledakowicz, S, 2008. Kinetic investigations of methane co-fermentation of sewage sludge and organic fraction of municipal solid waste. Bioresour. Technol. 99, 5731-5737. Souza T.S.O. Carvajal A., Donoso-Bravo A., Peña M., Fdz-Polanco F., 2013. ADM1 calibration using BMP tests for modelling the effect of autohydrolysis pretreatment on the performance of continuos sludge digesters. Water Res. 47, 3244-3254. Stroot P.G., McMahon K., Mackie R.I., Raskin L., 2001. Anaerobic codigestion of municipal solid waste and biosolids under various mixing conditions-I.Digester performance. Water Res. 35 (7), 1804-1816. Yasui H., Sugimoto M., Komatsu K., Goel R., Li Y.Y., Noike T., 2006. An approach for substrate mapping between ASM and ADM1 for sludge digestion. Water Sci. Tech. 54(4), 83-92. Yasui H., Komatsu K., Goel R., Li Y.Y., Noike T., 2008. Evaluation of state variable interface between the Activated Sludge Models and Anaerobic Digestion Model no 1. Water Sci. Tech. 57(6), 901-907. Yoshida H., Gable J.J., Park J.K., 2012. Evaluation of organic waste diversion alternatives for greenhouse gas reduction. Resour. Conserv. Recy. 60,1-9. Zaher U., Buffiere P., Steyer J.P., Chen S., 2009. A procedure to estimate proximate analysis of mixed organic wastes. Water Environ. Res., 81(4), 407-414.

Energetic conversion of OFMSW by anaerobic codigestion with sewage sludge
109
Zhang Y., Banks C., Heaven S., 2012. Anaerobic digestion of two biodegradable municipal waste streams. J. Environ. Manage. 104, 166-174. Zitomer D.H., Adhikari P., Heisel C., Dineen D., 2008. Municipal anaerobic digesters for codigestion, energy recovery, and greenhouse gas reductions. Water Environ. Res. 80 (3), 229-237. Zupančic G.D., Uranjek-Ževart N., Roš M., 2008. Full-scale anaerobic co-digestion of organic waste and municipal sludge. Biomass Bioenerg. 32, 162-167.

References
110

111
APPENDIX Basing on experimental results obtained by BMP tests (chapter 2) for substrate from restaurant waste, where yeast residues were observed and higher methane production was registered, BMP tests to evaluate a possible pre-hydrolysis action of yeast on OFMSW substrate were performed. BMP tests were conducted following the same experimental procedure described in chapter 2. An ISR of 3 was used. A sourdough sample from the bread production and OFMSW from a canteen were collected. Pre-treatment were performed on 500gr of grinded OFMSW adding fixed amounts of yeast (25gr and 50gr) at 32°C storage temperature, achieved by an incubator. The pre-treatment duration was of 24 hours. Blank references samples were considered. Samples were defined as follow:
• OFMSW storage, without yeast, at 4°C (OFMSW_4); • OFMSW storage, without yeast, at 32°C (OFMSW_32); • OFMSW storage at 32°C with 25gr of yeast (OFMSW_32_25); • OFMSW storage at 32°C with 50gr of yeast (OFMSW_32_50).
After pre-treatment, OFMSW samples were diluted to 5%TS and shredded by kitchen mixer to obtain a substrate size <10mm. Soluble COD was measure in each pre-treated sample, with the results reported in the following table:
Sample OFMSW_4 OFMSW_32 OFMSW_32_25 OFMSW_32_50 CODs [mg/l] 15520 16520 17740 19940
Increment respect
OFMSW_4 +6,44 +14,30 +28,48
It’s possible to observe the slight increment of the sample maintained at 32°C without yeast, due to hydrolysis action performed by bacteria already present in substrates. In sample treated with yeast, after 24 hours, a visible rising effect was registered. The soluble COD increase was near the 30% for OFMSW_32_50.

Appendix
112
Blank and the 4 trials BMP tests were performed in triplicate. The results are depicted in the following figure.
The final accumulated volume of each trial is reported in the following graph.
Data were used to make a comparison to understand the effectiveness of biological pre-treatment with yeast. From OFMSW_32 to OFMSW_4 an increase of 9% on methane production was registered. OFMSW_32_50 has highlighted a growth of 18,8% respect OFMSW_4, but only of 9% respect OFMSW_32. The increase of OFMSW_32_25 respect OFMSW_32 wasn’t appreciable (0,9%). Data from this trial could encourage a possible pre-treatment base on yeast action, but several conditions have to be tested (for example with larger amounts of yeast) before drawing conclusions.
0,0
100,0
200,0
300,0
400,0
500,0
600,0
700,0
800,0
1 3 5 7 9 11 13 15 17 19 21 23 25 27 29 31 33 35
Acc
umul
ated
vol
ume
of m
etha
ne [N
ml]
[Days] BLANK OFMSW_4 OFMSW_32 OFMSW_32_25 OFMSW_32_50
635,4
692,4 698,8
754,9
560,0
600,0
640,0
680,0
720,0
760,0
800,0
OFMSW_4 OFMSW_32 OFMSW_32_25 OFMSW_32_50
Acc
umul
ated
vol
ume
of
met
hane
[Nm
l]