learning to operate anaerobic bioreactors - formatex · in the case of the anaerobic ... anaerobic...
TRANSCRIPT
Learning to Operate Anaerobic Bioreactors
A. Franco, A. Mosquera-Corral, J.L. Campos, E. Roca* Department of Chemical Engineering, School of Engineering, University of Santiago de Compostela, Lope Gómez de Marzoa s/n, 15782 Santiago de Compostela, Spain This chapter describes the main parameters and the different techniques used to characterize an anaerobic bioreactor and how to apply the obtained information to learn how to operate it. In this kind of biological systems, the large number of processes, operating parameters and removed compounds involved makes necessary to combine knowledge from both Microbiology and Chemical Reactor Engineering. The main difficulties encountered on the operation (start-up, operation) of anaerobic reactors are commented. In each part, the pertinent measurements for improving the bioreactor performance in practice are introduced.
Keywords, Anaerobic digestion, bioreactor operation, microbial populations, wastewater treatment
1. Introduction
The treatment of industrial wastewaters can be carried out by either aerobic or anaerobic biological processes. To carry out an aerobic process, air must be continuously supplied to convert 50% of the organic matter compounds, measured as Chemical Oxygen Demand (COD), into CO2 and 50% into sludge which is a waste product requiring large investments for disposal. In the case of the anaerobic process 90% of the COD is converted, in absence of oxygen, into biogas containing methane (CH4), which can be used as fuel, and in advantage only very little COD is converted into sludge. Nevertheless, this process must be operated at temperatures around 35 °C increasing costs of energy consumption. The anaerobic process is then recommended for the treatment of high concentrated wastewater since the amount of methane generated can compensate the energetic cost to maintain the temperature of the bioreactor. Anaerobic digestion is a naturally occurring biological process by which organic matter compounds are broken down to simple components under anaerobic conditions. Anaerobic micro-organisms digest the organic materials to produce biogas containing methane and carbon dioxide as end-products [1, 2]. The biogas produced in the anaerobic bioreactor usually contains small amounts of hydrogen sulphide (SH2) and ammonia (NH3), as well as trace amounts of other gases. Anaerobic digestion is a complex process which comprises three main steps (Fig.1): hydrolysis, acidogenesis and methanogenesis [3]. During hydrolysis, the fermentative bacteria convert the insoluble complex organic matter compounds into soluble molecules such as volatile fatty acids (VFA), amino acids and sugars. The complex polymeric compounds are hydrolyzed to monomers. In the second stage, acetogenic bacteria, also known as acid formers, convert the products from the first stage into simple organic acids, carbon dioxide and hydrogen. The main compounds produced are acetic, propionic and butyric acids and ethanol. Finally, methane is produced during methanogenesis by bacteria called methane formers in two ways: a.- by means of cleavage of two acetic acid molecules to generate carbon dioxide and methane; or b.- by reduction of carbon dioxide with hydrogen. Usually the first reaction is the preferred one. The anaerobic digestion is a biological process involving many different types of micro-organisms in a tight syntrophic relationship, where the production of methane gas is the slowest and most sensitive step. For this reason, specific environmental conditions (temperature and pH) must be maintained for the
* Corresponding author: e-mail: [email protected], Phone: +34 981563100
618
Communicating Current Research and Educational Topics and Trends in Applied Microbiology A. Méndez-Vilas (Ed.)_____________________________________________________________________
©FORMATEX 2007
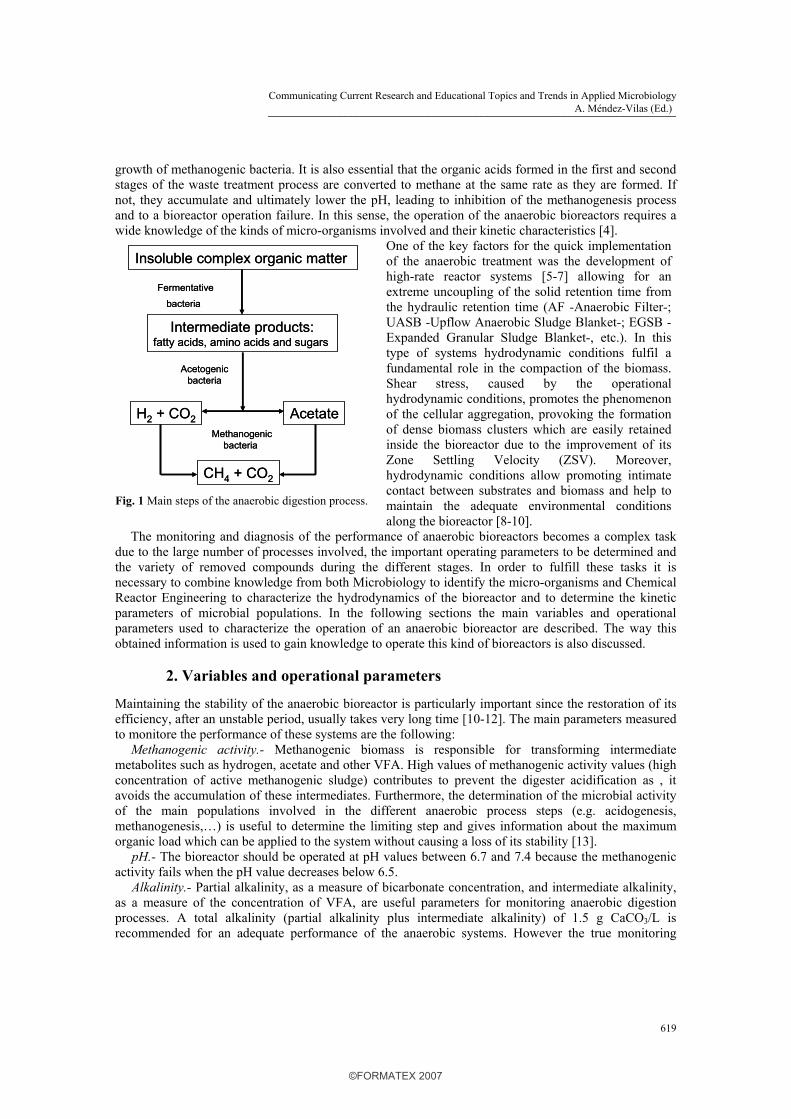
growth of methanogenic bacteria. It is also essential that the organic acids formed in the first and second stages of the waste treatment process are converted to methane at the same rate as they are formed. If not, they accumulate and ultimately lower the pH, leading to inhibition of the methanogenesis process and to a bioreactor operation failure. In this sense, the operation of the anaerobic bioreactors requires a wide knowledge of the kinds of micro-organisms involved and their kinetic characteristics [4].
Insoluble complex organic matter
Fermentative
bacteria
Intermediate products:fatty acids, amino acids and sugars
Acetogenicbacteria
AcetateMethanogenic
bacteria
CH4 + CO2
H2 + CO2
Insoluble complex organic matter
Fermentative
bacteria
Intermediate products:fatty acids, amino acids and sugars
Acetogenicbacteria
AcetateMethanogenic
bacteria
CH4 + CO2
H2 + CO2
Fig. 1 Main steps of the anaerobic digestion process.
One of the key factors for the quick implementation of the anaerobic treatment was the development of high-rate reactor systems [5-7] allowing for an extreme uncoupling of the solid retention time from the hydraulic retention time (AF -Anaerobic Filter-; UASB -Upflow Anaerobic Sludge Blanket-; EGSB -Expanded Granular Sludge Blanket-, etc.). In this type of systems hydrodynamic conditions fulfil a fundamental role in the compaction of the biomass. Shear stress, caused by the operational hydrodynamic conditions, promotes the phenomenon of the cellular aggregation, provoking the formation of dense biomass clusters which are easily retained inside the bioreactor due to the improvement of its Zone Settling Velocity (ZSV). Moreover, hydrodynamic conditions allow promoting intimate contact between substrates and biomass and help to maintain the adequate environmental conditions along the bioreactor [8-10].
The monitoring and diagnosis of the performance of anaerobic bioreactors becomes a complex task due to the large number of processes involved, the important operating parameters to be determined and the variety of removed compounds during the different stages. In order to fulfill these tasks it is necessary to combine knowledge from both Microbiology to identify the micro-organisms and Chemical Reactor Engineering to characterize the hydrodynamics of the bioreactor and to determine the kinetic parameters of microbial populations. In the following sections the main variables and operational parameters used to characterize the operation of an anaerobic bioreactor are described. The way this obtained information is used to gain knowledge to operate this kind of bioreactors is also discussed.
2. Variables and operational parameters
Maintaining the stability of the anaerobic bioreactor is particularly important since the restoration of its efficiency, after an unstable period, usually takes very long time [10-12]. The main parameters measured to monitore the performance of these systems are the following: Methanogenic activity.- Methanogenic biomass is responsible for transforming intermediate metabolites such as hydrogen, acetate and other VFA. High values of methanogenic activity values (high concentration of active methanogenic sludge) contributes to prevent the digester acidification as , it avoids the accumulation of these intermediates. Furthermore, the determination of the microbial activity of the main populations involved in the different anaerobic process steps (e.g. acidogenesis, methanogenesis,…) is useful to determine the limiting step and gives information about the maximum organic load which can be applied to the system without causing a loss of its stability [13]. pH.- The bioreactor should be operated at pH values between 6.7 and 7.4 because the methanogenic activity fails when the pH value decreases below 6.5. Alkalinity.- Partial alkalinity, as a measure of bicarbonate concentration, and intermediate alkalinity, as a measure of the concentration of VFA, are useful parameters for monitoring anaerobic digestion processes. A total alkalinity (partial alkalinity plus intermediate alkalinity) of 1.5 g CaCO3/L is recommended for an adequate performance of the anaerobic systems. However the true monitoring
619
Communicating Current Research and Educational Topics and Trends in Applied Microbiology A. Méndez-Vilas (Ed.)_____________________________________________________________________
©FORMATEX 2007

parameter used is the intermediate alkalinity to total alkalinity ratio which must be maintained lower than 0.3-0.4 [9]. Biogas composition.- This parameter is a fast indicator of operational problems in the system. Under stable operational conditions, the end products in the biogas are CH4 and CO2. Intermediate products such as H2 and/or CO are frequently accumulated during perturbations. Therefore, the presence of these compounds in the produced biogas can be used to detect the perturbation stages [11]. A global mass balance performed to the bioreactor allows the estimation of the amount of methane produced by the system (Fig. 2, a) while the energy balance is a useful tool to calculate the energetic requirement to maintain the bioreactor at the appropriated temperature value (Fig. 2, b).
Input: liquid stream
Q·CODinf
Output: liquid stream
Q·CODef
Output: biogas producedQg·%CH4·kgCH4/1.4m3CH4·4kgCOD/kgCH4
Accumulation: biomass produced
10%·Q·(CODinf-CODef)
Q: flow rate of wastewater (m3/d)Qg: gas flow rate (m3/d)CODinf and CODef: COD of influent and effluent (kg COD/m3)
a
Input: liquid stream
Q·CODinf
Output: liquid stream
Q·CODef
Output: biogas producedQg·%CH4·kgCH4/1.4m3CH4·4kgCOD/kgCH4
Accumulation: biomass produced
10%·Q·(CODinf-CODef)
Q: flow rate of wastewater (m3/d)Qg: gas flow rate (m3/d)CODinf and CODef: COD of influent and effluent (kg COD/m3)
Input: liquid stream
Q·CODinf
Output: liquid stream
Q·CODef
Output: biogas producedQg·%CH4·kgCH4/1.4m3CH4·4kgCOD/kgCH4
Accumulation: biomass produced
10%·Q·(CODinf-CODef)
Input: liquid stream
Q·CODinf
Output: liquid stream
Q·CODef
Output: biogas producedQg·%CH4·kgCH4/1.4m3CH4·4kgCOD/kgCH4
Accumulation: biomass produced
10%·Q·(CODinf-CODef)
Q: flow rate of wastewater (m3/d)Qg: gas flow rate (m3/d)CODinf and CODef: COD of influent and effluent (kg COD/m3)
a
Input: liquid stream
m·Cp·Tinf
Output: liquid stream
Input: biogas produced
Qg·%CH4·kgCH4/1.4m3CH4·Heat of combustionCH4
m·Cp·Tef
Output: loss of heatA·U·(Tef-Tenv)
m: mass flow rate of wastewater (kg/d)Qg: gas flow rate (m3/d)Tinf Tef and Tenv: temperature of influent, effluent
and environment (°C)Cp: specific heat capacity of wastewater (kJ/kg·°C)A: surface area of the bioreactor (m2)U: overall heat transfer coefficient (kW/m2·°C)
b
Input: liquid stream
m·Cp·Tinf
Output: liquid stream
Input: biogas produced
Qg·%CH4·kgCH4/1.4m3CH4·Heat of combustionCH4
m·Cp·Tef
Output: loss of heatA·U·(Tef-Tenv)
Input: liquid stream
m·Cp·Tinf
Output: liquid stream
Input: biogas produced
Qg·%CH4·kgCH4/1.4m3CH4·Heat of combustionCH4
m·Cp·Tef
Output: loss of heatA·U·(Tef-Tenv)
m: mass flow rate of wastewater (kg/d)Qg: gas flow rate (m3/d)Tinf Tef and Tenv: temperature of influent, effluent
and environment (°C)Cp: specific heat capacity of wastewater (kJ/kg·°C)A: surface area of the bioreactor (m2)U: overall heat transfer coefficient (kW/m2·°C)
b
Fig. 2 Mass (a) and energy (b) balances applied to an anaerobic bioreactor. The mass balance is done in terms of COD: 10% of the gap between COD of the inlet and outlet liquid streams is accumulated inside the bioreactor as biomass and 90% is converted into methane. Based on practical experience, a ratio of 0.35 m3 CH4/kg COD degraded can be considered as a realistic value to estimate the methane production while the percentage of methane in the biogas can be estimated by Eq. (1).
100·8
TOCCOD·5.14
5.0CH% 4
−
−= (1)
where COD and TOC are the concentrations of Chemical Oxygen Demand and the Total Organic Carbon of the influent, respectively. Maintaining the bioreactor at an adequate operational temperature requires heating the inlet stream and taking into account the losses of heat to the environment. By combining energy and mass balances it can be calculated whether the energy recovered from biogas is enough to operate the system
3. Characterization of anaerobic sludge
The operation of the anaerobic bioreactors relies on the performance of the microbial populations present in the sludge. It is then crucial the characterization of the sludge in terms of microbiological, kinetic and physical properties.
620
Communicating Current Research and Educational Topics and Trends in Applied Microbiology A. Méndez-Vilas (Ed.)_____________________________________________________________________
©FORMATEX 2007

3.1. Microbial populations
The populations which limit the global performance of the process are those which perform the methanogenic process. Thus a deep insight on the different populations’ types existing in the bioreactors is advisable to understand and favour their appropriate operation. In order to determine the different methanogenic bacteria populations present in the anaerobic sludge, microbiological analysis like those based on the Fluorescence In Situ Hybridization (FISH) technique are often used nowadays [14].
Table 1. Oligonucleotide probes used for FISH.
Probe Target organism Probe sequence (5’ – 3’) Ref. EUB338 Bacteria GCTGCCTCCCGTAGGAGT [15] ARC915 Archaea GTGCTCCCCCGCCAATTCCT [16] MS821 Methanosarcina CGCCATGCCTGACACCTAGCGAGC [17] MX825 Methanosaetaceae TCGCACCGTGGCCGACACCTAGC [17] MB1174 Methanobacteriales TACCGTCGTCCACTCCTTCCTC [17]
This technique is based on the use of fluorescently labelled oligonucleotide probes comprising from 15 to 24 nucleic acids (DNA type) to target specific regions of the 16S ribosomal RNA (rRNA) of the searched bacteria (Table 1). The rRNA is present inside the ribosomes of the bacteria and it is in general an indicator of their active state. These DNA oligonucleotide probes are designed in such a way that depending on the targeted zone of the 16S rRNA different bacteria kingdom, phylum, class, order, family, genus or specie can be detected by observation under the epifluorescence microscope.
Oligonucleotide probe
Fluorescent dye
16S rRNA
RibosomeCell
a)Oligonucleotide probe
Fluorescent dye
16S rRNA
RibosomeCell
a)
16S rRNA
RibosomeCell
Oligonucleotide
probe
Fluorescentdye
b)
16S rRNA
RibosomeCell
Oligonucleotide
probe
Fluorescentdye
b)
Fig. 3 Scheme of the FISH technique application: a) Oligonucleotide enters the cell and ribosome; b) Oligonucleotide probe hybridizes with the targeted rRNA.
Fig. 4 Images of anaerobic samples analyzed by the FISH technique.
According to Amann (1995) [18] a typical FISH protocol includes four steps: a.- the fixation and permeabilization of the bacterial membrane to allow the probe to enter first inside the cell and latter inside the ribosome (Fig. 3, a); b.- hybridization (coupling) of the probe to the targeted sequence of the
621
Communicating Current Research and Educational Topics and Trends in Applied Microbiology A. Méndez-Vilas (Ed.)_____________________________________________________________________
©FORMATEX 2007

rRNA (Fig. 3, b); c.- washing steps to remove unbound probe; and d.- detection of labelled cells by epifluorescence microscopy (Fig. 4). Further details can be found in Amann et al. (1990) [15].
3.2. Kinetic characterization
In order to determine the capacity of an anaerobic sludge in terms of inoculation and operation of an anaerobic bioreactor, specific methanogenic activity (SMA) assays are performed by means of batch experiments (Fig.5, a). The specific activity of the biomass is determined according to eq. (2) from the amount of methane produced in sealed vials along the time (Fig. 5, b) and measured by means of liquid displacement [19] or overpressure measurements [20].
ftVXdt
dV
SMAR
CH
··0
4
= (g CH4/(g VSS·d)) (2)
where X0, VR and ft are the biomass concentration, reactor volume and time fraction, respectively.
020406080
100120140160180
0 50 100 150 200 250 300 350Time (h)
mL
C4H
dtdV
CH 4
b)
020406080
100120140160180
0 50 100 150 200 250 300 350Time (h)
mL
C4H
dtdV
CH 4
020406080
100120140160180
0 50 100 150 200 250 300 350Time (h)
mL
C4H
dtdV
CH 4
b)
Fig. 5 a) Pressure transducer and measurement device; b) Typical curve of methane production.
3.3. Physical characterization
Anaerobic biomass normally appears in two different states: suspended or aggregated in granules. Several physical properties of the biomass are measured in order to analyze its retention feasibility inside the different used anaerobic bioreactors. These properties are described in the following sections. Sludge Volumetric Index (SVI).- The SVI value is used to monitor the settling properties of the anaerobic biomass (Fig. 6). It is relevant for its good retention inside the anaerobic bioreactors [21]. SVI is measured, according to eq. 3, as the volume (expressed in millilitres) occupied by 1 gram of a biomass sample after 30 minutes of settling.
)solids(g/LSuspendedL)volume(mL/sludgeSettledSVI =
(3)
This value gives an idea about the degree of compacting of a biomass sample. Normal values of this parameter for a well settling sludge are ranging between 50 and 100 mL/g SS. Zone Settling Velocity (ZSV).- The ZSV is determined to establish the rate of settling of sludge samples. At high concentrations of suspended solids, suspensions settle in the zone-settling regimes (discrete, flocculant and delayed ones) characterized by the presence of a different interface between the water clarified zone and the sludge settling zones (Fig. 7) [21]. A typical value for a well settling sludge is 1 m/h.
a)
622
Communicating Current Research and Educational Topics and Trends in Applied Microbiology A. Méndez-Vilas (Ed.)_____________________________________________________________________
©FORMATEX 2007

Granules density.- When anaerobic biomass grows in form of granules, the biomass density (as mass of granules per volume occupied by the granules) is determined by using different tracer reagents like Dextran Blue [22]. The larger the granules density the larger the amount of bacteria is in a certain volume of granules. Normal values for this parameter are ranging from 30 to 100 g VSS/L granules.
Time D
epth
Water clarified zoneDiscrete settling zone
Flocculant settling zone
Delayed settling zone
Compression zoneTime
Dep
th
Water clarified zoneDiscrete settling zone
Flocculant settling zone
Delayed settling zone
Compression zone
Fig. 6 Experiment for determining SVI of a granular anaerobic biomass sample.
Fig. 7 Sludge settling profile.
Average diameter of the granules.- Morphology of the granules is measured by means of image analysis (IA) consisting of a combination of a stereomicroscope and a digital camera to record the pictures (Fig. 8), which are later analyzed by a computer program [23]. The granules sizes of a representative biomass sample are generally expressed as the mean feret diameter, which is calculated as an average value from the shortest and the longest measured segment from a granule (Fig. 9). The size distribution of granules is quite wide ranging from 0.2 mm to several millimetres.
a
b
Fig. 8 Picture of granules for size determination.
Fig. 9 Dimensions of the granule to calculate the feret diameter.
Fig. 10 Scanning electron micrographs of anaerobic granules.
Scanning Electron Microscopy.- Morphological studies of the biomass are also performed by scan electron microscopy (Fig. 10). This analytical technique gives information about the structure of the surface of the granules, the observed surface roughness and porous sizes [12].
4. Hydraulic behaviour of anaerobic bioreactors for wastewater treatment
The knowledge of the hydraulic behaviour of anaerobic bioreactors is a key issue for establishing the conditions of their optimal operation. The first step for estimating the hydraulic behaviour of a bioreactor is to obtain the Residence Time Distribution (RTD) curve. RTD curve is obtained by injecting a tracer pulse at the inlet stream of the bioreactor and measuring, along the time of the experiment, the tracer concentration at the outlet stream. In case of a bioreactor with immobilised or self-aggregated micro-
623
Communicating Current Research and Educational Topics and Trends in Applied Microbiology A. Méndez-Vilas (Ed.)_____________________________________________________________________
©FORMATEX 2007

organisms, it is recommended a method which uses two different tracers, as it allows the determination of the volume of the different phases present in the reactors (e.g. liquid and biomass volume). Two of the compounds most widely used as tracers in lab-scale experiments are Dextran Blue and LiCl [24]. Two RTD curves can simultaneously be obtained for each reactor, by injecting a pulse containing both Dextran Blue and LiCl. Due to the different molecular weight of these tracers, LiCl can be transported within the biomass while Dextran Blue (high molecular weight compound) can not. Experimental RTD data for each tracer can be observed in Fig. 11, together with the Continuous Stirred Tank Reactor (CSTR) model and two tanks in series model (Two CSTR) curves [25].
00.10.20.30.40.50.60.70.80.9
1
0 0.5 1 1.5 2 2.5 3 3.5 4
ϕ
Cϕ
Two CSTRs Model
CSTR Model
00.10.20.30.40.50.60.70.80.9
1
0 0.5 1 1.5 2 2.5 3 3.5 4
ϕ
Cϕ
Two CSTRs Model
CSTR Model
Fig. 11 RTD curves of Dextran Blue (×) and LiCl (•) obtained in an anaerobic bioreactor, together with complete stirred tank reactor (CSTR) model and two CSTR in series model curves.
These tracer curves supply valuable information for evaluating the hydraulic behaviour parameters of the anaerobic digester (e.g. real Hydraulic Residence Time HRT, number of theoretical tanks, useful liquid volume, total and hollow biomass volume, etc.). In this way, deviations (dead zones, shortcuts, bad mixing…) from ideal flow behaviour can be identified and the pertinent measures for improving the bioreactor performance in practice can be applied. As an example, an increase in the liquid upflow velocity or the re-injection of the produced off biogas (CH4 and CO2) can be used to improve the agitation and therefore mixing inside the bioreactor. If the digester presents high biogas retention within the biomass aggregates, a subsequent decrease in the useful volume occurs. In this case, external energy (e.g. pulsed feeding) can be applied for improving external mass transfer and solve the problem. The curves obtained from the two tracers supply information about the internal diffusivity of the substrate inside the biomass aggregates. If the curves are different it is an indicative of the presence of internal mass transfer resistance, which can condition the characteristics of micro-organisms and the distribution of micro-organisms populations inside the granules.
5. Operation of anaerobic wastewater treatment plants
Anaerobic digestion is being applied for the treatment of a wide type of industrial effluents in more than 1400 treatment plants in 65 countries [8, 26]. Upflow Anaerobic Filter (UAF) is a widely extended technology for the treatment of wastewater (high-rate anaerobic reactors, pre and post-treatment,…), however its implementation at industrial level has decreased drastically in the last few years, mainly due to the two main drawbacks presented by this technology [27]: i) Clogging of the bed (leading to the formation of preferential pathways and an important decrease of reactor useful volume) and ii) Entrapment of biogas bubbles (impedes mass transfer between liquid and solid and also decreases the useful volume).
624
Communicating Current Research and Educational Topics and Trends in Applied Microbiology A. Méndez-Vilas (Ed.)_____________________________________________________________________
©FORMATEX 2007
Anaerobic filters have been partially replaced by the use of new technologies (UASB, EGSB…), or well combined with another type of reactors (hybrid upflow sludge bed filter USBF) which preferably require the granulation of the present biomass. This new configurations are able to avoid the clogging of the bed or the flotation of biomass. The main disadvantage of this type of digesters is, in turn, the start-up process [28], since the granulation of the biomass usually takes several months [29]. This biomass aggregation is usually achieved by a progressive increase of the Organic Loading Rate (OLR) up to the design value. OLR values must initially be low (1 kg COD/m3·d), causing poor hydraulic mixture, especially in UASB reactors, and impeding a proper mass transfer between the three phases present in the reactor. In fact, it normally takes 4-8 months before steady state conditions are reached in this kind of systems. Another important difficulty in the operation of anaerobic bioreactors is to maintain the process operating in stable conditions, without the accumulation of intermediates, such as VFA, hydrogen gas and carbon monoxide, among others [30]. If an overload is produced (due to a sudden increase in the COD concentration or to the presence of inhibitors), then measures have to be taken to avoid the complete destabilization of the bioreactor, e.g. decreasing the feeding flow and increasing the recycling flow and the alkalinity concentration. Non stable operation is mainly due to the variation of the wastewater quality (pollutants concentrations) and flow-rate. These perturbations are common at the industrial wastewater plants and are difficult to overcome by the wastewater treatment facilities. As a consequence, the anaerobic bioreactor operation is vulnerable to changes in the influent flow-rate, quality and environmental conditions. This is especially important in high rate wastewater treatment processes (e.g. OLR between 5-25 kg COD/m3·d), where a disturbance such as an overload, may produce even a complete and irreversible failure of the process [31]. Thus, it is very important the early detection of an overload state or other type of disturbance, such as toxic or pH shocks, for driving the process to a normal operation before its efficiency is reduced or the biomass results damaged [32-35].
5.1. Quality of biogas
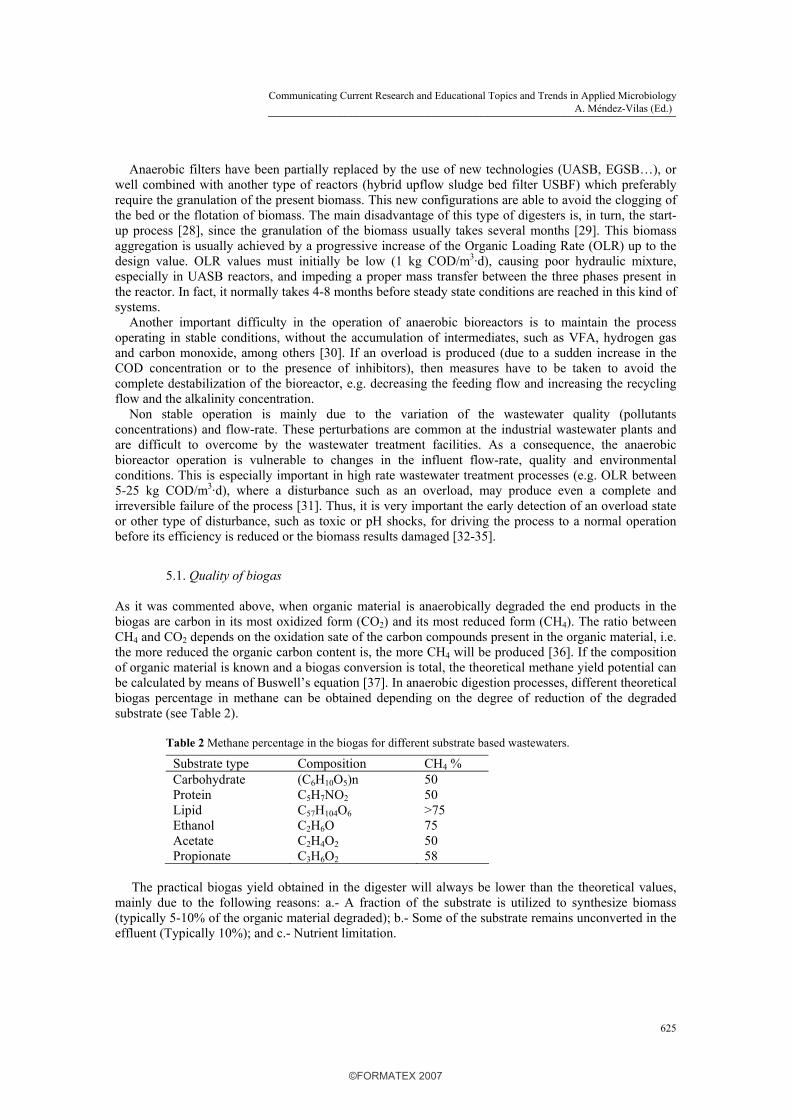
As it was commented above, when organic material is anaerobically degraded the end products in the biogas are carbon in its most oxidized form (CO2) and its most reduced form (CH4). The ratio between CH4 and CO2 depends on the oxidation sate of the carbon compounds present in the organic material, i.e. the more reduced the organic carbon content is, the more CH4 will be produced [36]. If the composition of organic material is known and a biogas conversion is total, the theoretical methane yield potential can be calculated by means of Buswell’s equation [37]. In anaerobic digestion processes, different theoretical biogas percentage in methane can be obtained depending on the degree of reduction of the degraded substrate (see Table 2).
Table 2 Methane percentage in the biogas for different substrate based wastewaters.
Substrate type Composition CH4 % Carbohydrate (C6H10O5)n 50 Protein C5H7NO2 50 Lipid C57H104O6 >75 Ethanol C2H6O 75 Acetate C2H4O2 50 Propionate C3H6O2 58
The practical biogas yield obtained in the digester will always be lower than the theoretical values, mainly due to the following reasons: a.- A fraction of the substrate is utilized to synthesize biomass (typically 5-10% of the organic material degraded); b.- Some of the substrate remains unconverted in the effluent (Typically 10%); and c.- Nutrient limitation.
625
Communicating Current Research and Educational Topics and Trends in Applied Microbiology A. Méndez-Vilas (Ed.)_____________________________________________________________________
©FORMATEX 2007

Under favourable conditions and the presence of high soluble COD concentration in wastewater, a degree of conversion as high as 90-95 % can be achieved. Conversion values in a range of 30-60 % are obtained for highly particulate organic matter as manures [36]. The pH in the reactor plays an important role in the biogas composition especially in the equilibrium of the CO2. Carbon dioxide is highly soluble in water, thus it is partially dissolved in the liquid phase of the reactor or converted to bicarbonate depending on the pH value, and thus its concentration in the gas phase is always lower than the theoretical value. On the other hand, CH4 is practically insoluble in water and ends up in the gas phase. In this way the percentage of methane in biogas can be used for calculating the energetic requirements to maintain the bioreactor at an appropriate temperature, according to mass and energy balances (Fig. 2). In order to learn how to operate an anaerobic bioreactor, information relative to the system has to be collected [38]:
1. The values of the main control parameters have to be determined corresponding either to the liquid phases or to the micro-organisms involved in the process (sludge) to be able to characterize the state of operation of the process.
2. The establishment of the hydrodynamic patterns at macroscopic scale by means of the RTD determination is crucial to understand the behaviour of the different populations of micro-organisms inside the reactor.
The appropriated use of the collected information leads to the establishment of the conditions for a successful operation of the anaerobic bioreactors [39, 40].
Acknowledgements The support by the Galician Government (Project SEDDAN, PGIDIT04TAM265006PR) and the Spanish Government (Ministry of Science and Technology through the Project ANACOM, CTQ2004-07811-C02-01/PPQ and Ministry of Education and Science through the Project CONSOLIDER CSD2007-00055) is gratefully acknowledged.
References
[1] G. Lettinga, Antonie Van Leeuwenhoek International Journal of General and Molecular Microbiology 67(1), 3 (1995).
[2] J.M. Lema, R. Méndez and M. Soto, Ingenieria Química 24(274), 191 (1992). [3] M. Henze and P. Harremoes, Water Science and Technology 15(1), 1 (1983). [4] A.J.M. Stams, Antonie Van Leeuwenhoek International Journal of General and Molecular Microbiology 66(1-
3), 271 (1994). [5] G. Lettinga, A.F. van Velsen, S.W. Hobma, W. de Zeeuw and A. Klapwyk, Biotechnology and Bioengineering
22(4), 699 (1980). [6] P.L. Mc Carthy, In: Anaerobic Digestion. D.E. Hughes et al. Eds. (Elsevier Biomedical Press, Amsterdam,
1981), pp. 3-22. [7] J.C. Young and P.L. McCarty, Journal of Water Pollution Control Federation 41(5), 160 (1969). [8] Y. Huang, G. Huang, S. Chou and S. Cheng, Water Science and Technology 42(3-4), 43 (2000). [9] A. Franco, E. Roca and J.M. Lema, Journal of Environmental Engineering 133 (2), 186 (2007). [10] A. Franco, E. Roca and J.M. Lema, Water Research 40(5), 871 (2006). [11] A. Puñal, E. Roca and J.M. Lema, Water Research 36(10), 2656 (2002). [12] A. Franco, G. Gresia, E. Roca, A. Rozzi and J.M. Lema, Water Science and Technology 45(10), 163 (2002). [13] R.K. Voolapalli and D.C. Stuckey, Water Research 35(7), 1831 (2001). [14] M. Figueroa, J.R. Vázquez-Padín, J.L. Campos, R. Méndez and A. Mosquera-Corral, Luminiscence 21, 320
(2006). [15] R.I. Amann, B.J. Binder, R.J. Olson, S.W. Chisholm, R. Devereu and D.A. Stahl, Applied and Environmental
Microbiology 56(6), 1919 (1990). [16] D.A. Stahl and R. Amann, In: Nucleic acid techniques in bacterial systematics, E. Stackebrandt and M.
Goodfellow ED. (John Wiley & Sons Ltd., Chichester, England, 1991), pp. 205-248. [17] L. Raskin., J.M. Stromley., B.R. Rittmann and D.A. Stahl, Applied and Environmental Microbiology 60(4),
1232 (1994).
626
Communicating Current Research and Educational Topics and Trends in Applied Microbiology A. Méndez-Vilas (Ed.)_____________________________________________________________________
©FORMATEX 2007

[18] R.I. Amann. In A.D.L. Akkerman, J.D. van Elsas and F.J. de Brujin (ed), Molecular microbial ecology manual. (Kluwer Academic Publisher, Dordrecht, The Netherlands, 1995), pp. 1-15.
[19] M. Soto, R. Méndez and J.M. Lema, Water Research 27(8), 1361 (1993). [20] B.R. Buys, A. Mosquera-Corral, M. Sánchez and R. Méndez, Water Science and Technology 41(12), 113
(2000). [21] APHA-AWWA-WPCF 20th Edition. L.S Clesceri, A.E. Greenberg and A.D. Eaton Eds., (Washington, 1999). [22] J.J. Beun., M.C.M. van Loosdrecht and J.J. Heijnen, Water Research 36(3), 702 (2002). [23] L. Tijhuis, W.A.J. van Benthum, M.C.M. van Loosdrecht and J.J. Heijnen, Biotechnology and Bioengineering
44(8), 867 (1994). [24] A. Franco, E. Roca and J.M. Lema, Water Science and Technology 48(6), 51 (2003). [25] O. Levenspiel, Chemical Reaction Engineering. (John Wiley, New York, 1988). [26] R.J. Frankin, Water Science and Technology 44(8), 1-6 (2001). [27] M. Jawed and V. Tare, Bioresource Technology 72(1), 75-84 (2000). [28] A. Puñal, P. Melloni, E. Roca, A. Rozzi and J.M. Lema, Journal of Environmental Engineering 127(5) , 397
(2001). [29] J. Rintala, Water Science and Technology 24(1), 69-74 (1991). [30] P.D. Pullammanappallil, S.A. Svoronos, D.P. Chynoweth and G. Lyberatos, Biotechnology and Bioengineering
58(1), 13 (1998). [31] J. Tay and X. Zhang, Journal of Environmental Engineering 126(8), 713 (2000). [32] A. Marsili-Libelli and A. Müller, Pattern Recognition Letters 17(6), 651 (1996). [33] R. Hickey, W. Wu, M. Veiga and R. Jones, Water Science and Technology 24(8), 207 (1991). [34] R. Hickey and M. Switzenbaum, Journal of the Water Pollution Control Federation 63(2), 129 (1991). [35] F. Molina, G. Ruiz, C. García, E. Roca and J.M. Lema, Water Science and Technology (In Press) (2007). [36] I. Angelidaki and W. Sanders, Re/Views in Environmental Science and Bio/Technology 3(2), 117 (2004). [37] E. Buswel and S. Neave, Laboratory studies of sludge digestion. Illinois Div. of State Water Survey 30 (1930). [38] A. Puñal, A. Lorenzo, E. Roca, C. Hernández and J.M. Lema, Water Science and Technology 40(8), 237
(1999). [39] A. Puñal, J. Rodríguez, A. Franco, E.F. Carrasco, E. Roca and J.M. Lema, Water Science and Technology
43(7), 191 (2001). [40] O. Bernard, B. Chahuat, A. Hélias, B. Le Dantec, J.-P. Steyer, L. Lardon, P.Neveu, S. Lambert, P. Ratini,
S.Frattesi, J. Lema, E. Roca, G. Ruiz, J.Rodriguez, A.Franco, P. Vanrolleghem, U.Zaher, D.J.W. De Pauw, K. De Neve, K. Lievens, D. Dochain, O. Schoefs, H. Fibrianto, R. Farina, V. Alcaraz Gonzalez, V. Gonzalez Alvarez, P. Lemaire, J.A. Martinez, O. Duclaud and J.F. Lavigne, Water Science and Technology 52(1-2), 457 (2005).
627
Communicating Current Research and Educational Topics and Trends in Applied Microbiology A. Méndez-Vilas (Ed.)_____________________________________________________________________
©FORMATEX 2007