acidogenicfermentationand anaerobic codigestion of non...
TRANSCRIPT

Acidogenic fermentation and anaerobic codigestion of non‐source sorted OFMSW and Polyethylene glycol
J. Dosta1, A. Martin‐Ryals2, M. Garrigó1, V. Ortiz‐Roca1, I. Fernández1, J. Mata‐Álvarez1
1 Department of Chemical Engineering and Analytical Chemistry, University of Barcelona, Barcelona, Catalunya, 08080 Spain.
2 Department of Agricultural and Biological Engineering, University of Illinois Urbana‐Champaign, Urbana, IL, 61801, USA

INDEX
1. IntroductionAnaerobic Codigestion of Residual Organic Matter (ROM)Acidogenic fermentation of ROM for the production of PHA
2. Objetives
4. Results and discussionAnaerobic codigestion of ROM and PEGAcidogenic fermentation of ROMAcidogenic cofermentation of ROM and PEG
3. Materials and Methods
5. Conclusions

Introduction
‐ Nowadays, new strategies for organic wastes of urban/industrial origin are focused to reach more CIRCULARITY. In this framework:
POLYHIDROXYALCANOATES (PHA)
PHOSPHOROUS AND NITROGEN (Fertilizers)
ANAEROBIC DIGESTION OR CODIGESTION
‐ The value of the products, materials and resources should be maintained in the economy the longer time possible (reuse, recycling).
‐Waste generation should be minimized
ORGANIC FRACTION OF MUNICIPAL SOLID WASTES,
SEWAGE SLUDGE, ….
1

If PHA is produced, biogas production in AD should
be increased
ANAEROBIC DIGESTION AND CODIGESTION OF RESIDUAL ORGANIC MATTER (ROM) (non‐source sorted OFMSW)
Mechanical‐biologicaltreatment plants
Polyethylene glycol (PEG) has many applications, from industrial
manufacturing to medicine production, and can be found in some industrial
wastewaters.
LIMITATIONS IN ANAEROBIC DIGESTION OF PURE PEG
‐ Lack of nutrients‐ Negligible alkalinity‐ Generation of large amounts of Volatile
Fatty Acids (VFA), mainly acetic acid, by substrate degradation (inhibitory effect).
COULD BE OVERCOMED BY
ROM + PEG CODIGESTION
Synergistic Effect
Introduction
Non‐source sortedOFMSW (ROM)
2

METHANOGENESIS
CH4 + CO2
ACIDOGENIC FERMENTATION
LIPIDSCARBOHYDRATESPROTEINSHYDROLYSIS
edcba PNOHC
ACIDOGENESIS &
ACETOGENESIS
INTERMEDIATE PRODUCTS(propionic acid, butyric acid, …)
ACETIC ACID H2, CO2
Fatty acids, alcoholsAminoacids, Simple sugars
3
Introduction
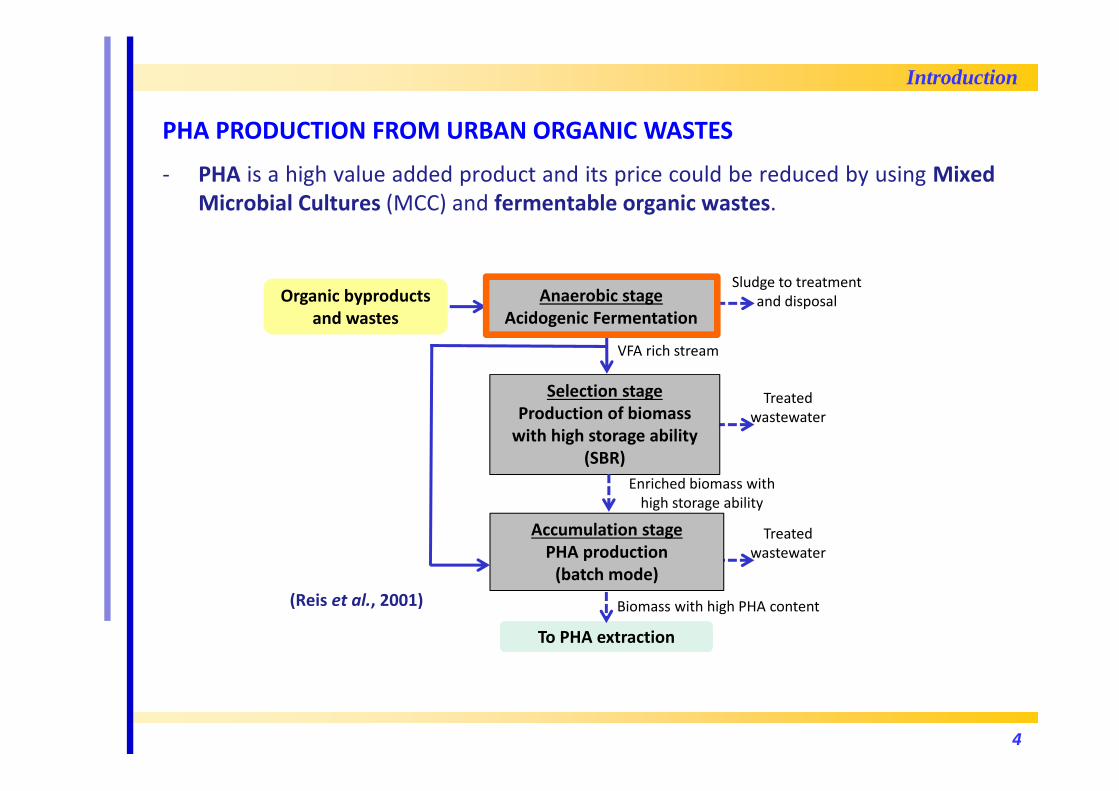
‐ PHA is a high value added product and its price could be reduced by using MixedMicrobial Cultures (MCC) and fermentable organic wastes.
PHA PRODUCTION FROM URBAN ORGANIC WASTES
4
Introduction
Treated wastewater
Treated wastewater
(Reis et al., 2001)
Organic byproductsand wastes
Selection stageProduction of biomasswith high storage ability
(SBR)
Accumulation stagePHA production(batch mode)
Anaerobic stageAcidogenic Fermentation
To PHA extraction
Sludge to treatment and disposal
VFA rich stream
Enriched biomass with high storage ability
Biomass with high PHA content

‐ The use of Mixed Microbial Cultures could ferment heterogeneous organic wastes likethe OFMSW
ACIDOGENIC FERMENTATION
Operational parameters of the fermenter:
‐ HRT‐ SRT‐ pH‐ TEMPERATURE‐ ORGANIC LOAD
VFA concentration VFA composition CODVFA/CODSOLUBLE Ratio NH4
+‐N concentration, ….
TUNING OF
Chemical (acid, alkaline, O3, H2O2, ...) Biological (enzymes dosing, bioaumentation, ...) Physical treatments (thermal, ultrasound, ...) Pretreatments combination Others
CO‐FERMENTATIONWITH OTHER ORGANIC WASTES
PRETREATMENTS
5
Introduction
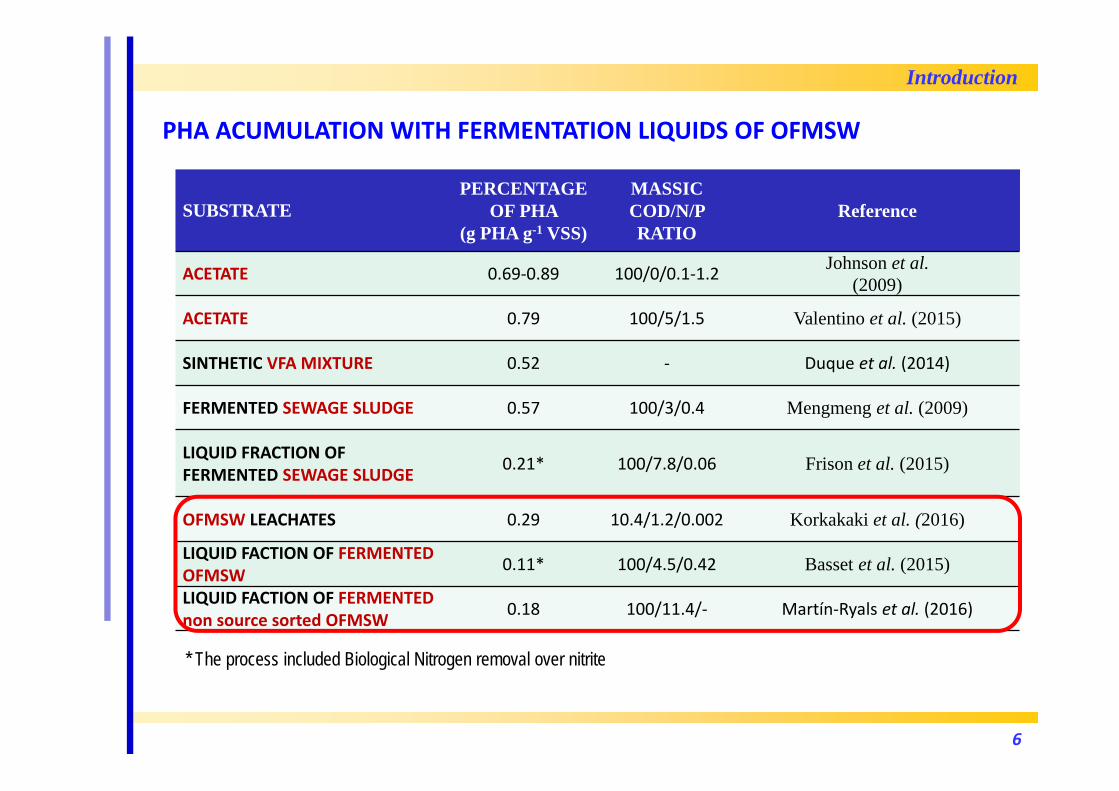
PHA ACUMULATION WITH FERMENTATION LIQUIDS OF OFMSW
SUBSTRATEPERCENTAGE
OF PHA (g PHA g-1 VSS)
MASSIC COD/N/P RATIO
Reference
ACETATE 0.69‐0.89 100/0/0.1‐1.2 Johnson et al.(2009)
ACETATE 0.79 100/5/1.5 Valentino et al. (2015)
SINTHETIC VFA MIXTURE 0.52 ‐ Duque et al. (2014)
FERMENTED SEWAGE SLUDGE 0.57 100/3/0.4 Mengmeng et al. (2009)
LIQUID FRACTION OF FERMENTED SEWAGE SLUDGE 0.21* 100/7.8/0.06 Frison et al. (2015)
OFMSW LEACHATES 0.29 10.4/1.2/0.002 Korkakaki et al. (2016)
LIQUID FACTION OF FERMENTED OFMSW 0.11* 100/4.5/0.42 Basset et al. (2015)
LIQUID FACTION OF FERMENTED non source sorted OFMSW 0.18 100/11.4/‐ Martín‐Ryals et al. (2016)
6
Introduction
* The process included Biological Nitrogen removal over nitrite

REDUCTION in PHA accumulation
(bacterial growth is promotedinstead of PHA accumulation)
1,5‐3,0 g N‐NH4+ L‐1
< 0,5 g P‐PO43‐ L‐1
‐ EXCESS OF NUTRIENTS in the fermentation liquid
7
ACIDOGENIC FERMENTATION
ShreddedROM
Rejectedsolids Liquid fraction of ROM
fermentation DIGESTATE
BIOGAS
PurgedWastewater
SOLID/LIQUID (S/L) SEPARATOR
S/LSEPARATOR
PREPARATIONTANK
ANAEROBIC DIGESTION
PEG
PEG
Introduction
NH4+‐N + PO4
3‐‐P Recovery/Removal
NH4+‐N + PO4
3‐‐P Recovery/Removal
‐ Unfavourable CODVFA/CODSOLUBLE
Martin-Ryals et al. (2016)
ANAEROBIC CODIGESTION AND COFERMENTATION OF ROM+PEG rich WW

Objetives
OBJETIVES
To study the effect of using PEG‐industrial wastewater for:
‐ Anaerobic codigestion with ROM
‐ Acidogenic co‐fermentation with ROM
8

Experimental devices
EXPERIMENTAL DEVICES
Batch test assaysfor acidogenicfermentation
Acidogenicfermentation lab‐scale reactor (5L)
9
Lab‐scale anaerobic digesterand codigester (5L)

Methods, Substrate and inocculum
ANALYTICAL METHODS
Standard Methods for the Examination of Water and Wastewater (APHA, 2012)
SUBSTRATE AND INOCULUM
REACTORS SUBSTRATES INOCULUM
AnaerobicCodigesters
AcidogenicFermentation
RESIDUAL ORGANIC MATTER (ROM) + Supernatant from Anaerobic
Digestion of ROM[Mechanical biological treatment plant
Metropolitan Area of Barcelona]
PEG RICH INDUSTRIAL WASTEWATER[Pharmaceutical Industry]
Anaerobic digestion biomassfrom a mesophilic digester
treating ROM
10

ROM CHARACTERIZATION
Parameter Units ValuepH - 6.5-7.0Total Solids (TS) % w/w 5.0 ± 1.1Volatile Solids (VS) % w/w 3.9 ± 0.9Total Alkalinity mg CaCO3 L-1 3,230.5 ± 489.0Total VFA mg L-1 1,176 ± 348NH4
+-N mg L-1 > 1,067
11
ROM AND PEG CHARACTERISTICS
PEG-RICH INDUSTRIAL WASTEWATER CHARACTERIZATION
Parameter Units ValuepH - 4.5-5.0Total Solids (TS) % w/w 45.04 ± 1.02Volatile Solids (VS) % w/w 44.61 ± 1.03Total Alkalinity mg CaCO3 L-1 1,867.5 ± 42.5Total VFA mg L-1 657.4 ± 1.5NH4
+-N mg L-1 5.15 ± 0.5NOx
--N mg L-1 n.d.Sulfites and sulfates (SOX
2--S) mg L-1 n.d.n.d.: not detected
Results and discussion: Anaerobic Co-digestion

ANAEROBIC CODIGESTION OF ROM AND PEG
ADAcoD
Results and discussion: Anaerobic Co-digestion
ROM
PEG
ROM
Two Stages
1) ANAEROBIC DIGESTION (2 reactors)(simulating the industrial operation)
2) ANAEROBIC CO‐DIGESTION ROM+PEG implemmented in one digester
Operating conditions:‐ HRT 20 days‐ Temperature 35ºC‐ Feeding manually once a day‐ ROM collected 3 times/week
12
ANAEROBIC CODIGESTION OF ROM AND PEG
Results and discussion: Anaerobic Co-digestion
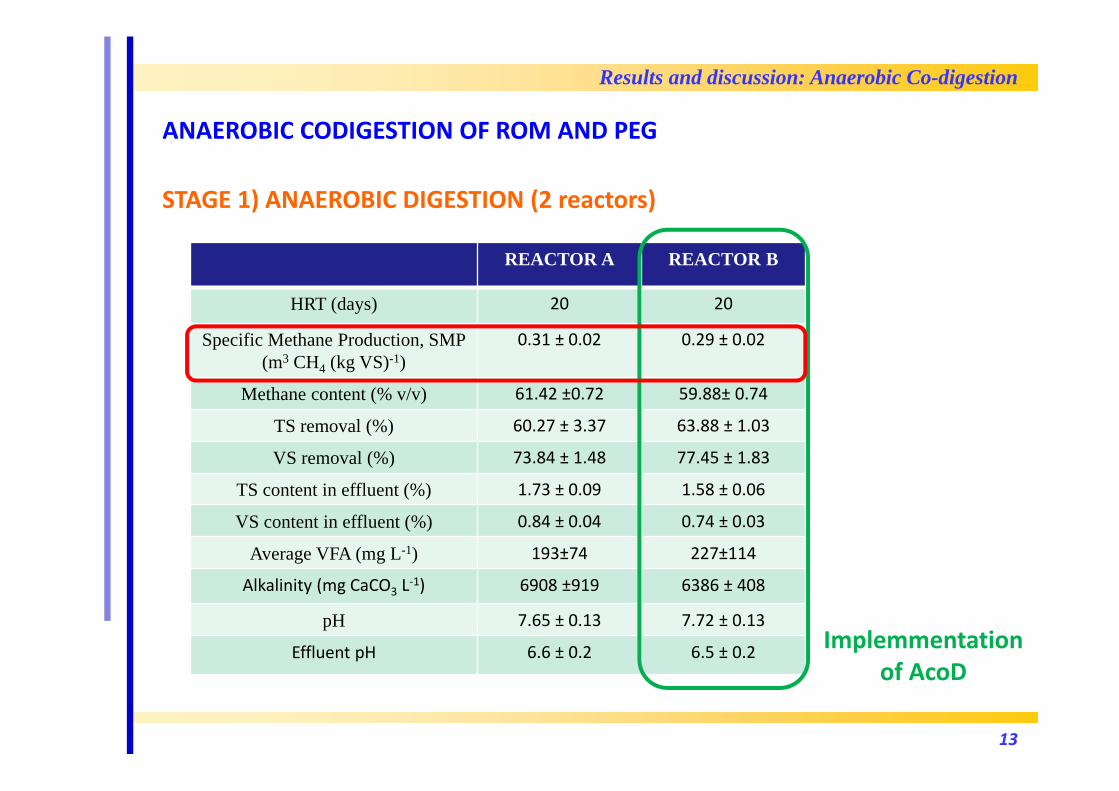
STAGE 1) ANAEROBIC DIGESTION (2 reactors)
REACTOR A REACTOR B
HRT (days) 20 20
Specific Methane Production, SMP(m3 CH4 (kg VS)-1)
0.31 ± 0.02 0.29 ± 0.02
Methane content (% v/v) 61.42 ±0.72 59.88± 0.74
TS removal (%) 60.27 ± 3.37 63.88 ± 1.03
VS removal (%) 73.84 ± 1.48 77.45 ± 1.83
TS content in effluent (%) 1.73 ± 0.09 1.58 ± 0.06
VS content in effluent (%) 0.84 ± 0.04 0.74 ± 0.03
Average VFA (mg L-1) 193±74 227±114
Alkalinity (mg CaCO3 L‐1) 6908 ±919 6386 ± 408
pH 7.65 ± 0.13 7.72 ± 0.13
Effluent pH 6.6 ± 0.2 6.5 ± 0.2 Implemmentation of AcoD
13
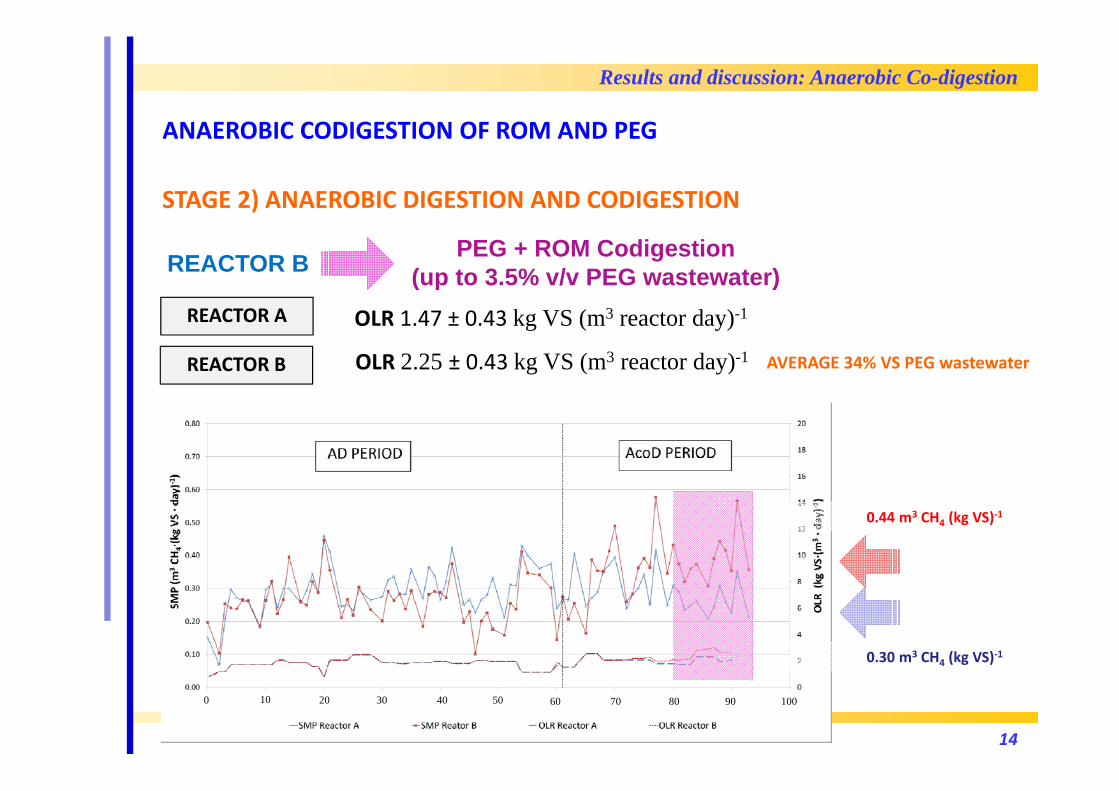
OLR 2.25 ± 0.43 kg VS (m3 reactor day)-1
ANAEROBIC CODIGESTION OF ROM AND PEG
Results and discussion: Anaerobic Co-digestion
STAGE 2) ANAEROBIC DIGESTION AND CODIGESTION
OLR 1.47 ± 0.43 kg VS (m3 reactor day)-1REACTOR A
REACTOR B
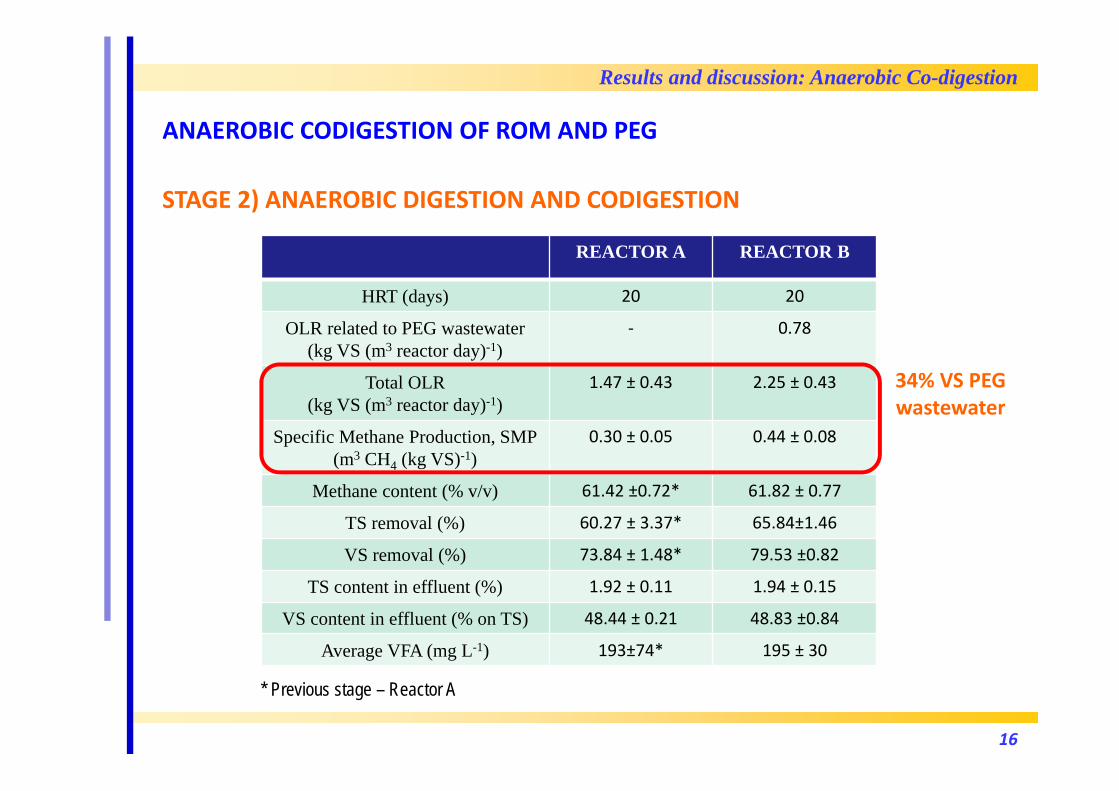
REACTOR B AVERAGE 34% VS PEG wastewater
PEG + ROM Codigestion (up to 3.5% v/v PEG wastewater)
0.44 m3 CH4 (kg VS)‐1
0.30 m3 CH4 (kg VS)‐1
0 10 20 30 40 50 60 70 80 90 100
14

0,00
2,00
4,00
6,00
8,00
10,00
0,00
0,50
1,00
1,50
2,00
2,50
04/04/2015 14/04/2015 24/04/2015 04/05/2015 14/05/2015 24/05/2015 03/06/2015 13/06/2015 23/06/2015 03/07/2015 13/07/2015 23/07/2015
OLR (K
g SV/m
3∙dia
Prod
uced
Biogas (m
3biogas /(m
3reactorday)
‐1)
BIOGAS PRODUCTION AND OLR Biogas Reactor B Biogas Reactor A
OLR Reactor B OLR Reactor A
ANAEROBIC CODIGESTION OF ROM AND PEG
Results and discussion: Anaerobic Co-digestion
STAGE 2) ANAEROBIC DIGESTION AND CODIGESTIONPEG + ROM Codigestion
(3.5% v/v PEG wastewater)
0
20
40
60
80
100
04/04/2015 14/04/2015 24/04/2015 04/05/2015 14/05/2015 24/05/2015 03/06/2015 13/06/2015 23/06/2015 03/07/2015 13/07/2015 23/07/2015
SV (%
removed
)
% SV removal Reactors A and B %VS removed Reactor A %VS removed Reactor B
REACTOR B
Higher Biogas production
Higher VS removal
0 10 20 30 40 50 60 70 80 90 100 110
0 10 20 30 40 50 60 70 80 90 100 110
AD period AcoD period
15
34% VS PEG wastewater
ANAEROBIC CODIGESTION OF ROM AND PEG
Results and discussion: Anaerobic Co-digestion
STAGE 2) ANAEROBIC DIGESTION AND CODIGESTION
REACTOR A REACTOR B
HRT (days) 20 20
OLR related to PEG wastewater(kg VS (m3 reactor day)-1)
‐ 0.78
Total OLR (kg VS (m3 reactor day)-1)
1.47 ± 0.43 2.25 ± 0.43
Specific Methane Production, SMP(m3 CH4 (kg VS)-1)
0.30 ± 0.05 0.44 ± 0.08
Methane content (% v/v) 61.42 ±0.72* 61.82 ± 0.77
TS removal (%) 60.27 ± 3.37* 65.84±1.46
VS removal (%) 73.84 ± 1.48* 79.53 ±0.82
TS content in effluent (%) 1.92 ± 0.11 1.94 ± 0.15
VS content in effluent (% on TS) 48.44 ± 0.21 48.83 ±0.84
Average VFA (mg L-1) 193±74* 195 ± 30
* Previous stage – Reactor A
16

ACIDOGENIC FERMENTATION OF ROM ‐ BATCH TESTS
17
TS percentage (%)
Retention time (days)
HAc
+ HPr (m
g/L)
BEST VFA PRODUCTION RESULTS: TS: 5.4 %; HRT: 3.4 days; T: 37 ºC
Tested parameters in batch experiments:‐ Retention time (0‐5 days)‐ % TS (3.3 ‐ 8.2 %)‐ Temperature (33 ‐ 37ºC)
Results and discussion: Acidogenic Fermentation

Average VFA concentration 8.8 ± 0.8 g L‐1
Average VFA concentration 9.4 ± 1.5 g L‐1
Average VFA concentration 10.7 ± 1.7 g L‐1
0
2000
4000
6000
8000
10000
12000
14000
16000
0 25 50 75 100 125 150
Total V
FA (m
g/L)
Days of Operation
Fermenter Effluent
Influent ROM
Start‐up HRT 3 daysHRT 2.5 days HRT 3.5 days
ACIDOGENIC FERMENTATION OF ROM
Continuous operation:
180 195 210 225
HRT = 2.5 days
HRT = 3.0 days
HRT = 3.5 days
Higher HRT Higher VFA concentration Higher % HAc+HPr
55.3 % HAc + HPr56.4 % HAc + HPr
64.6 % HAc + HPr
‐ Inoculum: AD biomass‐ Initial HRT: 2.5 d to wash‐out methanogens‐ Temperature 37ºC; No pH control
Results and discussion: Acidogenic Fermentation
TOTA
L VFA (m
g/L)
Days of operation
18

0
2000
4000
6000
8000
10000
12000
14000
16000
180 195 210 225
Tota
l VFA
(mg/
L)
Days of operation
Fermenter Effluent
Influent ROM
0
10
20
30
40
50
60
70
80
90
100
180 195 210 225
% In
divi
dual
VFA
/ To
tal V
FA
time (days)
% HAc+HPr / (Total VFA)
"% HAc / (Total VFA)"
19
ACIDOGENIC FERMENTATION OF ROM
ROM Fermentation
HRT (days) 3.5
TS influent (%) 6.05 ± 0.86
VS influent (%) 4.07 ± 0.59
Average VFA (g L-1) 10.7 ± 1.7
% HAc + HPr (%) 64.6 ± 4.6
CODVFA/CODSOL (‐) > 0.57
Effluent pH 6.6 ± 0.2
Effluent NH4+‐N (g L‐1) 2.54 ± 0.58
Results and discussion: Acidogenic Fermentation

20
ACIDOGENIC FERMENTATION OF ROM AND PEG – BATCH TESTS
0
2000
4000
6000
8000
10000
12000
14000
16000
18000
1 2 3 4 5 6 7
Concentra
ció AG
V (mg
AGV L
‐1 )
12,5% PEG (en base SV)Acetico
Propionico
isobutirico
butirico
isovalerico
valerico
isocaproico
caproico
heptanoico
TOTAL
0
2000
4000
6000
8000
10000
12000
14000
16000
18000
1 2 3 4 5 6 7
Concentra
ció AG
V (mg
AGV L
‐1)
0 % PEG (en base SV)Acetico
Propionico
isobutirico
butirico
isovalerico
valerico
isocaproico
caproico
heptanoico
TOTAL
0
2000
4000
6000
8000
10000
12000
14000
16000
18000
1 2 3 4 5 6 7
Concentra
ció AG
V (mg
AGV L
‐1 )
Tiempo (días)
50 % PEG (en base SV)AceticoPropionicoisobutiricobutiricoisovalericovalericoisocaproicocaproicoheptanoicoTOTAL
Tested parameters:‐Mixtures PEG – ROM (% PEG on VS basis): 0, 12.5, 25, 37.5, 50 % ‐ % TS (5.4%)‐ Temperature (37ºC)
% PEG (% VS)
Average increase of VFA in the test withrespect to 0 %PEG
12.5 X 1.22
25.0 X 1.25
37.5 X 1.32
50.0 X 0.97
12.5% PEG -> 33.4% VFA increase
Results and discussion: Acidogenic Fermentation

ACIDOGENIC FERMENTATION OF ROM AND PEG – BATCH TESTS
Higher % PEG
Lower % HAc + HPr with respect to total VFA
Results and discussion: Acidogenic Fermentation
21

0
2000
4000
6000
8000
10000
12000
14000
16000
180 205 230 255
Tota
l VFA
(mg/
L)
time (days)
Fermenter Effluent
Influent ROM
ROM + PEGROM
0
10
20
30
40
50
60
70
80
90
100
180 205 230 255
% In
divi
dual
VFA
/ To
tal V
FA
time (days)
% HAc+HPr / (Total VFA)
"% HAc / (Total VFA)"
ROM + PEG CO‐FERMENTATION
ROM Ferment.
ROM +PEG
Ferment.
HRT(days)
3.5 3.5
TS influent(%)
6.05 ± 0.86 6.17 ± 1.05
VS influent(%)
4.07 ± 0.59 4.13 ± 1.36
Average VFA (g L-1)
10.7 ± 1.7 12.1 ± 1.3
% HAc + HPr(%)
64.6 ± 4.6 66.5 ± 3.5
CODVFA/CODSOL(‐)
> 0.57 >0.62
Effluent pH 6.6 ± 0.2 6.5 ± 0.2
Effluent NH4+‐N
(g L‐1) 2.54 ± 0.58 2.46 ± 0.49
Results and discussion: Acidogenic Fermentation
22
ACIDOGENIC FERMENTATION
ShreddedROM
Rejectedsolids Liquid fraction of
fermented ROM DIGESTATE
BIOGAS
PurgedWastewater
SOLID/LIQUID (S/L) SEPARATOR
S/LSEPARATOR
PREPARATIONTANK
ANAEROBIC DIGESTION
PEG
PEG
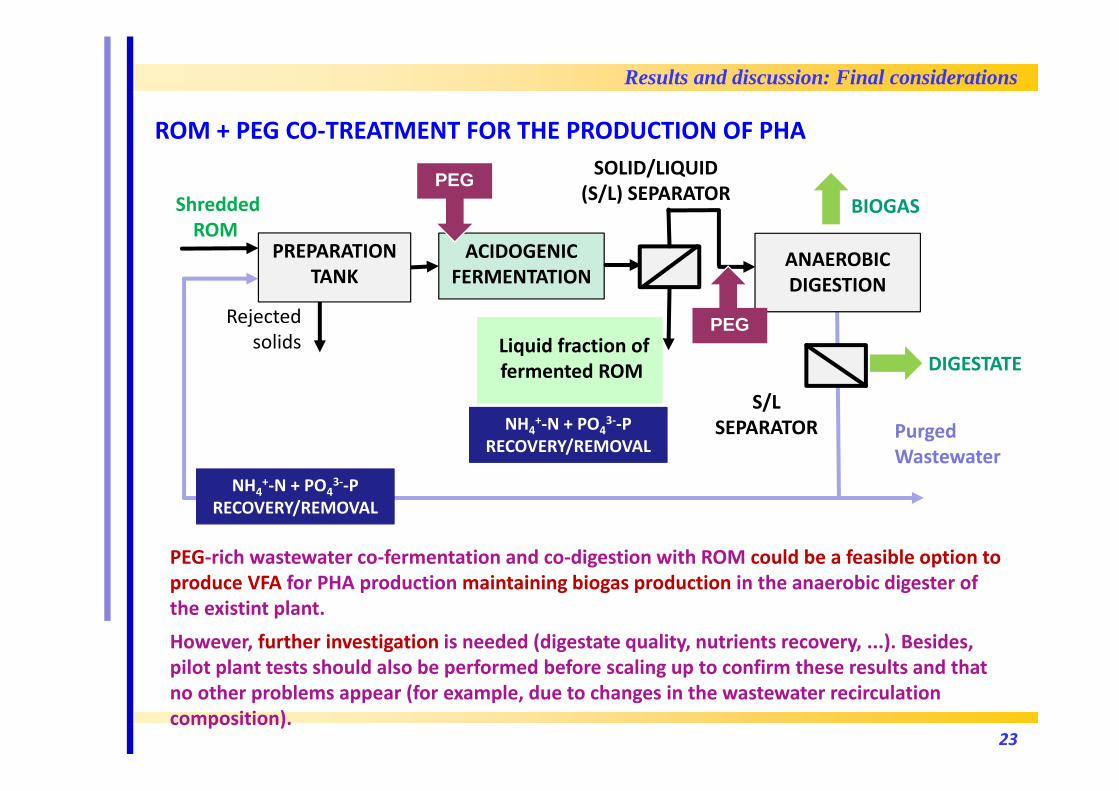
ROM + PEG CO‐TREATMENT FOR THE PRODUCTION OF PHA
Results and discussion: Final considerations
PEG‐rich wastewater co‐fermentation and co‐digestion with ROM could be a feasible option to produce VFA for PHA production maintaining biogas production in the anaerobic digester of the existint plant.
However, further investigation is needed (digestate quality, nutrients recovery, ...). Besides, pilot plant tests should also be performed before scaling up to confirm these results and that no other problems appear (for example, due to changes in the wastewater recirculation composition).
NH4+‐N + PO4
3‐‐P RECOVERY/REMOVAL
NH4+‐N + PO4
3‐‐P RECOVERY/REMOVAL
23

CONCLUSIONS
The use of PEG‐rich industrial wastewater as co‐substrate has been assessed as afeasible alternative to improve biogas production in the anaerobic digestion ofROM, without affecting the reactor stability and with no external nutrient supply.When the OLR was increased by 35% (on VS basis) due to co‐substrate addition, anincrease of the SMP by approximately 50% was registered.
The introduction of PEG‐rich industrial wastewater (co‐substrate) for acidogenicfermentation of ROM lead to higher VFA production. At short term conditions thehighest VFA increase per unit of VS of PEG wastewater added was recorded for amixture of ROM and PEG with 12.5 % of co‐substrate on VS basis and theproportion of VFA of C4, C5 and C6 was higher when compared with acidogenicfermentation of ROM.
However, during long‐term experiments of co‐fermentation (12.5 % on VS basis ofPG co‐substrate) an acclimation of biomass was observed and higher percentagesof acetic acid and propionic acid (66.5%) to total VFA were recorded, with anincrease of VFA production of 14% with respect to mono‐fermentation of ROM(maintaining the OLR on VS basis).
24

Acidogenic fermentation and anaerobic codigestion of OFMSW and Polyethylene glycol
J. Dosta1, A. Martin‐Ryals2, M. Garrigó1, V. Ortiz‐Roca1, I. Fernández1, J. Mata‐Álvarez1
1 Department of Chemical Engineering and Analytical Chemistry, University of Barcelona, Barcelona, Catalunya, 08080 Spain.
2 Department of Agricultural and Biological Engineering, University of Illinois Urbana‐Champaign, Urbana, IL, 61801, USA