assessment of micro-scale anaerobic digestion for
TRANSCRIPT
1
This is a revised personal version of the text of the final journal article, which is made available for scholarly purposes only, in accordance with the journal's author permissions.
Assessment of Micro-Scale Anaerobic Digestion for Management of Urban Organic Waste: A Case Study in London, UK1
Dr. Mark Walker1, Helen Theaker1, Rokiah Yaman2, Dr. Davide Poggio3, Dr. William Nimmo1, Angela Bywater4, Prof. Mohamed Pourkashanian1
1 Department of Mechanical Engineering, the University of Sheffield, Sheffield, S1 3JD, UK. [email protected] [email protected], [email protected], [email protected], [email protected]
2 Camley Street Natural Park, 12 Camley Street, London, Greater London, N1C 4PW, UK. [email protected]
3 Centre for Research in Social Simulation (CRESS), Department of Sociology, Faculty of Arts and Human Sciences,
University of Surrey, Guildford, GU2 7XH, UK. [email protected].
4 University of Southampton, University Road, Southampton SO17 1BJ, UK, [email protected]
Corresponding author: Mark Walker, Energy Building, Department of Mechanical Engineering, The University of Sheffield, Sheffield, S1 3JD, UK. [email protected], +44 114 2157242
Abstract
This paper describes the analysis of an AD plant that is novel in that it is located in an urban
environment, built on a micro-scale, fed on food and catering waste, and operates as a
purposeful system. The plant was built in 2013 and continues to operate to date, processing
urban food waste and generating biogas for use in a community café. The plant was
monitored for a period of 319 days during 2014, during which the operational parameters,
biological stability and energy requirements of the plant were assessed. The plant processed
4574 kg of food waste during this time, producing 1008 m3 of biogas at average 60.6 %
methane. The results showed that the plant was capable of stable operation despite large
fluctuations in the rate and type of feed. Another innovative aspect of the plant was that it
was equipped with a pre-digester tank and automated feeding, which reduced the effect of
1 Article available at http://dx.doi.org/10.1016/j.wasman.2017.01.036. Please note that access to the full text
of this article will depend on your personal or institutional entitlements. This article can already be cited using
the year of online availability and the DOI as follows: Walker et al (2017). Assessment of Micro-Scale
Anaerobic Digestion for Management of Urban Organic Waste: A Case Study in London, UK. Waste
Management (Preprint). j.wasman.2017.01.036.
2
feedstock variations on the digestion process. Towards the end of the testing period, a rise
in the concentration of volatile fatty acids and ammonia was detected in the digestate,
indicating biological instability, and this was successfully remedied by adding trace
elements. The energy balance and coefficient of performance (COP) of the system were
calculated, which concluded that the system used 49% less heat energy by being housed in a
greenhouse, achieved a net positive energy balance and potential COP of 3.16 and 5.55
based on electrical and heat energy, respectively. Greenhouse gas emissions analysis
concluded that the most important contribution of the plant to the mitigation of
greenhouse gases was the avoidance of on-site fossil fuel use, followed by the diversion of
food waste from landfill and that the plant could result in carbon reduction of 2.95 kg CO2eq
kWh-1 electricity production or 0.741 kg CO2eq kg-1 waste treated.
Highlights
A micro-scale AD plant was built and operated reliably in London, UK
The system produced 0.596 m3 CH4 kg-1 VS from locally-collected mixed organic
waste
GHG reduction of the system was 0.741 kg CO2eq kg-1 waste treated cf. landfilling
The system advantageously included a pre-digestion tank to buffer the feed
variations
Biological ammonia inhibition was mitigated by trace element supplementation
Keywords: Anaerobic digestion, Biogas, Food waste, Urban organic waste, Ammonia
inhibition, Micro-scale
Abbreviations
AD Anaerobic Digestion
COD Chemical Oxygen Demand
COP Coefficient of performance
GHG Greenhouse gas
HRT Hydraulic retention time
kWe Kilowatts of electrical output
LCV Lower calorific value
OLR Organic loading rate
TPA Tonnes per annum
TS Total solids
VFA Volatile fatty acids
VS Volatile solids
3
1 Introduction
Anaerobic Digestion (AD) in the UK and Europe has enjoyed a wide uptake in the past 20
years, due to governments’ introduction of feed-in tariffs and renewable heat incentives
improving its economic viability (Edwards et al., 2015). However, although there has been
much development at scales over 125 kWe electrical output, there has been very limited
uptake of the technology at the micro scale (5-15kWe or equivalent) (NNFCC, 2016).
The use of AD on a micro-scale is used mainly in developing countries, with an estimated 5
million household scale digesters across India and China alone, as it provides a convenient
way of processing and sanitising local waste such as animal slurries (Lansing et al., 2008), as
well as producing biogas. However, in the developed world, AD is generally restricted to
larger scale plants. There are currently 316 non-sewage-based AD plants operating in the
UK, with a total installed capacity of 290MW (average of 918 kW per plant) (NNFCC, 2016).
These AD plants are fed on a variety of feedstocks, including energy crops, dairy effluent,
food waste and animal slurries and manures.
However, across the UK there is now a growing introduction of source segregated food
waste collections and a need to reduce waste and emissions wherever possible to achieve
climate change targets. Micro-AD plants in an urban environment could offer support for
these issues in the form of non-centralised (i.e. distributed) organic waste management.
There are a number of challenges specific to the urban environment that AD can address
(Stoknes et al., 2016).
Micro-scale AD applications have the potential to deliver a variety of advantages relative to
conventional AD plants including; reduced transport requirements, potential for community
involvement, and the fostering of a circular economy by means of creating a ‘biorefinery’
that will dispose of local waste, utilise its energy potential, and also produce a natural
fertiliser that can be used in urban agriculture, horticulture and hydroponics. The
demonstration of small-scale AD will also make the technology more familiar and accessible,
which could potentially increase its uptake by adding understanding of the field and
capturing feedstocks from sources that are out of the catchment area of larger plants.
This paper describes a monitoring study of a novel micro-AD system, with an innovative
process design and unusual setting, implemented in a community wildlife park in London in
the UK. The paper includes a system description, and performance, energy and carbon
evaluations with the purpose of presenting and assessing the concept of micro-AD in the
urban environment.
4
2 Materials and Methods
2.1 Site description
The pilot system was designed and installed by a consortium of companies and researchers
in 2013, and the monitoring took place from October 2013 to November 2014. The plant
was built within the grounds of the Camley Street Natural Park in London, UK and the site
was used to convert locally produced, commercial organic waste, collected by cargo bicycle,
into biogas for cooking, heating and electricity.
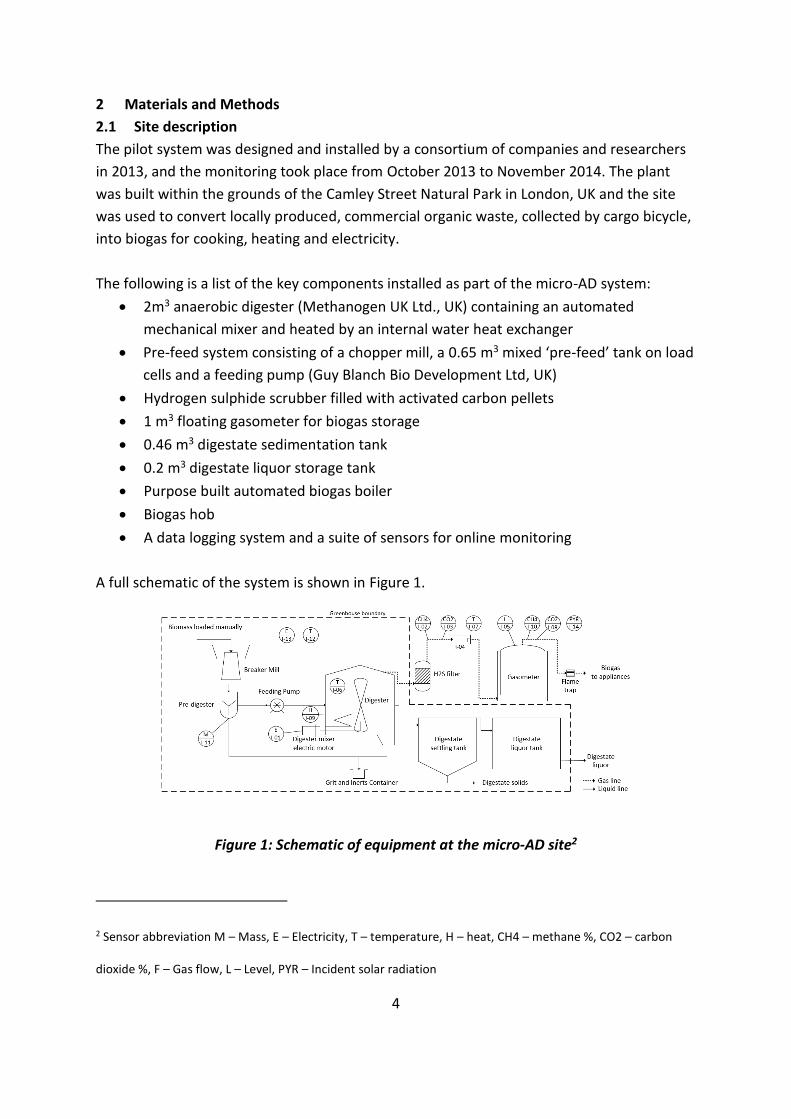
The following is a list of the key components installed as part of the micro-AD system:
2m3 anaerobic digester (Methanogen UK Ltd., UK) containing an automated
mechanical mixer and heated by an internal water heat exchanger
Pre-feed system consisting of a chopper mill, a 0.65 m3 mixed ‘pre-feed’ tank on load
cells and a feeding pump (Guy Blanch Bio Development Ltd, UK)
Hydrogen sulphide scrubber filled with activated carbon pellets
1 m3 floating gasometer for biogas storage
0.46 m3 digestate sedimentation tank
0.2 m3 digestate liquor storage tank
Purpose built automated biogas boiler
Biogas hob
A data logging system and a suite of sensors for online monitoring
A full schematic of the system is shown in Figure 1.
Figure 1: Schematic of equipment at the micro-AD site2
2 Sensor abbreviation M – Mass, E – Electricity, T – temperature, H – heat, CH4 – methane %, CO2 – carbon
dioxide %, F – Gas flow, L – Level, PYR – Incident solar radiation
5
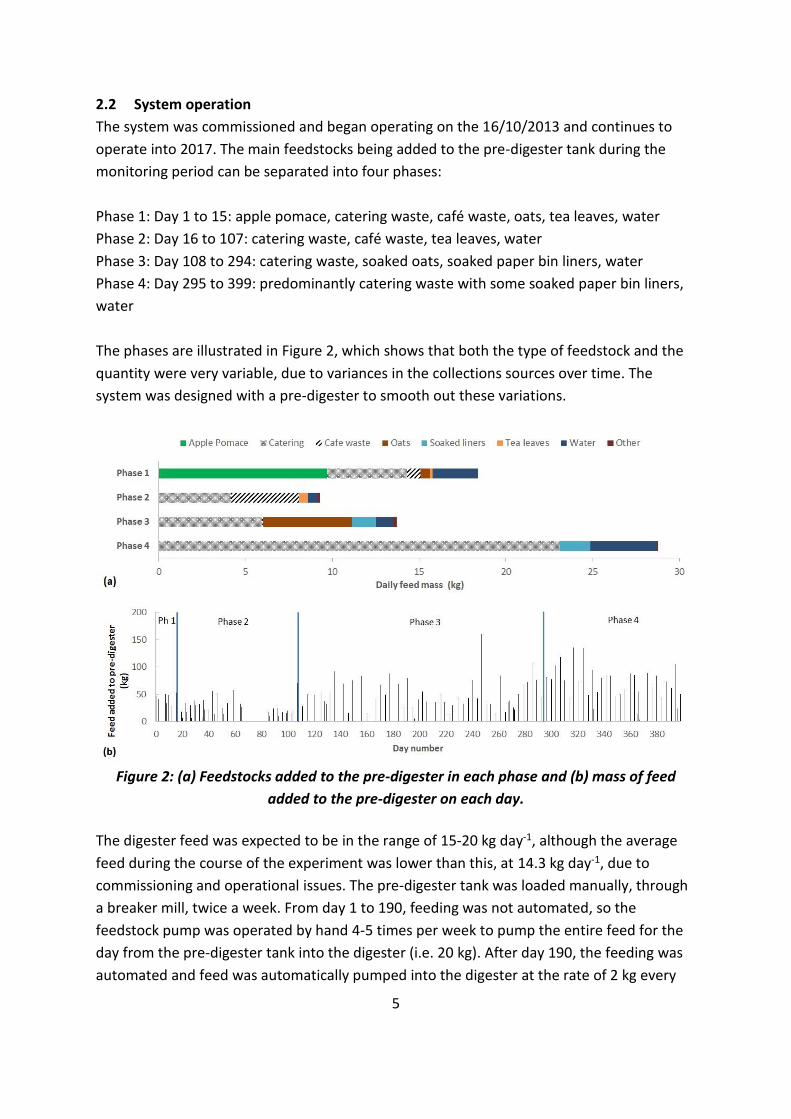
2.2 System operation
The system was commissioned and began operating on the 16/10/2013 and continues to
operate into 2017. The main feedstocks being added to the pre-digester tank during the
monitoring period can be separated into four phases:
Phase 1: Day 1 to 15: apple pomace, catering waste, café waste, oats, tea leaves, water
Phase 2: Day 16 to 107: catering waste, café waste, tea leaves, water
Phase 3: Day 108 to 294: catering waste, soaked oats, soaked paper bin liners, water
Phase 4: Day 295 to 399: predominantly catering waste with some soaked paper bin liners,
water
The phases are illustrated in Figure 2, which shows that both the type of feedstock and the
quantity were very variable, due to variances in the collections sources over time. The
system was designed with a pre-digester to smooth out these variations.
Figure 2: (a) Feedstocks added to the pre-digester in each phase and (b) mass of feed
added to the pre-digester on each day.
The digester feed was expected to be in the range of 15-20 kg day-1, although the average
feed during the course of the experiment was lower than this, at 14.3 kg day-1, due to
commissioning and operational issues. The pre-digester tank was loaded manually, through
a breaker mill, twice a week. From day 1 to 190, feeding was not automated, so the
feedstock pump was operated by hand 4-5 times per week to pump the entire feed for the
day from the pre-digester tank into the digester (i.e. 20 kg). After day 190, the feeding was
automated and feed was automatically pumped into the digester at the rate of 2 kg every
6
two hours. The plant was operated and tested by volunteers and staff, and the biogas was
used on a gas hob in the site’s café. A 1 kWe CHP Stirling engine (Ecogen, UK) was planned
for the site but this was installed after the monitoring period.
2.3 Project monitoring
The project monitoring period began on 3/1/14 (day 80) and data collection continued until
19/11/2014 (day 399) although some digestate samples were taken and analysed after this
date up until 13/07/2015 (day 635). Three forms of monitoring were used: daily readings
taken by the operators, automatic sampling, and laboratory-based (“off-line”) sample
testing.
2.3.1 Operator monitoring
Data collection was performed by the plant operator. During each loading operation,
manual records were made of the type and amount of feedstock added to the pre-digester
tank, including the addition of water, contamination, operational time taken, and notes
about any problems or issues. Alongside this, manual measurements were taken of the
cumulative biogas flow and digester temperature.
2.3.2 Automatic monitoring using sensors and cloud-based logging software
The system was also automatically monitored in real time by a suite of sensors connected to
data acquisition hardware. These sensors measured the following: biogas production (Elster
BK-G2.5 Diaphragm gas flow meter), methane and carbon dioxide content of the biogas at
both the digester outlet and at the system outlet (Dynament NDIR CH4 sensor, Dynament
NDIR CO2 sensor), temperatures of the digester, greenhouse and outside ambient (Atlas
Scientific ENV-TEMP thermistor), electrical consumption of the site (ISKRAEMECO ME162
electricity meter) and digester (Finder 7E.13 electricity meter), heat consumption of the
digester (Superstatic 449 heat meter) and incident solar radiation on the greenhouse
(APOGEE CS-300 Pyrometer). In addition, biogas oxygen (ITG-103 electrochemical sensor)
and hydrogen sulphide (ITG I-46 electrochemical sensor) composition were measured
intermittently but these sensors did not operate reliably over the monitoring period.
Calibration of the biogas composition sensors was done using a calibration gas containing 35
% carbon dioxide, 1 % oxygen, 50 ppm hydrogen sulphide and the balance being methane.
Recalibration was performed approximately every two months over the monitoring period.
All other sensors were pre-calibrated from the factory.
The customised PC data logging software was developed using DAQFactory software and
data was made available online through the DAQConnect website, for data sharing amongst
the larger project team.
7
2.3.3 Offline analyses – laboratory-based testing of pre-digester and digestate
Samples from both the pre-digester tank and the digester output (digestate) were taken by
the operator. TS and VS were measured as per standard methods (APHA, 1998), pH was
measured with a Hach pH meter and probe. VFAs were measured using an Agilent 7890A
gas chromatograph, with a DB-FFAP column of high polarity designed for the analysis of
VFAs, as per the manufacturer’s guidelines. Elemental content was determined using an
elemental analyser (Flash EA2000, CE Instruments) equipped with a flame photometric
detector (Flash EA 1112 FPD, CE Instruments). Alkalinity was measured by titration using
endpoints of 5.75 (partial) and 4.3 (total) with intermediate alkalinity being the difference
between the partial and total alkalinities. Anion and cation concentrations were measured
using a Metrohm 940 ProfIC Vario Ion Chromatography system. Theoretical COD (Chemical
Oxygen Demand) was calculated using the method of Baker et al. (1999).
3 Results and Discussion
3.1 System overview
3.1.1 Operational Key performance indicators for comparison
The data collected allowed the calculation of total feed and water added to the AD system
over its operational period, hydraulic retention time (HRT), total biogas production and
average overall, specific and volumetric biogas production. These are summarised in Table
1.
Table 1: Key performance statistics for the micro-AD plant from day 80 to day 399
Measurements Value Unit
Average daily feed amount 14.3 kg day-1
Average daily VS added 3.22 kg day-1
Average OLR 1.6 kg VS m-3 day-1
Average water added 2.3 kg day-1
Average daily biogas production 3.15 m3 day-1
Volumetric daily biogas production 1.57 m3biogas m-3
digester day-1
Total mass of food added 4574 kg
Specific biogas yield 220 m3 tonne-1 fresh matter
Specific methane yield 595.5 m3 CH4 tonne-1 VS
Average biogas methane content 60.6 %
Average HRT 127.2 days
Operational period 319 days
Average digester temperature 35.7 ˚C
8
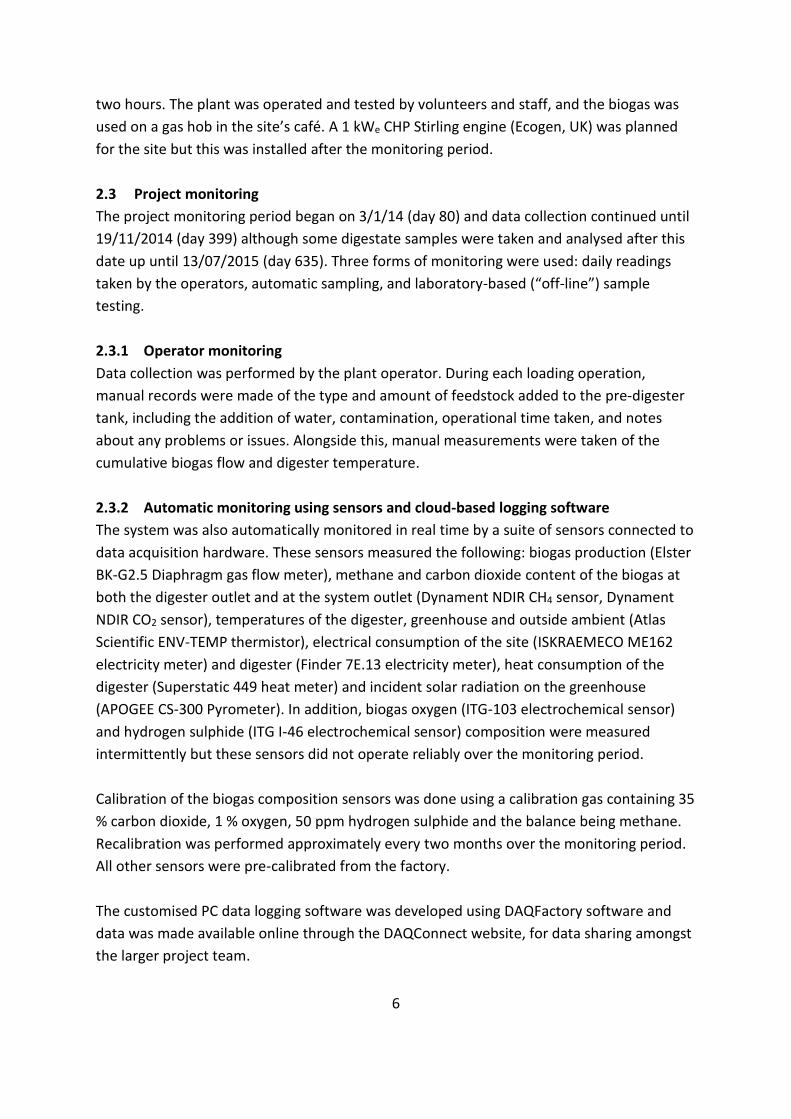
3.1.2 Feedstock and pre-digester tank characterisation
The volumes of each waste feedstock type added to the pre-digester tank are shown in
Figure 2. It can be seen that food waste (from small catering businesses) was the largest
category with over 52% of the total waste added to the AD system, with waste oats also
representing a large fraction of the feed (17%).
By combining a mixed tank model with the data collected by the operator, it is possible to
approximate the composition of the waste being fed into the digester at any moment.
Figure 3 shows (a) the total waste and its composition in the pre-digester tank and (b)
percentage of each category being fed to the digester each day.
Figure 3: Content of the pre-digester tank, (a) by weight and (b) by percentage
composition.
As demonstrated in Figure 2 and Figure 3, the combination of disruptions to the feeding
schedule and a pre-digester tank make it very difficult to ascertain the exact composition of
the feed going into the digester.
3.1.3 Operational observations
Anecdotal evidence given by operators stated that although representing an additional
workload, collection of the daily readings enabled the site staff to engage more effectively
with the workings of the plant and learn more about the processes involved.
Key lessons learned during the testing period were as follows:
Space: due to its location, the site had a very limited space available for the
installation and this led to very little room for maintenance and ‘housekeeping’. This
made the operation of the plant unnecessarily difficult so should be avoided if
possible.
Pre-digester: the pre-digester tank provided very useful storage, which enabled the
operators to add feedstock when it became available, usually twice a week.
9
Odour: Odour was a problem with some feedstocks, which was improved by better
sealing of the pre-digester tank. Operators noted that odour seemed to improve
when oats were added and became worse during periods of heavy feeding.
Noise: Noise is of particular concern in an urban area. The main source of noise
pollution was the milling machinery.
Biogas use: Biogas was initially used in a biogas hob for making hot drinks but later in
the project a custom-built automated biogas boiler was installed. There are no type-
approved ‘off-the-shelf’ heating appliances for biogas currently available in the UK.
Later in the project a CHP Stirling engine was installed.
Digestate: Although it is a very valuable resource, demand for the digestate was
limited and caused issues throughout the testing period. This was due to a number
of reasons, including lack of appropriate regulation at this scale and lack of scientific
data to provide confidence in its safety to potential users for urban horticultural use.
Careful consideration should be given before a plant is built to identify a reliable
outlet for the digestate.
3.1.4 Economic analysis
A brief economic analysis of the plant (details are provided in Appendix 1) shows a higher
than predicted capital cost, mainly due to the need for an expensive logging system, a
bespoke biogas boiler and CHP. Operational costs were lower than expected but not by a
significant amount. Revenue from the plant was lower than expected, because the plant
processed less feedstock than was predicted. The system was able to cover some of its
operational costs by generating revenue from waste disposal and energy production but
required grant funding for its installation. In future systems, it is expected that there are
significant savings to be made from capital costs by increasing production volume and
reducing monitoring requirements.
The economics of this project are not favourable compared to an established plant with
proven technology. At this early stage of development, rather than financial return, the
main drivers behind investment in this plant were the proof of concept, promotion of the
technology and education around the subject. In future applications, the economics of such
a system would need to be more favourable for investment.
3.2 Analysis of the pre-digester tank
As shown in Figure 3, the potential effect of the pre-digester tank can be observed in that
waste loading events (waste added to the pre-digester tank) were decoupled from the
feeding events (into the digester) by the dilution of the loaded feedstock in the existing
contents of the pre-digester tank. This effect can last several months as can be seen clearly
in the ‘washout’ behaviour of apple pomace, which despite only being added to the pre-
digester tank during phase 1 (days 1 to 15), it is still being added to the digester at day 130,
10
during phase 3. The small size of the installation means that it is possible to have a relatively
large pre-digester tank (compared with the main digester). This means that the period of
‘feed buffering’ is relatively long compared with a conventional large-scale AD plant, where
building such a large pre-digester tank would be uneconomical. In this case, the volume
ratio was 1:3 (pre-digester: digester). As food waste is known to be a highly variable
feedstock (Fisgativa et al., 2016), this represents a useful advantage to the micro-scale
application.
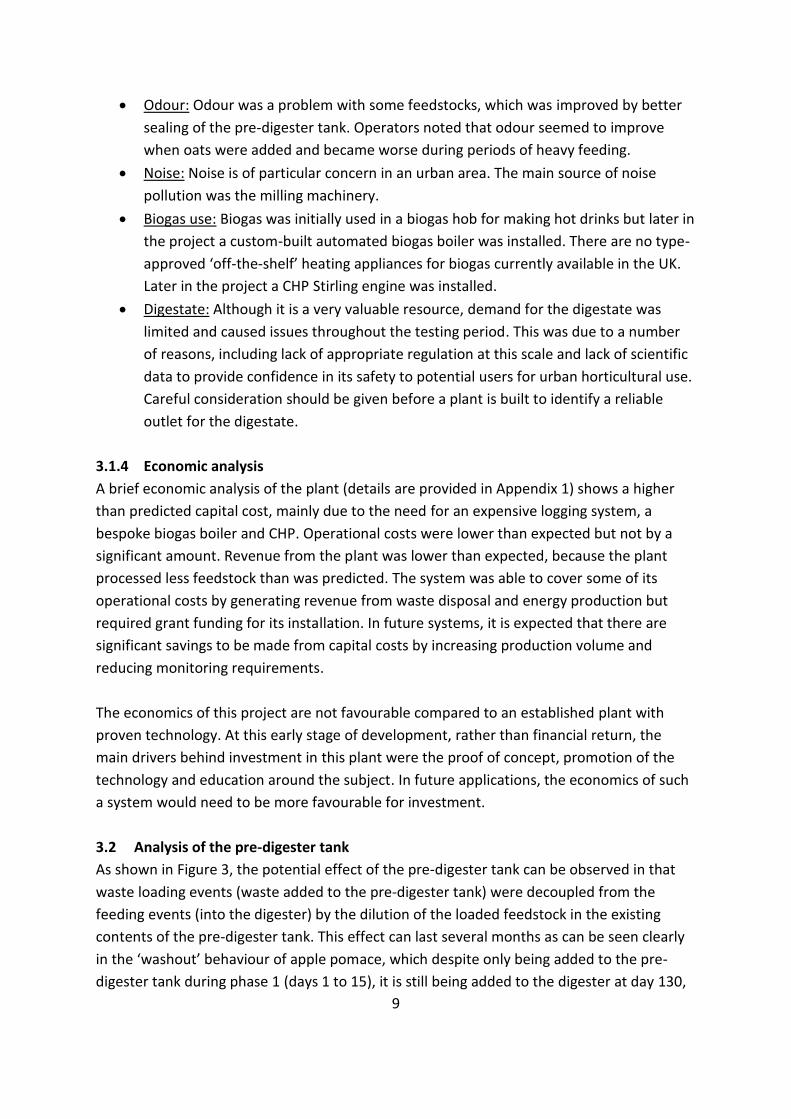
The type of feedstock added to the pre-digester can be related to the measured TS and VS
concentrations in the pre-digester, shown in Figure 4(a). During the period of oats being fed
into in the pre-digester tank (phase 3, days 108 to 294) the TS of the pre-digester rose from
22% to 37%, and then fell during phase 4, when predominantly food waste was added to the
pre-digester tank.
Figure 4: Laboratory analysis of the pre-digester tank showing (a) TS, VS and theoretical
COD, and (b) VFA and pH
The variation in TS and VS is important, as these concentrations have a large impact on the
potential biogas production of the feedstock. The VS has a large variation (from 16% to
34%), however the theoretical COD, calculated from the elemental composition, shows very
little variation during the testing period since it is specific to the solids material.
The VFA concentration in the pre-digester tank is an indicator of the amount of hydrolysis
and fermentation taking place. This peaked in phase 3 at around 22.4 kg m-3. After this
point, a reduction in the VFA concentration is observed, likely to be a consequence of the
decrease in pH leading to an inhibition of fermentation, analogous to ensiling. The low pH
environment in the pre-digester tank is such that the formation of methane by
methanogenic organisms can be ruled out since these organisms cannot grow under these
conditions (Angelidaki et al., 2003).
The average elemental composition of the feedstock was 49.0, 34.8, 6.2 and 2.92 (% by
mass of TS) of C, H, O and N, respectively, i.e. a C:N of 14.4.
11
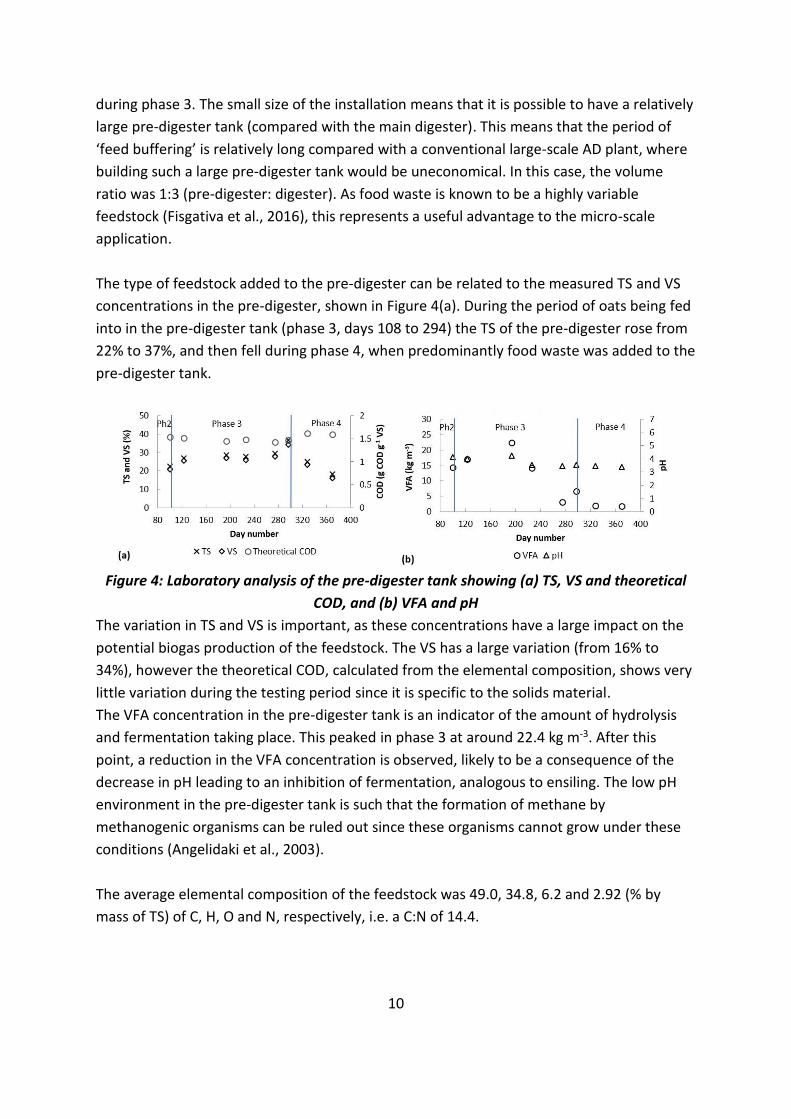
3.3 Digestate characterisation
Figure 5: Laboratory analysis of the digestate showing (a) TS and VS, (b) pH and IA/PA, (c)
PA and IA, and (d) TA and VFA.
A summary of the laboratory analysis of the digestate is shown in Figure 5. A general
increasing trend in TS and VS was observed as the initial inoculum (diluted digestate and
cattle slurry) was replaced with the mixed waste feedstock. The trend appears to have
levelled off by the end of the testing period, indicating the arrival at a pseudo steady state
of the system in terms of mass balance, albeit dependent on the input moisture content and
added water. The digestion process appears healthy throughout the testing period. The
process is characterised by; stable pH (well within the optimum range for the growth of
methanogens) (Gujer and Zehnder, 1983); a gradual increase in partial and total alkalinity
and generally low (<500 mg l-1) VFA concentrations after the initial acclimatisation period.
The average temperature of the digester during the testing period was 35.7 °C and stayed
within ±1 °C of this. The greenhouse had a positive effect on the temperatures and energy
requirements of the system, as described in section 3.6.1.
The digestate was tested off-line and found to contain negligible amounts of pathogens
(E.Coli and Salmonella). Operator experience was that it was stable and had minimal odour.
The average retention time for the feed in the digester was 127 days.
3.3.1 Ion analysis
Average digestate anion concentrations were 0.84, 0.24, 3.72, 1.67, 0.05 g l-1 for Na+, Ca2+,
NH4+, K+ and Mg2+, cation concentrations were 1.52, 0.09 and 0.22 g l-1 of Cl-, Br- and PO4
2-
respectively. The NPK, presented as is conventional for fertilisers, of the mature digestate
12
(the sample taken on day 370) on a dry basis is 16.2:1:9.6 which is similar to that reported
by WRAP for food waste digestate (15.3;1;3.8)(WRAP, 2011).
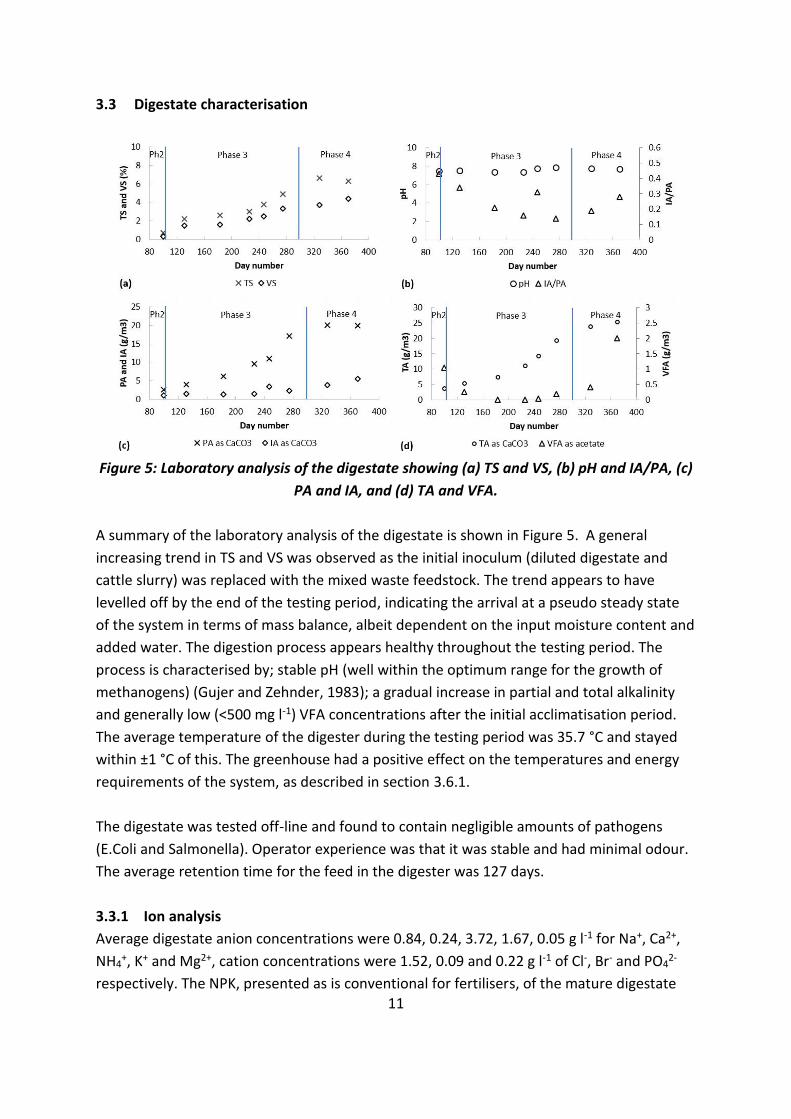
3.4 Biogas production
There were variations in biogas production per unit feed over the project period, caused
predominantly by variations in the composition and amount of feedstock added to the
system.
Figure 6: (a) Digester OLR and feed added to the digester (I-11), (b) biogas production (I-
04) and (c) biogas methane content (I-02) during the test period.
The biogas production of the system is highly variable from day to day, as shown in Figure 6,
whereas a weekly trend showed a gradual increase reaching around 4-5 m3 day-1 up to day
289, after which there was a gradual decrease in the biogas production from the system.
The quality of the biogas, as shown in Figure 6(c), shows less daily variation but over the
course of the project the trend was a gradual decrease in the methane composition of the
biogas from around 65% to around 57%. The hydrogen sulphide was not measured regularly
but spot measurements gave an average pre-treatment H2S reading of > 200 ppm (out of
13
range of the sensor used) and an average post- treatment reading of 178 ppm. To
understand the reason for the downward trend in methane composition, further analysis
would be required; it is possible that the change in the feedstock composition led to a
natural reduction in the biogas composition, but it could also be an early sign of process
instability (Lv et al., 2014); this is discussed further in section 3.5. The decrease in biogas
production volume was not caused by a reduction in the OLR (which remained fairly
constant from around day 235 onwards, at around 2.2 kg m-3 day-1, shown in Figure 6(a)) but
a reduction in the VS concentration of the mixed biomass in the pre-digester tank, which
decreased from around day 297 onwards, as shown in Figure 4. This would also contribute
to the reducing biogas production, and was likely due to a change in feedstock from waste
oats to food waste.
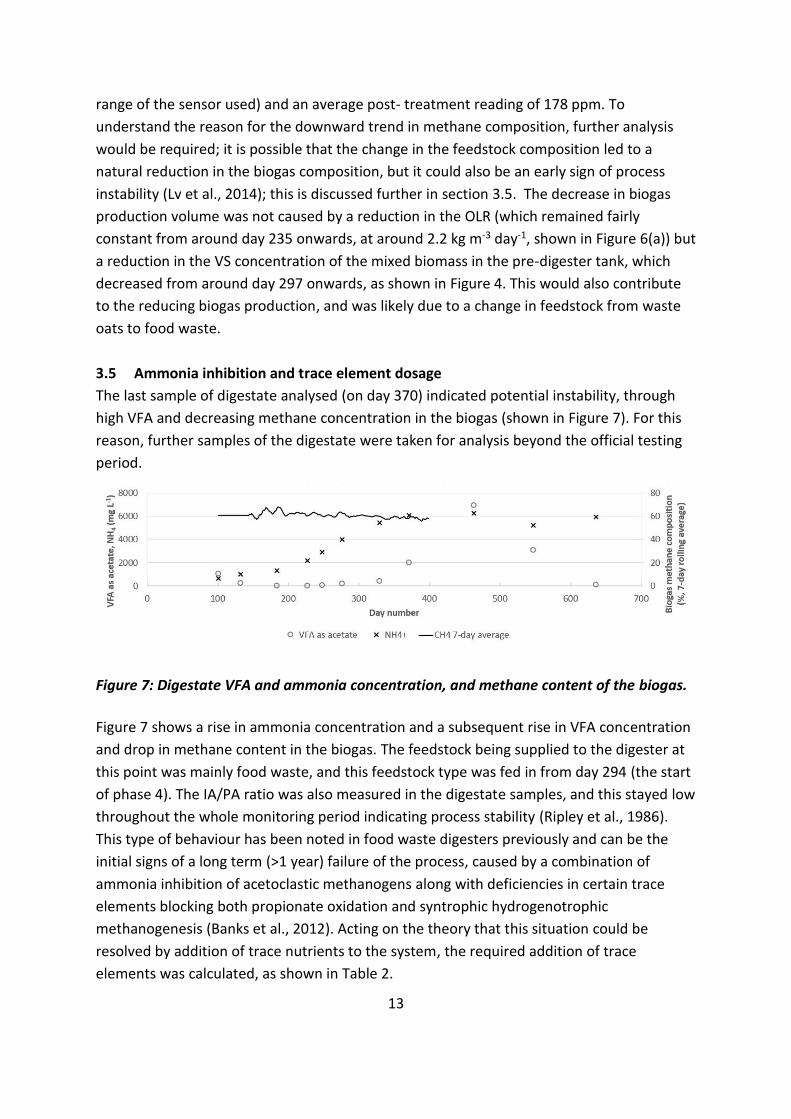
3.5 Ammonia inhibition and trace element dosage
The last sample of digestate analysed (on day 370) indicated potential instability, through
high VFA and decreasing methane concentration in the biogas (shown in Figure 7). For this
reason, further samples of the digestate were taken for analysis beyond the official testing
period.
Figure 7: Digestate VFA and ammonia concentration, and methane content of the biogas.
Figure 7 shows a rise in ammonia concentration and a subsequent rise in VFA concentration
and drop in methane content in the biogas. The feedstock being supplied to the digester at
this point was mainly food waste, and this feedstock type was fed in from day 294 (the start
of phase 4). The IA/PA ratio was also measured in the digestate samples, and this stayed low
throughout the whole monitoring period indicating process stability (Ripley et al., 1986).
This type of behaviour has been noted in food waste digesters previously and can be the
initial signs of a long term (>1 year) failure of the process, caused by a combination of
ammonia inhibition of acetoclastic methanogens along with deficiencies in certain trace
elements blocking both propionate oxidation and syntrophic hydrogenotrophic
methanogenesis (Banks et al., 2012). Acting on the theory that this situation could be
resolved by addition of trace nutrients to the system, the required addition of trace
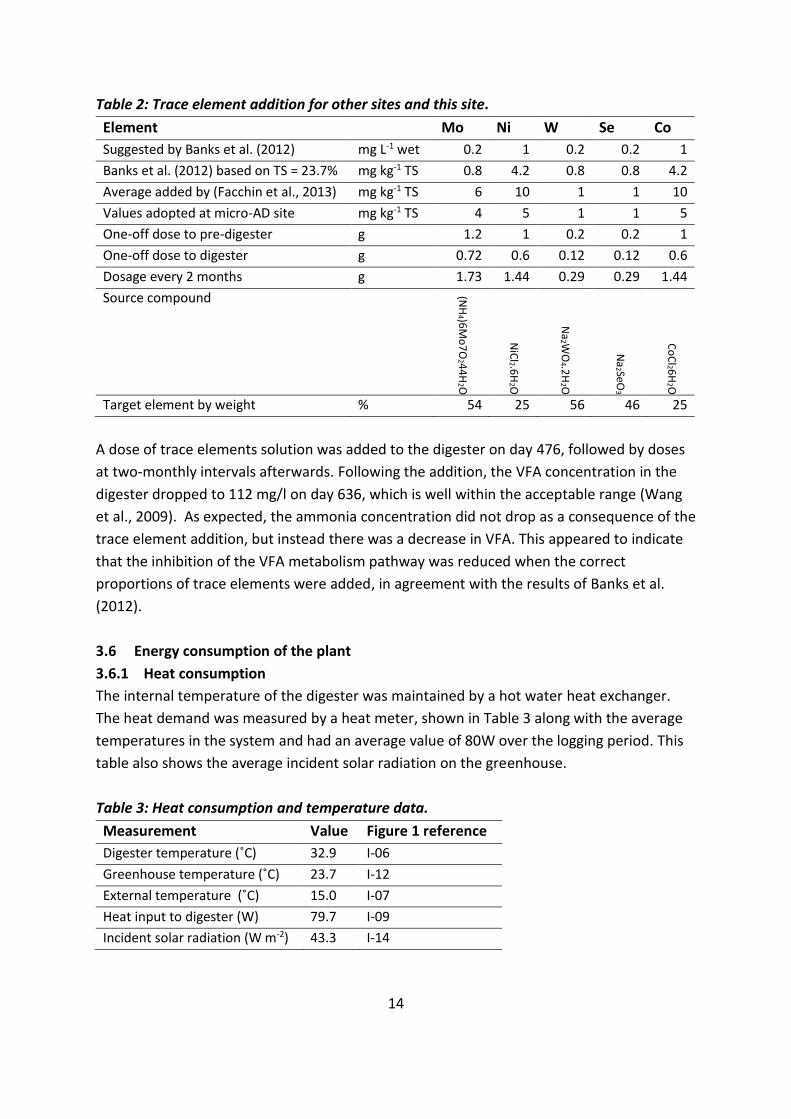
elements was calculated, as shown in Table 2.
14
Table 2: Trace element addition for other sites and this site.
Element Mo Ni W Se Co
Suggested by Banks et al. (2012) mg L-1 wet 0.2 1 0.2 0.2 1
Banks et al. (2012) based on TS = 23.7% mg kg-1 TS 0.8 4.2 0.8 0.8 4.2
Average added by (Facchin et al., 2013) mg kg-1 TS 6 10 1 1 10
Values adopted at micro-AD site mg kg-1 TS 4 5 1 1 5
One-off dose to pre-digester g 1.2 1 0.2 0.2 1
One-off dose to digester g 0.72 0.6 0.12 0.12 0.6
Dosage every 2 months g 1.73 1.44 0.29 0.29 1.44
Source compound
(NH
4 )6M
o7
O2 4
4H
2 O
NiC
l2 .6H
2 O
Na
2 WO
4 .2H
2 O
Na
2 SeO3
Co
Cl2 6
H2 O
Target element by weight % 54 25 56 46 25
A dose of trace elements solution was added to the digester on day 476, followed by doses
at two-monthly intervals afterwards. Following the addition, the VFA concentration in the
digester dropped to 112 mg/l on day 636, which is well within the acceptable range (Wang
et al., 2009). As expected, the ammonia concentration did not drop as a consequence of the
trace element addition, but instead there was a decrease in VFA. This appeared to indicate
that the inhibition of the VFA metabolism pathway was reduced when the correct
proportions of trace elements were added, in agreement with the results of Banks et al.
(2012).
3.6 Energy consumption of the plant
3.6.1 Heat consumption
The internal temperature of the digester was maintained by a hot water heat exchanger.
The heat demand was measured by a heat meter, shown in Table 3 along with the average
temperatures in the system and had an average value of 80W over the logging period. This
table also shows the average incident solar radiation on the greenhouse.
Table 3: Heat consumption and temperature data.
Measurement Value Figure 1 reference
Digester temperature (˚C) 32.9 I-06
Greenhouse temperature (˚C) 23.7 I-12
External temperature (˚C) 15.0 I-07
Heat input to digester (W) 79.7 I-09
Incident solar radiation (W m-2) 43.3 I-14
15
Temperature data collected by the logging system can be used to analyse the bulk heat
transfer characteristics of the micro-AD system. Because the temperature of the digester
was approximately constant throughout the project, the heat loss from the digester can be
equated to its heat input. The heat loss has conductive, convective and radiative elements
although for this analysis they are simply grouped together to give an overall heat loss value
and overall heat transfer coefficient.
Using monthly data for temperature and heat use on the heat meter, the heat transfer
coefficient (K) can be calculated using the equation �̇� = 𝐾∆𝑇, where �̇� is the heat loss (W),
𝐾 is the overall heat transfer coefficient (W ˚C-1) and ∆𝑇 is the temperature difference (˚C).
This equation can be used with the average temperature difference between digester and
greenhouse to give the digester overall effective heat transfer coefficient (Kd), and the
difference between the digester and ambient to give the overall effective heat transfer
coefficient for both the digester and greenhouse together (Kb).
Kd had an average of 8.7 W ˚C-1 (8.0-9.5 with 95% confidence) giving the digester a U-value
of approximately 0.85 W m-2 ˚C-1. The heat demand varies in the range 39.1-111.5 W over
the logging period, although given the mild winter conditions, this could be expected to
increase to around 121 W with an average ambient winter temperature of around 4.4 ˚C
and higher in severe winter conditions. Kb was estimated at 4.2 W ˚C-1 (3.5-5.0 with 95%
confidence). Using both of these average heat transfer coefficients, an approximation can
be made of the energy savings given by housing the digester in the greenhouse.
To assess the heating effect of the greenhouse, the calculations for heat demand above can
be repeated, instead using the difference between the digester temperature and the
ambient temperature.
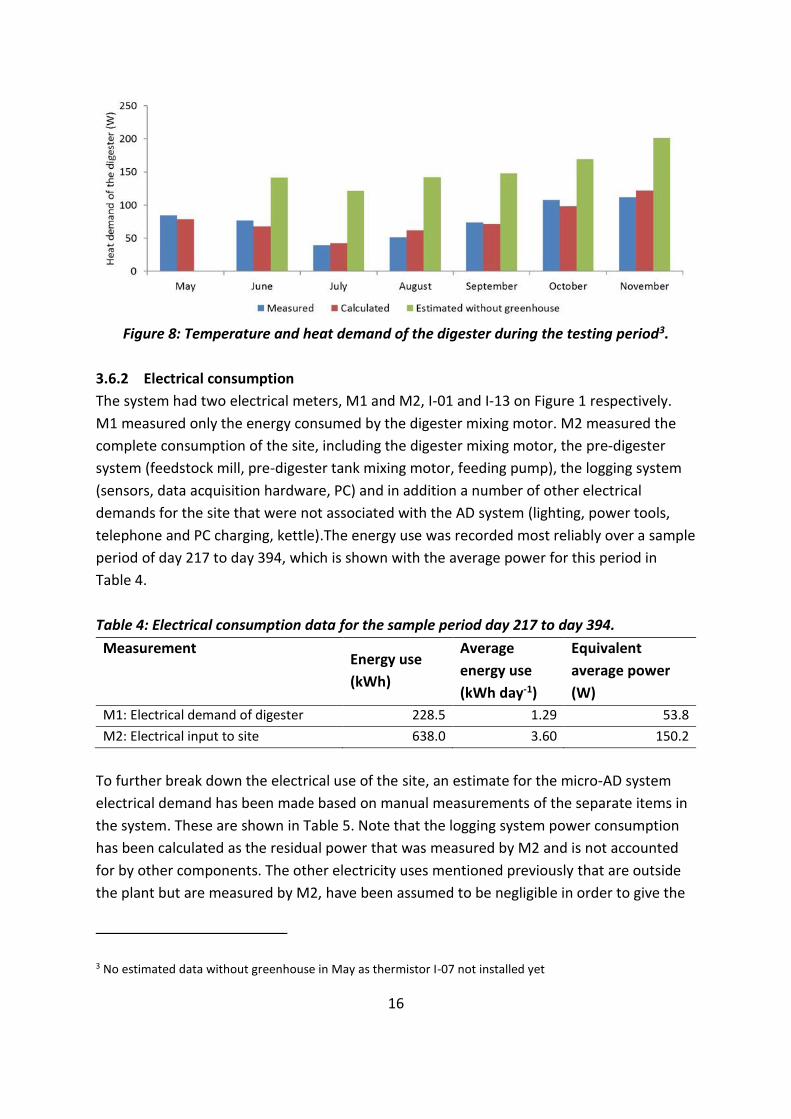
The measured heat demand, calculated heat demand, and calculated heat demand without
the greenhouse are shown in Figure 8. Based on this analysis, the overall heat savings of
putting the digester inside a greenhouse are an average of 49% (of the projected heat
demand without housing) or 76.6 W.
16
Figure 8: Temperature and heat demand of the digester during the testing period3.
3.6.2 Electrical consumption
The system had two electrical meters, M1 and M2, I-01 and I-13 on Figure 1 respectively.
M1 measured only the energy consumed by the digester mixing motor. M2 measured the
complete consumption of the site, including the digester mixing motor, the pre-digester
system (feedstock mill, pre-digester tank mixing motor, feeding pump), the logging system
(sensors, data acquisition hardware, PC) and in addition a number of other electrical
demands for the site that were not associated with the AD system (lighting, power tools,
telephone and PC charging, kettle).The energy use was recorded most reliably over a sample
period of day 217 to day 394, which is shown with the average power for this period in
Table 4.
Table 4: Electrical consumption data for the sample period day 217 to day 394.
Measurement Energy use
(kWh)
Average
energy use
(kWh day-1)
Equivalent
average power
(W)
M1: Electrical demand of digester 228.5 1.29 53.8
M2: Electrical input to site 638.0 3.60 150.2
To further break down the electrical use of the site, an estimate for the micro-AD system
electrical demand has been made based on manual measurements of the separate items in
the system. These are shown in Table 5. Note that the logging system power consumption
has been calculated as the residual power that was measured by M2 and is not accounted
for by other components. The other electricity uses mentioned previously that are outside
the plant but are measured by M2, have been assumed to be negligible in order to give the
3 No estimated data without greenhouse in May as thermistor I-07 not installed yet
17
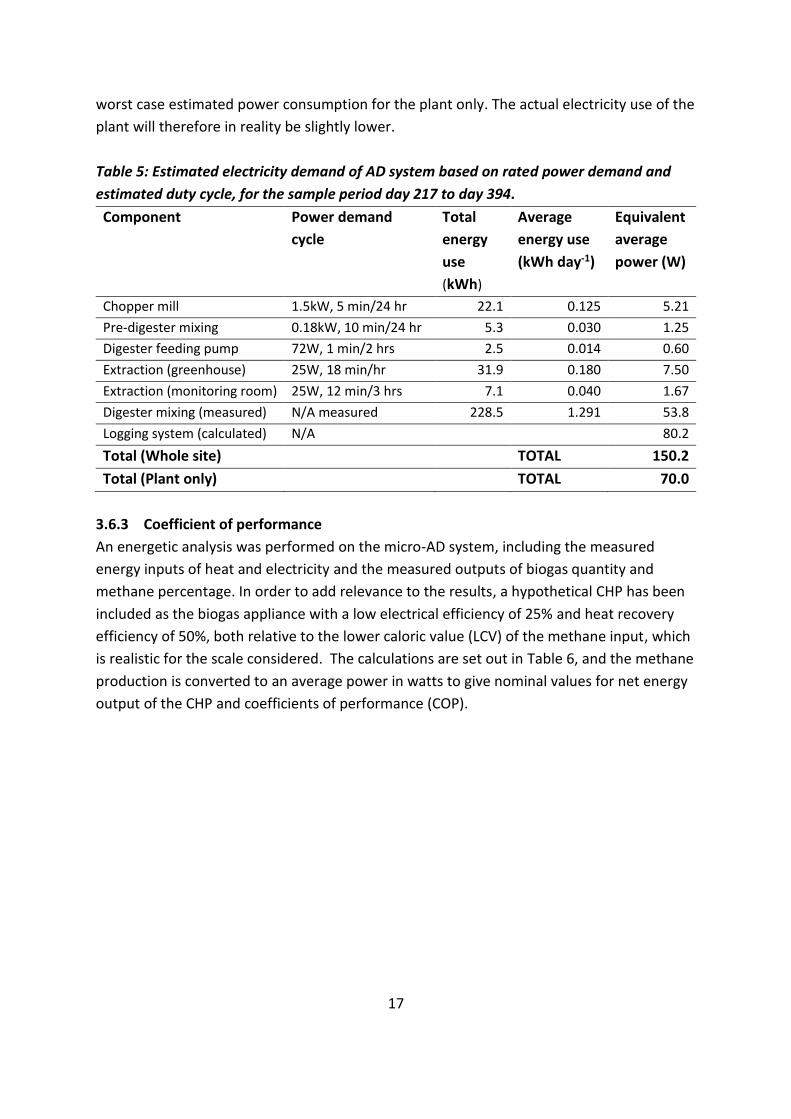
worst case estimated power consumption for the plant only. The actual electricity use of the
plant will therefore in reality be slightly lower.
Table 5: Estimated electricity demand of AD system based on rated power demand and
estimated duty cycle, for the sample period day 217 to day 394.
Component Power demand
cycle
Total
energy
use
(kWh)
Average
energy use
(kWh day-1)
Equivalent
average
power (W)
Chopper mill 1.5kW, 5 min/24 hr 22.1 0.125 5.21
Pre-digester mixing 0.18kW, 10 min/24 hr 5.3 0.030 1.25
Digester feeding pump 72W, 1 min/2 hrs 2.5 0.014 0.60
Extraction (greenhouse) 25W, 18 min/hr 31.9 0.180 7.50
Extraction (monitoring room) 25W, 12 min/3 hrs 7.1 0.040 1.67
Digester mixing (measured) N/A measured 228.5 1.291 53.8
Logging system (calculated) N/A 80.2
Total (Whole site) TOTAL 150.2
Total (Plant only) TOTAL 70.0
3.6.3 Coefficient of performance
An energetic analysis was performed on the micro-AD system, including the measured
energy inputs of heat and electricity and the measured outputs of biogas quantity and
methane percentage. In order to add relevance to the results, a hypothetical CHP has been
included as the biogas appliance with a low electrical efficiency of 25% and heat recovery
efficiency of 50%, both relative to the lower caloric value (LCV) of the methane input, which
is realistic for the scale considered. The calculations are set out in Table 6, and the methane
production is converted to an average power in watts to give nominal values for net energy
output of the CHP and coefficients of performance (COP).
18
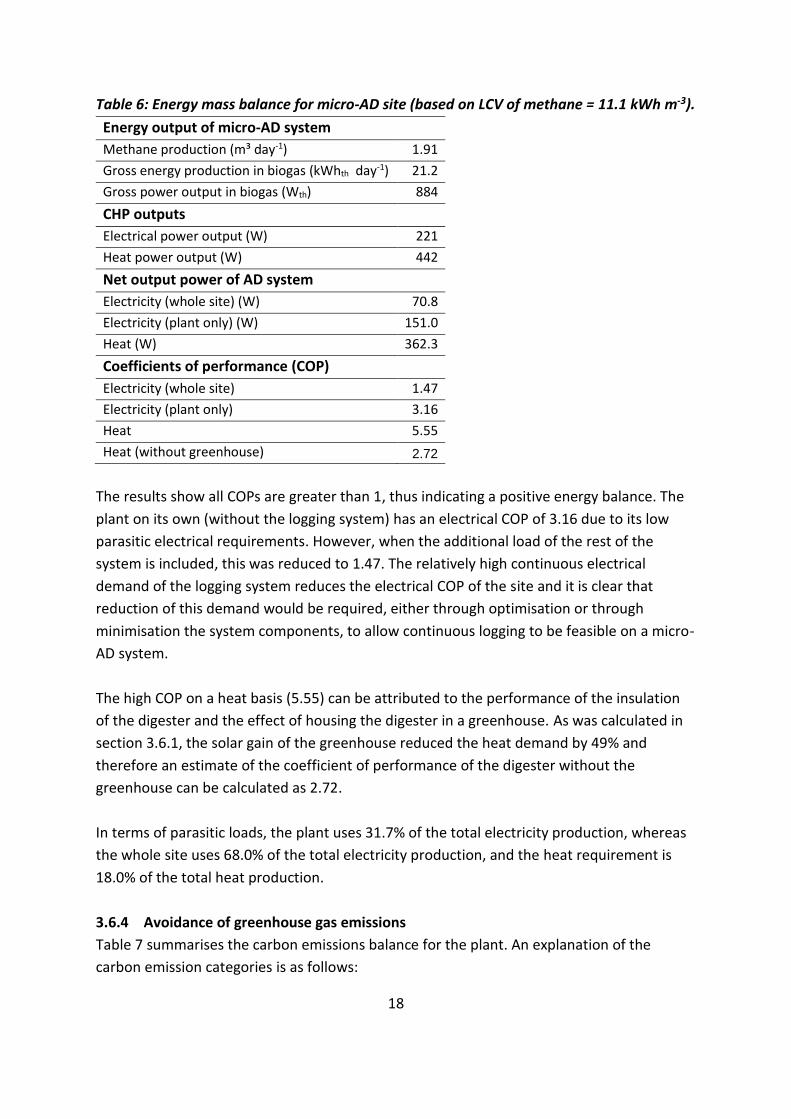
Table 6: Energy mass balance for micro-AD site (based on LCV of methane = 11.1 kWh m-3).
Energy output of micro-AD system
Methane production (m³ day-1) 1.91
Gross energy production in biogas (kWhth day-1) 21.2
Gross power output in biogas (Wth) 884
CHP outputs Electrical power output (W) 221
Heat power output (W) 442
Net output power of AD system Electricity (whole site) (W) 70.8
Electricity (plant only) (W) 151.0
Heat (W) 362.3
Coefficients of performance (COP) Electricity (whole site) 1.47
Electricity (plant only) 3.16
Heat 5.55
Heat (without greenhouse) 2.72
The results show all COPs are greater than 1, thus indicating a positive energy balance. The
plant on its own (without the logging system) has an electrical COP of 3.16 due to its low
parasitic electrical requirements. However, when the additional load of the rest of the
system is included, this was reduced to 1.47. The relatively high continuous electrical
demand of the logging system reduces the electrical COP of the site and it is clear that
reduction of this demand would be required, either through optimisation or through
minimisation the system components, to allow continuous logging to be feasible on a micro-
AD system.
The high COP on a heat basis (5.55) can be attributed to the performance of the insulation
of the digester and the effect of housing the digester in a greenhouse. As was calculated in
section 3.6.1, the solar gain of the greenhouse reduced the heat demand by 49% and
therefore an estimate of the coefficient of performance of the digester without the
greenhouse can be calculated as 2.72.
In terms of parasitic loads, the plant uses 31.7% of the total electricity production, whereas
the whole site uses 68.0% of the total electricity production, and the heat requirement is
18.0% of the total heat production.
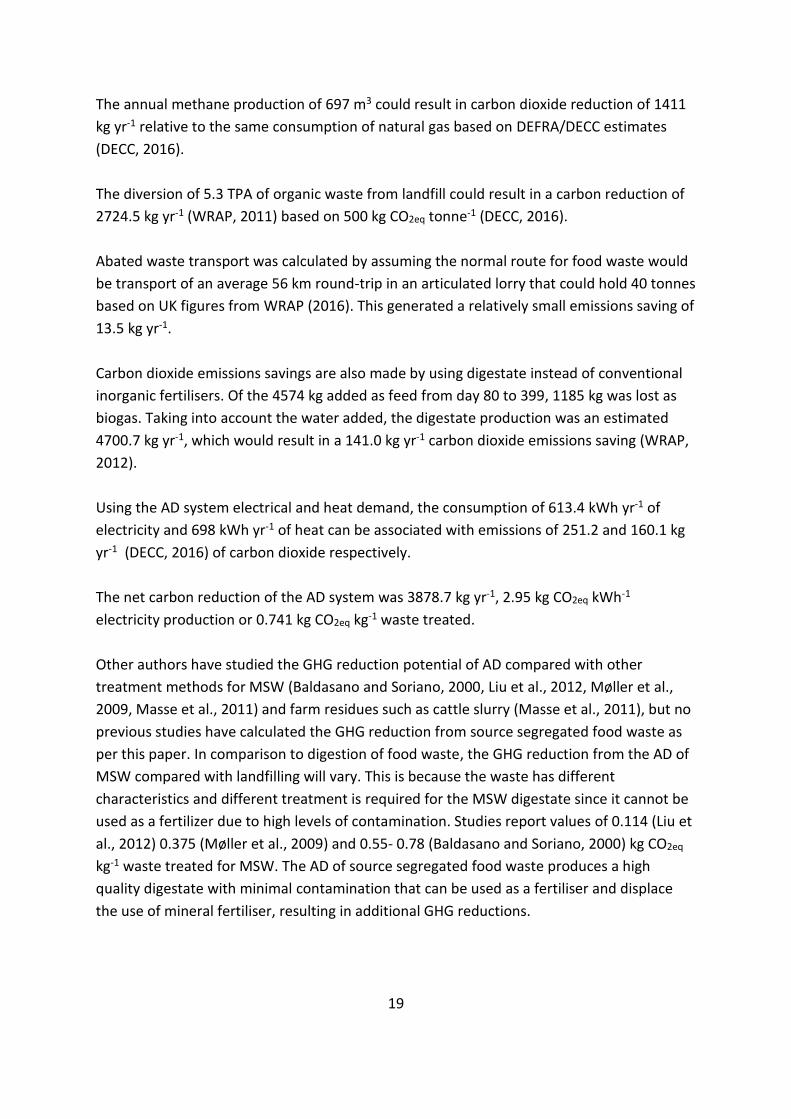
3.6.4 Avoidance of greenhouse gas emissions
Table 7 summarises the carbon emissions balance for the plant. An explanation of the
carbon emission categories is as follows:
19
The annual methane production of 697 m3 could result in carbon dioxide reduction of 1411
kg yr-1 relative to the same consumption of natural gas based on DEFRA/DECC estimates
(DECC, 2016).
The diversion of 5.3 TPA of organic waste from landfill could result in a carbon reduction of
2724.5 kg yr-1 (WRAP, 2011) based on 500 kg CO2eq tonne-1 (DECC, 2016).
Abated waste transport was calculated by assuming the normal route for food waste would
be transport of an average 56 km round-trip in an articulated lorry that could hold 40 tonnes
based on UK figures from WRAP (2016). This generated a relatively small emissions saving of
13.5 kg yr-1.
Carbon dioxide emissions savings are also made by using digestate instead of conventional
inorganic fertilisers. Of the 4574 kg added as feed from day 80 to 399, 1185 kg was lost as
biogas. Taking into account the water added, the digestate production was an estimated
4700.7 kg yr-1, which would result in a 141.0 kg yr-1 carbon dioxide emissions saving (WRAP,
2012).
Using the AD system electrical and heat demand, the consumption of 613.4 kWh yr-1 of
electricity and 698 kWh yr-1 of heat can be associated with emissions of 251.2 and 160.1 kg
yr-1 (DECC, 2016) of carbon dioxide respectively.
The net carbon reduction of the AD system was 3878.7 kg yr-1, 2.95 kg CO2eq kWh-1
electricity production or 0.741 kg CO2eq kg-1 waste treated.
Other authors have studied the GHG reduction potential of AD compared with other
treatment methods for MSW (Baldasano and Soriano, 2000, Liu et al., 2012, Møller et al.,
2009, Masse et al., 2011) and farm residues such as cattle slurry (Masse et al., 2011), but no
previous studies have calculated the GHG reduction from source segregated food waste as
per this paper. In comparison to digestion of food waste, the GHG reduction from the AD of
MSW compared with landfilling will vary. This is because the waste has different
characteristics and different treatment is required for the MSW digestate since it cannot be
used as a fertilizer due to high levels of contamination. Studies report values of 0.114 (Liu et
al., 2012) 0.375 (Møller et al., 2009) and 0.55- 0.78 (Baldasano and Soriano, 2000) kg CO2eq
kg-1 waste treated for MSW. The AD of source segregated food waste produces a high
quality digestate with minimal contamination that can be used as a fertiliser and displace
the use of mineral fertiliser, resulting in additional GHG reductions.
20
Table 7: Greenhouse gas balance for the plant.
Item Associated CO₂
emissions
Reference CO₂ saving
kg yr-1
Methane produced, for use in CHP 2.0245 kg CO₂eq m-³ (DECC, 2016) 1411.0
Diversion of waste from landfill 500 kg CO₂eq tonne-1 (DECC/DEFRA, 2011) 2724.5
Reduction in transport 2.7 kg CO₂eq tonne-1 waste (GOV.UK, 2015) 13.5
Displacement of artificial fertilisers 30 kg CO₂eq tonne-1
digestate
(WRAP, 2012) 141.0
Use of electricity 0.40957 kg CO₂eq kWh-1 (DECC, 2016) - 251.2
Heating the digester 0.20405 kg CO2eq kWh-1 (DECC, 2016) - 160.1
NET CARBON EMISSIONS AVOIDANCE 3878.7 kg CO₂eq yr-1
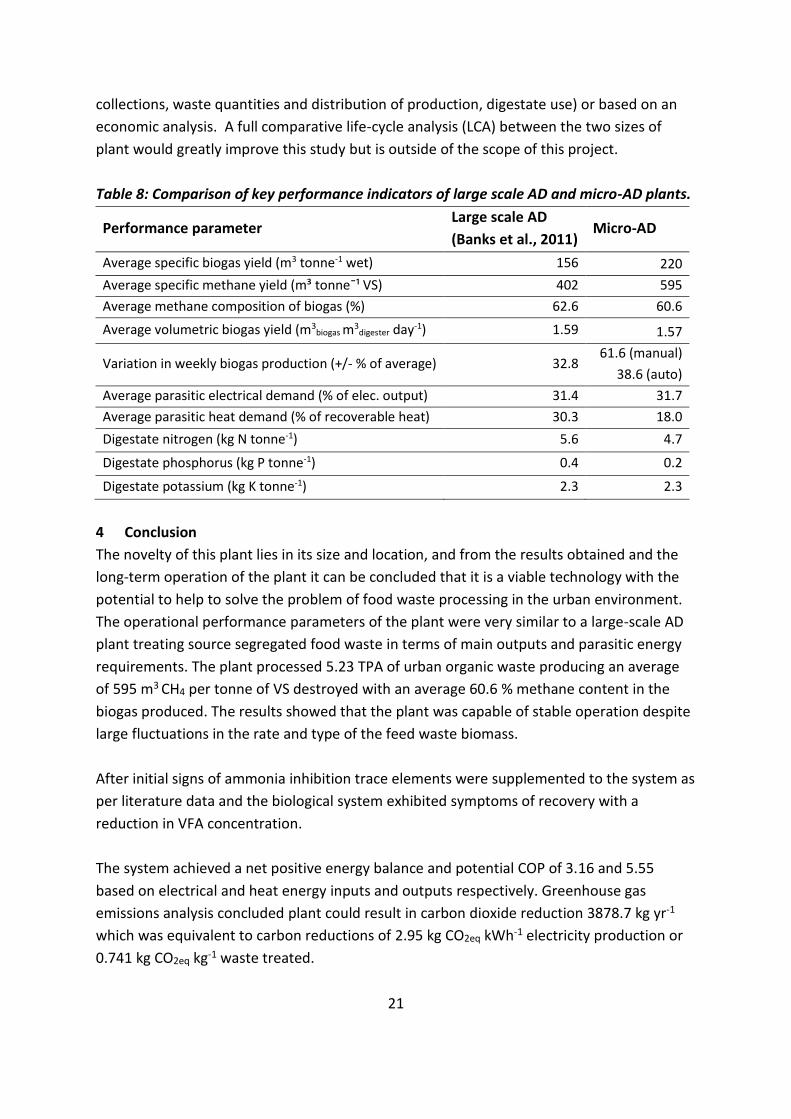
3.7 Comparison with a large-scale AD plant
Published data (Banks et al., 2011) from a 900 m3 commercial anaerobic digestion system
fed on food and green waste allows a comparison of some of the performance outputs of
micro-AD with large scale AD. Values either directly taken from or derived from the data
presented in the paper, are shown, and compared with equivalent values for the micro-AD
site in Table 8.
Results for volumetric biogas yield and biogas composition are broadly similar for both
systems, thus demonstrating a similar level of performance in terms of biomethane output
when compared with the size of the system. The average specific methane yield from the
feedstock was much lower in the large scale system, which could indicate a performance
difference. However, in consideration of the other available data on the monitoring of the
large scale plant, it is thought that this can probably be attributed to an actual reduced
biogas potential of the feedstock due to addition of green waste and the feeding of less
fresh food waste into the system. In comparison, the micro-AD digester was fed
predominantly food waste and oats, which both have a high specific methane potential. The
variation in weekly biogas flow was greater in the micro-AD system especially during the
manual feeding period, but was more comparable with the large-scale system once the
automatic feeding was implemented.
The parasitic requirement of the large-scale system (31.4 %) is similar to that of the micro-
AD system (31.7 %) and the parasitic heat requirement is much greater in the large system
which can be attributed to the pasteurisation heat (no pasteurisation was performed at the
micro-AD site).
Using the data available, it appears that the performance of the micro-AD is either
comparable or slightly better than the large scale AD system. However, it is likely that the
choice of appropriate scale would be made based on factors external to the system (e.g.
21
collections, waste quantities and distribution of production, digestate use) or based on an
economic analysis. A full comparative life-cycle analysis (LCA) between the two sizes of
plant would greatly improve this study but is outside of the scope of this project.
Table 8: Comparison of key performance indicators of large scale AD and micro-AD plants.
Performance parameter Large scale AD
(Banks et al., 2011) Micro-AD
Average specific biogas yield (m3 tonne-1 wet) 156 220
Average specific methane yield (m³ tonneˉ¹ VS) 402 595
Average methane composition of biogas (%) 62.6 60.6
Average volumetric biogas yield (m3biogas m3
digester day-1) 1.59 1.57
Variation in weekly biogas production (+/- % of average) 32.8 61.6 (manual)
38.6 (auto)
Average parasitic electrical demand (% of elec. output) 31.4 31.7
Average parasitic heat demand (% of recoverable heat) 30.3 18.0
Digestate nitrogen (kg N tonne-1) 5.6 4.7
Digestate phosphorus (kg P tonne-1) 0.4 0.2
Digestate potassium (kg K tonne-1) 2.3 2.3
4 Conclusion
The novelty of this plant lies in its size and location, and from the results obtained and the
long-term operation of the plant it can be concluded that it is a viable technology with the
potential to help to solve the problem of food waste processing in the urban environment.
The operational performance parameters of the plant were very similar to a large-scale AD
plant treating source segregated food waste in terms of main outputs and parasitic energy
requirements. The plant processed 5.23 TPA of urban organic waste producing an average
of 595 m3 CH4 per tonne of VS destroyed with an average 60.6 % methane content in the
biogas produced. The results showed that the plant was capable of stable operation despite
large fluctuations in the rate and type of the feed waste biomass.
After initial signs of ammonia inhibition trace elements were supplemented to the system as
per literature data and the biological system exhibited symptoms of recovery with a
reduction in VFA concentration.
The system achieved a net positive energy balance and potential COP of 3.16 and 5.55
based on electrical and heat energy inputs and outputs respectively. Greenhouse gas
emissions analysis concluded plant could result in carbon dioxide reduction 3878.7 kg yr-1
which was equivalent to carbon reductions of 2.95 kg CO2eq kWh-1 electricity production or
0.741 kg CO2eq kg-1 waste treated.
22
5 Acknowledgments
The authors would like to acknowledge WRAP DIAD II for funding the construction and
operation of the AD plant (full copy of the project report available from www.wrap.org.uk)
and the School of Process Engineering at the University of Leeds for access to their
laboratories and analytical equipment. Thanks go to the LEAP consortium, which included
Community by Design, James Murcott and Angela Bywater at Methanogen UK Ltd, Guy
Blanch Bio Development, Dr David Neylan, Clive Andrews at Aleka Designs and Cath Kibbler
at the Community Composting Network. The generous contributions of the voluntary
Community by Design site staff; Marco Fanasca, Panteha Ahmadi and Tasos Torounidis, are
also acknowledged.
6 References
Angelidaki, I., Ellegaard, L. & Ahring, B. 2003. Applications of the anaerobic digestion
process. Biomethanation II, 1-33.
Apha 1998. Standard methods for the examination of water and wastewater, Washington,
DC, American Public Health Association.
Baker, J. R., Milke, M. W. & Mihelcic, J. R. 1999. Relationship between chemical and
theoretical oxygen demand for specific classes of organic chemicals. Water Research, 33,
327-334.
Baldasano, J. & Soriano, C. 2000. Emission of greenhouse gases from anaerobic digestion
processes: comparison with other municipal solid waste treatments. In: BALDASANO, J.,
MATA-ALVAREZ, J., CECCHI, F. & TILCHE, A. (eds.).
Banks, C. J., Chesshire, M., Heaven, S. & Arnold, R. 2011. Anaerobic digestion of source-
segregated domestic food waste: Performance assessment by mass and energy balance.
Bioresource Technology, 102, 612-620.
Banks, C. J., Zhang, Y., Jiang, Y. & Heaven, S. 2012. Trace element requirements for stable
food waste digestion at elevated ammonia concentrations. Bioresource Technology, 104,
127-135.
Decc. 2016. Greenhouse gas reporting - conversion factors 2016 [Online]. Available:
https://www.gov.uk/government/publications/greenhouse-gas-reporting-conversion-
factors-2016 [Accessed 10th August 2016].
Decc/Defra 2011. Anaerobic Digestion Strategy and Action Plan.
Edwards, J., Othman, M. & Burn, S. 2015. A review of policy drivers and barriers for the use
of anaerobic digestion in Europe, the United States and Australia. Renewable and
Sustainable Energy Reviews, 52, 815-828.
Facchin, V., Cavinato, C., Fatone, F., Pavan, P., Cecchi, F. & Bolzonella, D. 2013. Effect of
trace element supplementation on the mesophilic anaerobic digestion of foodwaste in
batch trials: The influence of inoculum origin. Biochemical Engineering Journal, 70, 71-77.
23
Fisgativa, H., Tremier, A. & Dabert, P. 2016. Characterizing the variability of food waste
quality: A need for efficient valorisation through anaerobic digestion. Waste Management,
50, 264-274.
Gov.Uk. 2015. Average heavy goods vehicle fuel consumption: Great Britain [Online].
Available: https://www.gov.uk/government/statistical-data-sets/env01-fuel-consumption
[Accessed 17th August 2016].
Gujer, W. & Zehnder, A. J. B. 1983. Conversion Processes in Anaerobic Digestion. Water
Science and Technology, 15, 127-167.
Lansing, S., Botero, R. B. & Martin, J. F. 2008. Waste treatment and biogas quality in small-
scale agricultural digesters. Bioresource Technology, 99, 5881-5890.
Liu, X., Gao, X., Wang, W., Zheng, L., Zhou, Y. & Sun, Y. 2012. Pilot-scale anaerobic co-
digestion of municipal biomass waste: Focusing on biogas production and GHG reduction.
Renewable Energy, 44, 463-468.
Lv, Z., Hu, M., Harms, H., Richnow, H. H., Liebetrau, J. & Nikolausz, M. 2014. Stable isotope
composition of biogas allows early warning of complete process failure as a result of
ammonia inhibition in anaerobic digesters. Bioresource Technology, 167, 251-259.
Masse, D. I., Talbot, G. & Gilbert, Y. 2011. On farm biogas production: A method to reduce
GHG emissions and develop more sustainable livestock operations. Animal Feed Science and
Technology, 166-67, 436-445.
Møller, J., Boldrin, A. & Christensen, T. H. 2009. Anaerobic digestion and digestate use:
accounting of greenhouse gases and global warming contribution. Waste Management &
Research, 27, 813-824.
Nnfcc. 2016. Biogas Map [Online]. Available: http://www.biogas-
info.co.uk/resources/biogas-map/ [Accessed 15th August 2016].
Ripley, L. E., Boyle, W. C. & Converse, J. C. 1986. Improved Alkalimetric Monitoring for
Anaerobic Digestion of High-Strength Wastes. Journal (Water Pollution Control Federation),
58, 406-411.
Stoknes, K., Scholwin, F., Krzesiński, W., Wojciechowska, E. & Jasińska, A. 2016. Efficiency of
a novel “Food to waste to food” system including anaerobic digestion of food waste and
cultivation of vegetables on digestate in a bubble-insulated greenhouse. Waste
Management.
Wang, Y., Zhang, Y., Wang, J. & Meng, L. 2009. Effects of volatile fatty acid concentrations
on methane yield and methanogenic bacteria. Biomass and Bioenergy, 33, 848-853.
Wrap 2011. Digestates: Realising the fertiliser benefits for crops and grassland. Banbury:
WRAP.
Wrap 2012. Digestate Action Plan. Banbury: WRAP.
Wrap 2016. Household food waste collections guide. Banbury: WRAP.

24
Appendix 1. Economic analysis
This section provides an economic analysis of the system, which is split into capital costs,
operational costs and revenue (tables A1, A2 and A3 respectively).
Table A1: Predicted and actual capital costs (GBP to Euro October 2013 exchange rate =
1.1815).
Capital cost Predicted Actual
Monitoring system €3385 €3385
Pre-feed system €6262 €5848
Digester €7266 €7266
Gas holder €1477 €1477
Ancillaries €2741 €2741
Gas use €1595 €11224
Infrastructure €1772
Commissioning €1181 €1181
TOTAL CAPITAL COST €25680 €33123
Table A2: Predicted and actual operational costs (GBP to Euro October 2013 exchange rate
= 1.1815).
Operational costs Predicted Actual
Labour cost for prediction (€ hour1) 9.5
Wages for operation (€ year-1) 1725 1474
Parts (€ year-1) 478 478
Maintenance (€ year-1) 47 47
Total operational costs (€ year-1) 2251 2000
Electricity cost
Electricity cost (€ kWh-1) 0.118 0.118
Electricity use digester (€ year-1) 217.3 138.7
Electricity use for feed mill/mixing (€ year-1) 20.1 7.3
Electricity use for extraction (€ year-1) 9.5
Electricity use for monitoring (€ year-1)
107.8
Total Electricity Use (€ year-1) 237.4 263.3
TOTAL ANNUAL COSTS (€ year-1) 2488.14 2263.53
25
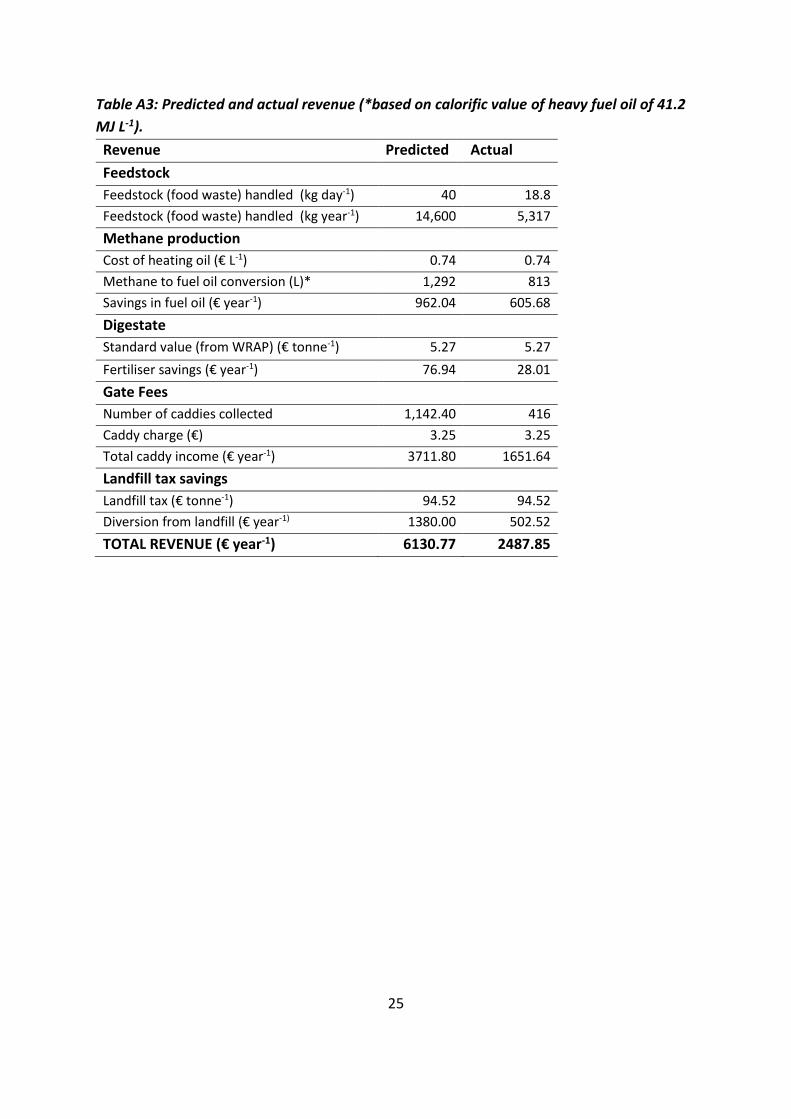
Table A3: Predicted and actual revenue (*based on calorific value of heavy fuel oil of 41.2
MJ L-1).
Revenue Predicted Actual
Feedstock
Feedstock (food waste) handled (kg day-1) 40 18.8
Feedstock (food waste) handled (kg year-1) 14,600 5,317
Methane production
Cost of heating oil (€ L-1) 0.74 0.74
Methane to fuel oil conversion (L)* 1,292 813
Savings in fuel oil (€ year-1) 962.04 605.68
Digestate
Standard value (from WRAP) (€ tonne-1) 5.27 5.27
Fertiliser savings (€ year-1) 76.94 28.01
Gate Fees
Number of caddies collected 1,142.40 416
Caddy charge (€) 3.25 3.25
Total caddy income (€ year-1) 3711.80 1651.64
Landfill tax savings
Landfill tax (€ tonne-1) 94.52 94.52
Diversion from landfill (€ year-1) 1380.00 502.52
TOTAL REVENUE (€ year-1) 6130.77 2487.85