barometric phone sensors – more hype than hope! phone sensors – more hype than hope! kartik...
TRANSCRIPT

Barometric Phone Sensors – More Hype Than Hope!
Kartik Muralidharan†, Azeem Javed Khan§, Archan Misra†,Rajesh Krishna Balan†, Sharad Agarwal‡
†Singapore Management University, §Oriental Institute of Management, ‡Microsoft Research†{kartikm.2010,archanm,rajesh}@smu.edu.sg, §[email protected], ‡[email protected]
ABSTRACTThe inclusion of the barometer sensor in smartphones signaled anopportunity for aiding indoor localization efforts. In this paper,we therefore investigate a possible use of the barometer sensor fordetecting vertically oriented activities. We start by showing the ac-curacies of various commodity measurement devices and the chal-lenges they bring forth. We then show how to use the barome-ter values to build a predictor that can detect floor changes andthe mode (elevator, escalator, or stairs) used to change floors withnearly 100% accuracy. We validate these properties with data col-lected using 3 different measurement devices from 7 different build-ings. Our investigation reveals that while the barometer sensor haspotential, there is still a lot left to be desired.
1. INTRODUCTIONThere are a number of papers in ACM MobiSys and HotMobile
that have profited from the plethora of sensors on smartphones, in-cluding the gyroscope, accelerometer, compass and microphone.Many have employed these sensors for location and contextual aware-ness. Imagine our excitement when we noticed a new sensor ap-pearing on smartphones – the barometer – that has not been tappedby our community. This sensor has appeared on “top shelf” de-vices, including the Samsung Galaxy S4, Google Nexus 4 and 10.
Naturally, our first instinct was to use this sensor to solve one ofthe key challenges in mobile computing – indoor location. Sincethe barometer sensor measures ambient atmospheric pressure, andsince that pressure varies primarily with height, our objective is todetermine which floor of an indoor building the user is on.
In practice, this is a challenging problem. Atmospheric pressureoutdoors varies throughout the course of a day, subject to naturalweather phenomena. Some large indoor buildings are pressurized,either for heating and cooling efficiency or for sanitary reasons.While in some indoor location scenarios, an error of a few metersmay be tolerable, in this situation an error of even 2 meters mightindicate the wrong floor. Given these real-world challenges, can westill determine which floor of a building a user is on?
For this paper, we conducted extensive measurements using sev-eral devices in 7 buildings across Singapore across different times
Permission to make digital or hard copies of all or part of this work forpersonal or classroom use is granted without fee provided that copies arenot made or distributed for profit or commercial advantage and that copiesbear this notice and the full citation on the first page. To copy otherwise, torepublish, to post on servers or to redistribute to lists, requires prior specificpermission and/or a fee.ACM HotMobile’14, February 26–27, 2014, Santa Barbara, CA, USA.Copyright 2014 ACM 978-1-4503-2742-8 ...$15.00.
of the day and days of the week. As we anticipated, there is abso-lute pressure variation observed by a phone that remains stationaryon a floor. Worse, we observed inter- and intra- phone model vari-ations in absolute pressure readings that were large enough that twophones next to each other of the same model give pressure readingsthat are off by the equivalent of over one building floor. We sub-sequently focus on relative pressure differences, the intuition beingthat a change in pressure equivalent to a floor height indicates thatthe phone has changed floors. Unfortunately, we also encountersensor drift, where the readings from a barometer sensor vary notnecessarily because the actual pressure has changed. Despite thesechallenges, we have made the following findings:
1 Absolute pressure readings are unreliable indicators of floor-level information, and there are several subtle pitfalls thatpractitioners must consciously tackle.
2 The pressure difference between two floors of a building showssignificantly less variability across time and phone model.Using readings from a single device, we can determine thati) the user has changed floors, ii) and how many floors havechanged (or the change in absolute height) with almost per-fect accuracy.
3 The three common modes for changing floors (escalators,stairs and elevators) can be distinguished by looking at therate of pressure change. These rates are distinctly higher thanthe typical drift we observe on barometer sensors.
4 The barometer is significantly more robust than an accelerom-eter at detecting vertical activities. However, it consumessimilar amounts of energy, even though on paper, the barom-eter is a very cheap sensor.
Unfortunately, there are key challenges that prevent us from us-ing the barometer sensor on phones for determining which floor auser is on. Since the absolute value reported by different phonesvaries, we cannot simply use sensors embedded in the building toprovide reference values to compare against and then determinewhat height or floor a user is on. Many large buildings have multi-ple entrances that may be on different floors, hence it is not trivial toidentify which floor a user has entered on and then simply count upor down each time the pressure changes. Finally, while the barome-ter sensor could be used in conjunction with an infrastructure-based
This research is supported by the Singapore National ResearchFoundation under its IDM Futures Funding Initiative and admin-istered by the Interactive Digital Media Programme Office, Me-dia Development Authority and supported in part by the SingaporeMinistry of Education Academic Research Fund Tier 2 under theresearch grant MOE2011-T2-1-001. Any opinions, findings, con-clusions or recommendations expressed in this material are those ofthe authors and do not necessarily reflect the views of the grantingagency or Singapore Management University.
1

indoor location system, it provides limited value since it only pro-vides how many floors have changed when the user moves.
If not for indoor location, what can the barometer sensor be usedfor? The sensor was originally introduced to provide faster GPS lo-cation fixes by providing an initial altitude estimate for the GPS lo-cation calculations. However, we have run experiments with com-parable devices, ones that have the barometer and ones that do not,and we see no improvement in GPS lock speed or accuracy (aver-age speed of 39.0s for a cold start GPS lock for a Nexus 4 with abarometer compared to 20.3s for a Lumia 720 without). We there-fore encourage the mobile community to find solutions, that over-come the limitations we encountered in using barometer sensor forindoor location, as well as identify other compelling use cases forthis new sensor.
2. MOTIVATIONThe use of a barometer for identifying height (or floor) change
information is motivated by the fundamental property that atmo-spheric pressure drops with an increase in altitude. It is well-knownthat this relation between barometric pressure and altitude is af-fected not just by the temperature, but also by various environ-mental phenomena, such as weather patterns and humidity. Forexample, during hurricanes or temperate depressions, the pressurereadings will obviously drop. Our focus is not on studying or in-vestigating this fundamental relationship, but on ascertaining theproperties of pressure variations in indoor buildings, and on theinterplay between such variations and the measurement accuracyof the phone-embedded barometer sensor.
We expect the use of the barometer for indoor height/floor es-timation to be a non-obvious exercise, principally because indoorenvironments have several distinct artifacts that we do not observeoutdoors. In particular, we can envision the following artifacts:
• Buildings are often pressurized and climate controlled (morespecifically, in the context of Singapore, air-conditioned).As a consequence, we expect the humidity and temperatureindoors to be quite distinct from that outdoors. Also, thepressure-gradient indoors may not follow a simple relation-ship, as the building pressure on different floors may be reg-ulated by different air-conditioning units or controllers.
• The floor heights of buildings are typically in the range 2.5-6.0 meters, which may be well within the range of measure-ment error of the smartphone-embedded barometer sensor.So, while a 20 meter variation in height estimation may beinconsequential for GPS, it may translate into an error of 8or more floors inside a building!
• The floor heights of buildings are not only different, but arenon-uniform (even within the same building). In particu-lar, our empirical studies showed that the heights of lower-level floors (notably the entrance lobby) are often larger, andeven the heights of otherwise homogeneous floors (e.g, the4th and 5th floors of a campus building) show unexpectedconstruction-specific artefacts.
3. DEVICE-SPECIFIC CHARACTERISTICSWe used three different devices for recording our data; 1) a Sam-
sung Galaxy S III smartphone (S3), 2) a Google Galaxy Nexussmartphone (NX), and 3) an external USB weather board (UB) [3].For the Android platform devices (S3 and NX), we wrote a smallapplication that queried the Android API for the barometer values(at 15 Hz for NX and 25 Hz for S3). For the weather board (UB),we used a laptop running a terminal program that captured the UB’sbarometer output at 1 Hz for 120 seconds. In the case of the UB
1002
1003
1004
1005
1006
1007
1008
1009
1010
0 1 2 3 4 5 6 7 8 9 10 11 12
Pres
sure
(hPa
)
Time(Hour)
S3-1
S3-2
NX-1
NX-2
Figure 1: 12 Hour pressure trend on a single floor
0
0.2
0.4
0.6
0.8
1
1.2
1.4
0 200 400 600 800 1000H
eigh
t(m
) Time(s)
NX
Figure 2: Temporal Variation in height as computed from pres-suredevice, we collected at least 120 samples (or 2 minutes of data) forevery result. Unless otherwise mentioned, every result for the An-droid devices uses individual ‘data points’ that are an average of atleast 1,000 consecutive samples.
The NX and UB devices used Bosch barometer sensor [2] whilethe S3 used a STM sensor [1]. The Bosch sensors were rated for anRMS measurement error of 0.5 meters (corresponding to an RMSpressure error of 0.06 hPa), while the STM sensors were rated foran RMS measurement error of 0.65 meters (corresponding to anRMS pressure error of 0.08 hPa).
3.1 Device Impact on AccuracyFigure 1 shows the change in pressure as reported by four devices
(2 S3’s and 2 NX’s) for a 12-hour duration. All four devices wereleft stationary on a table, next to one other, in a closed room inour campus building. Figure 2 takes a closer look at this changein pressure on the NX device for a shorter duration of 15 minutes.There are several observations we make:
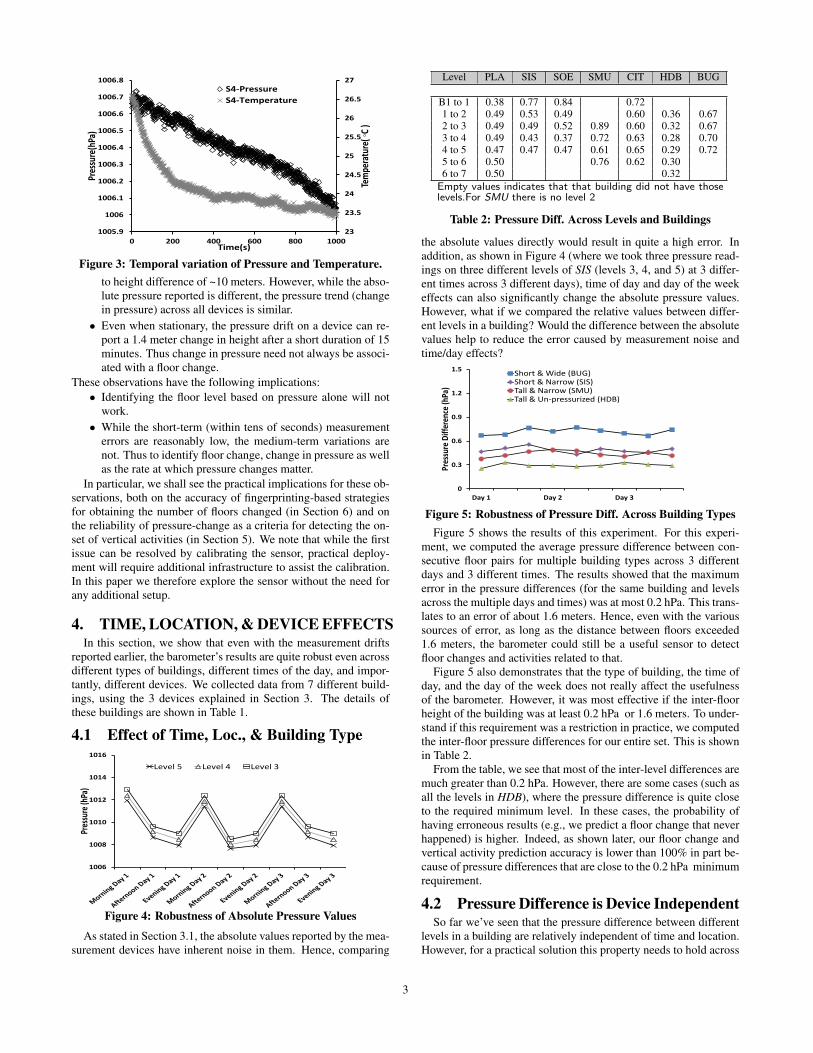
• Pressure does not remain constant for a given floor through-out the day in an HVAC environment. To understand why,we observe the variation in temperature and the correspond-ing variation in pressure [Figure 3]1. The figure suggests thatthis variation in pressure is perhaps a result of the variationin temperature.
• The absolute pressure reported (at any given time) acrossdifferent device models as well as that reported within thesame device model are different. This difference is signifi-cant and can correspond to the pressure difference across afloor pair. For example, the average pressure difference be-tween the two NX devices was 1.2 hPa which is equivalent
1For this observation we collected data using a Samsung GalaxyS4 device that has a built-in barometer and temperature sensor.
2
23
23.5
24
24.5
25
25.5
26
26.5
27
1005.9
1006
1006.1
1006.2
1006.3
1006.4
1006.5
1006.6
1006.7
1006.8
0 200 400 600 800 1000
Tem
pera
ture
( ◦C
)
Pres
sure
(hPa
)
Time(s)
S4-Pressure
S4-Temperature
Figure 3: Temporal variation of Pressure and Temperature.to height difference of ~10 meters. However, while the abso-lute pressure reported is different, the pressure trend (changein pressure) across all devices is similar.
• Even when stationary, the pressure drift on a device can re-port a 1.4 meter change in height after a short duration of 15minutes. Thus change in pressure need not always be associ-ated with a floor change.
These observations have the following implications:• Identifying the floor level based on pressure alone will not
work.• While the short-term (within tens of seconds) measurement
errors are reasonably low, the medium-term variations arenot. Thus to identify floor change, change in pressure as wellas the rate at which pressure changes matter.
In particular, we shall see the practical implications for these ob-servations, both on the accuracy of fingerprinting-based strategiesfor obtaining the number of floors changed (in Section 6) and onthe reliability of pressure-change as a criteria for detecting the on-set of vertical activities (in Section 5). We note that while the firstissue can be resolved by calibrating the sensor, practical deploy-ment will require additional infrastructure to assist the calibration.In this paper we therefore explore the sensor without the need forany additional setup.
4. TIME, LOCATION, & DEVICE EFFECTSIn this section, we show that even with the measurement drifts
reported earlier, the barometer’s results are quite robust even acrossdifferent types of buildings, different times of the day, and impor-tantly, different devices. We collected data from 7 different build-ings, using the 3 devices explained in Section 3. The details ofthese buildings are shown in Table 1.
4.1 Effect of Time, Loc., & Building Type
1006
1008
1010
1012
1014
1016
Pres
sure
(hPa
)
Level 5 Level 4 Level 3
Figure 4: Robustness of Absolute Pressure Values
As stated in Section 3.1, the absolute values reported by the mea-surement devices have inherent noise in them. Hence, comparing
Level PLA SIS SOE SMU CIT HDB BUG
B1 to 1 0.38 0.77 0.84 0.721 to 2 0.49 0.53 0.49 0.60 0.36 0.672 to 3 0.49 0.49 0.52 0.89 0.60 0.32 0.673 to 4 0.49 0.43 0.37 0.72 0.63 0.28 0.704 to 5 0.47 0.47 0.47 0.61 0.65 0.29 0.725 to 6 0.50 0.76 0.62 0.306 to 7 0.50 0.32
Empty values indicates that that building did not have thoselevels.For SMU there is no level 2
Table 2: Pressure Diff. Across Levels and Buildings
the absolute values directly would result in quite a high error. Inaddition, as shown in Figure 4 (where we took three pressure read-ings on three different levels of SIS (levels 3, 4, and 5) at 3 differ-ent times across 3 different days), time of day and day of the weekeffects can also significantly change the absolute pressure values.However, what if we compared the relative values between differ-ent levels in a building? Would the difference between the absolutevalues help to reduce the error caused by measurement noise andtime/day effects?
0
0.3
0.6
0.9
1.2
1.5
Day 1 Day 2 Day 3
Pres
sure
Diff
eren
ce (h
Pa)
Short & Wide (BUG) Short & Narrow (SIS) Tall & Narrow (SMU) Tall & Un-pressurized (HDB)
Figure 5: Robustness of Pressure Diff. Across Building TypesFigure 5 shows the results of this experiment. For this experi-
ment, we computed the average pressure difference between con-secutive floor pairs for multiple building types across 3 differentdays and 3 different times. The results showed that the maximumerror in the pressure differences (for the same building and levelsacross the multiple days and times) was at most 0.2 hPa. This trans-lates to an error of about 1.6 meters. Hence, even with the varioussources of error, as long as the distance between floors exceeded1.6 meters, the barometer could still be a useful sensor to detectfloor changes and activities related to that.
Figure 5 also demonstrates that the type of building, the time ofday, and the day of the week does not really affect the usefulnessof the barometer. However, it was most effective if the inter-floorheight of the building was at least 0.2 hPa or 1.6 meters. To under-stand if this requirement was a restriction in practice, we computedthe inter-floor pressure differences for our entire set. This is shownin Table 2.
From the table, we see that most of the inter-level differences aremuch greater than 0.2 hPa. However, there are some cases (such asall the levels in HDB), where the pressure difference is quite closeto the required minimum level. In these cases, the probability ofhaving erroneous results (e.g., we predict a floor change that neverhappened) is higher. Indeed, as shown later, our floor change andvertical activity prediction accuracy is lower than 100% in part be-cause of pressure differences that are close to the 0.2 hPa minimumrequirement.
4.2 Pressure Difference is Device IndependentSo far we’ve seen that the pressure difference between different
levels in a building are relatively independent of time and location.However, for a practical solution this property needs to hold across
3

Name Code Purpose Size (sq.m) Floors Location Type
University Building SIS Academic Building 9,064 6 Singapore Short, NarrowUniversity Admin Building SMU Office Building 52,637 13 Singapore Tall, Narrow
University Building SOE Academic Building 17,250 5 Singapore Short, NarrowResidential Housing HDB Apartment Building 21,375 18 Singapore Tall, Open Air
Plaza Singapura PLA Shopping Mall 67,500 9 Singapore Tall, WideBugis Junction BUG Shopping Mall 38,907 5 Singapore Short, Wide
City Square CIT Shopping Mall 32,516 6 Singapore NarrowAll the buildings, except for HDB, were air conditioned and not exposed to the outside air pressure.
Table 1: Buildings Used for Our Experiments
-3
-2.5
-2
-1.5
-1
-0.5
0
0.5
1007
1009
1011
1013
1015
1017
1019
1021
1023
1025
1 2 3 4 5
Pres
sure
Diff
eren
ce(h
Pa)
Pres
sure
(hPa
)
Time (Min)
NXS3NX Pressure DifferenceS3 Pressure Difference
Figure 6: Absolute Pressure versus Pressure Difference
the different measurement devices as well. Figure 6 plots the ab-solute pressure reported by the NX and S3 devices, as we movedseveral times (up and down) between a floor pair, as well as thepressure difference between the floors. Clearly, while the abso-lute pressure reported by the two devices differ by a magnitude ofaround 2hPa the pressure difference are relatively in-sync.
Overall, our measurements show that pressure differences arequite robust even across difference measurement devices, differenttypes of buildings, different times of the day, different days of theweek, and different locations. The main requirement is that thepressure difference between the two floors needs to be at least 0.2hPa (or 1.6 meters). In the next two sections, we show how to usethese pressure differences to build two extremely accurate (close to100% accuracy) and robust services — namely, a floor change pre-dictor that can also determine the exact number of floors changed,and a predictor that can determine whether an escalator, elevator,or stairs was used to change floors.
5. DETECTING MODE OF TRANSPORTWe hypothesise that the different mode of transports differ prin-
cipally in two parameters: a) rate of change of height (or equiva-lently, rate of change of pressure P), given by ∆P
∆T , and b) total timeduration T needed to move between floors.
However, the mappings between ∆P∆T and the modes of transport
is not straightforward. For example, for elevators, a) the rate ofpressure change (∆P) varies depending on the ’number of floors’changed (the period for which an elevator accelerates and decel-erates depends on the number of floors changed), and b) the aver-age rate of change of pressure, in most buildings, is higher whileascending than descending, suggesting that elevators travel fasterwhile ascending. There are also similarly confounding effects forescalators and stairs usage.
To navigate these effects in a tractable way, we experimentedwith four different classification strategies, each of which uses adifferent combination of 3 distinct features: i) ∆P (the pressurechange between the final and initial floors), ii) ∆P
∆T and iii) the tran-sition time T . We used the J48 classifier in Weka, with 10-foldcross validation, to compute the accuracy of our various classifiers.
Mode of Transport dp dp,T (dp/dt) (dp/dt),T
Escalator/Elevator/Stairs 69 99.67 98.3 100Escalator 79 99 100 100Elevator 28 100 95 100
Stairs 100 100 100 100For each mode of transport, we collected 100 samples with50 samples going up and 50 going down. The samples werecollected in 6 buildings by 2 different people using 3 devices.
Table 3: % accuracy for detecting vertical mode of transport
In Table 3, we present the effectiveness of the barometer at de-tecting the mode of transport used to change floor levels. Whenwe use both the pressure difference, the time difference, and thetotal time taken ((dp/dt)/T), we achieve 100% accuracy at detectingthe mode of transport. However, this is under the assumption thatthe time taken to change floors using the elevator, escalator, andstairs is different from each other. It also assumes that the floorsare at least 1.6 meters apart. This translates to about 5-7 secondsof movement on a typical escalator, stairs, and often less for anelevator.
6. DETECTING FLOOR CHANGESIn this section, we describe the effectiveness of the barometer in
determining that the measurement device has changed floors. Weshow this in two steps; 1) how effective is the barometer at justdetecting that a floor change has happened, and 2) how effective isthe barometer at detecting the exact number of floors changed?
6.1 Detecting That The User Has Changed FloorsTo determine the accuracy of the barometer at determining that
a device has changed floors, we collected 220 samples. This dataincluded 110 samples that involved the user changing floors and therest when the user did not. The floor transitioning data also had a50-50 split between going up and coming down. In both cases werecorded the change in pressure for the duration of the activity.
We then used Weka to perform a 10-fold cross validation and ob-tained a floor change accuracy, using just the difference in pressurevalues (dp), of 99.54%. I.e., we can use the barometer to very ac-curately determine if the measurement device has changed floors.However, this again assumes that the floor change is at least 1.6meters.
6.2 Identifying the Exact FloorUp to this point, the barometer can be used to very accurately
determine that a floor change has occurred. However, can we alsodetermine the number of floors that have been changed? For exam-ple, can we determine that the measurement device has gone up 2floors, or gone down 3 floors? This information could be incrediblyuseful in any kind of indoor localization tool.
6.2.1 Without Any Additional InformationWe investigate the accuracy levels achievable without any addi-
tional information (beyond the pressure and time differences ob-
4

0
20
40
60
80
100
1 2 3 4 5
Clas
sific
atio
n Ac
cura
cy %
Floor Pairs
dp
dp,T
dp/dt,T
dp/dt,T (+1/-1)
Figure 7: Accuracy At Determining No. of Floors Changedtained when changing floors). To do this, we collected data fromevery possible floor transitions of 1-5 levels (up and down) from allour buildings, using all the three measurement devices. For eachpossible floor transition, we collected 11 samples going up and 11samples going down for a total of 22 * 5 = 110 samples. We enteredall our measurements into Weka and built a suitable predictor thatcould be used to accurately determine the exact number of floorschanged.
Figure 7 shows the accuracy of determining the exact numberof floors changed using just pressure and time differences. We ob-serve that the accuracy of determining just a single floor change isvery high (close to 100% using the (dp/dt)/T predictor). However,the accuracy drops significantly for two and three floor changes.This is because the time taken to change these number of levels canoverlap (for example, an elevator can go up three floors just as fastas another elevator can go up two floors).
However, if we are willing to accept up to a one floor error, wecan achieve a 100% accuracy using the (dp/dt)/T (+1/-1) predictor.This predictor uses the direction of motion to accurately predicteither the exact number of floors changed or the number of floorschanged + 1. For example, if you went up 3 floors, it will returneither 3 or 4 floors up (and no other value). If you are went down 2floors, it will return either 2 or 3 floors down (and no other values).
6.2.2 With Basic Fingerprinting Information
90
91
92
93
94
95
96
97
98
99
100
1 2 3 4 5
Clas
sific
atio
n A
ccur
acy
%
Floor Pairs
Per Sample Average 5 Sample Average 15 Sample Average 25 Sample Average 30 Sample
Figure 8: No.of Floors Changed Accuracy with Fingerprinting
Finally, we investigate the accuracy of determining the numberof floors changed if we are able to complement our data with a lit-tle bit of fingerprint information. In particular, what if we knew theheight of the various floors or in other terms the relative pressuredifference between the various floors of the building the device iscurrently in. If this information was available, we would not need tomeasure the pressure values while changing floors and then usingthat to compute the difference in pressure and difference in timeneeded by our previous predictor. Instead, after the floor changewas done, we could just measure the absolute pressure seen at thenew floor and immediately compute the number of floors changed(using the difference between the current floor and the level 1 pres-sure as an index into a pre-computed “relative pressure map” table).
Figure 8 shows the accuracy possible under these assumptions.Each floor pair in the figure was the average of at least 1,000 sam-
Device S3 NexusFrequency (Hz) Acc/Bar 100/25 15/5 125/15 15/5
Measured Power Consumption (mW) After 10 mins of UseBase 28.3 65.06
Accelerometer 719.05 594.97 748.67 662.29Barometer 582.37 574.72 662.62 621.66
% Improvement 23.74 3.48 12.99 6.54
Table 4: Power Consumed by the Accelerometer & Barometer
ples. We observe that we can obtain 96.5% under these conditionwith just one measurement taken on the new floor by the device. Asmentioned earlier in Section 3.1, the measurement device noise canbe quite high and this affects our accuracy. To achieve better accu-racy, we should use more samples to smooth out the noise. If weare willing to take 30 samples, for example, the accuracy becomesalmost 100% (99.94%).
7. BETTER THAN AN ACCELEROMETER?Prior work has used the accelerometer to perform some of the
functions described earlier [13]. We therefore compare the barom-eter with the accelerometer for these functions, as well as the powerconsumed, to evaluate the true utility of the barometer. As before,we use the S3 and set the 3-axis linear accelerometer to a samplingfrequency of 15 Hz. We performed the experiments under two dif-ferent conditions. One, when the phone was kept flat in the righthand for the entire duration of the recording, and the second whenthe phone was perturbed for the entire duration of the recording.There were two types of perturbations. In the first type, the phonewas being used to play a game. In the second type, the user wasattending to a phone call. The perturbed data was collected in SISfrom six stairs, six escalators and six elevators for the floor com-binations of 1, 2 and 4 floor changes (both up and down). Theun-perturbed data contained 100 different sets of measurements forusing the stairs (across all the buildings in our dataset). Similarly,we had 100 different measurements for the escalators and elevatorsin our un-perturbed data. When taking the stairs, escalators or el-evators, the sensor values were recorded just before stepping ontothe transport and stopped just after stepping off the transport. Theun-perturbed data was labeled and used to create a training set forthe perturbed data using the J48 classifier in Weka.
Figure 9 shows the results of this study. Figure 9a) shows theresults for detecting the mode of vertical transport (elevators, es-calators, stairs) while the measurement device was left stationary(Normal), used to play a game, and used to make a call. Figure 9b)shows the results for detecting that the measurement device haschanged a floor under the same 3 conditions.We observe that whenthe measurement device was left in a normal position, the accuracyof both solutions was almost identical and quite high. However,when the measurement device was perturbed, the accuracy of theaccelerometer-based solution dropped significantly while the accu-racy of the barometer-based solution remained almost constant (andclose to 100% accurate).
Finally, the power consumption of each sensor measured overa 10 minute time period using the Monsoon power measurementdevice showed the barometer (on both devices) consumes between3 to 23% less power than the accelerometer (Table 4). This suggeststhat the barometer, in practice, is more energy efficient than theaccelerometer — but only just.
8. RELATED WORKBarometers have recently started appearing on smartphones and
tablets. Given the novelty of these sensors, we have found littleprior work that has used them for indoor location.
5

0
20
40
60
80
100
Un-perturbed Playing a game On a call
Clas
sific
atio
n A
ccur
acy
%
Accelerometer Barometer
0
20
40
60
80
100
Un-perturbed Playing a game On a call
Clas
sific
atio
n A
ccur
acy
%
Accelerometer Barometer
a) Detecting Mode of Vertical Transport b) Detecting a Floor Change
Figure 9: Robustness Of The Accelerometer Versus The Barometer
Brush [4] unsuccessfully attempted to use a barometer to helpusers find where they parked their car. Lester [8] focused on activityrecognition, including going up or down stairs and elevators. Whiletheir data collection included barometric pressure, it was not usedto infer where a user is.
Varshavsky [12] used a GSM fingerprinting based system to inferthe current floor of a user, but with lower accuracy than our systemand with higher fingerprinting overhead. Ojeda [10] deployed adead reckoning system to capture floor level transitions. However,that system is limited to stairs and cannot capture floor changes viaan elevator or escalator.
Johannsson [6] used vertical accelerometer information over timeto determine the number of floors traveled. While the paper reportshigh accuracy in classifying floor level transition it is unclear ifthe results hold for multiple buildings. Similarly Ye [13] used aphone’s accelerometer to record the time taken for traveling acrossdifferent floors via an elevator and the step count in the case ofstairs. The system was shown to achieve a high accuracy, but aswe observe, the accelerometer sensor is susceptible to any sort ofperturbation which can result in lower accuracies.
A large body of literature proposes indoor location techniqueswhich can be used to identify the physical location of users withvarying levels of accuracy. This could in theory be translated to de-tection of floor changes. Some techniques rely on custom hardwareor radios [5, 7, 9, 11]. Custom radios can also offer TOA (time ofarrival), TDOA (time difference of arrival) or AOA (angle of ar-rival) information for location. These approaches have hardwareadoption challenges.
9. CONCLUSIONSWe have provided what we believe to be the first exhaustive study
on the properties of mobile-embedded barometers across a numberof buildings with heterogeneous characteristics. Our results showthat while absolute pressure readings have significant time-of-dayvariations, the difference in pressure across different floor pairs isremarkably consistent and steady for any given building. As a con-sequence, we are able to use pressure difference as a useful fin-gerprint to detect the exact number of floors changed with almost100% accuracy. Additionally, pressure-based features (such as thechange in pressure) enable us to classify vertical activities (suchas taking escalators, stairs or elevators) with high accuracy. Thebarometer is highly robust to changes in the phone’s on-body place-ment and orientation, making it a significantly more robust sensorthan the accelerometer for real-life vertical activity detection.
Unfortunately, we also conclude that it is difficult to use thebarometer to determine the actual floor that a user is on. Knowinghow many floors a user has changed and what modality was usedis not a particularly useful piece of context. While the promise of
the barometer was that it would aid GPS location, in practice wefind that it does not help there either. In summary, we advise ourcolleagues in the mobile computing community to be aware of thelimitations of this sensor when being considered as part of theirsystem.
10. REFERENCES[1] LPS331AP MEMS Pressure sensor. http://www.st.com/
st-web-ui/static/active/en/resource/technical/document/datasheet/DM00036196.pdf.
[2] MEMS Pressure Sensors Data sheets. http://www.bosch-sensortec.com/en/homepage/products_3/environmental_sensors_1/bmp180_1/bmp180.
[3] USB Weather Board.https://www.sparkfun.com/products/8311?
[4] Brush, A. B., Karlson, A. K., Scott, J., Sarin, R., Jacobs, A.,Bond, B., Murillo, O., Hunt, G., Sinclair, M., Hammil, K.,and Levi, S. User experiences with activity-based navigationon mobile devices. MobileHCI, 2010.
[5] Chang, H., Tian, J., Lai, T., Chu, H., and Huang, P. Spinningbeacons for precise indoor localization. SenSys, 2008.
[6] Johannsson, H., Kaess, M., Fallon, M., and Leonard, J.Temporally scalable visual SLAM using a reduced posegraph. RSS Workshop on Long-term Operation ofAutonomous Robotic Systems in Changing Environments,2012.
[7] Kusy, B., Maroti, M., Balogh, G., Volgyesi, P., Sallai, J.,Nadas, A., Ledeczi, A., and Meertens, L. Node densityindependent localization. IPSN/SPOTS, 2006.
[8] Lester, J., Choudhury, T., and Borriello, G. A practicalapproach to recognizing physical activities. Pervasive, 2006.
[9] Muthukrishnan, K., Dulman, S., and Langendoen, K.Towards a rapidly deployable positioning system foremergency responders. International Conference onUbiquitous,Positioning, Indoor Navigation andLocation-Based Service, 2010.
[10] Ojeda, L. and Borenstein, J. Personal dead-reckoning systemfor GPS-denied environments. Safety, Security and RescueRobotics, 2007. SSRR 2007. IEEE International Workshopon, pages 1 –6, sept. 2007.
[11] Priyantha, N. B., Chakraborty, A., and Balakrishnan, H. TheCricket Location-Support system. MobiCom, 2000.
[12] Varshavsky, A., LaMarca, A., Hightower, J., and de Lara, E.The SkyLoc floor localization system. Percom, 2007.
[13] Ye, H., Gu, T., Zhu, X., Xu, J., Tao, X., Lu, J., and Jin, N.FTrack: Infrastructure-free floor localization via mobilephone sensing. Percom, 2012.
6