aspects of the crustal structure of the western mojave...
TRANSCRIPT

JOURNAL OF GEOPHYSICAL RESEARCH, VOL. 97, NO. 86, PAGES 8805-8816, JUNE 10, 1992
Aspects of the Crustal Structure of the Western Mojave Desert, California, From Seismic Reflection and Gravity Data
YONG-GANG LI AND THOMAS L. HENYEY
Department of Geological Sciences, University of Southern California, Los Angeles
LEoN T. Sn.VER
Division of Geological and Planetary Science, California Institute of Technology, Pasadena
Seismic and gravity data taken along line 1 of the 1982 Consortium for Continental Reflection Profiling (COCORP) Mojave Desert Survey (N-S profile, -30 km long) have been used to characterize the upper crust north of the San Andreas fault in the western Mojave block of southern California. Consortium for Continental Reflection Profiling seismic reflection data were reprocessed to emphasize the upper 5 seconds (two-way travel time). The resultant common depth point (CDP) sections provided starting models for generating a refmed geologic cross-section using a combination of ray tracing (forward modeling) and gravity interpretation. The forward modeling was used to validate the existence of faults and constrain their dips. The gravity data were used to refme the overall model, particularly in poor data areas on the CDP sections. Gravity data, taken along three nearby profiles parallel to primary line of section. were also used to determine the structural trend. Results from the first two seconds indicate the presence of a series of ENE striking reverse faults beneath the late Tertiary and Quaternary sedimentary cover of the western Mojave. The faults dip northward and offset the sediment-basement interface. The largest such feature has an apparent throw of -1.8 km and exhibits a subtle scarp at the Earth's surface suggesting Holocene displacement. The orientation of these faults, although not an instantaneous representation of the present-day stress field, is consistent with NNW compression across the western Mojave block and WNW striking San Andreas fault, as determined from nearby focal mechanisms and in situ stress measurements. The faults also appear to be closing small sedimentary basins in the Mojave block, which may have formed during an earlier extensional phase, similar to what is happening on a much larger scale in the Los Angeles basin to the south of the San Andreas fault Reflections between 2 and 5 s, coupled with the local geology and gravity modeling, are consistent with the presence of the Pelona/Rand schist in the subsurface beneath the western Mojave. The upper surface of the schist (i.e., Vincent/Rand thrust equivalent) rises southward toward the San Andreas fault where it is displaced vertically (up to the south) at least 5 km along the E-W trending Hitchbrook fault, such that the schist crops out between the Hitchbrook and subparallel San Andreas to the south. The same structure may exist beneath the Tehachapi mountains, with the roles of the Hitchbrook and San Andreas faults played by the north and south branches of the Garlock fault, respectively. The rising or arching of the basement toward the San Andreas fault (and toward the Garlock) is not only reflected in the geology and topography local to these faults in many places but is also generally observed on seismic reflection profiles in the vicinity of these faults in the western Mojave. Furthermore, the arching is also consistent with a strong component of fault normal compression.
INIRODUCTION
The westernmost Mojave desert or Antelope Valley (Figure 1) occurs between the E-W trending Garlock fault on the north and the NW-SE trending San Andreas fault on the south. The existence of the Tehachapi Mountains and Transverse Ranges uplifts to the north and south of the Antelope Valley, respectively, coupled with studies of the state of stress [Zoback et al., 1980; Zoback et al., 1987, Jones, 1988] and the pattern of faulting [e.g., Namson and Davis, 1988; Davis et al., 1989] suggest that this region is currently in a state of regional N-S crustal compression. In order to explore the response of the crust to this compression, we reprocessed line 1 of the 1982 Consortium for Continental Reflection Profiling
Copyright 1992 by the American Geophysical Union.
Paper number 91JB02119. 0148-0227/92/91JB-02119$0S.OO
(COCORP) Mojave seismic reflection survey [Cheadle et al., 1986], which extends from the San Andreas fault northward -30 km into the central part of Antelope Valley (Figure 1). The reprocessed line together with subsequent gravity measurements reveal elements of late Neogene compressional tectonics of the region. as well as aspects of the distribution and geometry of the Pelona/Rand schist north of the San Andreas fault in southern California.
REGIONAL GEOLOGY AND TECI'ONICS
The western Mojave block is a relatively featureless, highstanding (-750 m above sea level) alluvial plain with occasional buttes of Mesozoic plutonic and Tertiary volcanic/sedimentary rocks interspersed between a series of prominent basins. Two such basins can be identified from the regional gravity contours on Figure 1; they contain up to 3 km of largely terrigenous Tertiary sedimentary rocks with a basal volcanic unit that is probably either discontinuous or highly variable in thickness and composition over the area [Mabey,
8805

8806 Ll BT AL.: CRUSTAL STRUCI'URI! OF THB WESTERN MOJAVE DF.'IERT
~ PELONA/RAND ~SCHIST
~ UNDIFFERENTIATED PLUTONIC ~ a METAMORPHIC ROCKS
~ TERTIARY SEDIMENTARY ~ a VOLCANIC ROCKS D QUATERNARY ALLUVIUM
a TERRACE DEPOSITS
Fig. 1. Generalized geological map of the westernmost Mojave Desert showing the position of the 1982 COCORP Mojave seismic reflection line 1, beginning at VP61 (CDP1) and going southward across the San Andreas fault and into the San Gabriel mountains to VP380 (CDP600). The north portion of the line from VP61 to VP270 was reprocessed by CALCRUST. The inset shows the relationship of the study area to southern California. Bouguer gravity contours are shown by thin solid lines with a 10-mGal contour interval. Ancillary gravity data were collected along the three short lines parallel to the seismic line (see text). The dashed line across the seismic profile indicates the structural trend of fault F2 (see Figure 6).
1960; Lawson, 1987]. It has been suggested that these basins, as with the Los Angeles and southern San Joaquin basins, originated by extension during a premodern San Andreas (i.e., pre-5 Ma) phase of transform motion along the western margin of North America [e.g., Crowell, 1974, 1987].
The Antelope Valley is abutted by the Tehachapi Mountains and Transverse Ranges crystalline massifs on the north and south, respectively. Both of these ranges have been uplifted by a combination of folding and thrusting during the last few million years by compressional plate interactions along the "big bend" in the San Andreas fault [e.g., Anderson, 1971; Crowell 1979; Ehlig, 1982]. These uplifts and the concomitant erosion have resulted in the exhumation of a variety of metamorphic rocks from midcrustal depths, including high-grade gneisses of continental affmity [e.g., Saleeby et. al., 1987] , and a suite of late Mesozoic to early Cenozoic green to amphibolitic schists [e.g., Ehlig, 1968; Silver, 1982, 1983; Silver et al., 1984] believed to represent oceanic protolith [Haxel and Dillon, 1977]. The schists, variously known as the Pelona, Rand, and Orocopia schists, crop out sparingly over large parts of southern California and southwestern Arizona (Figure 2). They occur either as the lower plate in a thrust relationship with overlying crystalline rocks (e.g., Rand and Vincent thrusts) or as juxtaposed against these same rocks along major high-angle structures such as the
San Andreas, Garlock, and San Jacinto faults. The base of the schists is never exposed.
In the study area (Figure 1 ), the schists crop out between the north and south branches of the Garlock fault in the Tehachapi Mountains, along the San Andreas south of the Hitchbrook fault (along Portal Ridge) and at Quartz Hill, and in the Sierra Pelona south of the San Andreas. They are also found in the Mojave block approximately 60 km northeast of Rosamond Lake in the Rand Mountains (Figure 2) where they were studied by COCORP [Cheadle et al., 1986. The specific processes which have brought the schists to the surface are still not well understood. In some areas such as southeastern California, southwestern Arizona, and perhaps in the Rand Mountains of the central Mojave, extensional tectonics may have led to the unroofmg of these rocks. In the Tehachapi Mountains and the Transverse Ranges, however, compressional tectonics, involving thrusting and crustal buckling followed by erosion, may have played an important role. Furthermore, the proximity of the schists to the major transcurrent faults, particularly in the Transverse Ranges and Tehachapi Mountains, may be related to an even greater degree of deformation along these structures than is present on a more regional basis. In fact, there is substantial evidence of accentuated uplift and compression in the immediate vicinity of the San Andreas fault between the Salton Trough and its

Ll BT AL.: CRUSTAL STR.ucruRB OP THB Wl!sTBRN MOJA VB DBSBRT 8807
Q IOOiun~ .. _____ ....
DISTRIBUTION OF PELONA I RAND/ OROCOPIA SCHIST
• • •
35°
Fig. 2. Current distribution of the Rand-Pelona-Orocopia schist in California and Arizona (modified from Ehlig [1968] and Haxel and Dillon [1978]): 1, Sierra Pelona; 2, Portal Ridge and Quartz Hill; 3, Tehachapi Mountains; 4, Rand Mountains; 5, Eastern San Gabriel Mountains; 6, Orocopia Mountains; 7, Chocolate Mountains.
junction with the Garlock fault. Features include "pressure ridges," highly folded Tertiary strata, basement arched upward toward the fault, and fault-normal gradients in metamorphic grade.
An important component of the Tehachapi and Transverse Ranges uplifts is manifested by presently active frontal thrusts or reverse faults. These include the White Wolf fault and Pleito thrust in the southern San Joaquin Valley, the Sierra Madre system of exposed reverse faults along the southern flank of the Transverse Ranges, and the associated Elysian Park trend of buried thrusts and folds along the northern margin of the Los Angeles basin [cf. Davis et al., 1989]. In addition to being responsible for the major uplifts, these faults are also effecting closure of many of the Tertiary basins of southern California. Significantly, however, with the possible exception of the portion of the Transverse Ranges northeast of the San Andreas fault, reverse or thrust faulting is less well developed along the flanks of the Tehachapis and Transverse Ranges where they adjoin the Mojave block. The relative stability of the western Mojave block has been attributed to the "flow" of less "rigid" more easily deformable crust south of the San Andreas around the ''big bend" [Anderson, 1971; Sheffels and McNun, 1986].
DATAACQUISmON AND PROCESSING
Data used in this study consist of COCORP seismic reflection data obtained through the normal COCORP data distribution channels, and gravity data collected by California Consortium for Crust Studies (CALCRUST) along the seismic reflection line. The seismic reflection data were fust processed into standard common depth point (CDP) sections, which provided the basic framework or starting point for our f"mal model or geologic cross section. Forward modeling (ray tracing), constrained by the CDP section and selected shot gathers, was then used in conjunction with the gravity data to improve the locations and orientations of faults and petrologic discontinuities in the final cross section.
Seismic Reflection
COCORP Mojave line 1 is one of six seismic reflection lines run by COCORP in 1982 for profiling deep structures within the western Mojave Desert region. The line stretches southward 32 km from VP61 to VP380 (Figure 1) along llOth street in the Antelope Valley and then turns westward at the Hitchbrook fault and crosses the San Andreas fault into the San Gabriel Mountains. Only the straight portion of the line between VP61 and VP270 was used for this study.
The reflection data were recorded with a 96-channel pushto-south spread with 100.6-m group spacing. The source consisted of five vibrators employing eight sweeps per vibrator point (VP) with a 32-s upsweep from 8 to 32 Hz. Shot point spacing was also 100.6 m, giving a nominal 48 COP fold. The 52-s recording time resulted in a 20-s correlated record length with an 8-ms sampling rate. The data were reprocessed from raw shot gathers at University of Southern California (USC) using Merlin Geophysical Research Limited's standard seismic profiling software on a micro VAX n, with an emphasis on improving the original COCORP images in the upper crust (less than 5-s two-way travel time (TWTT) north of the San Andreas fault
Although the survey was nominally 48-fold, we used only the 24 near-offset traces in each CDP gather in order to reduce the effects of refractions from shallow interfaces, as well as potential three-dimensional complexities. The following processing sequence was used: (1) trace editing, scaling, balancing and application of spherical divergence for the best data quality, (2) time-dependent frequency filtering of shot gathers within the 12-40 Hz bandwidth, (3) deconvolution of shot gathers to suppress reverberation and multiples generated within the sedimentary sections, (4) f-k filtering (velocity filtering in frequency-wavenumber domain) of shot gathers with windows adjusted to eliminate surface waves and prominent head waves, (5) velocity analysis using constant velocity scans rather than velocity spectral analysis prior to normal moveout (NMO) correction, (6) elevation statics and
8808 ll B1' AL.: CRUSTAL STRUCTURB OF THB WBsTI!RN MOJAVE DllSI!RT
crooked line geometry corrections, (7) CDP sorting and muting of far-offset traces, (8) NMO, (9) bmd pass IDtering of CDP gathers to suppress low frequency noise due to NMO and high-frequency noise due to deconvolution, (10) 24-fold CDP stack, (11) poststack deconvolution to resolve fine layering within the sedimentary section, and (12) display with a weighted automated gain control (AGC).
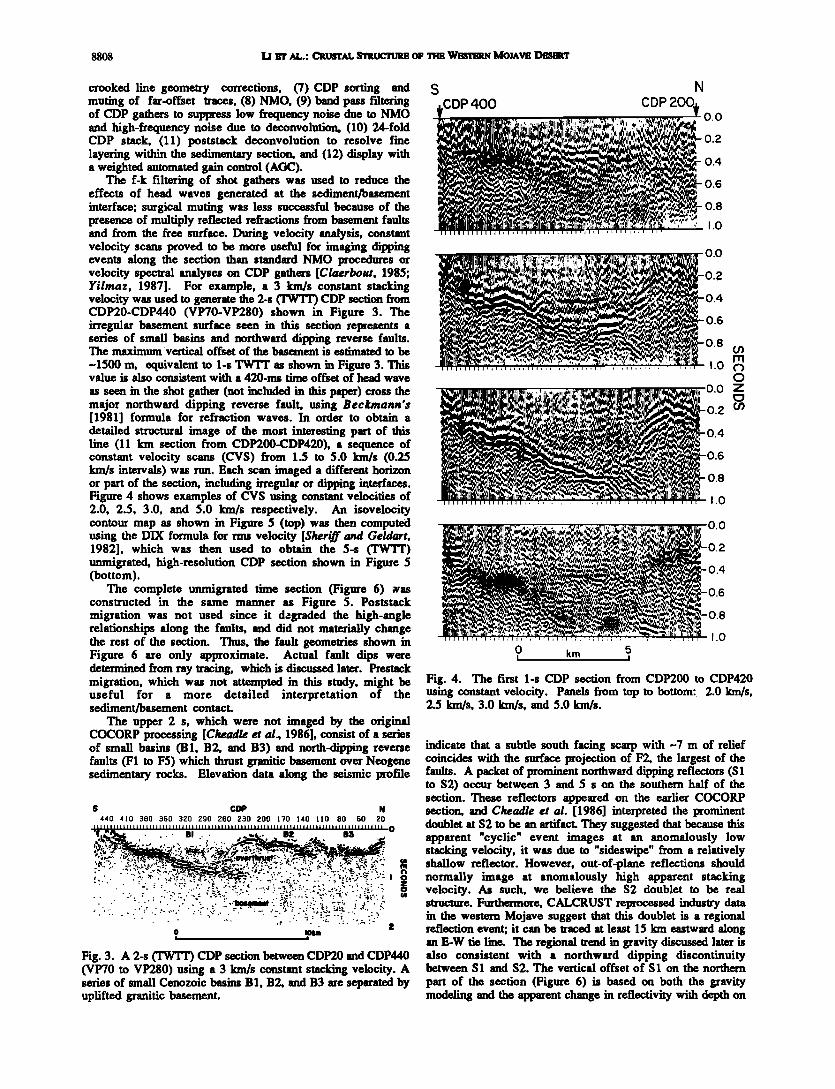
The f-k filtering of shot gathers was used to reduce the effects of head waves generated at the sediment/basement interface; surgical muting was less successful because of the presence of multiply reflected refractions from basement faults and from the free surface. During velocity analysis, constant velocity scans proved to be more useful for imaging dipping events along the section than standard NMO procedures or velocity spectral analyses on CDP gathers [Claerbout, 1985; Yilmaz, 1987]. For example, a 3 km/s constant stacking velocity was used to generate the 2-s (TW'IT) CDP section from CDP20-CDP440 (VP70-VP280) shown in Figure 3. The irregular basement surface seen in this section represents a series of small basins and northward dipping reverse faults. The maximum· vertical offset of the basement is estimated to be -1500 m. equivalent to 1-s TWIT as shown in Figure 3. This value is also consistent with a 420-ms time offset of head wave as seen in the shot gather (not included in this paper) cross the major northward dipping reverse fault, using Beclmann's [1981] formula for refraction waves. In order to obtain a detailed structural image of the most interesting part of this line (11 km section from CDP200-CDP420), a sequence of constant velocity scans (CVS) from 1.5 to 5.0 km/s (0.25 km/s intervals) was run. Each scan imaged a different horizon or part of the section, including irregular or dipping interfaces. Figure 4 shows examples of CVS using constant velocities of 2.0, 2.5, 3.0, and 5.0 km/s respectively. An isovelocity contour map as shown in Figure 5 (top) was then computeO using the DIX formula for rms velocity [Siu!ri.ff and Geldart, 1982], which was then used to obtain the 5-s (TWIT) unmigrated, high-resolution CDP section shown in Figure 5 (bottom).
The complete unmigrated time section (Figme 6) ;was constructed in the same manner as Figure 5. Poststack migration was not used since it d~graded the high-angle relationships along the faults, and did not materially change the rest of the section. Thus, the fault geometries shown in Figure 6 are only approximate. Actual fault dips were determined from ray tracing, which is discussed later. Prestack migration, which was not attempted in this study, might be useful for a more detailed interpretation of the sediment/basement contacL
The upper 2 s, which were not imaged by the original COCORP processing [Ciu!adle et al., 1986], consist of a series of small basins (B 1, B2, and B3) and north-dipping reverse faults (F1 to F5) which thrust granitic basement over Neogene sedimentary rocks. Elevation data along the seismic proiDe
s COP 440 41 o 3BO 350 320 290 2so 230 200 no t40 11 o eo so 20
0~--------------~~ Fig. 3. A 2-s (TWIT) CDP section between CDP20 and CDP440 (VP70 to VP280) using a 3 km/s constant stacking velocity. A series of small Cenozoic basins B1, B2. and B3 are separated by uplifted granitic basemenL
s N
0 km 5
0.0
0.2
0.4
0.6
0.8
1.0
(/) ITI () 0 z c (/)
Fig. 4. The first 1-s CDP section from CDP200 to CDP420 using constant velocity. Panels from top to bottom:. 2.0 km/s, 2.5 km/s, 3.0 km/s, and 5.0 km/s.
indicate that a subtle south facing scarp with -7 m of relief coincides with the surface projection of F2. the largest of the faults. A packet of prominent northward dipping reflectors (S1 to S2) occur between 3 and 5 s on the southern half of the section. These reflectors appeared on the earlier COCORP section, and Clu!odle et al. [1986] intetpreted the prominent doublet at S2 to be an artifacL They suggested that because this apparent "cyclic" event images at an anomalously low stacking velocity, it was due to "sideswipe" from a relatively shallow reflector. However, out-of-plane reflections should normally image at anomalously high apparent stacking velocity. As such, we believe the S2 doublet to be real structure. Furthermore, CALCRUST reprocessed industry data in the western Mojave suggest that this doublet is a regional reflection event; it can be traced at least 15 km eastward along an E-W tie line. The regional trend in gravity discussed later is also consistent with a northward dipping discontinuity between S 1 and S2. The vertical offset of S 1 on the northern part of the section (Figure 6) is based on both the gravity modeling and the apparent change in reflectivity with depth on

LI Bl' AL.: CRUSTAL STRUCTUJtB OF nm WEsTBitN MOJAVE DBsBRT 8809
s km/s
1.5 2.0
3.0 I--I--I--I--
4.0 I--I--I--1--
5.0 r--
s COP
N
0
I
tsec
I
I
N
410 390 370 350 330 310 290 270 250 230 210
0 IOkm
(/) ITI 0 0 z 0 (/)
Fig. 5. A 2-s ('I'W'JT) hlgh-resolution COP section from COP200 to CDP420 (VP160 to VP270) generated from a detailed CVS analysis (see text). (Top) The isovelocity contour section for rms velocity converted from the CVS results shown in Figure 4. The contour interval is 0.25 km/s. (Bottom) The resulting COP section. The reverse fault, F2 (dashed line). dips northward and offsets the sediment/basement interface. The north dipping fault, Fl, is well imaged in the basement beneath basin Bl.
the seismic section. Thls offset is consistent with the downward projection of the primary reverse fault, F2. The displacement of S2 is less certain. particularly if F2 soles out with depth.
The reverse faults form the northern flanks of the small basins, resulting in characteristic asynunetrical ''half-basins" (e.g., F2 and B1). Thls geometry suggests that the basins (or possibly a single basin) predated the faulting and are (is) being currently closed by the overthrusting, similar to what is occurring in the Los Angeles basin 75 Ian to south [Davis et. al., 1989]. Within basin B1, there is a sequence of fine layers with crenulated interfaces. The degree of crenulation appears to increase downward, suggesting ongoing N-S compressi01,1al shortening. It is of interest to speculate as to whether faults F1 and F2, whlch occur on either side of basin B1, may have been an earlier set of basin-forming conjugate normal faults and have been reactivated as a thrusts during the present
episode of regional compression. If so, F2 would have reversed its dip, while the dip of F1 would have remained the same, in order to account for the present configuration of the sedimentary section.
Forward Modeling
The interpretation of COP time sections is difficult when complex structures such as reverse faults are present [May and Horn, 1978]. Not only are the reflection images complicated, but also, for example, hlgh-angle structures do not image well even when dip moveout or artificially hlgh stacking velocities are used. Various approaches such as depth migration [Larncr and Hanon, 1977], inverse ray methods [May and Covey, 1981], and phase and group correlation in perigrams [Gelchinsly et al., 1985] have been used by others to address these problems. To refme the geometry of the western Mojave

8810 LJ Er AI..: CRUSTAL STRUCTURB OF THB WBSTBRN MOJAVE DHSBRT
s COP N 460 440 420 400 380 360 340 320 300 280 260 240 220 200 180 160 140 120 100 80 60 40 ZfJ
Ul
~ 0 z 0 Ul
Fig. 6. A 5-s (TWIT) time section of the reprocessed portion of COCORP Mojave line 1 showing a sequence of basins (B1 to B3) and northward dipping reverse faults (F1 to F5). Reflectors S1 and S2 may be related to the top of the Pelona schist (contact with overlying granitic rocks). SAF, San Andreas fault; HF, Hitchbrook fault.
overthrusts observed on the CDP section (Figure 6), we have used ray tracing on models, initially constructed from the CDP images, but constrained by events or phases on selected shot gathers.
The evidence for the near-surface configuration of the major overthrust F2 appears on the three shot gathers in Figure 7, and the resultant model, based on ray tracing and the original CDP image, is shown in Figure 8. Two sets of parallel head waves, H1 and H2, appear on the three push-to-south shot gathers generated by the source at VP186, VP190 and VP192, located 600, 1000, and 1200 m, respectively, south of the overthrust (VP180). The time separation between H1 and H2 increases with distance of the source from the fault. The second head wave, H2, can be modeled as a reflected refraction from
the near-surface portion of the fault plane (bottom panel in Figure 8), which is nearly vertical, in contrast to the primary fault plane at greater depth. Velocities used in the forward modeling were consistent with both the velocity profile generated by the constant velocity scans discussed earlier and probable basement and sediment velocities for the Mojave block [Malin et al., 1981]. The top panel of Figure 8 illustrates the modeling of reflection events R1 and R2 from the basement/sediment contact (Figure 8). The middle panel of Figure 8 illustrates the modeling of R3, resulting from a combination of refraction at the basement/sediment interface and reflection from fault Fl. The modeled travel times of the five events, H1, H2, R1, R2, and R3, are shown in Figure 9 for comparison with the observations in Figure 7. The source of
" Ul 1"1 0 0 z 0
3 Ul
4
5
Fig. 7. Common shot gathers recorded at VP186, VP190, VP192 with the source 600, 1000, 1200 m south of the reverse fault, F2, respectively. H1 and H2 represent the primary head wave and a reflected refraction from fault F2, respectively. The time separation between H1 and H2 increases as the source moves away from F2. Event Dis the direct wave; G is the ground roll; R1 is the reflection from the top of the basement beneath basin B 1; R2 is the reflection from the overthrust portion of F2, and R3 is the reflection from the north dipping fault Fl.

Ll In' AL.: CRUSTAL STRUCTURB OF niB WBSTBRN MOIAVB DBSBRT 8811
e ~ J: 1-D. 11.1 c
0
2
3
4
0
I
2
3
4
2
3
V-5km/s
4 lo--------~5---------ci0-T-T-T-T-IT5-T-T-T-T-f20
DISTANCE (km)
Fig. 8. Ray paths for reflection and tefraction events shown in Figure 7.
the basement reflectivity of F1, as well as that of the other faults discussed below, is probably related to fracturing and chemical alteration along the fault planes.
Specific characteristics of the faults were further refined by forward modeling. For example, the dip of F2 was modeled in the region of the underthrust low-velocity wedge. Two models of this structure were considered (top panels of Figures 10 and 11 ). In the bottom panels, the synthetic data are compared with a shot gather recorded by 30 channels of the spread located above the structure and the source at VP165. Wavelet shape was deduced from the first arrival in a well-recorded trace. The two models differ by the presence of an intermediatevelocity volcanic(?) layer in Figure 11. Without the intermediate-velocity layer (Figure 10), the best-fit model requires a dip of -30° for the upper bo1D1dary (fault plane) of the wedge. However, this does not appear to be consistent with the COP images in Figures 3, 6, and 7, which, after depth conversion, seem to require dips on the order of 40°-50°. The
-(.) Cl) Ill
s N o~~-,--~~--.--.-..-.--.--.
VPI90
2 3 4 6 7 8 9 ~
DISTANCE ( km) Fig. 9. Travel times (solid curves) generated by forward modeling of the reflection and refraction events shown in the model in Figure 8. These results can be compared with the equivalent data (dashed curves) in the middle panel of Figure 7.
s N DISTANCE(km)
0 1.6 20 24 28 32 3.6 4.0 or-~~~~~--~~~~~----~-,
400
800
E 1200 :::c t 1600 w c
' ' 2000 ---~---~---------------------
basement 2400
·5.5km/sec: ' ' 2800 - - - - - - - ~ - - - - - - - r - - - " - - - - - - - ~ - - - - - - - - - - -
0.0
02
0.4
0.6 C/) c 08 z 0 (.)
10 w C/)
12
14
16
18
Fig. 10. Details of ray tracing used to constrain the geometry of the overthrust portion of the basement along fault F2. (Top) Model with a low-velocity zone underlying the high-velocity overthrust. (Lower Left) Synthetic shot gather consisting of 30 traces across the overthrust, assuming the source at VP165. (Lower Right). The recorded shot gather at VP 165. Events R1 and R3 are reflections from the top and bottom of the lowvelocity wedge, respectively.
presence of the intermediate-velocity layer allows for a greater dip on the fault plane and, as such, is the preferred model (Note that we have not attempted to model the amplitudes.) The existence of a volcanic layer is consistent with, but not required by, the regional surface geology. Volcanic rocks ranging from tuffs to flows and plugs occur in the western Mojave.
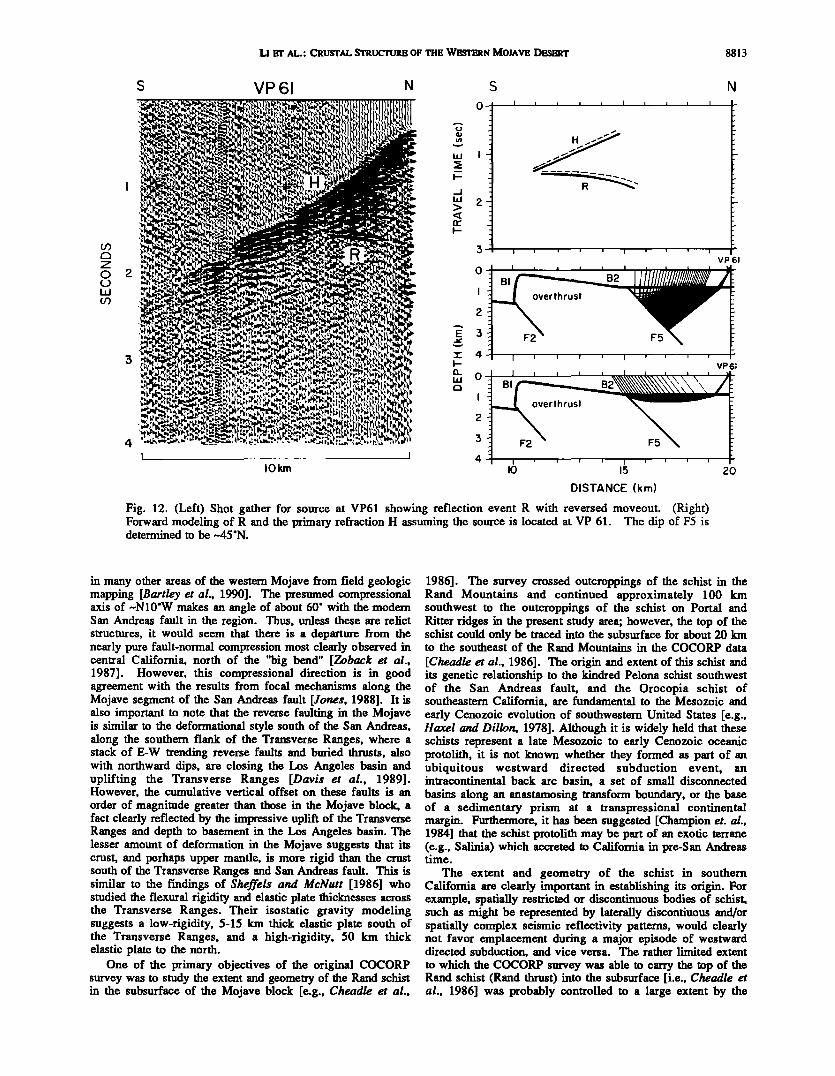
Reflection from fault F5, for example, shows up well on shot gather VP 61 (Figure 12), and thus its dip can also be modeled. The reversed hyperbolic event R, seen on shot gather above fault F5 (left panel), is consistent with northward dip of the order of 45° as illustrated in the right panel. Dips of reverse faults F3 and F4 can be modeled in the same manner.
Gravity Data
In an attempt to constrain the structural interpretation from seismic imaging along COCORP line 1, we acquired detailed gravity data at each of the original VPs along the main seismic line. Also, in order to determine the out-of-plane structural trend, we measured gravity along three short parallel lines:
8812 Ll In' AL.: CRUSTAL STRUCTURE OF THB Wl!STBRN MOJAVE DBSBRT
s N DISTANCE (km)
o o.4 08 1.2 16 20 24 2.8 3.2 3.6 40 o~~~~~~~~rn~~~~~--~--.
400
800
'E ,_ 1200 ::z:: ~ 1600 w 0
2000
2400
2800
C/) 0 z 0 u w C/)
I I
--!--~---~--1--~---1 I
: 1bose~ent 1 1 1
--J---~--L--~---L--~--J __ I I I I
1 :5.5km/sec: : - - 4 - - -1- - :- . ~ -- ~ - - -I
I
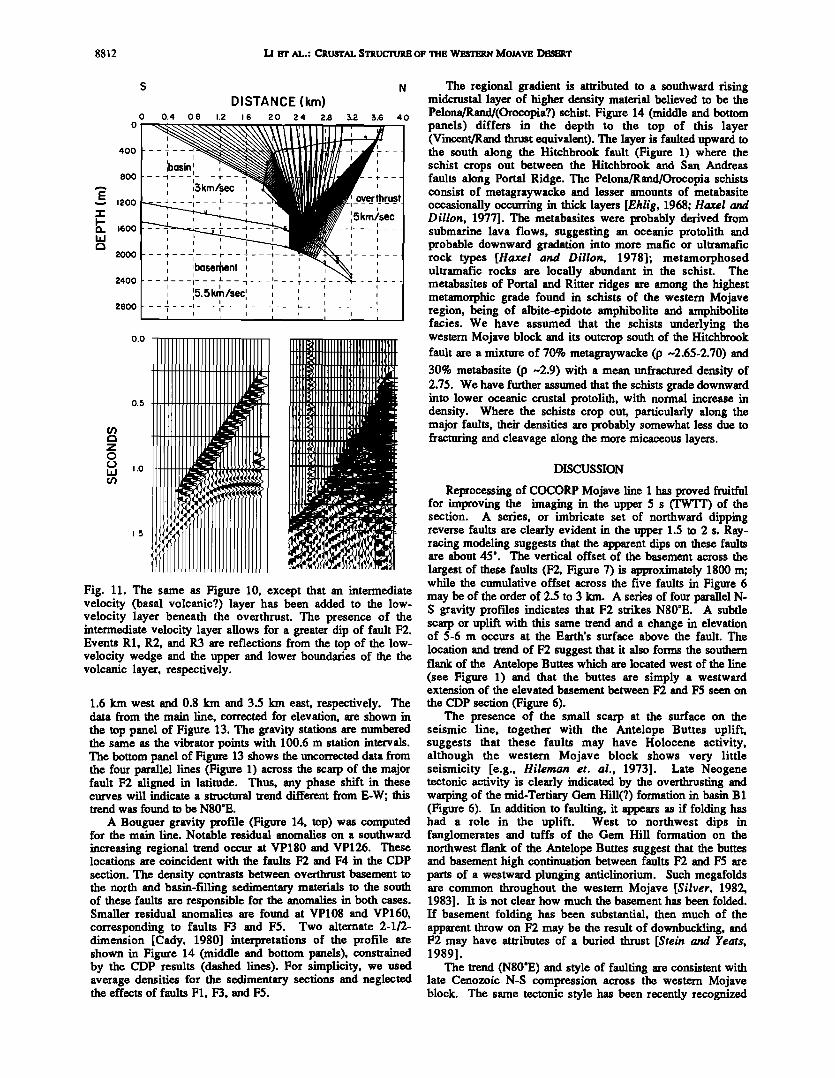
Fig. 11. The same as Figure 10, except that an intermediate velocity (basal volcanic?) layer has been added to the lowvelocity layer beneath the overthrust. The presence of the intermediate velocity layer allows for a greater dip of fault F2. Events R1, R2, and R3 are reflections from the top of the lowvelocity wedge and the upper and lower boundaries of the the volcanic layer, respectively.
1.6 km west and 0.8 km and 3.5 km east, respectively. The data from the main line, corrected for elevation, are shown in the top panel of Figure 13. The gravity stations are numbered the same as the vibrator points with 100.6 m station intervals. The bottom panel of Figure 13 shows the uncorrected data from the four parallel lines (Figure 1) across the scarp of the major fault F2 aligned in latitude. Thus, any phase shift in these curves will indicate a structural trend different from E-W; this trend was found to be N80"E.
A Bouguer gravity profile (Figure 14, top) was computed for the main line. Notable residual anomalies on a southward increasing regional trend occur at VP180 and VP126. These locations are coincident with the faults F2 and F4 in the CDP section. The density contrasts between overthrust basement to the north and basin-filling sedimentary materials to the south of these faults are responsible for the anomalies in both cases. Smaller residual anomalies are found at VP108 and VP160, corresponding to faults F3 and F5. Two alternate 2-1/2-dimension [Cady, 1980] interpretations of the profile are shown in Figure 14 (middle and bottom panels), constrained by the CDP results (dashed lines). For simplicity, we used average densities for the sedimentary sections and neglected the effects of faults F1, F3, and F5.
The regional gradient is attributed to a southward rising midcrustal layer of higher density material believed to be the Pelona/Randi(Orocopia?) schist. Figure 14 (middle and bottom panels) differs in the depth to the top of this layer (Vincent/Rand thrust equivalent). The layer is faulted upward to the south along the Hitchbrook fault (Figure 1) where the schist crops out between the Hitchbrook and San Andreas faults along Portal Ridge. The Pelona/Rand/Orocopia schists consist of metagraywacke and lesser amounts of metabasite occasionally occurring in thick layers [Ehlig, 1968; Haul and Dillon, 1977]. The metabasites were probably derived from submarine lava flows, suggesting an oceanic protolith and probable downward gradation into more mafic or ultramafic rock types [Haxel and Dillon, 1978]; metamorphosed ultramafic rocks are locally abundant in the schist. The metabasites of Portal and Ritter ridges are among the highest metamorphic grade found in schists of the western Mojave region, being of albite-epidote amphibolite and amphibolite facies. We have assumed that the schists underlying the western Mojave block and its outcrop south of the Hitchbrook fault are a mixture of 70% metagraywacke (p -2.65-2.70) and
30% metabasite (p -2.9) with a mean unfractured density of 2.75. We have further assumed that the schists grade downward into lower oceanic crustal protolith, with normal increase in density. Where the schists crop out, particularly along the major faults, their densities are probably somewhat less due to fracturing and cleavage along the more micaceous layers.
DISCUSSION
Reprocessing of COCORP Mojave line 1 has proved fruitful for improving the imaging in the upper 5 s (TWTT) of the section. A series, or imbricate set of northward dipping reverse faults are clearly evident in the upper 1.5 to 2 s. Rayracing modeling suggests that the apparent dips on these faults are about 45". The vertical offset of the basement across the largest of these faults (F2, Figure 7) is approximately 1800 m; while the cumulative offset across the five faults in Figure 6 may be of the order of 2.5 to 3 km. A series of four parallel NS gravity profiles indicates that F2 strikes N80"E. A subtle scarp or uplift with this same trend and a change in elevation of 5-6 m occurs at the Earth's surface above the fault. The location and trend of F2 suggest that it also forms the southern flank of the Antelope Buttes which are located west of the line (see Figure 1) and that the buttes are simply a westward extension of the elevated basement between F2 and F5 seen on the CDP section (Figure 6).
The presence of the small scarp at the surface on the seismic line, together with the Antelope Buttes uplift, suggests that these faults may have Holocene activity, although the western Mojave block shows very little seismicity [e.g., Hileman et. al., 1973]. Late Neogene tectonic activity is clearly indicated by the overthrusting and warping of the mid-Tertiary Gem Hill(?) formation in basin B1 (Figure 6). In addition to faulting, it appears as if folding has had a role in the uplift. West to northwest dips in fanglomerates and tuffs of the Gem Hill formation on the northwest flank of the Antelope Buttes suggest that the buttes and basement high continuation between faults F2 and F5 are parts of a westward plunging anticlinorium. Such megafolds are common throughout the western Mojave [Silver, 1982, 1983]. It is not clear how much the basement has been folded. If basement folding has been substantial, then much of the apparent throw on F2 may be the result of downbuckling, and F2 may have attributes of a buried thrust [Stein and Yeats, 1989].
The trend (N80"E) and style of faulting are consistent with late Cenozoic N-S compression across the western Mojave block. The same tectonic style has been recently recognized
Ll BT AL.: CRUSTAL STRUCTURB OF THB Wi!STBRN MOJAVB DBSBRT 8813
s VP61 N s N 0
u ... Q> H,.....,,."' Ill
-" ..-: UJ ,. ~ ..,-"' i= ~ ...J
R '
UJ 2 > <( a:: 1-
3 VP61
0
2
E 3 .:
3 J: 4 1-a.. 0 UJ 0
2
4 3
4 IOkm
DISTANCE (km)
Fig. 12. (Left) Shot gather for source at VP61 showing reflection event R with reversed moveout. (Right) Forward modeling of Rand the primary refraction H assuming the source is located at VP 61. The dip of F5 is determined to be -45 "N.
in many other areas of the western Mojave from field geologic mapping [Bartley et al., 1990]. The presumed compressional axis of -N10"W makes an angle of about 60" with the modem San Andreas fault in the region. Thus, unless these are relict structures, it would seem that there is a departure from the nearly pure fault-normal compression most clearly observed in central California, north of the "big bend" [Zoback et al., 1987]. However, this compressional direction is in good agreement with the results from focal mechanisms along the Mojave segment of the San Andreas fault [Jones, 1988]. It is also important to note that the reverse faulting in the Mojave is similar to the deformational style south of the San Andreas, along the southern flank of the Transverse Ranges, where a stack of E-W trending reverse faults and buried thrusts, also with northward dips, are closing the Los Angeles basin and uplifting the Transverse Ranges [Davis et al., 1989]. However, the cumulative vertical offset on these faults is an order of magnitude greater than those in the Mojave block. a fact clearly reflected by the impressive uplift of the Transverse Ranges and depth to basement in the Los Angeles basin. The lesser amount of deformation in the Mojave suggests that its crust, and perhaps upper mantle, is more rigid than the crust south of the Transverse Ranges and San Andreas fault. This is similar to the fmdings of Sheffels and McNutt [1986] who studied the flexural rigidity and elastic plate thicknesses across the Transverse Ranges. Their isostatic gravity modeling suggests a low-rigidity, 5-15 km thick elastic plate south of the Transverse Ranges, and a high-rigidity, 50 km thick elastic plate to the north.
One of the primary objectives of the original COCORP survey was to study the extent and geometry of the Rand schist in the subsurface of the Mojave block [e.g., Cheadle et al.,
1986]. The survey crossed outcroppings of the schist in the Rand Mountains and continued approximately 100 km southwest to the outcroppings of the schist on Portal and Ritter ridges in the present study area; however, the top of the schist could only be traced into the subsurface for about 20 km to the southeast of the Rand Mountains in the COCORP data [Cheadle et al., 1986]. The origin and extent of this schist and its genetic relationship to the kindred Pelona schist southwest of the San Andreas fault, and the Orocopia schist of southeastern California, are fundamental to the Mesozoic and early Cenozoic evolution of southwestern United States [e.g., Haxel and Dillon, 1978]. Although it is widely held that these schists represent a late Mesozoic to early Cenozoic oceanic protolith, it is not known whether they formed as part of an ubiquitous westward directed subduction event, an intracontinental back arc basin, a set of small disconnected basins along an anastamosing transform boundary, or the base of a sedimentary prism at a transpressional continental margin. Furthermore, it has been suggested [Champion et. al., 1984] that the schist protolith may be part of an exotic terrane (e.g., Salinia) which accreted to California in pre-San Andreas time.
The extent and geometry of the schist in southern California are clearly important in establishing its origin. For example, spatially restricted or discontinuous bodies of schist, such as might be represented by laterally discontiuous and/or spatially complex seismic reflectivity patterns, would clearly not favor emplacement during a major episode of westward directed subduction, and vice versa. The rather limited extent to which the COCORP survey was able to carry the top of the Rand schist (Rand thrust) into the subsurface [i.e., Cheadle et al., 1986] was probably controlled to a large extent by the

8814 Ll In' AL.: CRUSTAL S"n.UC'I'URB OP THB WI!ITBRN MOIA VB DI!SBRT
s N 0 5 1-• _;;;.:km"--"""'"l
-80~~~--~~·~--~~·~~-r~~
..... "6 "' ..s -90
i Cl Ill:: 1&.1 G-1oo ::J g
-110
s 150
..... "6 Cll E ....
i Cl
! 50
Ill::
. .......
280 260 240 220 200 180 160 140 ......... ..... 0 .......... .....
220 200
km
180 160
STATION NUMBER
5
LINE 1 o LINE 2 o LINE 3 + LINE 4 •
120
80
N
Fig. 13. Gravity data acquired along the seismic line and three short parallel lines. The station inturval is 100.6 m. (Top) Gravity along the seismic line corrected for elevation. (Bottom) Uncorrected data along a portion of the main line (circles) and three short parallel lines: 1.6 bn west (triangles), 0.8 bn east (squares), and 3.5 bn east (crosses) of the main line, respectively, across fault F2. The data have been aligned in latitude, and the shifts in the positions of the maxima indicate a sii'Uctural trend of N80°E.
quality of the data (unfavorable signal to noise ratio) and not the disappearance of the reflectivity. In fact, a second prominent reflector (F) mapped by Cheodle et al. [1986] about 4 s below, and subparallel to, the presumed Rand thrust appears to have greater regional extent and may be related to either the base of the schist or a transition to deeper oceanic protolith. Clearly, more detailed seismic work focused on investigating the schist's extent away from the Rand Mountains is needed to resolve the ambiguity. Also, if the schist is anisotropic, S wave birefringence might be used as an aid in mapping its cli.atribution in the subsurface.
As noted earlier, the schist also crops out in the Mojave block immediately north of the San Andreas fault in the study area. Here the schist is in contact with granitic rocks of the Mojave block along the Hitchbrook fault (Figurel ). Unlike the Rand thrust, which puts the granitic rocks over the schist, the Hitchbrook fault appeiii'S, both from its surface trace and om modeling (Figme 15), to be a high-angle structure. H so, cmying the top of the schist into the subsurface of the Mojave block from this outcropping, as was done in the Rand Mountains, is not possible. Also, it might be concluded that this body of schist represents an isolated OCC1D'rence along
s 0
..... } ....... -90 ~
~ Cl
ffi ~-100
1<m 5
MODEL OBSERVED o
N
Fig. 14. (Top) Bouguer gravity along COCORP line 1 from VP100 to VP270; the circles are from the observed data and the smooth curve is the gravity computed from either of the models shown in the middle and lower panels. (Middle) Gravity model with top of schist coincident with reflector S 1. (Bottom) Gravity model with top of schist coincident with fust of S2 reflectors. The dashed lines are the positions of reflectors from the seismic (CDP) depth section, and the solid lines are the corresponding gravity (ORA) models. The symbols, 2.75/6.0, correspond to density/velocity where is in grams per cubic centimeter and velocity is in kilometers per second.
bounding high angle faults. However, a set ofreflectors (SlS2 in Figures 6, and 15) dipping -20" to the north and terminating southward against the Hitchbrook fault at depths between 2 and 4 s TWIT (5-10 bn) has been interpreted in this study to be related to the schist. If this interpretation is correct, then (1) the schist does in fact occur beneath the

Ll BT AL.: CRUSTAL STRUCTURB OF nm WBSTBRN MOJAVE DBSI!RT 8815
s N 0 IOkm
STATION NUMBER
Fig. 15. Inferred geological cross section along COCORP line 1 from VP80 to VP300 based on a Ct •mbination of reprocessed CDP data, ray tracing, and potential field modeling. Hatchured pattern represents granitic rocks and .viggle pattern represents Rand/Pelona schist.
western Mojave, (2) the extent of the schist in the western Mojave can be explored using the S 1-S2 reflector packet, and (3) the schist between the San Andreas and Hitchbrook faults has been displaced vertically (up to the south) by about 5 km along the Hitchbrook fault. Work by CALCRUST in the Tehachapi Mountains [P. E. Malin et. al., manuscript in preparation, 1992] suggests that a similar relationship exists there, where a set of prominent, northward dipping, upper crustal reflectors appear to terminate southward against the north branch of the Garlock fault. At the surface, the north branch of the Garlock juxtaposes Rand schist to the south against granitic rocks to the north (see Figure 1) and also appears from field evidence, to be a high-angle structure. Thus, as in the case of the Hitchbrook, the schist is displaced vertically (also up to the south) along the north branch of the Garlock.
The large apparent vertical offset of the schist along the Hitchbrook and San Andreas faults has important implications regarding uplift of the schist and the sense of displacement on these structures. One mechanism for producing the large apparent vertical offsets might be through large strike-slip displacements. While this may be the case for the San Andreas, the Hitchbrook does not appear to be a regionally significant transcurrent structure. Thus we consider two other possibilities. First, the Hitchbrook might be an older Tertiary, down-to-the-north normal fault which formed in preSan Andreas time during the major Neogene basin forming episode along the transtentional California margin [e.g., Crowell, 1987]. And second, given the post-5 Ma compressional regime of this region [Zoback et al., 1987], the schist may have been locally forced upward between pairs of high-angle structures (e.g., the San Andreas and Hitchbrook faults or the north and south branches of the Garlock fault) in a semiductile manner, from a regionally ubiquitous upper crustal to midcrustallayer. In contrast, occurrences of the schist in places such as the Rand Mountains, Sierra Pelona, and southeastern California appear to represent broad crustal antiforms and thus a different tectonic style and history. The model involving ductile upward transport would seem to require these rocks to have suffered severe internal deformation during the last few million years (perhaps analogous to salt domes) which does not seem to have been the case. Furthermore, such processes operating in the upper crust seem unlikely.
CONCLUSION
In conclusion, reprocessed seismic reflection data from COCORP line 1 in the western Mojave, in conjunction with gravity data, have provided new insights into the Neogene tectonics of the western Mojave and the distribution of Pelona/Rand schist in this region. A series of ENE striking reverse faults has been imaged beneath the late Tertiary and Quaternary sedimentary cover of the western Mojave. These faults are consistent with NNW compression across the western Mojave block and the San Andreas fault, although the inferred direction of maximum compression is not strictly fault-normal as has been suggested for the San Andreas north of the "big bend" [Zoback et al., 1987]. The cumulative displacement on these faults is only 10-20% of that on the south frontal fault (Sierra Madre) system of the Transverse Ranges. This asymmetry in deformation across the San Andreas may be related to different crustal rheologies on either side of the fault, such as strength, flexural rigidity, and/or effective elastic thickness [e.g., Sheffels and McNutt, 1986].
The new results also reveal aspects of the distribution and geometry of the Pelona/Rand schist north of the San Andreas fault in southern California. Reflectors observed in seismic sections collected by both COCORP and industry, and occurring between the surface (in the Rand Mountains) and 6 s (0 to 20 km) may be related to a crustal packet which contains the Pelona schist. This packet is about 4 s (-12 km) thick throughout the Mojave. The most prominent elements of this reflector packet appear to be related to the top of the schist, i.e., the Vincent/Rand thrust, and perhaps to a transition from the schist into its subcrust. The top of the schist arches upward toward the San Andreas fault in the study area, where it is vertically offset -5 km along the E-W trending Hitchbrook fault. This arching of the basement toward the San Andreas fault is also consistent with a strong component of compression across the Transverse Ranges, as well as across the San Andreas and subparallel Hitchbrook faults. The presence of the schist at the surface between the high-angle San Andreas and Hitchbrook faults, coupled with the large apparent vertical offset across the Hitchbrook, suggests that these relationships have developed by either (1) large strikeslip displacements and/or normal faulting along the Hitchbrook fault or (2) ductile mobilization of the schist from mid-crustal depths due to compression in this region during the last few million years (since opening of the Gulf of California and inception of the modem San Andreas system). Geological and mechanical arguments would seem to favor the former.
Acknowledgments. The Mojave seismic reflection data reprocessed in this study were kindly provided by COCORP. We would like to acknowledge discussions regarding the processing and interpretation with David Okaya, Peter Malin, Eric Frost, and Gregory Davis. A. Levander, J. Namson, and an associate editor provided helpful comments during the review process. In particular we are indebted to J. Namson for his suggestion that the Hitchbrook is an older, down-to-the north normal fault. The gravity data were obtained with the aid of John Scott. Susan Turnbow and Desser Motion typed the final version of the manuscript. The study was supported by NSF grants EAR-8319254 and EAR-8609247 to CALCRUST.
REFERENCES
Anderson, D. L., The San Andreas fault, in Continents, Adrift, Scientific American, pp. 143-160, W.H. Freeman, New York, 1971.
Bartley, J. M., J. M. Fletcher, J.M., and A.F. Glazner, Tertiary extention and shortening of lower-plate rocks in the central Mojave metamorphic core complex, southern California, Tectonics, 9, 521-534, 1990.

8816 Ll BT AL.: CRUSTAL STRUCTURE OP THE WBSTBRN MOJAVE DBSBRT
Beckmann, H., Applied Geophysics, Geology of Petroleum, Halsted, New York, 1981.
Cady, J.W., Calculation of gravity and magnetic anomalies of finite-length right polygonal prisms, Geophysics, 45, 1507-1512, 1980.
Champion, D. E., D. G. Howell, and C. S. Gromme, Paleomagnetic and geologic data indicating 2500 km of northward displacement for the Salinian and related terranes, California, J. Geophys. Res., 89, 7736-7752, 1984.
Cheadle, M. J., B. L. Czuchra, T. Byrne, C. J. Ando, J. E. Oliver, L. D. Brown, S. Kaufman, P. E. Malin, and R. A. Phinny, The deep crustal structure of the Mojave Desert, California, from COCORP seismic reflection data, Tectonics, 5, 293-320, 1986.
Claerbout, J. F., Imaging the Earth's Interior, Blackwell Scientific, Boston. Mass., 1985.
Crowell, J. C., Origin of late Cenozoic sedimentary basins in California, Spec. Publ. Soc. Econ. Paleontol. Mineral., 22, 190-204, 1974.
Crowell, J. C., The San Andreas fault system through time, J. Geol. Soc. London, 136, 293-302, 1979.
Crowell, J. C., Late Cenozoic basins of onshore southern California: Complexity is the hallmark of their tectonic history, in Cenozoic Development of Coastal California, Rubey Volume VI, edited by R. V. Ingersoll and W. G. Ernst, pp. 207-241, Prentice-Hall, Englewood Cliffs, N. J., 1987.
Davis, T. L., J. S. Namson, and R. F. Yerkes, A cross section of the Los Angeles area: Seismically active fold and thrust belt, the 1987 Whittier Narrows earthquake, and earthquake hazard, J. Geophys. Res., 94, 9644-9664, 1989.
Ehlig, P. L., Causes of distribution of Pelona, Rand, and Orocopia Schists along the San Andreas and Garlock faults, Stanford Univ. Publ. Geol. Sci., 11, 294-306, 1968.
Ehlig, P. L., Origin and tectonic history of the basement terrane of the San Gabriel Mountains, central Transverse Ranges, in The Geotectonic Development of California, Rubey Volume 1, edited by W. G. Ernest, pp. 253-283, Prentice Hall, Englewood Cliffs, N.J., 1981.
Ehlig, P. L., The Vincent thrust: Its nature, paleogeographic reconstruction across the San Andreas fault and bearing on the evolution of the Transverse Ranges, Geology and Mineral Wealth of the California Transverse Ranges, Mason Hill Volume, edited by D. L. Fife and J. A. Minch, pp. 370-379, South Coast Geological Society, Santa Ana, Calif., 1982.
Gelchinsky, B., E. Landa, and V. Shtivelman. Algorithm of phase and group correlation, Geophysics, 50, 596-608, 1985.
Haxel, G. and J. Dillon, The Pelona and Orocopia Schists and the Proto-San Andreas fault of southern California (abstract), Geol. Soc. Am. Abstr. Programs, 9, 423-433, 1977.
Haxel, G.,and J. Dillon, The Pelona-Orocopia Schist and Vincent-Chocolate mountain thrust system, southern California, in Mesozoic Paleogeography of the Western U.S., Pacific Coast Paleogeolography Symposium, vol. 2, pp. 453-469, Pacific Section. Society of Economic Paleontologists and Mineralogists, Los Angeles, Calif., 1978.
Hileman. J. A., C .. Allen. and J. M. Nordquist, Seismicity of the southern California region, 1 January 1932 to 31 December 1972, report, Seismol. Lab., Calif. Inst. of Technol., Pasadena, 1973.
Jones, L. M., Focal mechanisms and the state of stress on the San Andreas fault in southern California, J. Geophys. Res. 93, 8869-8891, 1988.
Lamer, K., and L. Hatton, Depth migration of imaged time sections, paper presented at the 47th Annual International
SEG Meeting, Soc. of Explor. Geol., Calgary, Alberta, Sept 20, 1977.
Lawson III, H. R., Geophysical study of the western Mojave Desert, M.S. thesis, 163 pp., Univ. of South/ Calif., Los Angeles, 1987.
Mabey, D. R., Gravity survey of the western Mojave Desert, California, U. S. Geol. Surv. Prof Pap., 316-D, 51-72, 1960.
Malin, P. E., M. H. Gillespie, P. C. Leary, and T. L. Henyey, Crustal structure near Palmdale. California from borehole determined ray parameters, Bull. Seismol. Soc. Am., 71, 1783-1803, 1981.
May, B. T., and J. D. Covey, An inverse ray method for computing geologic structures from seismic reflectionsZero-offset case. Geophysics, 46, 268-287, 1981.
May, B. T., and F. Horn. Synthetic seismic sections of typical petroleum traps, Geophysics, 43, 1119-1147, 1978.
Namson. J. S., and T. L. Davis, Seismically active fold and thrust belt in the San Joaquin Valley, central California, Geol. Soc. Am. Bull.,100, 257-273, 1988.
Saleeby, J. B., D. B. Sams, and R. W. Kistler, U/Pb zircon. Strontium, and Oxygen isotopic and geochronological study of the southernmost Sierra Nevada batholith, California, J. Geophys. Res., 92, 10,443-10,466, 1987.
Sheffels, B., and M. McNutt, Role of subsurface loads and regional compression in the isostatic balance of the Transverse Ranges, California: Evidence for intracontinental subduction, J. Geophys. Res., 91, 6419-6431, 1986.
Sheriff, R. E. and L. P. Geldart, Exploration Seismology, Cambridge University Press, New York, 1982.
Silver, L. T., Evidence and a model for west-directed early to Mid-Cenozoic basement overthrusting in southern California, Geol. Soc. Am. Abstr. Programs, 14, 617, 1982.
Silver, L. T., Paleogene overthrusting in the tectonic evolution of the Transverse Ranges, Mojave and Salinian regions, California, Geol. Soc. Am. Abstr. Programs, 15, 438, 1983.
Silver, L. T., D. B. Sams, M. I. Bursik, R. W. Graymer, J. A. Nourse, M. A. Richards, and S. L. Salyards, Some observations on the tectonic history of the Rand Mountains, Mojave Desert, California, Geol. Soc. Am. Abstr. Programs,16, 323, 1984.
Stein. R. S. and R. S. Yeats, Hidden earthquakes, Sci. Am., 260, 48-57, 1989.
Telford, W.M., L.P. Geldart, R.E. Sheriff, and D.A. Keys, Applied Geophysics, Cambridge University Press, New York, 1982.
Yilmaz, 0., Seismic data processing, Investigations in Geophysics, No.2, edited by S. M. Doherty, 526 pp., Society of Exploration Geophysicists, Tulsa, OK, 1987.
Zoback, M. L., H. Tsukahara, and S. Hickman, Stress measurements at depth in the vicinity of the San Andreas fault: Implications for the magnitude of shear stress at depth, J. Geophys. Res., 85, 6157-6173, 1980.
Zoback, M. D., et al., New evidence on the state of stress of the San Andreas fault system, Science, 238, 1105-1111, 1987.
T.L. Heayey and Y.-G. U, Department of Geological Scieacea, Uaivenity of Southern California, l.ol Aaplea, CA 90089.
L.T. Silver, Divilioa of GeoiOJical and Planetary Science, California lnllitute ofTechaoloJy, Paudeaa, CA 91125.
(Received December 27, 1990; reviaed July 18, 1991;
accepted AuJUit 12, 1991.