application of insar and gravimetry for land subsidence ... · article application of insar and...
TRANSCRIPT
Article
Application of InSAR and Gravimetry for LandSubsidence Hazard Zoning in Aguascalientes, Mexico
Jesús Pacheco-Martínez 1,*, Enrique Cabral-Cano 2, Shimon Wdowinski 3,Martín Hernández-Marín 1, José Ángel Ortiz-Lozano 1 and Mario Eduardo Zermeño-de-León 1
Received: 23 August 2015; Accepted: 7 December 2015; Published: 17 December 2015Academic Editors: Zhenhong Li, Roberto Tomas, Norman Kerle and Prasad S. Thenkabail
1 Centro de Ciencias del Diseño y de la Construcción de la Universidad Autónoma de Aguascalientes,Av. Universidad # 940, Ciudad Universitaria, C. P. 20131 Aguascalientes, Mexico;[email protected] (M.H.-M.); [email protected] (J.A.O.-L.);[email protected] (M.E.Z.-L.)
2 Departamento de Geomagnetismo y Exploración, Instituto de Geofísica,Universidad Nacional Autónoma de Mexico, Circuito de la investigación Científica, Ciudad Universitaria,D.F. 04510 Delegación Coyoacán, Mexico; [email protected]
3 Rosenstiel School of Marine and Atmospheric Science, University of Miami, 4600 Rickenbacker Causeway,Miami, FL 33149, USA; [email protected]
* Correspondence: [email protected]; Tel.: +52-449-910-8456; Fax: +52-449-910-8451
Abstract: In this work we present an application of InSAR and gravimetric surveys for riskmanagement related to land subsidence and surface ground faulting generation. A subsidencevelocity map derived from the 2007–2011 ALOS SAR imagery and a sediment thicknesses mapobtained from the inversion of gravimetric data were integrated with a surface fault map to producea subsidence hazard zoning in the city of Aguascalientes, Mexico. The resulting zoning is presentedtogether with specific recommendations about geotechnical studies needed for further evaluationof surface faulting in these hazard zones. The derived zoning map consists in four zones includingnull hazard (stable terrain without subsidence), low hazard (areas prone to subsidence), mediumhazard (zones with subsidence) and high hazard (zones with surface faulting). InSAR resultsdisplayed subsidence LOS velocities up to 10 cm/year and two subsidence areas unknown beforethis study. Gravimetric results revealed that the thicker sediment sequence is located toward north ofAguascalientes City reaching up to 600 m in thickness, which correspond to a high subsidence LOSvelocity zone (up to 6 cm/year).
Keywords: land subsidence; Aguascalientes; surface cracks; ground failure; subsidence zoning;subsidence hazard
1. Introduction
Land subsidence induced by groundwater extraction is a man-induced geological hazard affectingmany cities in the word. One of the main hazards on ground subsiding areas is the developmentof subsidence-related surface faults and earth fissures, because they damage housing and otherinfrastructure, decreasing their real estate value. In Aguascalientes (see Section 3.1), surface faults candevelop displacement across their escarpment (Figure 1), with a variable width of an active zone upto ten meters in which housing structures are easily damaged. Surface faults usually develop overthe bounds of the subsidence zones, but they are not rare toward the central part of subsiding areas.Another subsidence-related problem is the increased flood likelihood due to the disruption of sewageutilities and changes in the surface drainage.
Remote Sens. 2015, 7, 17035–17050; doi:10.3390/rs71215868 www.mdpi.com/journal/remotesensing

Remote Sens. 2015, 7, 17035–17050
Figure 1. Surface faults due to differential subsidence in Aguascalientes. (a) Surface fault affectingman-made structures; (b) Surface faulting has developed escarpments up to 1.80 m high. The locationof the subsidence-related surface faults is shown in Figure 2b.
In this work we use the terms “ground fault”, “surface fault”, “surface crack”, or “fissure” to referto subsidence-related terrain discontinuities, and the terms “quaternary fault”, “pre-existing fault” orsimply “fault” refer to pre-subsidence tectonic faults.
Land subsidence due to groundwater extraction is a slow and gradual process whose effects areusually observed long after subsidence has begun. Because there is no loss of life usually associatedwith its occurrence, subsidence may not be considered a major disaster. Hence, land subsidence isusually not considered in risk mitigation public policies in Mexico as opposed to other hazardousevents such as earthquakes, volcanic eruptions, hurricanes and floods. Unlike subsidence, these eventsare characterized by short duration and high intensity with consequences and catastrophic effects thatare immediately observable.
The Disaster Risk Index (DRI) defined by the United Nations Development Programme [1]provides a methodological tool to assess the impact of catastrophic events [2]. Currently, the DRI issolved for three natural hazards: earthquake, tropical cyclones and flooding, but risk assessment ofother hazards including land subsidence due to groundwater extraction remains as scientific challengesand as works in progress.
Many studies have reported the occurrence of land subsidence and its effects [3–10]. Studiesdealing with monitoring and detecting subsidence are numerous [11–17], as well as works addressedto land subsidence modeling for calculating the expected magnitudes and rates of subsidence fordifferent scenarios [18–23]. Nevertheless, subsidence risk assessment are still scarce [24–29].
In general, risk assessment involves three basic elements: (a) characterization of hazardous event,which is the natural or anthropogenic event able to cause life-loss or property damage (b) quantificationof physical exposure, which refers the number of lives or assets exposed to the hazardous event;(c) determination of vulnerability, which is the features that make the physical exposure able to absorbthe impact of the hazardous event [1,2,30,31]. Once the elements of risk have been determined, risk iscalculated through a model which relates these elements of risk.
Risk subsidence assessment has been addressed in different ways. For example someworks propose methodologies for the determination of areas prone to develop subsidence-relatedfaulting [23,26,27,32–34]. Other works proposed methodologies to determine the areas that are likelyto develop subsidence [29,35]. In all these approaches, the physical exposure has been the terrain butnot constructions.
17036
Remote Sens. 2015, 7, 17035–17050
In this work we propose an approach for producing subsidence hazard maps, where man-madestructures are the assets exposed to the hazardous event, using the city of Aguascalientes, Mexico asa study case. We processed InSAR data to derive subsidence velocity maps which were combined withgeophysical and geological information to produce a zoning map of subsidence hazard.
The presented work covers only the first part of the subsidence risk assessment process:the characterization of the hazardous event. Nevertheless, the resulting maps from this approachprovide valuable information for damage prevention in cities subject to subsidence.
2. Methods
2.1. Identification of Factors Contributing to Subsidence Hazard
Hazard is usually characterized in terms of the probability that a hazardous event occurs withcertain intensity during a given time period [30]. This approach works for phenomena such asearthquakes or hurricanes, which cannot be avoided and whose magnitude cannot be reduced. In thosecases, historical data of the events and their magnitudes are processed with probabilistic techniques inorder to estimate the magnitude of an event in a particular time period.
However, land subsidence due to groundwater extraction is a predictable phenomenon, whoseoccurrence can be avoided if groundwater is not extracted, and whose intensity can be reduced bychanging the ground water extraction policies. The mechanism leading to the generation of subsidencedue to groundwater extraction and associated faulting is well-known [7,36–40]. Nevertheless, theability to calculate time, location, speed and magnitude of subsidence is limited due to the difficulty todetermine the parameters that control the process [41,42].
Subsidence occurrence is a combination of two factors: (a) the existence of unconsolidated orpoorly consolidated sediments deposits that comprise the aquifer system and (b) lowering of thegroundwater level [37,38,43]. The existence of large thickness of sediments prone to consolidation inthe subsoil, which contain water susceptible to be pumped, is by itself the geological environmentpotentially prone to subside, whilst water table lowering is the triggering factor of subsidence.However, if the aquifer system is not comprised of unconsolidated sediments, then subsidence will notdevelop, even if a groundwater level reduction takes place. Thus, the existence and spatial distributionof consolidation-prone basin-fill sediments is the first independent factor to be considered for analyzingland subsidence hazard zoning, which is the mapping of the areas prone to subsidence and the lowestlevel of hazardous for constructions.
In areas where subsidence began long ago, subsidence can evolve in two manners: (a) subsidencedevelops in a uniform way generating a vertical displacement field with low horizontal gradients;(b) subsidence develops differentially, then the horizontal gradients of the vertical displacement fieldare large enough to develop horizontal stresses leading to ground failure development includingsurface faults and cracks [7,23,44,45].
Uniform subsidence changes the surface slope and modifies the slope of the sewer utilities,developing new flooding-prone areas. Hence, zones where uniform subsidence occurs are the secondhazard level for civil structures and urban infrastructure.
Surface faulting is the main concern for property owners and local governments in subsidingurban areas not only for their damage potential but also because ground failures can severely reducereal estate value. As a result, areas where surface faults have developed pose the highest hazard levelto civil structures and other urban infrastructure.
In summary, the key elements to assess the hazard level for man-made structures due to landsubsidence by groundwater extraction are: (1) determination of existence of deformable sedimentscontaining groundwater; (2) detection of sediment zones with subsidence in progress; and (3) locationof affected areas by surface faulting.
17037
Remote Sens. 2015, 7, 17035–17050
2.2. InSAR and Gravimetry for Determining Areas Having Subsidence Hazard Factors
Both gravimetry and InSAR are useful tools for determining two of the three subsidence hazardfactors previously discussed. Gravimetric analysis can be used to determine the distribution ofsediments prone to be consolidated, while InSAR detects the affected areas by subsidence. The presenceof surface faults, which is the other subsidence hazard contributing factor, can be obtained throughfield based cartography.
Gravimetric measurements have been used successfully to determine the distribution andthickness of granular filling in sedimentary basins [23,34,46]. In central Mexico, areas undergoingland subsidence due to groundwater extraction are usually comprised of sequences of unconsolidatedsediment overlying a more dense volcanic or sedimentary rock formation. Consequently, the densitycontrast between the underlying consolidated rock and the overlying sediments is significant, which isvery favorable for a gravimetric study.
The result of a gravimetric survey is a gravimetric anomaly map, which is the difference betweenthe measured and theoretical gravity field. This difference is attributed to the density heterogeneitiesin subsurface: low gravimetric anomalies suggest presence of low density material close to the surface,and high values of the anomaly indicate denser material strata close to the surface. Hence, a gravimetricanalysis provides valuable information about the spatial distribution and thickness of sediments.
Furthermore, some studies have shown that in geological settings susceptible to developingsubsidence by groundwater extraction, there is an inverse correlation between sediment thickness andthe gravimetric anomaly [23,34,47]. This relationship can be used as a qualitative way to characterizeareas with large sediment thickness.
Additionally, gravimetric anomaly data can be inverted or directly modeled in order to elaboratemodels of the sediment thickness distribution. The modeling may be enhanced by constraining themodel with lithological and other direct observations, allowing the generation of detailed maps ofsediment thickness distribution
Because land subsidence due to groundwater extraction may affect large areas, its detectionand quantification are quite suitable for satellite remote sensing techniques. interferometricsynthetic aperture radar (InSAR) techniques have been successfully used to characterize subsidingareas [11,48,49].
3. Case Study: Subsidence Hazard Zoning of Aguascalientes, Mexico
3.1. Study Area
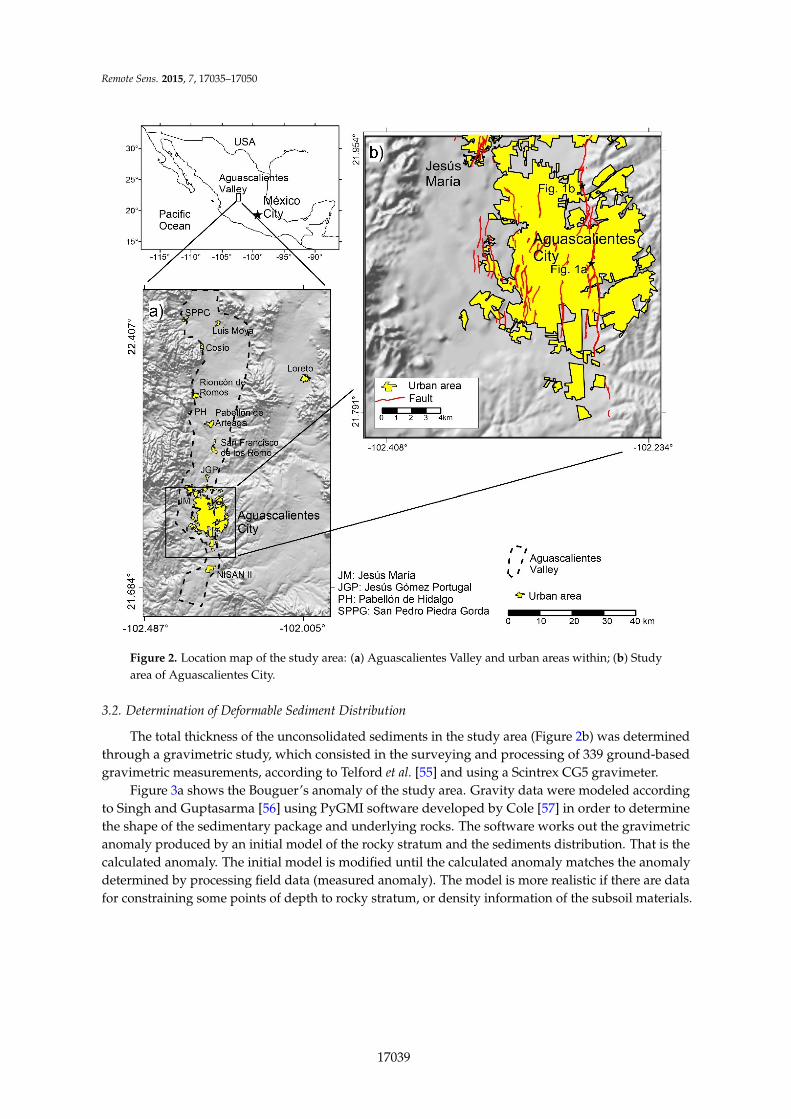
The city of Aguascalientes is located within the Aguascalientes graben in central Mexico, 430 kmNW of Mexico City. Close to one million inhabitants live in the city and suburban municipalities,725,000 in the city of Aguascalientes, and the other 225,000 in the 7 surrounding municipalities [50]:Cosio, Jesús María, Rincón de Romos, Pabellón de Aretaga, San Francisco de los Romo, San PedroPiedra Gorda and Luis Moya (Figure 2a). Intense groundwater extraction initiated in the early 1970’sdue to an increase in agricultural and industrial activities, triggering land subsidence and developmentof surface faults [51–53] and even the reactivation of tectonic faults [7].
According to SIFAGG (Sistema de Información de Fallas y Grietas) [54], currently 208 surface faultsand fractures have been mapped throughout the entire Aguascalientes valley with an accumulatedlength of 290 km, affecting 1865 buildings mainly housings, from which 1438 of those are locatedwithin the city of Aguascalientes. Figure 2b shows only those surface faults within Aguascalientes City.
17038
Remote Sens. 2015, 7, 17035–17050
Figure 2. Location map of the study area: (a) Aguascalientes Valley and urban areas within; (b) Studyarea of Aguascalientes City.
3.2. Determination of Deformable Sediment Distribution
The total thickness of the unconsolidated sediments in the study area (Figure 2b) was determinedthrough a gravimetric study, which consisted in the surveying and processing of 339 ground-basedgravimetric measurements, according to Telford et al. [55] and using a Scintrex CG5 gravimeter.
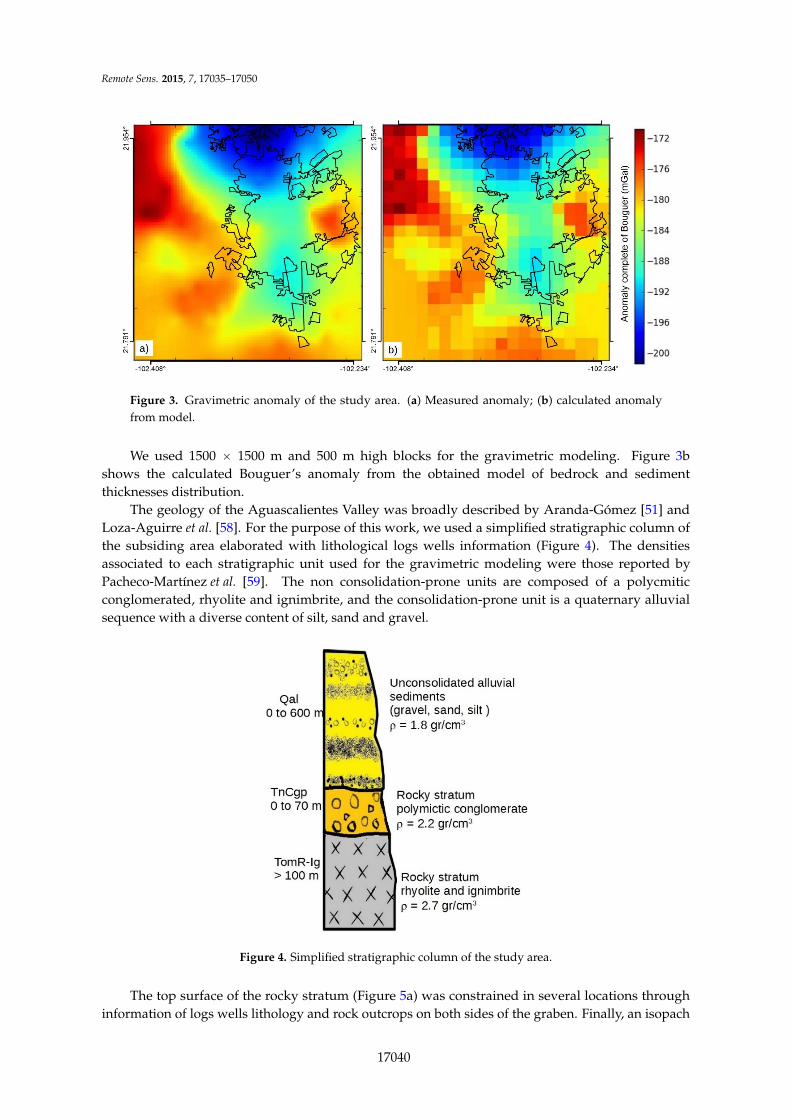
Figure 3a shows the Bouguer’s anomaly of the study area. Gravity data were modeled accordingto Singh and Guptasarma [56] using PyGMI software developed by Cole [57] in order to determinethe shape of the sedimentary package and underlying rocks. The software works out the gravimetricanomaly produced by an initial model of the rocky stratum and the sediments distribution. That is thecalculated anomaly. The initial model is modified until the calculated anomaly matches the anomalydetermined by processing field data (measured anomaly). The model is more realistic if there are datafor constraining some points of depth to rocky stratum, or density information of the subsoil materials.
17039
Remote Sens. 2015, 7, 17035–17050
Figure 3. Gravimetric anomaly of the study area. (a) Measured anomaly; (b) calculated anomalyfrom model.
We used 1500 ˆ 1500 m and 500 m high blocks for the gravimetric modeling. Figure 3bshows the calculated Bouguer’s anomaly from the obtained model of bedrock and sedimentthicknesses distribution.
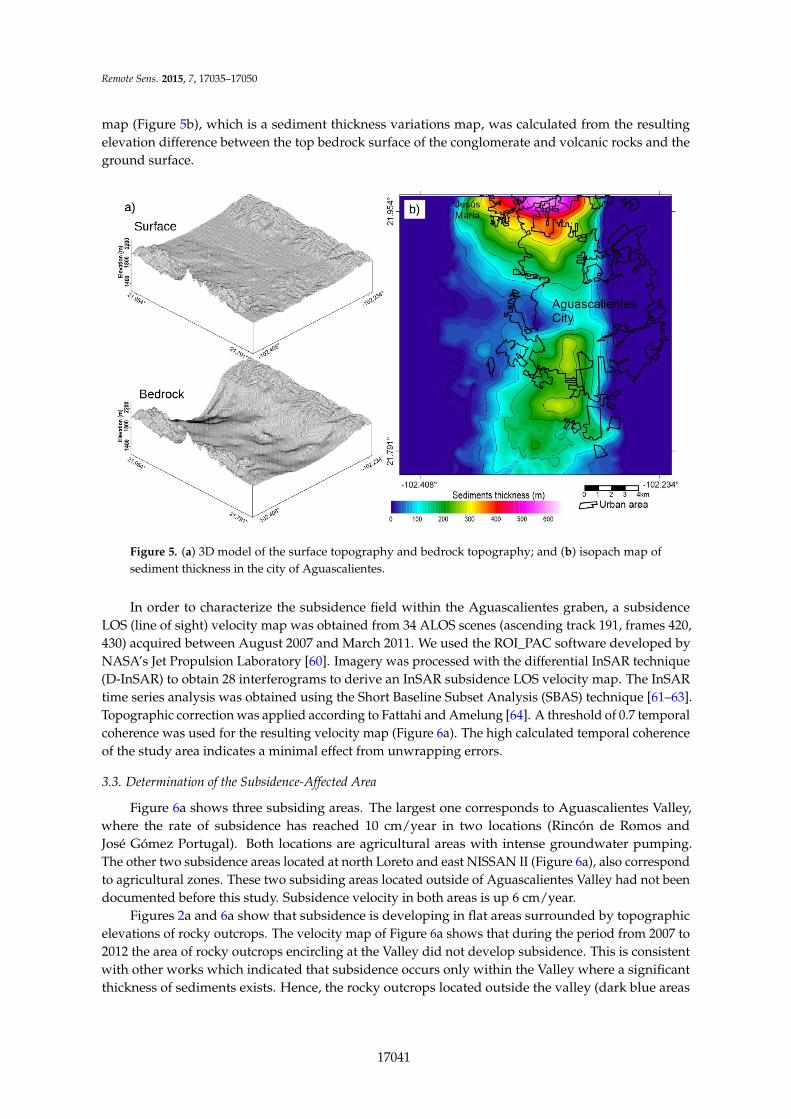
The geology of the Aguascalientes Valley was broadly described by Aranda-Gómez [51] andLoza-Aguirre et al. [58]. For the purpose of this work, we used a simplified stratigraphic column ofthe subsiding area elaborated with lithological logs wells information (Figure 4). The densitiesassociated to each stratigraphic unit used for the gravimetric modeling were those reported byPacheco-Martínez et al. [59]. The non consolidation-prone units are composed of a polycmiticconglomerated, rhyolite and ignimbrite, and the consolidation-prone unit is a quaternary alluvialsequence with a diverse content of silt, sand and gravel.
Figure 4. Simplified stratigraphic column of the study area.
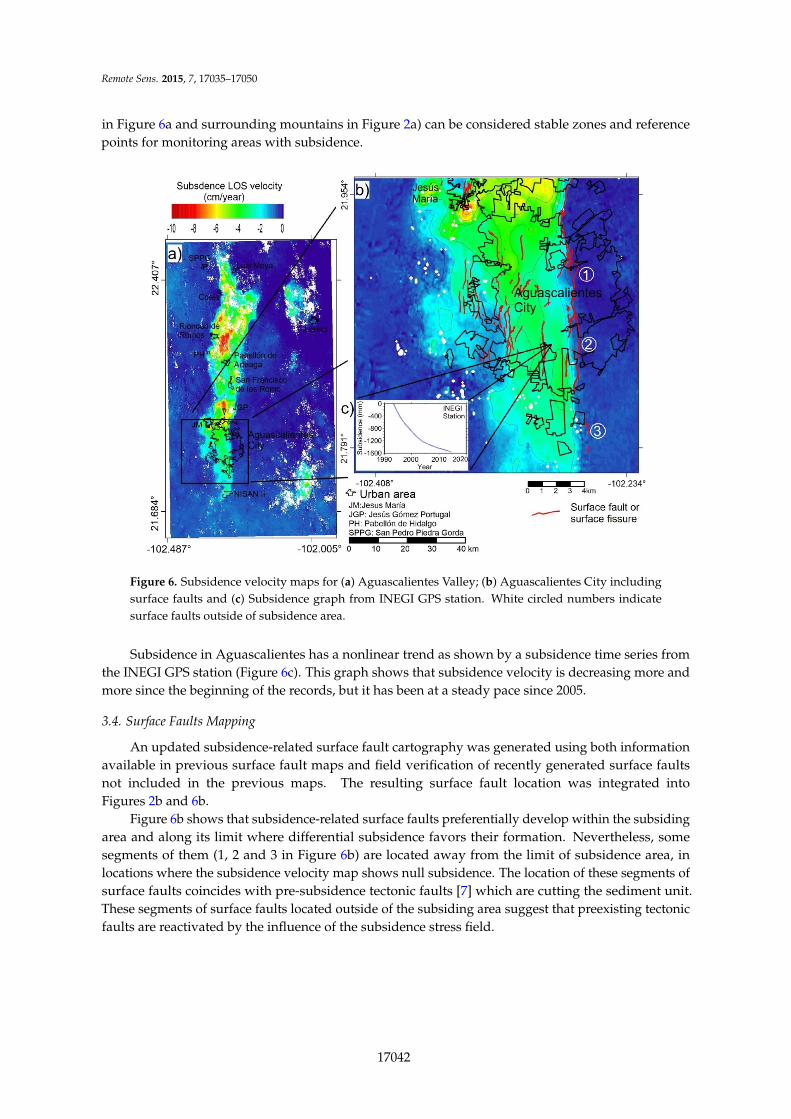
The top surface of the rocky stratum (Figure 5a) was constrained in several locations throughinformation of logs wells lithology and rock outcrops on both sides of the graben. Finally, an isopach
17040
Remote Sens. 2015, 7, 17035–17050
map (Figure 5b), which is a sediment thickness variations map, was calculated from the resultingelevation difference between the top bedrock surface of the conglomerate and volcanic rocks and theground surface.
Figure 5. (a) 3D model of the surface topography and bedrock topography; and (b) isopach map ofsediment thickness in the city of Aguascalientes.
In order to characterize the subsidence field within the Aguascalientes graben, a subsidenceLOS (line of sight) velocity map was obtained from 34 ALOS scenes (ascending track 191, frames 420,430) acquired between August 2007 and March 2011. We used the ROI_PAC software developed byNASA’s Jet Propulsion Laboratory [60]. Imagery was processed with the differential InSAR technique(D-InSAR) to obtain 28 interferograms to derive an InSAR subsidence LOS velocity map. The InSARtime series analysis was obtained using the Short Baseline Subset Analysis (SBAS) technique [61–63].Topographic correction was applied according to Fattahi and Amelung [64]. A threshold of 0.7 temporalcoherence was used for the resulting velocity map (Figure 6a). The high calculated temporal coherenceof the study area indicates a minimal effect from unwrapping errors.
3.3. Determination of the Subsidence-Affected Area
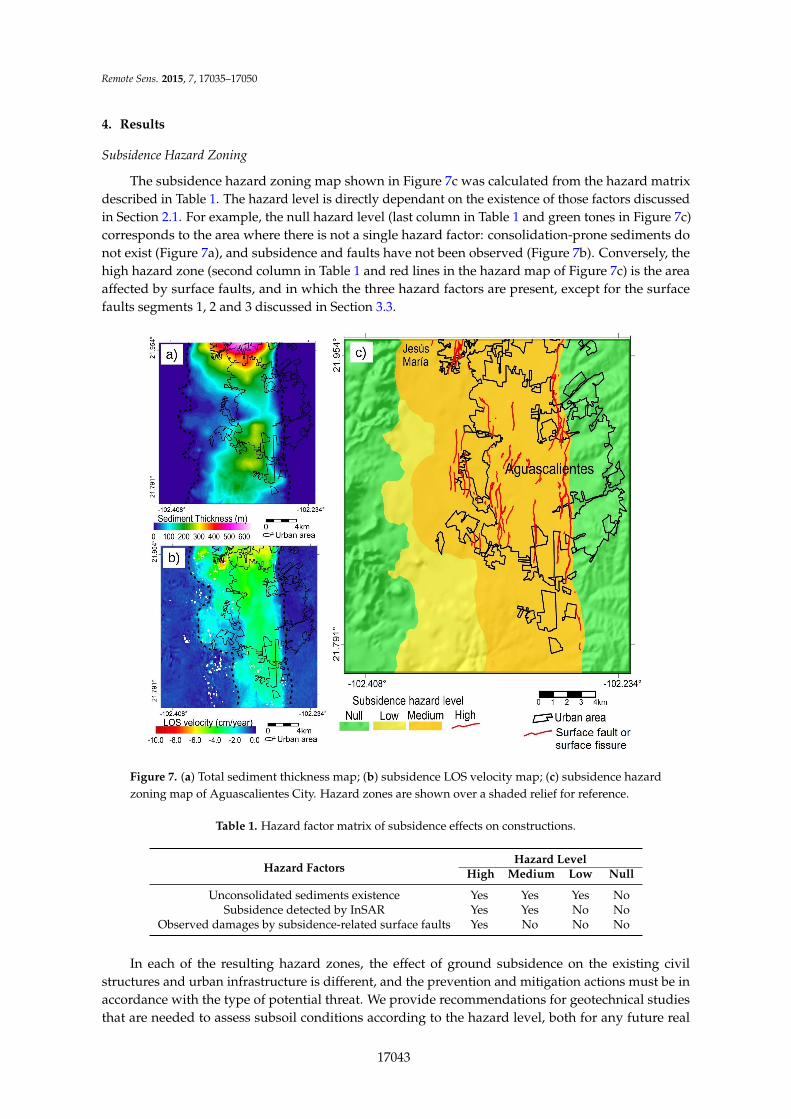
Figure 6a shows three subsiding areas. The largest one corresponds to Aguascalientes Valley,where the rate of subsidence has reached 10 cm/year in two locations (Rincón de Romos andJosé Gómez Portugal). Both locations are agricultural areas with intense groundwater pumping.The other two subsidence areas located at north Loreto and east NISSAN II (Figure 6a), also correspondto agricultural zones. These two subsiding areas located outside of Aguascalientes Valley had not beendocumented before this study. Subsidence velocity in both areas is up 6 cm/year.
Figures 2a and 6a show that subsidence is developing in flat areas surrounded by topographicelevations of rocky outcrops. The velocity map of Figure 6a shows that during the period from 2007 to2012 the area of rocky outcrops encircling at the Valley did not develop subsidence. This is consistentwith other works which indicated that subsidence occurs only within the Valley where a significantthickness of sediments exists. Hence, the rocky outcrops located outside the valley (dark blue areas
17041
Remote Sens. 2015, 7, 17035–17050
in Figure 6a and surrounding mountains in Figure 2a) can be considered stable zones and referencepoints for monitoring areas with subsidence.
Figure 6. Subsidence velocity maps for (a) Aguascalientes Valley; (b) Aguascalientes City includingsurface faults and (c) Subsidence graph from INEGI GPS station. White circled numbers indicatesurface faults outside of subsidence area.
Subsidence in Aguascalientes has a nonlinear trend as shown by a subsidence time series fromthe INEGI GPS station (Figure 6c). This graph shows that subsidence velocity is decreasing more andmore since the beginning of the records, but it has been at a steady pace since 2005.
3.4. Surface Faults Mapping
An updated subsidence-related surface fault cartography was generated using both informationavailable in previous surface fault maps and field verification of recently generated surface faultsnot included in the previous maps. The resulting surface fault location was integrated intoFigures 2b and 6b.
Figure 6b shows that subsidence-related surface faults preferentially develop within the subsidingarea and along its limit where differential subsidence favors their formation. Nevertheless, somesegments of them (1, 2 and 3 in Figure 6b) are located away from the limit of subsidence area, inlocations where the subsidence velocity map shows null subsidence. The location of these segments ofsurface faults coincides with pre-subsidence tectonic faults [7] which are cutting the sediment unit.These segments of surface faults located outside of the subsiding area suggest that preexisting tectonicfaults are reactivated by the influence of the subsidence stress field.
17042
Remote Sens. 2015, 7, 17035–17050
4. Results
Subsidence Hazard Zoning
The subsidence hazard zoning map shown in Figure 7c was calculated from the hazard matrixdescribed in Table 1. The hazard level is directly dependant on the existence of those factors discussedin Section 2.1. For example, the null hazard level (last column in Table 1 and green tones in Figure 7c)corresponds to the area where there is not a single hazard factor: consolidation-prone sediments donot exist (Figure 7a), and subsidence and faults have not been observed (Figure 7b). Conversely, thehigh hazard zone (second column in Table 1 and red lines in the hazard map of Figure 7c) is the areaaffected by surface faults, and in which the three hazard factors are present, except for the surfacefaults segments 1, 2 and 3 discussed in Section 3.3.
Figure 7. (a) Total sediment thickness map; (b) subsidence LOS velocity map; (c) subsidence hazardzoning map of Aguascalientes City. Hazard zones are shown over a shaded relief for reference.
Table 1. Hazard factor matrix of subsidence effects on constructions.
Hazard FactorsHazard Level
High Medium Low Null
Unconsolidated sediments existence Yes Yes Yes NoSubsidence detected by InSAR Yes Yes No No
Observed damages by subsidence-related surface faults Yes No No No
In each of the resulting hazard zones, the effect of ground subsidence on the existing civilstructures and urban infrastructure is different, and the prevention and mitigation actions must be inaccordance with the type of potential threat. We provide recommendations for geotechnical studiesthat are needed to assess subsoil conditions according to the hazard level, both for any future real
17043
Remote Sens. 2015, 7, 17035–17050
estate development and for those existing structures. We list the recommendations from lowest tohighest hazard level.
Null hazard zone: This corresponds to the area in which land subsidence was not detected duringthe period of InSAR data acquisitions (subsidence LOS velocity = 0 in Figure 6), and surface faultshave not been observed yet. Furthermore, in this zone the total thickness of unconsolidated sedimentsis negligible. Null hazard zone corresponds to the rocky outcrops area and those areas in which thebedrock is covered by a thin stratum of sediments. Standard geotechnical studies are sufficient forthis zone.
Low hazard zone: This is the zone of unconsolidated sediments forming the overexploited granularaquifer system (sediment thickness > zero in Figure 5), which are bounded by rocky outcrops, and inwhich subsidence LOS velocity was zero for the observation period (dark blue tones in Figure 6) andsurface faults have not been observed.
In this zone, standard geotechnical studies are needed, plus a superficial geological studysearching for evidence of tectonic faults and cracks in the sediment unit, which could be reactivated ifa decline in groundwater table take place in this zone.
Medium hazard zone: This corresponds to the zone of unconsolidated sediments forming theoverexploited granular aquifer system (sediment thickness > zero in Figure 5), and in which subsidencewas detected through the LOS velocity map (subsidence LOS velocity > 0 in Figure 6). Although thiszone is undergoing subsidence, it is presented uniformly, such that terrain ruptures have not developed.
Geotechnical studies similar to those suggested for low hazard zone are needed, plus a geophysicalsurvey for detecting any incipient or blind surface faulting. Resistivity profiles have been usedwith relative success for detecting surface faults in their initial stage when they may not be visibleon the surface yet [7]. In case that resistivity profiles show an anomaly that could be related toan incipient surface fault, direct excavation of a trench may be needed in order to confirm its existence.Another threat to buildings in this area is the modification of surface drainage as a result of subsidence,which could develop flooding areas and also renders sewage systems ineffective. As this is a regionaleffect of subsidence, the municipal agency responsible for operating the sewage system along with theagency responsible for urban planning should take this issue into consideration for developing timelymitigation measures.
High hazard zone: This zone corresponds to areas where subsidence-related surface faults andfissures have been detected due to the damages they cause to constructions and terrain surface alongtheir trace. The zone includes a band of terrain in each side of the trace of the surface fault in whichsubsidence is developing in a differential manner.
Geotechnical studies similar to those suggested for the medium hazard zone are needed, plusa detailed analysis to determine the influence width of subsidence-related faults in which civilstructures may be damaged due to uneven subsidence.
5. Discussion
The approach of this work was to elaborate a zoning map of the hazard to which constructionsare exposed in subsidence areas. The resulting hazard zoning map includes areas prone to subsidence,those currently undergoing ground subsidence and existent surface fault traces. The hazard map doesnot include the zones prone to surface faults generation or future zones of surface faults growth.
Although the subsidence-induced faulting mechanism due to groundwater extraction is verywell understood, examples of determination of parameters involved in surface fault generation arescarce, and their field and laboratory measurements are still not a common practice for many realestate developers. As a consequence, subsidence-related fault modeling customized for specific civilstructures that may be derived in individualized construction design is still an unattainable goal.
Some authors have proposed solutions for determining the zones prone to developsubsidence-related ground faulting [15,23,27,32,33]. These methodologies are based on thedetermination of the horizontal gradients of a measured parameter. The proposed solutions correlate
17044
Remote Sens. 2015, 7, 17035–17050
ground faulting areas to high values of horizontal gradients of gravimetric anomalies [23], soil vibrationfrequency [32,33] and high values of horizontal gradients of subsidence magnitude [15,27]. Their resultsshow that these methodologies can forecast shallow ground fault generation, but further research isstill needed to determine critical gradient threshold values related to ground faulting developing inspecific cases. Also, further work is still needed to improve the temporal and spatial accuracy forsurface fault generation predictions.
The most hazardous zone for constructions is on ground failures. The zoning includes only thelinear feature representing the trace of the terrain rupture. However, ground failures have an activezone defined by the width of the trace in which differential subsidence is significant to induce damageto the constructions. Studies to determine the width of the active zone or the influence zone ofa ground failure are practically nonexistent. More research is needed to obtain a reliable and practicalmethodology to determine accurately enough this parameter.
The recommendations in this work for geotechnical studies in subsidence areas are to exploresubsoil in order to prevent effects of subsidence, mainly those related to surface faults. The currentpractice in Aguascalientes City and other Mexican cities where surface faults have damagedconstructions is the continuous repair of buildings as long as ground failure does not affect theirstructural stability. Otherwise, buildings are demolished and the terrain is used for parking, green areaor other uses except for building construction. Performance investigations of constructions built overground failures are incipient [65,66]. Preliminary results show that a combination of flexible materialsand special structures, including a device for restoring the level of construction at certain intervals,could be a solution to prevent damage to constructions.
As subsidence is a progressing deformation and rupture subsoil process, hazard levels couldchange with time. If subsidence continues, then new surface faults and fissures will be generated, andthe existing ones will enlarge, producing new zones of high hazard. Conversely, if subsidence stops,then terrain surface will not experience differential subsidence. Surface faults and fissures will becomeinactive, and the terrain surface will be stable for constructions. In any case, the subsidence hazardzoning map should be periodically updated to prevent the implementation of wrong measures inrisk management.
Parameters to determine hazard factors were obtained directly by on-site measurements(gravimetry, mapping of subsidence-related surface faults and rocky outcrops) and by remote sensing(InSAR). Hence, accuracy of the zoning depends on the resolution of the methods used for processingof measured field data.
In the case of the determination of rocky stratum and sediment distribution (low hazard zone),we used 1500 ˆ 1500 m and 50 m high blocks for the gravimetric modeling. Hence, the resolutionachieved for the map production was 1500 m. Therefore, features with sizes lesser than 1500 m are notrepresented in the model of rocky stratum (Figure 5a). Hence, the model of rocky stratum might notinclude detail sufficient to identify topographic features that are triggering differential subsidence andcausing increasing subsidence in specific locations.
However, the resolution of sediment thickness map distribution does not affect the accuracy ofhazard zoning, because the limit of zones of low and null hazard was defined from a GPS surveyingon the bounds of rocky outcrops with an accuracy of ˘4 m. Likewise, the limit of zones of low andmedium hazard is not influenced by the resolution of sediment thickness map because this limit wasdetermined by subsidence measured by InSAR.
The ALOS-InSAR images used to produce the subsidence velocity map have a resolution of30 m. Hence, as we used a GPS with sub-meter resolution for surveying of rocky outcrops andsurface faults, the greatest error in zoning map limits could come from the subsidence velocity map.However, this error is negligible for scale maps 1:10,000 which is the scale more frequently used forurban planning management.
The zoning map does not include either the effect of lateral variations in the sediment thicknessor the influence of subsidence magnitude developed in specific locations. The insertion of these factors
17045
Remote Sens. 2015, 7, 17035–17050
would improve the zoning process, which would result in a map with more zones than the mapderived from the factors analyzed in this work.
Each of such zones would indicate the hazard related to subsidence more accurately.Nevertheless, the simplification of the hazard zoning in four zones as was proposed in this workallows specific and practical recommendations for geotechnical exploration.
A map with many zones or a continuum zoning map could be an interesting scientific contribution.However, the resulting zoning map could lose its practicality and usefulness for urban planning anddevelopment. Additionally, zones with higher subsidence can be addressed as special and specificcases of medium hazard level (as determined in this work).
Risk assessment involves three stages: (1) hazard characterization; (2) quantification of exposedelements at the hazard and determination of their vulnerability; and (3) calculation of risk. Althoughthe characterization of hazard factors is really relevant only in the context of risk assessment, our workrepresent a significant contribution to the development of a further complete methodology, mainlybecause stages 2 and 3 are still unresolved issues and lines of research in progress.
6. Conclusions
A hazard subsidence zoning map is a necessary element in risk management of subsidenceeffects on man-made structures. Gravimetric measurements and InSAR-derived subsidence velocitymaps provide valuable information for this hazard map. Gravimetric surveys are quite suitable fordetermining sediment thickness which may be prone to consolidation and consequently developground subsidence, while InSAR techniques are most suitable for a precise characterization of thesubsidence field.
A combination of both techniques, along with reliable subsurface surface faulting information,was used to derive a subsidence hazard map for the city of Aguascalientes. This map will allow stateand municipal government agencies to clearly specify specific geotechnical and geophysical studiesaccording to the hazard level of the zone in which new constructions are planned.
Due to the dynamic nature of the subsidence process, hazard zoning maps, such as the onedescribed in this work, need to be continuously updated. Future InSAR analysis using newly acquireddata or enhanced processing techniques along with other geodetic infrastructure development such ascontinuously operating GNSS stations will provide updated ground subsidence velocity maps which,in turn, will allow periodic updates of the subsidence hazard maps.
Acknowledgments: Jesús Pacheco-Martínez thanks CONACYT and PRODEP for financial support “Investigaciónapoyada por el CONACYT”. Shimon Wdowinski and Enrique Cabral-Cano acknowledge support throughNASA-ROSES grant NNX12AQ08G. Some of the geodetic infrastructure used in this study was developed withsupport from UNAM-PAPIIT projects IN104213-2 and IN109315-3 for Enrique Cabral-Cano. This material is partlybased on data provided by the UNAVCO Facility with support from the National Science Foundation (NSF) underaward EAR-1338091.
Author Contributions: Jesús Pacheco-Martínez developed the research approach. He processed both InSAR andgravimetric data, and wrote the manuscript. Enrique Cabral-Cano and Shimon Wdowinski participated in theadvising of the InSAR data processing and they gave support improving the manuscript. Martín Hernández-Marín,José Ángel Ortiz-Lozano, Mario Eduardo Zermeño-de-León contributed sharing information on land subsidence,and damages caused by surface faults to the constructions in Aguascalientes City, they also collaborated in thereviewing the manuscript.
Conflicts of Interest: The authors declare no conflict of interest.
References
1. United Nations Development Programme (UNDP). Reducing Disaster Risk; United Nations DevelopmentProgramme: New York, NY, USA, 2004.
2. Peduzzi, P.; Dao, H.; Herold, C.; Mouton, F. Assessing global exposure and vulnerability towars naturalhazards: The Disaster Risk Index. Nat. Hazards Earth Syst. Sci. 2009, 9, 1149–1159. [CrossRef]
17046
Remote Sens. 2015, 7, 17035–17050
3. Zhang, A.; Gong, S.; Carbognin, L.; Johnson, A.I. In Proceedings of the Seventh International Symposium onLand Subsidence, Shanghai, China, 23–28 October 2005; IAHS Press: Rotterdam, The Netherlands, 2005;Publication No. 234.
4. Carreón-Freyre, D.; Cerca, M.; Galloway, D.L. In Proceedings of the Eighth International Symposium onLand Subsidence, Querétaro, Mexico, 17–22 October 2010; IAHS Press: Wallingford, UK, 2010; PublicationNo. 339.
5. Ovando-Shelley, E.; Ossa, A.; Santoyo, E. Effects of regional subsidence and earthquakes on architecturalmonuments in Mexico City. Bol. Soc. Geol. Mex. 2013, 65, 157–167.
6. López-Alvarez, B.; Ramos-Leal, J.A.; Santacruz-De-León, G.; Morán-Ramírez, J.; Carranco-Lozada, S.E.;Noyola-Medrano, C. Subsidence associated with land use changes in urban aquifers with intensive extraction.Nat. Sci. 2013, 5, 291–295. [CrossRef]
7. Pacheco-Martínez, J.; Hernandez-Marín, M.; Burbey, T.J.; González-Cervantes, N.; Ortíz-Lozano, J.Á.;Zermeño-de-Leon, M.E.; Solís-Pinto, A. Land subsidence and ground failure associated to groundwaterexploitation in the Aguascalientes Valley, Mexico. Eng. Geol. 2013, 164, 172–186. [CrossRef]
8. Aranda-Gómez, J.J.; Levresse, G.; Pacheco-Martínez, J.; Ramos-Leal, J.A.; Carrasco-Núñez, G.;Chacón-Baca, E.; González-Naranjo, G.; Chávez-Cabello, G.; Vega-González, M.; Origel-Gutierrez, G.; et al.Active subsidence at the bottom of a recently desiccated crater-lake (Guanajuato, Mexico) and its probablerelation with subsidence faults at Salamanca and Celaya. Bol. Soc. Geol. Mex. 2013, 65, 169–188.
9. Holzer, T.; Johnson, A.I. Land subsidence caused by ground water withdrawal in urban areas. GeoJournal1985, 11, 245–255. [CrossRef]
10. Feng, Q.; Liu, G.; Meng, L.; Fu, E.; Zhang, H.; Zhang, K. Land subsidence induced by groundwater extractionand building damage level assessment—A case study of Datun, China. J. China Univ. Min. Technol. 2008, 18,556–560. [CrossRef]
11. Chaussard, E.; Wdowinski, S.; Cabral-Cano, E.; Amelung, F. Land subsidence in central Mexico detected byALOS InSAR time-series. Remote Sens. Environ. 2014, 140, 94–106. [CrossRef]
12. Osmanoglu, B.; Dixon, T.H.; Wdowinski, S.; Cabral-Cano, E.; Jiang, Y. Mexico City subsidence observed withpersistent scatterer InSAR. Int. J. Appl. Earth Obs. Geoinf. 2011, 13, 1–12. [CrossRef]
13. Cigna, F.; Osmanoglu, B.; Cabral-Cano, E.; Dixon, T.H.; Ávila-Olivera, J.A.; Garduño-Monroy, V.H.;DeMets, C.; Wdowinski, S. Monitoring land subsidence and its induced geological hazard with SyntheticAperture Radar Interferometry: A case study in Morelia, Mexico. Remote Sens. Urban Environ. 2012, 117,146–161. [CrossRef]
14. Cabral-Cano, E.; Dixon, T.H.; Miralles-Wilhelm, F.; Díaz-Molina, O.; Sánchez-Zamora, O.; Carande, R.E.Space geodetic imaging of rapid ground subsidence in Mexico City. Geol. Soc. Am. Bull. 2008, 120, 1556–1566.[CrossRef]
15. Cabral-Cano, E.; Osmanoglu, B.; Dixon, T.; Wdowinski, S.; Demets, C.; Cigna, F.; Díaz-Molina, O. Subsidenceand fault hazard maps using PSI and permanent GPS networks in central Mexico. In Proceedingsof the Eighth International Symposium on Land Subsidence, Querétaro, Mexico, 17–22 October 2010;Carreón-Freyre, D., Cerca, M., Galloway, D., Eds.; IAHS Press: Wallingford, UK, 2010; pp. 255–259,Publication No. 339.
16. Hoffmann, J.; Zebker, H.A.; Galloway, D.L.; Amelung, F. Seasonal subsidence and rebound in Las VegasValley, Nevada, observed by Synthetic Aperture Radar Interferometry. Water Resour. Res. 2001, 37, 1551–1566.[CrossRef]
17. Amelung, F.; Galloway, D.L.; Bell, J.W.; Zebker, H.A.; Laczniac, R.J. Sensing the ups and downs of Las Vegas:InSAR revelas structural control of land subsidence and aquifer-system deformation. Geology 1999, 27,483–486. [CrossRef]
18. Raspini, F.; Loupasakis, C.; Rozos, D.; Adam, N.; Moretti, S. Ground subsidence phenomena in the Deltamunicipality region (Northern Greece): Geotechnical modeling and validation with Persistent ScattererInterferometry. Int. J. Appl. Earth Obs. Geoinf. 2014, 28, 78–89. [CrossRef]
19. Hung, W.-C.; Hwang, C.; Liou, J.-C.; Lin, Y.-S.; Yang, H.-L. Modeling aquifer-system compaction andpredicting land subsidence in central Taiwan. Eng. Geol. 2012, 147–148, 78–90. [CrossRef]
20. Hernández-Marín, M.; Burbey, T. Controls on initiation and propagation of pumping-induced earth fissures:Insights from numerical simulations. Hydrogeol. J. 2010, 18, 1773–1785. [CrossRef]
17047
Remote Sens. 2015, 7, 17035–17050
21. Ortiz-Zamora, D.; Ortega-Guerrero, A. Evolution of long-term land subsidence near Mexico City: Review,field investigations, and predictive simulations. Water Resour. Res. 2010, 46, W01513. [CrossRef]
22. Kihm, J.-H.; Kim, J.-M.; Song, S.-H.; Lee, G.-S. Three-dimensional numerical simulation of fully coupledgroundwater flow and land deformation due to groundwater pumping in an unsaturated fluvial aquifersystem. J. Hydrol. 2007, 335, 1–14. [CrossRef]
23. Pacheco-Martínez, J.; Arzate-Flores, J.; Rojas, E.; Arroyo, M.; Yutsis, V.; Ochoa, G. Delimitation of groundfailure zones due to land subsidence using gravity data and finite element modeling in the Querétaro Valley,Mexico. Eng. Geol. 2006, 84, 143–160. [CrossRef]
24. Solano-Rojas, D.; Cabral-Cano, E.; Wdowinski, S.; Hernández-Espriú, A.; Falorni, G.; Bohane, A. Subsidencehazard an risk assessments for Mexico City: An interdisciplinary analysis of satellite-derived subsidencemapp (PSInSAR) and census data. In Proceedings of the 2014 AGU Fall Meeting, San Francisco, CA, USA,15–19 December 2014; Abstract NH53B-3894.
25. Hernández-Espriú, A.; Reyna-Gutiérrez, J.A.; Sánchez-León, E.; Cabral-Cano, E.; Carrera-Hernández, J.;Martínez-Santos, P.; Macías-Medrano, S.; Falorni, G.; Colombo, D. The DRASTIC-Sg model: An extensionto the DRASTIC approach for mapping groundwater vulnerability in aquifers subject to differential landsubsidence, with application to Mexico City. Hydrogeol. J. 2014, 22, 1469–1485. [CrossRef]
26. Cabral-Cano, E.; Díaz-Molina, O.; Delgado-Granados, H. Subsidencia y sus mapas de peligro: Un ejemploen el área nororiental de la zona Metropolitana de la Ciudad de Mexico. Bol. Soc. Geol. Mex. 2011, 63, 53–60.
27. Cabral-Cano, E.; Solano-Rojas, D.; Oliver-Cabrera, T.; Salazar-Tlaczani, L.; Wdowinski, S.; DeMets, C.;Pacheco-Martínez, J. Subsidence and associated shallow faulting hazard assessment in central Mexico usingInSAR and GPS. In Proceedings of the 2014 AGU Fall Meeting, San Francosnco, CA, USA, 15–19 December2014; Abstract G41A-0471.
28. Hu, B.; Zhou, J.; Wang, J.; Chen, Z.; Wang, D.; Xu, S. Risk assessment of land subsidence at Tianjin coastalarea in China. Environ. Earth Sci. 2009, 59, 269–276. [CrossRef]
29. Huang, B.; Shu, L.; Yang, Y.S. Groundwater Overexploitation Causing Land Subsidence: Hazard RiskAssessment Using Field Observation and Spatial Modelling. Water Resour. Manag. 2012, 26, 4225–4239.[CrossRef]
30. Douglas, J. Physical vulnerability modelling in natural hazard risk assessment. Nat. Hazards Earth Syst. Sci.2007, 7, 283–288. [CrossRef]
31. Bründl, M.; Romang, H.E.; Bischof, N.; Rheinberger, C.M. The risk concept and its application in naturalhazard risk management in Switzerland. Nat. Hazards Earth Syst. Sci. 2009, 9, 801–813. [CrossRef]
32. Ovando-Shelley, E.; Lermo-Samaniego, J.; Auvinet, G.; Méndez-Sánchez, E. Microtremor measurements toidentify zones of potential fissuring in the basin of Mexico. Geofís. Int. 2012, 51, 143–156.
33. Lermo, J.; Ovando, E.; Espinoza, L. Microtremor measurements to detect zones of potential cracking in thebasin of Mexico. In Proceedings of Eighth International Symposium on Land Subsidence, Querétaro, Mexico,17–22 October 2010; Carreón-Freyre, D., Cerca, M., Galloway, D., Eds.; IAHS Press: Querétaro, Mexico, 2010;pp. 51–33, Publication No. 339.
34. Pacheco-Martínez, J.; Arzate-Flores, J.A.; López-Doncel, R.; Barboza-Gudiño, R.; Mata-Segura, J.L.;Del-Rosal-Pardo, A.; Aranda-Gómez, J.J. Zoning map of ground failure risk due to land susbidence ofSan Luís Potosí, Mexico. In Proceedings of Eighth International Symposium on Land Subsidence, Querétaro,Mexico, 17–22 October 2010; Carreón-Freyre, D., Cerca, M., Galloway, D.L., Eds.; IAHS Press: Querétaro,Mexico, 2010; pp. 179–184, Publication No. 339.
35. Abbasnejad, A.; Abbasnejad, B. Subsidence hazard zoning of Jiroft Plain, Southeast Iran. Int. J. Eng. Res. Dev.2013, 7, 61–68.
36. Holzer, T.L. Ground failure in areas of subsidence due to ground-water decline in the United States.In Proceedings of the International Symposium on Land Subsidence, Anaheim, CA, USA, 13–17 December1976; Jhonson, A.I., Yamamoto, S., Eds.; IAHS Press: Paris, France, 1976; pp. 423–433, Publication No. 121.
37. Holzer, T.L. Ground failure induced by ground-water withdrawal from unconsolidated sediments. Geol. Soc.Am. Rev. Eng. Geol. 1984, VI, 67–105.
38. Galloway, D.L.; Burbey, T.J. Review: Regional land subsidence accompanying groundwater extraction.Hydrogeol. J. 2011, 19, 1459–1486. [CrossRef]
39. Budhu, M. Earth Fissure Formation from the Mechanics of Groundwater Pumping. Int. J. Geomech. 2011, 11,1–11. [CrossRef]
17048
Remote Sens. 2015, 7, 17035–17050
40. Wang, G.Y.; You, G.; Shi, B.; Yu, J.; Li, H.Y.; Zong, K.H. Earth fissures triggered by groundwater withdrawaland coupled by geological structures in Jiangsu Province, China. Environ. Geol. 2009, 57, 1047–1054.[CrossRef]
41. National Research Council (NRC). Mitigation Losses from Land Subsidence in the United States; NationalAcademy Press: Wachington, DC, USA, 1991.
42. Pacheco-Martínez, J.; Ortiz-Lozano, J.A.; Zermeño-De-León, M.; Mendoza-Otero, E. Líneas de investigaciónvigentes y pertinentes en subsidencia y generación de agrietamientos. In Convergencias del Diseño y laConstrucción; Acosta-Collazo, A., Ed.; Universidad Autónoma de Aguascalientes: Aguascalientes, Mexico,2011; Volume I, pp. 186–197.
43. Budhu, M.; Adiyaman, I.B. Mechanics of land subsidence due to groundwater pumping. Int. J. Numer. Anal.Methods Geomech. 2010, 34, 1459–1478. [CrossRef]
44. Bouwer, H. Land Subsidence and Cracking due to ground-water depletion. Ground Water 1977, 15, 358–364.[CrossRef]
45. Jachens, R.C.; Holzer, T.L. Differential compaction mechanism for earth fissures near Casa Grande, Arizona.Geol. Soc. Am. Bull. 1982, 93, 998–1012. [CrossRef]
46. Yutsis, V.; Aranda-Gómez, J.J.; Arzate Flores, J.; Harald, B.; Pacheco Martínez, J.; López-Loera, H. Maargeophysics: Valle de Santiago study. In Proceedings of the 5th International MAAR Conference, Querétaro,Mexico, 17–22 November 2014; pp. 32–33.
47. Jachens, R.C.; Holzer, T.L. Geophysical investigation of ground failure related to ground waterwithdrawal-Picacho Basin, Arizona. Ground Water 1979, 17, 574–585. [CrossRef]
48. Galloway, D.L.; Hudnut, K.W.; Ingebritsen, S.E.; Phillips, S.P.; Peltzer, G.; Rogez, F.; Rosen, P.A. Detection ofaquifer system compaction and land subsidence using interferometric synthetic aperture radar, AntelopeValley, Mojave Desert, California. Water Resour. Res. 1998, 34, 2573–2585. [CrossRef]
49. Bell, J.W.; Amelung, F.; Ferretti, A.; Bianchi, M.; Novali, F. Permanent scatterer InSAR reveals seasonal andlong-term aquifer-system response to groundwater pumping and artificial recharge. Water Resour. Res.2008, 44, W02407. [CrossRef]
50. Instituto Nacional de Estadística e Informática. Censo de Población y Vivienda 2010, Panorama Socioeconómico deAguascalientes; INEGI: Aguascalientes, Mexico, 2011.
51. Aranda-Gómez, J.J. Geología preliminar del graben de Aguascalientes. Rev. Mex. Cienc. Geol. 1989, 8, 22–32.52. Lermo, J.; Nieto-Obregón, J.; Zermeño, M. Faults and fractures in the valley of Aguascalientes. Preliminary
microzonification. In Proceedings of the Eleventh World Conference on Earthquake Engineering, Acapulco,Mexico, 23–28 June 1996.
53. Romero-Navarro, M.A.; Pacheco-Martínez, J.; Ortiz-Lozano, J.A.; Zermeño-De-León, M.E.;Araiza-Garaygordobil, G.; Mendoza-Otero, E. Land subsidence in Aguascalientes Valley, Mexico.Historical Review and present situation. In Proceedings of Eighth International Symposium on LandSubsidence, Querétaro, Mexico, 17–22 October 2010; Carreón-Freyre, D., Cerca, M., Galloway, D., Eds.; IAHSPress: Wallingford, UK, 2010; pp. 207–209, Publication No. 339.
54. SIFAGG Sistema de Información de Fallas Geológicas y Grietas. Available online: http://www.aguascalientes.gob.mx/sop/sifagg/web/mapa.asp. (accessed on 15 July 2015).
55. Telford, W.M.; Geldart, L.P.; Sheriff, R.E. Applied Geophysics; Cambridge University Press: New York, NY,USA, 1990.
56. Singh, B.; Guptasarma, D. New method for fast computation of gravity and magnetic anomalies fromarbitrary polyhedral. Geophysics 2001, 66, 521–526. [CrossRef]
57. Cole, P. PyGMI-Python Geophysical Modeling and Interpretation Software; Council for Geosciences. GeologicalSurvey of South Africa: Silverton, Pretoria, South Africa, 2015.
58. Loza-Aguirre, I.; Nieto-Samaniego, Á.F.; Alaniz-Álvarez, S.A.; Iriondo, A. Relaciones estratigráfico-estructuralesen la intersección del sistema de fallas San Luis-Tepehuanes y el graben de Aguascalientes, Mexico central.Rev. Mex. Cienc. Geol. 2008, 25, 533–548.
59. Pacheco Martínez, J.; Zermeño de León, M.; Mendoza Otero, E.; de Alba Obregón, R. Zonificación del PeligroPor Subsidencia: Caso Aguascalientes, 1a edición; Universidad Autónoma de Aguascalientes: Aguascalientes,Mexico, 2012.
60. Rosen, P.A.; Hensley, S.; Peltzer, G. Updated repeated orbit interferometry package released. Eos Trans. Am.Geophys. Union 2004, 85, 47. [CrossRef]
17049
Remote Sens. 2015, 7, 17035–17050
61. Rosen, P.A.; Hensley, S.; Joughin, I.R.; Li, F.K.; Madsen, S.N.; Rodríguez, E.; Goldstein, R.M. SyntheticAperure Radar Interferometry. Proc. IEEE 2000, 88, 333–382. [CrossRef]
62. Berardino, P.; Fornaro, G.; Lanari, R.; Sansosti, E. A new algorithm for surface deformation monitoring basedon small baseline differential SAR Interferograms. IEEE Trans. Geosci. Remote Sens. 2002, 40, 2375–2383.[CrossRef]
63. Lanari, R.; Mora, O.; Manunta, M.; Mallorqui, J.J.; Berardino, P.; Sansosti, E. A small-baseline approach forinvestigating deformations on full-resolution differential SAR interferograms. IEEE Trans. Geosci. Remote Sens.2004, 42, 1377–1386. [CrossRef]
64. Fattahi, H.; Amelung, F. DEM error correction in InSAR time series. IEEE Trans. Geosci. Remote Sens. 2013, 51,4249–4259. [CrossRef]
65. Hernández-Castillo, L.A.; Ortiz-Lozano, J.A.; Hernández-Marín, M.; Pacheco-Martínez, J.;Zermeño-De-León, M.E.; Soto-Bernal, J.J.; Ramos-Ruiz-Flores, J.; Soto-Zamora, M.A. Fragility curvesfor thin-walled cold-formed steel wall frames affected by ground settlements due to land subsidence.Thin-Walled Struct. 2015, 87, 66–75. [CrossRef]
66. Ortiz-Lozano, J.A.; Pacheco-Martínez, J.; Zermeño de León, M.; Alonso-Farrera, F.A.; Soto-Bernal, J.J.;Moreno-Virgen, M.R.; Correa-Zúñiga, L.O. Application of cold formed steel Framing Structures forconstruction in zones affected by Land Subsidence. MATEC Web Conf. 2012, 2, 1–7.
© 2015 by the authors; licensee MDPI, Basel, Switzerland. This article is an open accessarticle distributed under the terms and conditions of the Creative Commons by Attribution(CC-BY) license (http://creativecommons.org/licenses/by/4.0/).
17050