evaluation of terrasar-x insar for the measurements of mining subsidence · pdf...
TRANSCRIPT

EVALUATION OF TERRASAR-X INSAR FOR THE MEASUREMENTS OF MINING SUBSIDENCE
Krawczyk Artur (1), Perski Zbigniew (2), Marinković Petar (3), Hanssen Ramon(3)
(1)AGH University of Science and Technology, Faculty of Mining Surveying and Environmental Engineering, Krakow POLAND
(2)University of Silesia, Faculty of Earth Sciences, Sosnowiec POLAND(3)Delft University of Technology, Mathematic Geodesy and Positioning, Department of Earth Observation and Space
Systems (DEOS), Delft, THE NETHERLANDS
ABSTRACT
This work presents preliminary results of interferometric analysis of the high-resolution TerraSAR-X data for deformation monitoring applications. The preliminary analysis was performed with an interferogram of the Legnica-Głogów Copper Ore Mining Area with a dominant terrain deformation signal. This is the first interferogram of this type computed for any area in Poland. Furthermore, the general characteristics of TerraSAR-X system have been reviewed with the special emphasis on a different SAR acquisition modes and their significance for the interferometric applications. To further investigate the potential of TerraSAR-X data for the deformation monitoring, TerraSAR-X results were compared to the ones obtained utilizing Envisat/ASAR satellite data. Due to a significantly shorter temporal baseline, TerraSAR-X interferogram shows only a fraction of deformation as detected by Envisat/ASAR. Nevertheless, the average displacement velocities derived by both sensors are in the agreement within expected error margins. The detailed comparison showed similar detectability and measurability for the both mentioned SAR systems.
1. INTRODUCTION
Very high resolution passive satellite Earth Observation (EO) like IKONOS and Quickbird systems have been operationally used in many (Earth) monitoring applications for last 8 years. The first available civilian very high resolution space borne SAR (Synthetic Aperture Radar) system is TerraSAR-X. It acquires data in different modes with different resolutions: SpotLight (1.3 m), StripMap (3.3 m), Scan-SAR (14.8 m) and also in a polarimetric mode [1]. In this study the interferometric application of TerraSAR-X StripMap data has been evaluated and explored for the deformation monitoring applications. The test was performed for the area in Poland affected by terrain subsidence. The cause of the subsidence is an underground copper minerals exploitation. For the same area Envisat ASAR C-band data has been acquired covering approximately a similar time period (see Tab.1 and 2).
2. AREA OF INTEREST
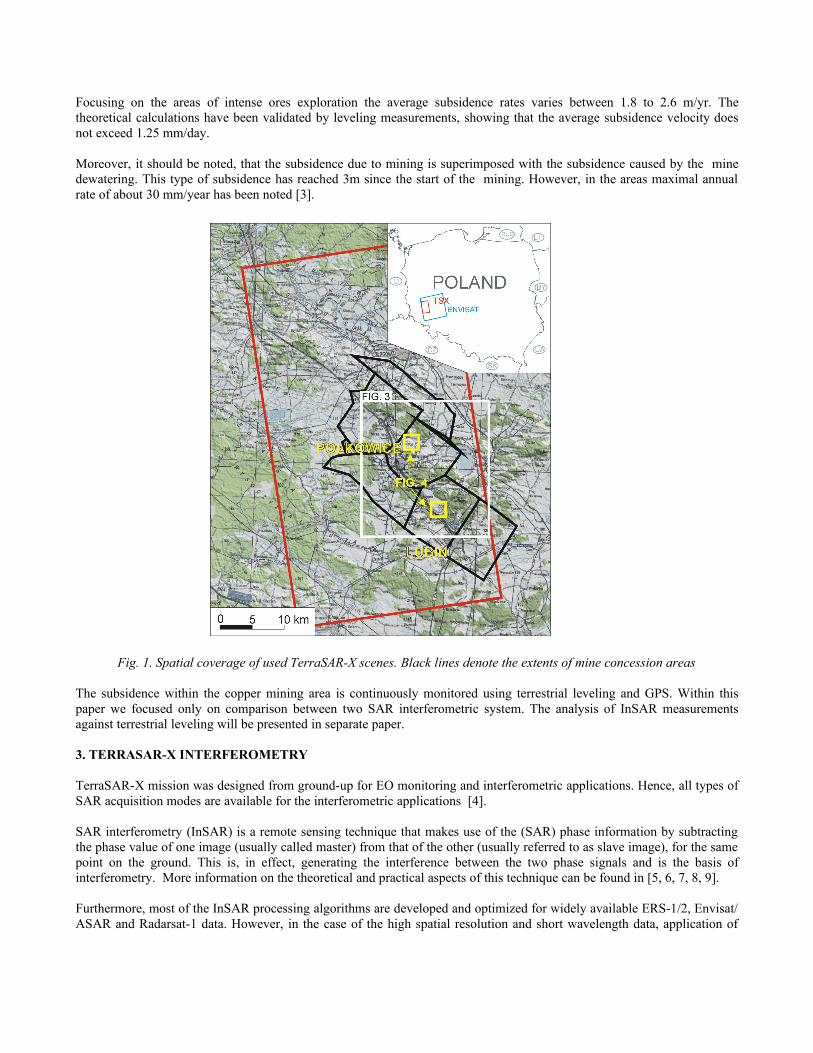
The TerraSAR-X images were acquired for Legnica-Głogów Copper Mining Area in south western Poland where 8 mining concession areas (400 sq km) is operated by 3 mines (Fig. 1). Two urban areas, namely, cities of Lubin and Polkowice and several villages are located within the extent of the direct mining influences. The minerals exploitation started in 1960’s causing subsidence due to mining itself, and also due to pumping out of mine water (mine de-watering). The observed ground subsidence is characterized by two main parameters [2]:
-max. subsidence w = 3,553 m,-max. tilt Tmax = 5,60 mm/m.
For the period since September 2000, the observed displacement rates are:-max. subsidence rate Δwmax= 1,81 m-max. tilt rate ΔTmax = 4,79 mm/m
Focusing on the areas of intense ores exploration the average subsidence rates varies between 1.8 to 2.6 m/yr. The theoretical calculations have been validated by leveling measurements, showing that the average subsidence velocity does not exceed 1.25 mm/day.
Moreover, it should be noted, that the subsidence due to mining is superimposed with the subsidence caused by the mine dewatering. This type of subsidence has reached 3m since the start of the mining. However, in the areas maximal annual rate of about 30 mm/year has been noted [3].
Fig. 1. Spatial coverage of used TerraSAR-X scenes. Black lines denote the extents of mine concession areas
The subsidence within the copper mining area is continuously monitored using terrestrial leveling and GPS. Within this paper we focused only on comparison between two SAR interferometric system. The analysis of InSAR measurements against terrestrial leveling will be presented in separate paper.
3. TERRASAR-X INTERFEROMETRY
TerraSAR-X mission was designed from ground-up for EO monitoring and interferometric applications. Hence, all types of SAR acquisition modes are available for the interferometric applications [4].
SAR interferometry (InSAR) is a remote sensing technique that makes use of the (SAR) phase information by subtracting the phase value of one image (usually called master) from that of the other (usually referred to as slave image), for the same point on the ground. This is, in effect, generating the interference between the two phase signals and is the basis of interferometry. More information on the theoretical and practical aspects of this technique can be found in [5, 6, 7, 8, 9].
Furthermore, most of the InSAR processing algorithms are developed and optimized for widely available ERS-1/2, Envisat/ASAR and Radarsat-1 data. However, in the case of the high spatial resolution and short wavelength data, application of

certain processing steps of the "conventional" InSAR processing algorithms cannot be applied directly. More specifically, referring to [4], the biggest problems could be associated to a conventional "three-step" coregistration and spectral filtering modules.
In order to achieve optimal interferometric results, the coregistration procedure must ensure the accuracy of 1/10 pixel or better. In the "conventional" coregistration approach, the line/pixel shift caused by topography is removed with a polynomial of a certain degree. However, for the high resolution interferometry, in order to achieve the optimal results, the coregistration approach that utilizes the imaging geometry information and a-priori information of the topography of AOI has to be used - the so called DEM-assisted method, see e.g. [10]. Moreover, for processing TerraSAR-X SpotLight data the adaptive filtering needs to be performed in order to account for time-varying Doppler centroid frequency, specifically,[11] optimization of the image resampling and spectral filtering algorithms is needed.
All the optimizations and new algorithmic development for processing SpotLight and StripMap TerraSAR-X data, including reader of COSAR format [11], are fully implemented and will be released in a new version of DORIS software [12,13].
In a case of Legnica-Głogów area two TerraSAR-X StripMap images were used (Tab. 1) covering the area presented on Fig. 1.
Table 1. TerraSAR-X scenes used for processing1 2
Orbit No. 02408 ASCENDING 02575 ASCENDINGAcquisition date and time 2007-11-20 16:34:52. 2007-12-01 16:34:51Incidence angle 31o 31o
Polarization HH HHTemporal baseline 11 daysGeometrical baseline (perpendicular)
-165.2 m
Altitude of ambiguity 28.7 m
3.1. Data processing details and preliminary interpretation
For the coregistration of TerraSAR-X dataset both "conventional" and "dem-assisted" method were tested. In this case study with rather moderate topography, there was no significant difference between both methods observed. The final processing was completed with “conventional” method based on orbital geometry and estimation of the resempling polynomial through correlation optimization procedure.
Furthermore, due to the large spatial baseline the terrain topography influenced strongly the fringe pattern, as indicated in Fig. 2. The topographic contribution was removed using one arc second DTED Level-2 data. Unfortunately, due to large spatial resolution difference between TerraSAR-X data and used DEM some topographic features could not be “removed”. It could be also noted that the DEM was constructed in 1990 and thus presents at least 17 years of temporal difference. The final geocoding to national coordinate system “Układ 2000” was completed using orbits and DTED elevation data.
Legnica-Głogów Copper Mining Area has been already studied with SAR interferometry using ERS-1 data [14, 15] and Envisat [16]. For the evaluation of TerraSAR interferometry a pair of Envisat ASAR data was acquired at the closest dates to TerraSAR-X acquisitions (Tab. 2).
Table 2. Envisat ASAR scenes used for processing1 2
Orbit No. 29570 ASCENDING 30071 ASCENDINGAcquisition date and time 26-OCT-2007 23:38:44 17-DEC-2007 23:37:44Incidence angle 23o 23o
Polarisation VV VVTemporal baseline 35 daysBaseline (perpendicular) 423.6 mAltitude of ambiguity 19.3 m
Envisat data were also processed with DORIS software, and the topographic phase contribution was removed using the same DTED dataset as in the processing of TerraSAR-X data.

Fig. 2. Interferometric products derived from full TerraSAR-X scenes A – coherence map; B – interferogram; C – topography corrected interferogram
Even though high coherence of TerraSAR-X interferogram of the area was not expected, because of the sensitivity of short wavelength (X band) and relatively rural area, computed TerraSAR-X interferogram presents very good coherence (Fig. 2). TerraSAR-X data were acquired in November and December, i.e., during the season of lowest vegetation what resulted in overall good coherence of the interferogram. However, the regional atmospheric effect should be noted (Fig. 2C).
The visual inspection of both, TerraSAR-X and Envisat interferograms, shows that the same areas affected by deformation (Fig. 3) could be identified. The location of subsidence phenomena is similar in both cases. Due to different temporal baseline and wavelength the measured subsidence ratios are different, but the question whether they are comparable remains.
Fig. 3. TerraSAR-X (left) and Envisat (Right) interferograms of the same area In LGOM. Data geocoded to the state coordinate system „2000”. In the eastern part of interferograms Żelazny Most waste pond is clearly visible

3.2 Quantitative analysis
To perform quantitative comparison two highly coherent subsidence bowls were chosen: one located on old abandoned mine waste dump area near Gilów and the second near Moskorzyn village (Fig. 4).
Fig. 4. Examples of two subsidence troughs In the area of Gilów waste dump (upper row) and near Moskorzyn village (lower row). From left: TerraSAR-X, Envisat and topographic map scale 1: 50 000 of the same area
For the comparison between ASAR and TSX the deformation gradient is needed. In order to compute it, for the selected subsidence bowls, the phase unwrapping was performed by the semi-manual approach taking into account coherence information, and considering a-priori subsidence information/prognosis. In this manner the deformation gradient was calculated. In order to do so, the interferometric phase difference between the highest subsidence in the center and the lowest subsidence at the edge of the bowl has been taken. The distance between those points was about 500 m thus atmospheric signal of long spatial wavelength was not affecting the measurements. To increase the (relative) accuracy and reduce the effect of noise, the phase values has been collected over 3x3 window and were averaged. The window size was estimated empirically taking into account the small spatial size analyzed subsidence bowl. The data was unwrapped over (pre)selected profiles using an a-priori information on the expected subsidence. As it was mentioned above the only highly coherent subsidence bowls were considered therefore we can assume that the measured phase gradient could be directly related to deformation. In order to make the phase measurements comparable, the gradients have been recalculated into a vertical component of the subsidence velocity, by means of formulas as described in [9]. Results are presented in mm/day and discussed in Tab. 3. To calculate the subsidence velocity its linearity over the temporal baselines of interferograms was assumed. The experience with the analysis of subsidence within area of study shows that the subsidence velocity variation becomes important within the frame of 3-4 months.

Table 3. Results of subsidence velocity calculations for the subsidence bowls show on Fig.4. Both SAR systems show very similar capability for subsidence velocity measurement.
SAR systemInterferometric phase
gradient [radians]Subsidence gradient along
LoS [mm]Subsidence velocity vertical
component [mm/day]Gilów mine waste dump area
TerraSAR-X 7.0542 17.402 1.238Envisat 10.5674 43.092 1.356
Vicinity of Moskorzyn villageTSX 2.1668 5.345 0.416Envisat 3.8108 16.982 0.446
LoS – Line of Sight
The obtained values show that both radar systems could measure the same phenomena with the similar accuracy. However, it has to be again stressed, that the analysis was performed using only a single interferogram with no removal of the atmospheric phase screen. Thus these results should be considered as preliminary, however, they still could be used to indicate the expected precision and to evaluate the performance of TerraSAR-X for the deformation monitoring.
During TerraSAR-X data analysis some features that does not have any equivalent in lower resolution systems like ASAR were noted (Fig. 5):
A B CFig. 5. Details of TerraSAR-X interferogram presenting features that can be studied due to its high spatial resolution.
Detailed description in the text below
Fig. 5A. Lubin town: on the TerraSAR-X interferograms the fringes around the individual buildings are visible. The building heights were not included on DTED elevation data thus the phase contribution represents probably buildings heights. It seems that the buildings heights could be measured his way. Fig. 5B. The embankment of Żelazny Most mine waste dumping area. The visible fringe patterns is not caused by any deformation but by the embankment heighten and reinforcement performed few years ago.Fig. 5C. Opencast sand mine „Obora”. The fringe pattern visible here is caused by elevation change due to sand pitting. As in the previous case TerrSAR-X reveals the areas where used DTED elevation data are not up to date.

4. CONCLUSIONS
The analysis described above shows that the monitoring of mine subsidence with TerraSAR-X, could benefit in the following areas:
1. More accurate geolocalization of the subsidence areas. Due to high resolution of TerraSAR-X we can more precisely register the geocoded interferograms into GIS based on visible topographic features and GCP points.
2. More detailed monitoring of subsidence development. Due to short temporal baseline (11 days) we can observe the subsidence development with higher temporal sampling. However, in a case of Copper ore mining such interval appears to be too short. The 11 days sampling is more important for the areas of much faster subsidence (up to few centimeters per day) that occurs on the areas of underground hard coal exploitation.
3. TeraSAR-X interferograms potentially might be used to detect and correct the errors of digital elevation data.
Moreover, in terms of operational use for subsidence monitoring, through a time series like processing setups, the current pricing model could be identified as major obstacle.
The research was performed thanks to funding provided by Polish Ministry of Science no. 4T12E 001 26. The DTED Level 2 elevation data was available for this research thanks to courtesy of Military Geographic Center.
5. REFERENCES
1.Fritz T., Eineder M. (ed.) (2008): TerraSAR-X Ground Segment Basic Product Specification Document, TX-GS-DD-3302, http://www.dlr.de/tsx/documentation/SAR_Basic_Products.pdf
2.Cuprum (2008): The evaluation of the results of the geodetic measurements on detailed network completed in 2007 by CBPM Cuprum for O/ZG „Rudna” Cuprum. Wrocław 2008, [In polish, unpublished report]
3.Popiołek E. (1997): Analysis of the development of the large area subsidence trough resulted from the dewatering of Tertiary ad Quaternary sediments within LGOM area. AGH, Kraków 1997. [In polsh, unpublished report].
4.Adam N., Eineder M., Schatter B., Yague-Martines N. (2008): First TerraSAR-X interferometry evaluation, Fifth International Workshop on ERS/Envisat SAR interferometry, `FRINGE07', Frascati, Italy, CDROM.
5.Goldstein R.M., Zebker H.A., Werner, C.L. (1988): Satellite radar interferometry: Two-dimensional phase unwrapping. Radio Science, 23(4): 713-720.
6.Bamler R., Hartl P. (1998): Synthetic aperture radar interferometry. Inverse Problems, 14: R1-R54.
7.Massonnet, D., Feigl, K.L. (1998): Radar interferometry and its application to changes in the earth's surface. Reviews of Geophysics, 36(4): 441-500.
8.Rosen P.A., Hensley S., Joughin I.R., Li F.K., Madsen S.N., Rodriguez E., Goldstein R.M. (2000): Synthetic Aperture Radar Interferometry. Proceedings of the IEEE, 88(3): 333-382.
9.Hanssen R.F., (2001): Radar Interferometry: Data Interpretation and Error Analysis. Kluwer Academic Publishers, Dordrecht.
10.Huanyin Y., Hanssen R., Kianicka J., Marinkovic P., Leijen F., Ketellar G. (2004): Sensitivity of topography of InSAR data coregistration, ENVISAT & ERS Symposium, Salzburg, Austria, 6-10 September, 2004, CDROM.
11.Fritz T. 2005 – TerraSAR-X Ground Segment Level 1b Product Format Specification TX-GS-DD-3307, http://www.dlr.de/tsx/documentation/TX-GS-DD-3307_Level-1b-Product-Format-Specification_1.3.pdf
12.Kampes B.M., Hanssen R.F., Perski Z. (2003): Radar Interferometry with Public Domain Tools, Third International Workshop on ERS SAR Interferometry, `FRINGE03', Frascati, Italy, 1-5 Dec 2003, CDROM.

13.Marinković P. (2008): New developments in Earth Observation: using TerraSAR-X satellite data for monitoring geophysical parameters. NAC-9, Nederlands Aardwetenschappelijk Congres, 18 - 19 March 2008, Veldhoven. – poster
14.Krawczyk A. Perski Z. (2000): Application of satellite radar interferometry on the areas of underground exploitation of copper ore in LGOM – Poland, 11th International Congress of the International Society for Mine Surveying. AGH, Kraków: 209-218.
15.Krawczyk A. Perski Z. (2000): Seen by radar. The application of SAR Interferometry for the areas of copper ore exploitation in Legnica-Głogów Copper Center, Geodeta, 10: 50-54 [in polish]
16.Popiołek E. (ed.) (2006): Analysis of vertical displacements of mining terrains of KGHM „Polska Miedź S.A. with application of SAR interferometric techniques. Stowarzyszenie Naukowe im. S.Staszica w Krakowie. [In polish, unpublished report]