annual report and accounts contents inside flap the directors’ statement on pages 75 to 77 for 3i...
TRANSCRIPT
Annual report and accounts 2018
Chairman’s statement
p2At a glance
p4
Review from the Managing Partner
p13Financial review
p36
Financial review, risk and sustainability36 Financial review
45 Risk report
52 Sustainability
Governance and accounts55 Introduction to Governance
56 Leadership
62 Effectiveness
67 Relations with shareholders
68 Accountability
73 Remuneration
75 Directors’ statement
78 Independent auditor’s report to the members of 3i Infrastructure plc
84 Consolidated statement of comprehensive income
85 Consolidated statement of changes in equity
86 Consolidated balance sheet
87 Consolidated cash flow statement
87 Reconciliation of net cash flow to movement in net debt
88 Significant accounting policies
93 Notes to the accounts
108 Investment policy
109 Portfolio valuation methodology
110 Information for shareholders
Overview1 Performance highlights
2 Chairman’s statement
4 At a glance
6 Infrastructure market
7 Realisations
8 Our business model
10 Our objectives and strategic priorities
11 How we measure our performance and KPIs
Investment Adviser’s review13 Review from the Managing Partner
16 Investment activity
18 Investment advisory team – Profiles of senior members
20 Portfolio
21 Movements in portfolio value
Review of investments27 Infinis
28 Wireless Infrastructure Group (‘WIG’)
29 Oystercatcher
30 TCR
31 Cross London Trains (‘XLT’)
32 ESVAGT
33 Valorem
34 Projects portfolio
Inside this report
The Strategic report comprises pages 1–53

See contents inside flap
The Directors’ statement on pages 75 to 77 for 3i Infrastructure plc (‘3i Infrastructure’ or ‘the Company’) for the year to 31 March 2018 has been drawn up in reliance upon applicable English and Jersey law and the liabilities of the Company in connection with this statement shall be subject to the limitations and restrictions provided by such law. This Annual report contains statements about the future outlook for 3i Infrastructure. Although the Directors believe their expectations are based on reasonable assumptions, any statements about the future outlook may be influenced by factors that could cause actual outcomes and results to be materially different.
This report contains Alternative Performance Measures (‘APMs’), which are financial measures not defined in International Financial Reporting Standards. These include Total return on opening net asset value (‘NAV’), NAV per share, Total income and non-income cash, and Investment value including commitments. The definition of each of these measures is shown on page 43. The total return for the year shown in the Performance highlights is the total comprehensive income for the year under IFRS.
In addition to the APMs, the Annual report shows portfolio information including cash and other net assets held within intermediate unconsolidated holding companies. A reconciliation of this portfolio information to the information presented in the Consolidated financial statements is shown on page 44.
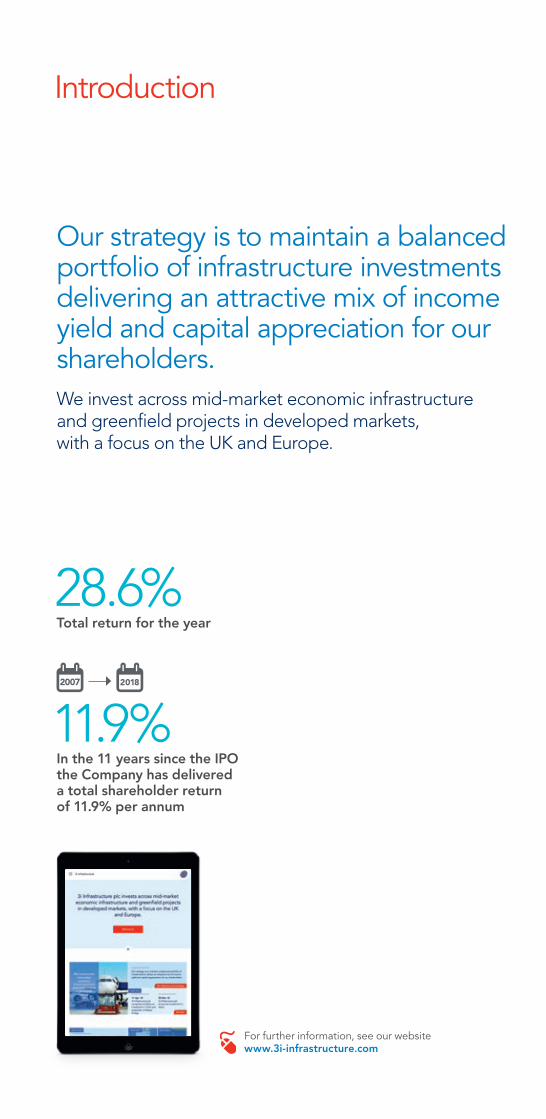
11.9%In the 11 years since the IPO the Company has delivered a total shareholder return of 11.9% per annum
For further information, see our website www.3i-infrastructure.com
Introduction
Our strategy is to maintain a balanced portfolio of infrastructure investments delivering an attractive mix of income yield and capital appreciation for our shareholders. We invest across mid-market economic infrastructure and greenfield projects in developed markets, with a focus on the UK and Europe.
28.6%Total return for the year
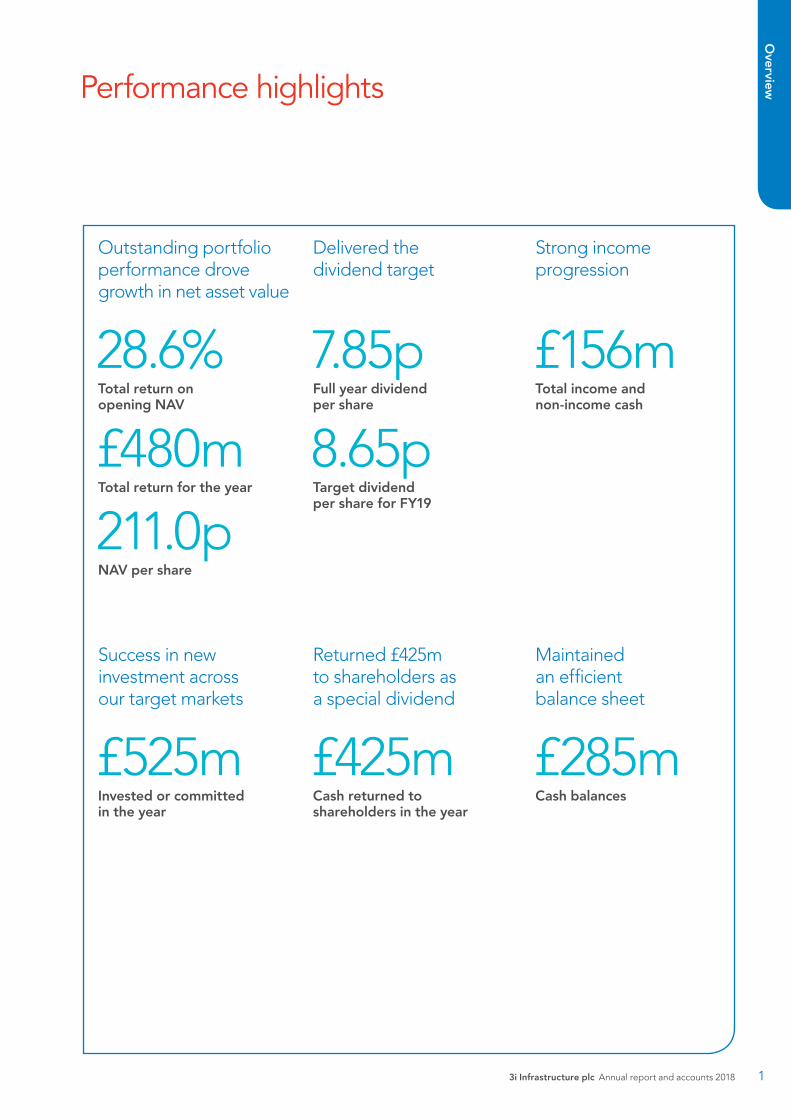
Performance highlights
Delivered the dividend target
Strong income progression
Returned £425m to shareholders as a special dividend
Maintained an efficient balance sheet
£285mCash balances
£425m Cash returned to shareholders in the year
28.6%Total return on opening NAV
£480mTotal return for the year
211.0pNAV per share
7.85pFull year dividend per share
8.65pTarget dividend per share for FY19
£156mTotal income and non-income cash
Outstanding portfolio performance drove growth in net asset value
Success in new investment across our target markets
£525mInvested or committed in the year
Overview
3i Infrastructure plc Annual report and accounts 2018 1

Chairman’s statement
3i Infrastructure provides its shareholders with a clear investment proposition, delivering an attractive mix of income yield and capital appreciation.
The Company exceeded its stated objectives with the highest total return in our history. During the year, the Investment Adviser actively managed the portfolio through well-managed sales, continued focus on diversification and engagement with management teams to achieve growth potential. The portfolio is well balanced and positioned to provide a sustainable mix of income yield and capital appreciation. I am grateful to the Board for their support during this busy year and to the Investment Adviser for its hard work to achieve this outperformance.
Richard LaingChairman, 3i Infrastructure plc10 May 2018
“The Company had an outstanding year. The realisations of our holdings in Elenia and Anglian Water Group generated exceptional value for shareholders.”
Overview
2
Performance The Company generated a total return of £480 million in the year ended 31 March 2018, or 28.6% on opening NAV (adjusted on a time weighted average basis for the return of cash to shareholders), far exceeding the target of 8% to 10% per annum to be achieved over the medium term. The NAV per share increased to 211.0 pence. We delivered a Total Shareholder Return (‘TSR’) of 11.8% in the year (FTSE 250: 5.3%). Since IPO, the Company’s annualised TSR was 11.9%, comparing favourably with the broader market (FTSE 250: 7.9% annualised over the same period). The Company has achieved this performance with relatively low share price volatility.
Portfolio activityThe Company sold its two largest assets at compelling prices after competitive processes run by the Investment Adviser. New investment commitments totalling £525 million were made in good businesses, through bilateral transactions, and follow-on investments in existing portfolio companies. The Investment Adviser’s review describes the investments made during the year, alongside portfolio developments, in more detail.
Special dividendA special dividend of £425 million was paid on 29 March 2018, giving to shareholders substantially all of the uplift on opening value of the stakes in Anglian Water Group (‘AWG’) and Elenia. This was consistent with our aim to minimise return dilution to shareholders by returning cash promptly, while retaining a good level of liquidity for future investment.
DividendFollowing the payment of the interim dividend of 3.925 pence per share in January 2018, the Board is recommending a final dividend for the year of 3.925 pence per
share, meeting our target for the year of 7.85 pence per share. We expect the final dividend to be paid on 9 July 2018. Consistent with our progressive dividend policy, we are announcing a total dividend target for the year ending 31 March 2019 of 8.65 pence per share, representing an exceptional year-on-year increase of 10%. This target rebases the dividend to a higher level aligned to the income generating potential of the portfolio. We expect this target dividend to be fully covered by income and non-income cash from our portfolio.
Corporate governanceWe have continued to monitor the development of tax changes recommended by the OECD’s Base Erosion and Profit Shifting (‘BEPS’) project. In June 2017, representatives from 68 countries and jurisdictions signed a Multilateral Instrument which provides a mechanism for amending tax treaties for several of the BEPS recommendations including those concerning prevention of treaty abuse. In order to mitigate the risk of tax leakage for the Company, the Board intends to move the tax domicile and management of the Company to the UK with effect from 1 October 2018. We are pursuing a project plan to achieve this, which includes an application to HMRC for UK approved investment trust status.
Steven Wilderspin stepped down as a non-executive Director on 31 December 2017. Steven had been a Board member since 20 September 2007 and was the Chairman of the Audit and Risk Committee. We are extremely grateful to Steven for his valuable contribution to the Board over the past 10 years. Wendy Dorman took over as Chairman of the Audit and Risk Committee with effect from 1 January 2018. Robert Jennings CBE was appointed as a non-executive Director on 1 February 2018. Robert brings an in-depth understanding of investing in infrastructure with over 20 years’ experience in the sector.
He is currently Chairman of Sequoia Economic Infrastructure Income Fund Limited and a non-executive director of Crossrail Limited and was, until February 2017, Chairman of Southern Water.
The Company’s Annual General Meeting (‘AGM’) was held on 6 July 2017. All resolutions were approved by shareholders, including the election and re-election of all Directors to the Board. This year’s AGM will be held on 5 July 2018. An Extraordinary General Meeting was held on 14 March 2018, at which shareholders approved all resolutions, including for a share consolidation of every 19 existing ordinary shares into 15 new ordinary shares which occurred on 15 March 2018. The share consolidation maintains comparability, as far as possible, of the Company’s share price before and after the payment of the special dividend.
OutlookFollowing the sales of Elenia and AWG, the Company’s portfolio now has a greater exposure to economic and competitive market factors than previously and, accordingly, we should expect more volatility within individual company performance. However, the portfolio is now more balanced, with five of the assets each representing between 10% and 20% of portfolio value, and is diversified across sectors and geographies. We remain confident in our business model and our ability to continue to deliver on our strategy and objectives.
Richard LaingChairman, 3i Infrastructure plc10 May 2018
Overview
3i Infrastructure plc Annual report and accounts 2018 3
At a glance
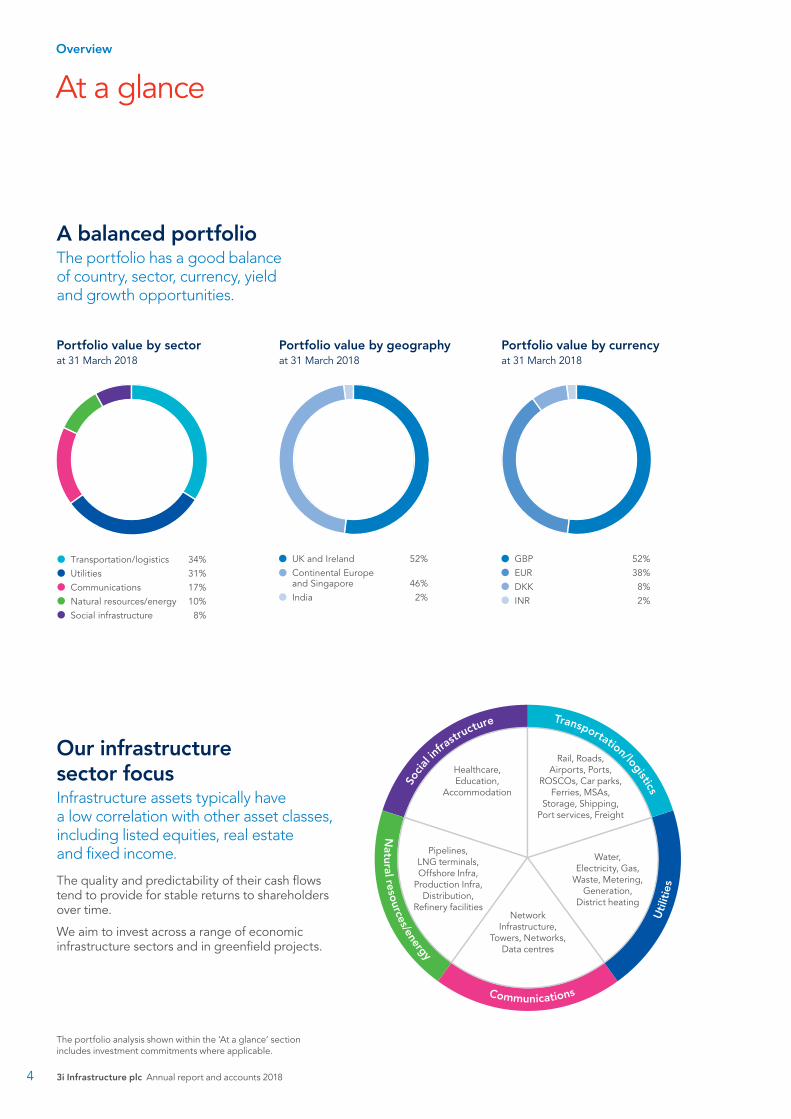
A balanced portfolioThe portfolio has a good balance of country, sector, currency, yield and growth opportunities.
The portfolio analysis shown within the ‘At a glance’ section includes investment commitments where applicable.
Our infrastructure sector focus Infrastructure assets typically have a low correlation with other asset classes, including listed equities, real estate and fixed income.
The quality and predictability of their cash flows tend to provide for stable returns to shareholders over time.
We aim to invest across a range of economic infrastructure sectors and in greenfield projects.
Portfolio value by geographyat 31 March 2018
Portfolio value by currencyat 31 March 2018
UK and Ireland 52%Continental Europe and Singapore 46%India 2%
GBP 52%EUR 38%DKK 8%INR 2%
Portfolio value by sectorat 31 March 2018
Transportation/logistics 34%Utilities 31%Communications 17%Natural resources/energy 10%Social infrastructure 8%
Healthcare, Education,
Accommodation
Rail, Roads, Airports, Ports,
ROSCOs, Car parks, Ferries, MSAs,
Storage, Shipping, Port services, Freight
Network Infrastructure,
Towers, Networks, Data centres
Water, Electricity, Gas,
Waste, Metering, Generation,
District heating
Pipelines, LNG terminals, Offshore Infra,
Production Infra, Distribution,
Refinery facilities
Overview
3i Infrastructure plc Annual report and accounts 20184
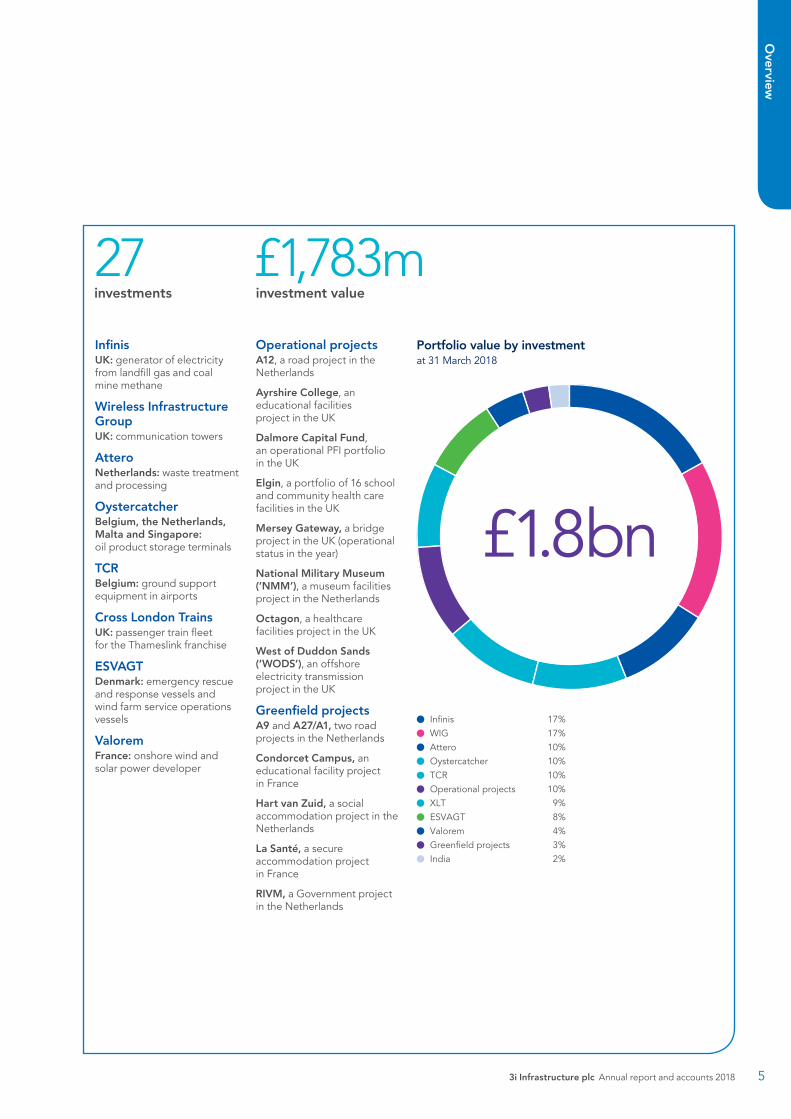
InfinisUK: generator of electricity from landfill gas and coal mine methane
Wireless Infrastructure GroupUK: communication towers
AtteroNetherlands: waste treatment and processing
OystercatcherBelgium, the Netherlands, Malta and Singapore: oil product storage terminals
TCRBelgium: ground support equipment in airports
Cross London TrainsUK: passenger train fleet for the Thameslink franchise
ESVAGTDenmark: emergency rescue and response vessels and wind farm service operations vessels
ValoremFrance: onshore wind and solar power developer
Operational projectsA12, a road project in the Netherlands
Ayrshire College, an educational facilities project in the UK
Dalmore Capital Fund, an operational PFI portfolio in the UK
Elgin, a portfolio of 16 school and community health care facilities in the UK
Mersey Gateway, a bridge project in the UK (operational status in the year)
National Military Museum (‘NMM’), a museum facilities project in the Netherlands
Octagon, a healthcare facilities project in the UK
West of Duddon Sands (‘WODS’), an offshore electricity transmission project in the UK
Greenfield projectsA9 and A27/A1, two road projects in the Netherlands
Condorcet Campus, an educational facility project in France
Hart van Zuid, a social accommodation project in the Netherlands
La Santé, a secure accommodation project in France
RIVM, a Government project in the Netherlands
27investments
£1,783minvestment value
Infinis 17%WIG 17%Attero 10%Oystercatcher 10%TCR 10%Operational projects 10%XLT 9%ESVAGT 8%Valorem 4%Greenfield projects 3%India 2%
Portfolio value by investmentat 31 March 2018
£1.8bn
Overview
3i Infrastructure plc Annual report and accounts 2018 5
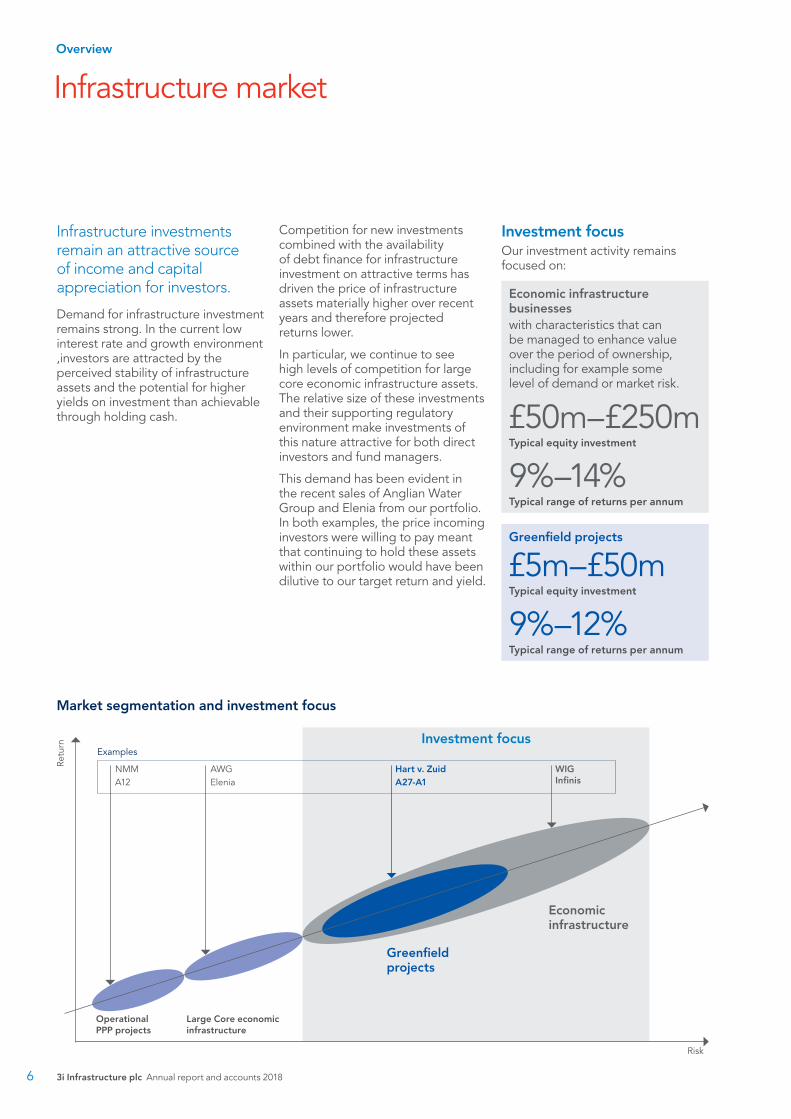
Infrastructure investments remain an attractive source of income and capital appreciation for investors.
Demand for infrastructure investment remains strong. In the current low interest rate and growth environment ,investors are attracted by the perceived stability of infrastructure assets and the potential for higher yields on investment than achievable through holding cash.
Competition for new investments combined with the availability of debt finance for infrastructure investment on attractive terms has driven the price of infrastructure assets materially higher over recent years and therefore projected returns lower.
In particular, we continue to see high levels of competition for large core economic infrastructure assets. The relative size of these investments and their supporting regulatory environment make investments of this nature attractive for both direct investors and fund managers.
This demand has been evident in the recent sales of Anglian Water Group and Elenia from our portfolio. In both examples, the price incoming investors were willing to pay meant that continuing to hold these assets within our portfolio would have been dilutive to our target return and yield.
Market segmentation and investment focus
Operational PPP projects
Large Core economic infrastructure
Investment focus
Greenfield projects
Economic infrastructure
Retu
rn
Risk
NMMA12
AWGElenia
Hart v. ZuidA27-A1
WIG Infinis
Examples
Infrastructure market
Greenfield projects
£5m–£50mTypical equity investment
9%–12%Typical range of returns per annum
Investment focusOur investment activity remains focused on:
Economic infrastructure businesses with characteristics that can be managed to enhance value over the period of ownership, including for example some level of demand or market risk.
£50m–£250mTypical equity investment
9%–14%Typical range of returns per annum
Overview
3i Infrastructure plc Annual report and accounts 20186
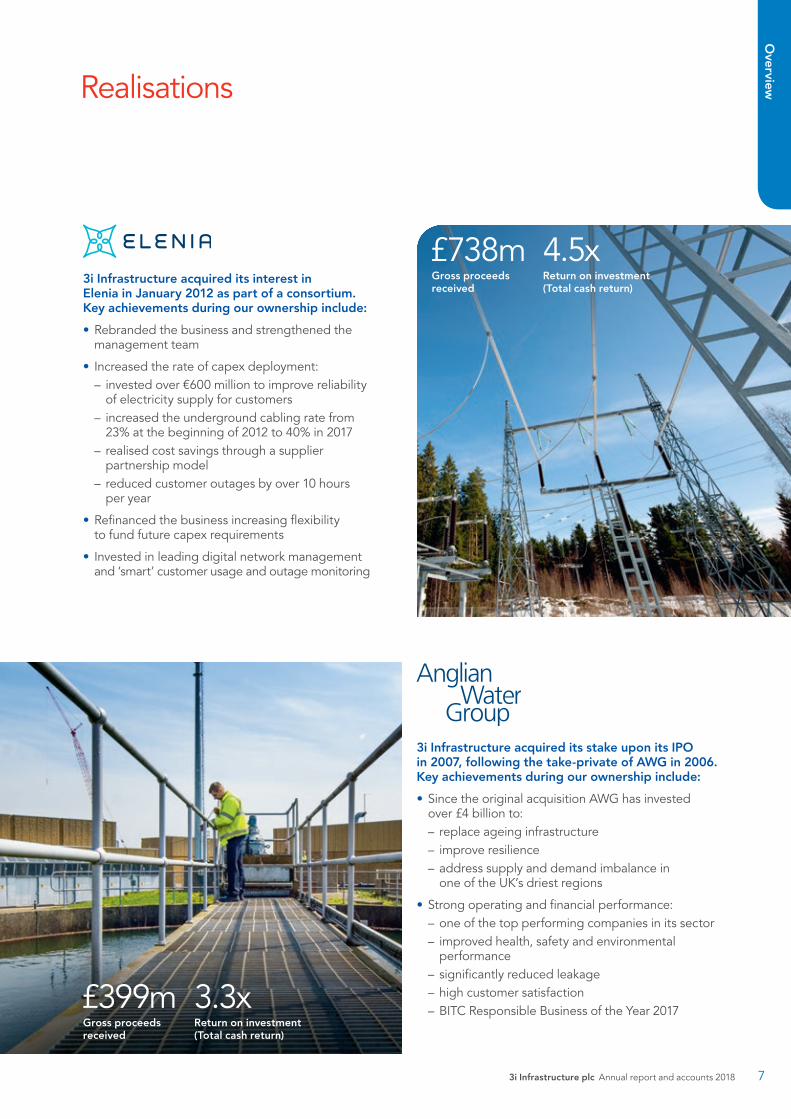
Realisations
3i Infrastructure acquired its stake upon its IPO in 2007, following the take-private of AWG in 2006. Key achievements during our ownership include:
• Since the original acquisition AWG has invested over £4 billion to: – replace ageing infrastructure – improve resilience – address supply and demand imbalance in one of the UK’s driest regions
• Strong operating and financial performance: – one of the top performing companies in its sector – improved health, safety and environmental performance
– significantly reduced leakage – high customer satisfaction – BITC Responsible Business of the Year 2017 £399m
Gross proceeds received
3.3xReturn on investment (Total cash return)
3i Infrastructure acquired its interest in Elenia in January 2012 as part of a consortium. Key achievements during our ownership include:
• Rebranded the business and strengthened the management team
• Increased the rate of capex deployment: – invested over €600 million to improve reliability of electricity supply for customers
– increased the underground cabling rate from 23% at the beginning of 2012 to 40% in 2017
– realised cost savings through a supplier partnership model
– reduced customer outages by over 10 hours per year
• Refinanced the business increasing flexibility to fund future capex requirements
• Invested in leading digital network management and ‘smart’ customer usage and outage monitoring
£738mGross proceeds received
4.5xReturn on investment (Total cash return)
Overview
3i Infrastructure plc Annual report and accounts 2018 7
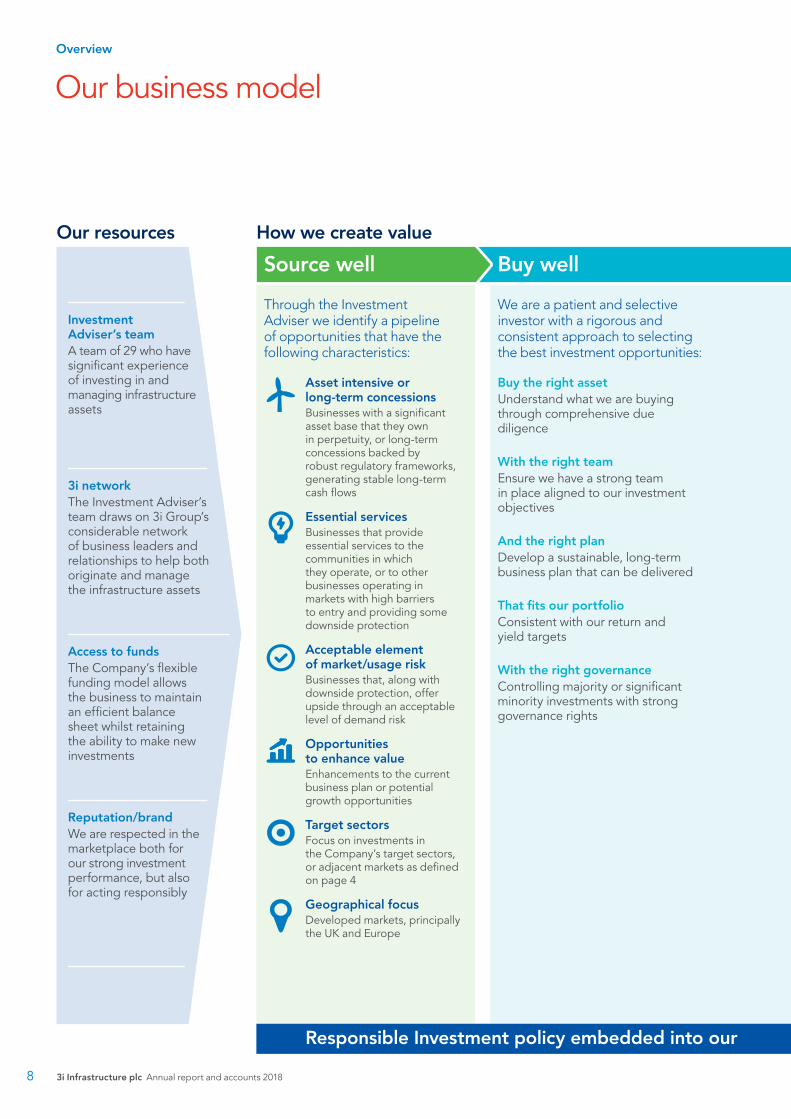
Through the Investment Adviser we identify a pipeline of opportunities that have the following characteristics:
Asset intensive or long-term concessionsBusinesses with a significant asset base that they own in perpetuity, or long-term concessions backed by robust regulatory frameworks, generating stable long-term cash flows
Essential servicesBusinesses that provide essential services to the communities in which they operate, or to other businesses operating in markets with high barriers to entry and providing some downside protection
Acceptable element of market/usage riskBusinesses that, along with downside protection, offer upside through an acceptable level of demand risk
Opportunities to enhance valueEnhancements to the current business plan or potential growth opportunities
Target sectorsFocus on investments in the Company’s target sectors, or adjacent markets as defined on page 4
Geographical focusDeveloped markets, principally the UK and Europe
Our business model
Our resources How we create value
Buy well
We are a patient and selective investor with a rigorous and consistent approach to selecting the best investment opportunities:
Buy the right assetUnderstand what we are buying through comprehensive due diligence
With the right teamEnsure we have a strong team in place aligned to our investment objectives
And the right planDevelop a sustainable, long-term business plan that can be delivered
That fits our portfolioConsistent with our return and yield targets
With the right governanceControlling majority or significant minority investments with strong governance rights
Source well
Responsible Investment policy embedded into our
Investment Adviser’s teamA team of 29 who have significant experience of investing in and managing infrastructure assets
3i networkThe Investment Adviser’s team draws on 3i Group’s considerable network of business leaders and relationships to help both originate and manage the infrastructure assets
Access to fundsThe Company’s flexible funding model allows the business to maintain an efficient balance sheet whilst retaining the ability to make new investments
Reputation/brandWe are respected in the marketplace both for our strong investment performance, but also for acting responsibly
Overview
3i Infrastructure plc Annual report and accounts 20188

Manage well
The Investment Adviser works closely with our portfolio companies to drive operational and financial performance to deliver the investment case.
Through an engaged asset management approach the Investment Adviser works with the management team to set the direction and strategic plan for the business.
This approach relies on a close partnership between the Investment Adviser and the management team. The Investment Adviser utilises a systematic, tailored approach to managing investments and has a proven track record of supporting management to deliver performance.
Our approach to asset management
Sale of assetsThe Company is a long-term holder of investments, with no fixed horizon for the sale of assets from its portfolio.
We will however consider selling investments when a sale would maximise value for our shareholders.
Responsible Investment policy embedded into our investment and portfolio monitoring processes
Engaged Asset
Management
Drive operational
performance
Consider follow on
investments/ M&A
opportunities
Best practice governance
and oversight
Define the strategic
direction
Implement an efficient
and appropriate capital
structure
Support and incentivise the management
team
Monitoring and performance
management
Delivered objectives
7.85pOrdinary dividend
41.4pSpecial dividend
28.6%Total return on opening net asset value for the year
19%Annualised asset IRR since IPO
Overview
3i Infrastructure plc Annual report and accounts 2018 9
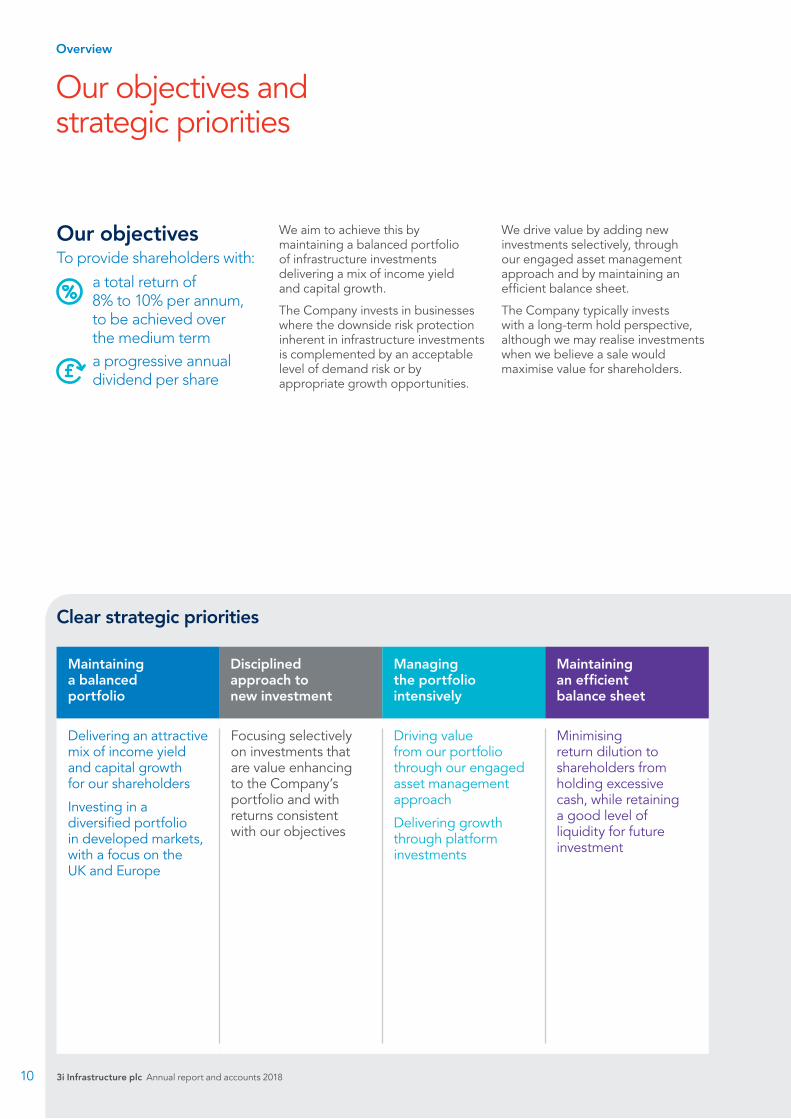
Our objectives and strategic priorities
We aim to achieve this by maintaining a balanced portfolio of infrastructure investments delivering a mix of income yield and capital growth.
The Company invests in businesses where the downside risk protection inherent in infrastructure investments is complemented by an acceptable level of demand risk or by appropriate growth opportunities.
We drive value by adding new investments selectively, through our engaged asset management approach and by maintaining an efficient balance sheet.
The Company typically invests with a long-term hold perspective, although we may realise investments when we believe a sale would maximise value for shareholders.
Clear strategic priorities
Delivering an attractive mix of income yield and capital growth for our shareholders
Investing in a diversified portfolio in developed markets, with a focus on the UK and Europe
Focusing selectively on investments that are value enhancing to the Company’s portfolio and with returns consistent with our objectives
Driving value from our portfolio through our engaged asset management approach
Delivering growth through platform investments
Minimising return dilution to shareholders from holding excessive cash, while retaining a good level of liquidity for future investment
Maintaining a balanced portfolio
Our objectivesTo provide shareholders with:
a total return of 8% to 10% per annum, to be achieved over the medium term a progressive annual dividend per share
Disciplined approach to new investment
Managing the portfolio intensively
Maintaining an efficient balance sheet
Overview
3i Infrastructure plc Annual report and accounts 201810
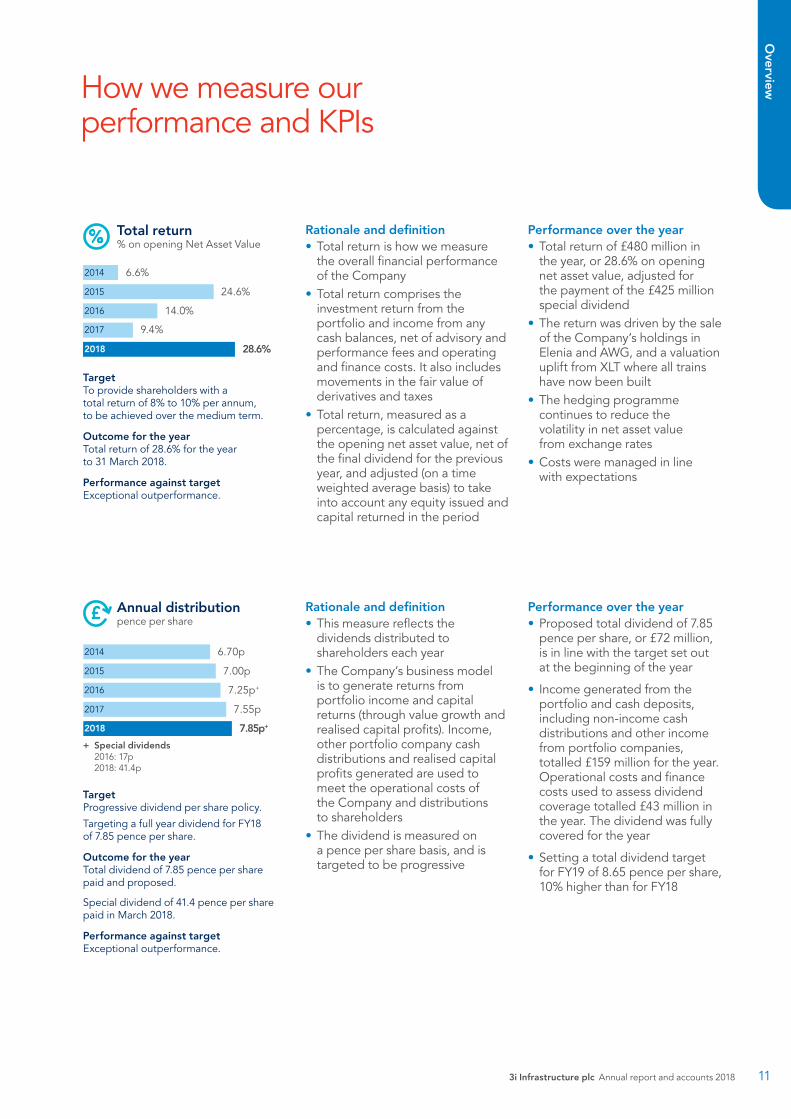
How we measure our performance and KPIs
Rationale and definition• Total return is how we measure
the overall financial performance of the Company
• Total return comprises the investment return from the portfolio and income from any cash balances, net of advisory and performance fees and operating and finance costs. It also includes movements in the fair value of derivatives and taxes
• Total return, measured as a percentage, is calculated against the opening net asset value, net of the final dividend for the previous year, and adjusted (on a time weighted average basis) to take into account any equity issued and capital returned in the period
Rationale and definition• This measure reflects the
dividends distributed to shareholders each year
• The Company’s business model is to generate returns from portfolio income and capital returns (through value growth and realised capital profits). Income, other portfolio company cash distributions and realised capital profits generated are used to meet the operational costs of the Company and distributions to shareholders
• The dividend is measured on a pence per share basis, and is targeted to be progressive
Performance over the year• Total return of £480 million in
the year, or 28.6% on opening net asset value, adjusted for the payment of the £425 million special dividend
• The return was driven by the sale of the Company’s holdings in Elenia and AWG, and a valuation uplift from XLT where all trains have now been built
• The hedging programme continues to reduce the volatility in net asset value from exchange rates
• Costs were managed in line with expectations
Performance over the year• Proposed total dividend of 7.85
pence per share, or £72 million, is in line with the target set out at the beginning of the year
• Income generated from the portfolio and cash deposits, including non-income cash distributions and other income from portfolio companies, totalled £159 million for the year. Operational costs and finance costs used to assess dividend coverage totalled £43 million in the year. The dividend was fully covered for the year
• Setting a total dividend target for FY19 of 8.65 pence per share, 10% higher than for FY18
TargetTo provide shareholders with a total return of 8% to 10% per annum, to be achieved over the medium term.
Outcome for the yearTotal return of 28.6% for the year to 31 March 2018.
Performance against targetExceptional outperformance.
+ Special dividends 2016: 17p 2018: 41.4p
TargetProgressive dividend per share policy.
Targeting a full year dividend for FY18 of 7.85 pence per share.
Outcome for the yearTotal dividend of 7.85 pence per share paid and proposed.
Special dividend of 41.4 pence per share paid in March 2018.
Performance against targetExceptional outperformance.
Total return% on opening Net Asset Value
Annual distributionpence per share
2014
2015
2016
2017
2018
6.6%
24.6%
14.0%
9.4%
28.6%
2014
2015
2016
2017
2018
6.70p
7.00p
7.25p+
7.55p
7.85p+
Overview
3i Infrastructure plc Annual report and accounts 2018 11
Investment Adviser’s review13 Review from the Managing Partner16 Investment activity18 Investment advisory team –
Profiles of senior members20 Portfolio21 Movements in portfolio value
Review from the Managing Partner
“It was a very strong year for the Company – excellent realisations, a high level of new investment, good performance from the portfolio, and a special dividend for shareholders.”
Phil WhiteManaging Partner, Infrastructure, 3i Investments plc10 May 2018
Investment A
dviser’s review
13
RealisationsThis year we sold our two largest investments. We had held our stake in Anglian Water since our IPO in 2007 and we are proud of the development of that business in our period of ownership. As well as delivering a good return for its shareholders in that time, Anglian Water provides excellent service to its customers, ranking very highly in OFWAT’s customer service metrics, and has taken great strides in reducing leakage to record low levels and in improving its environmental and health and safety performance. However, dividends had shrunk in the current regulatory period and we did not see this improving, while the intense political and media scrutiny on the broader sector meant that future returns were unlikely to meet the Company’s objectives. Despite that backdrop, we were successful in running a tight sale process which produced attractive offers, and we secured for the Company what we regard as an excellent outcome representing an annualised return of 16%.
Our investment in Elenia was realised at a truly exceptional annualised return of 31%. Elenia is a great company, leading its sector in Finland and prioritising investment in improving the reliability of electricity supply to its customers by burying cables underground where they are much less susceptible to severe weather. In our six years of ownership, capital expenditure of over €600 million helped reduce power outages by over 10 hours per customer. We worked very closely with the management team, our co-shareholders and advisers to prepare detailed plans for the sale process, while keeping open the option for the Company to retain its stake if offers received were not compelling value.
The process attracted offers from bidders across four continents, and this strong competitive dynamic coupled with excellent execution, secured a binding offer at a price we consider to be outstanding.
These two realisations, combined with sales achieved in previous years and the continued good performance of the current portfolio, have increased the asset IRR for the Company since IPO to 19% per annum.
Portfolio reviewWe have a large and diversified investment portfolio across sector, geography and investment maturity. We are engaged investors and work closely with our management teams to define their strategic direction and business plans, implement efficient and prudent capital structures, drive operational performance and support continued investment in their asset bases.
At Infinis, alongside the acquisition of Alkane Energy, we strengthened the board, appointing Tony Cocker (former CEO of E.ON UK) as Chairman and Scott Longhurst (Group Finance Director at AWG) as non-executive director and Chairman of the Audit Committee. We have also provided a further £12 million of equity investment to fund the development of alternative uses for surplus grid connection and engine capacity.
All of the 115 trains in the XLT fleet have been manufactured, and over 100 of these have now completed the testing and acceptance process. The performance of the trains is ahead of plan and remains on a positive trajectory.
We supported the expansion of TCR’s footprint across Europe (notably Italy and Germany), continued to build its presence in Malaysia through new contract wins and seen TCR’s entry into the Australian market through the acquisition of a leading local repair and maintenance business. We appointed Declan Collier, the former CEO of London City Airport, as a non-executive director.
At WIG, we continue to support management’s growth plans. In September, WIG launched the UK’s first 5G-ready, fibre-connected, outdoor small cell network in Aberdeen, working in partnership with Telefonica.
We refinanced debt facilities at ESVAGT and Oystercatcher, lengthening the maturity of the facilities and providing a natural hedge for Singapore dollar exposure in Oystercatcher. Valorem refinanced its operational portfolio with a long-term facility.
The Investment Adviser continues to work with the Company’s portfolio companies to assess new investment and capital expenditure programmes, as well as value accretive acquisitions.
Review from the Managing Partner continued
Investment Adviser’s review
3i Infrastructure plc Annual report and accounts 201814
Investment activityThis year we have sustained the high level of new investment seen in the previous year, deploying a material proportion of the proceeds from the divestments of Elenia and AWG. We continue to target attractive risk-adjusted returns in mid-market economic infrastructure businesses as well as greenfield projects. Where possible, we seek to secure investments on a bilateral basis, developing a robust and aligned investment case with management and minimising the transaction costs for the Company.
Total new investment commitments in the year of £525 million were:• £190 million to increase our
ownership share in WIG, the independent communications infrastructure provider. The Company now owns 93%, alongside management;
• £136 million into Infinis to fund the acquisition of Alkane Energy, a business generating power from coal mine methane gas, and to support the development of alternative uses for spare engines and grid connections;
• £176 million committed to acquire 50% of Attero, a leading waste processing business based in the Netherlands; and
• £23 million aggregate investment into ESVAGT and Oystercatcher to support further growth of those businesses.
These new investments have added further diversification to the Company’s portfolio, which is now much better balanced by size of investment, and has exposure to a range of countries, sectors and risk factors. While exposure to regulatory outcomes has been reduced, there is now increased potential volatility from market factors, including commodity prices and GDP growth. Overall, we believe that the portfolio is well-positioned to meet the Company’s return and dividend targets over the medium term.
OutlookThe Company has delivered very strong returns during the year, driven largely from the divestments of its two largest assets but underpinned by the continued performance of the broader portfolio.
We are continuing to see significant levels of competition for high quality infrastructure businesses in the UK and across Europe. The demand for large ‘core’ infrastructure assets was demonstrated by the prices we were able to achieve for AWG and Elenia, and we see this persisting in the medium term. Our investment focus remains on areas of the infrastructure market which offer more attractive risk-adjusted returns, in mid-market economic infrastructure businesses and greenfield projects. The new investments completed by the Company in the year demonstrate our ability to continue to access attractive investments in our target markets, including through existing portfolio company platforms.
As our new team in North America invests, we will work with the Board to evaluate the suitability for the Company of broadening its geographic focus to include that market.
We continue to see a good flow of new investment opportunities, but we remain disciplined to invest selectively and focused on maintaining a balanced and attractive portfolio for shareholders.
About the Investment Adviser3i Investments plc (‘3i Investments’), a wholly-owned subsidiary of 3i Group plc (‘3i Group’), acts as the investment adviser (the ‘Investment Adviser’) to the Company.
The Investment Adviser has added further to the team during the year, which now comprises around 50 people covering origination, execution, asset management and support functions. The team is based in London and Paris and also draws on 3i Group’s broader network of offices. The team provides advice to the Company on the origination and execution of new investments, on the management of the portfolio and on realisations, as well as on funding requirements.
Phil WhiteManaging Partner, Infrastructure 3i Investments plc10 May 2018
£190minvestment to acquire the majority of WIG
115trains manufactured for the XLT fleet
6new investments and commitments during the year
Investment A
dviser’s review
3i Infrastructure plc Annual report and accounts 2018 15
Investment activity
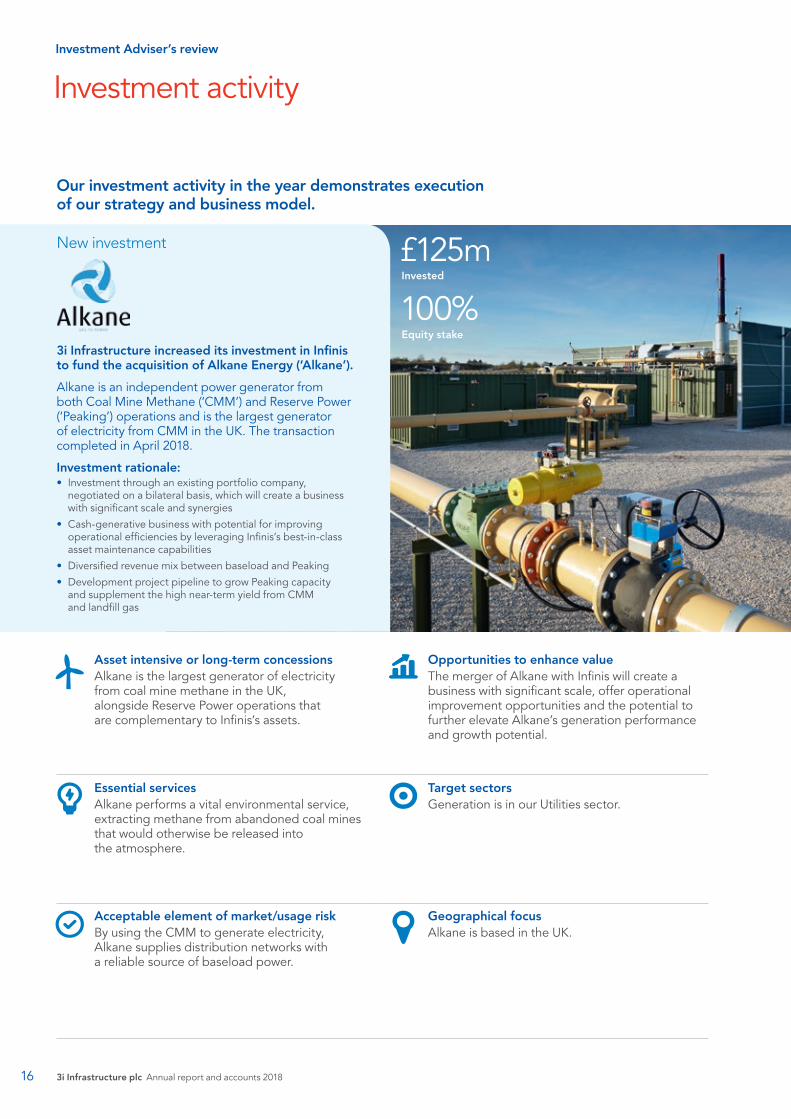
Our investment activity in the year demonstrates execution of our strategy and business model.
Asset intensive or long-term concessionsAlkane is the largest generator of electricity from coal mine methane in the UK, alongside Reserve Power operations that are complementary to Infinis’s assets.
Opportunities to enhance valueThe merger of Alkane with Infinis will create a business with significant scale, offer operational improvement opportunities and the potential to further elevate Alkane’s generation performance and growth potential.
Essential servicesAlkane performs a vital environmental service, extracting methane from abandoned coal mines that would otherwise be released into the atmosphere.
Target sectorsGeneration is in our Utilities sector.
Acceptable element of market/usage riskBy using the CMM to generate electricity, Alkane supplies distribution networks with a reliable source of baseload power.
Geographical focusAlkane is based in the UK.
£125mInvested
100%Equity stake
New investment
3i Infrastructure increased its investment in Infinis to fund the acquisition of Alkane Energy (‘Alkane’).
Alkane is an independent power generator from both Coal Mine Methane (‘CMM’) and Reserve Power (‘Peaking’) operations and is the largest generator of electricity from CMM in the UK. The transaction completed in April 2018.
Investment rationale:• Investment through an existing portfolio company,
negotiated on a bilateral basis, which will create a business with significant scale and synergies
• Cash-generative business with potential for improving operational efficiencies by leveraging Infinis’s best-in-class asset maintenance capabilities
• Diversified revenue mix between baseload and Peaking
• Development project pipeline to grow Peaking capacity and supplement the high near-term yield from CMM and landfill gas
Investment Adviser’s review
3i Infrastructure plc Annual report and accounts 201816
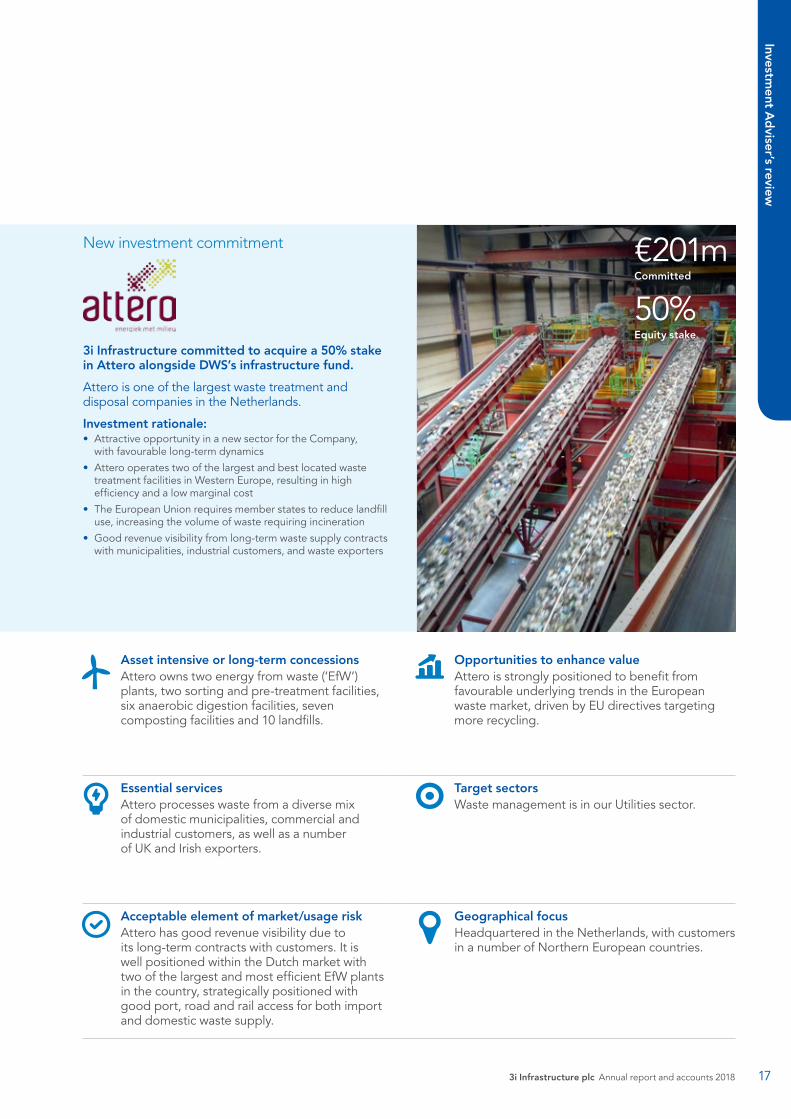
New investment commitment
3i Infrastructure committed to acquire a 50% stake in Attero alongside DWS’s infrastructure fund.
Attero is one of the largest waste treatment and disposal companies in the Netherlands.
Investment rationale:• Attractive opportunity in a new sector for the Company,
with favourable long-term dynamics
• Attero operates two of the largest and best located waste treatment facilities in Western Europe, resulting in high efficiency and a low marginal cost
• The European Union requires member states to reduce landfill use, increasing the volume of waste requiring incineration
• Good revenue visibility from long-term waste supply contracts with municipalities, industrial customers, and waste exporters
Asset intensive or long-term concessionsAttero owns two energy from waste (‘EfW’) plants, two sorting and pre-treatment facilities, six anaerobic digestion facilities, seven composting facilities and 10 landfills.
Opportunities to enhance valueAttero is strongly positioned to benefit from favourable underlying trends in the European waste market, driven by EU directives targeting more recycling.
Essential servicesAttero processes waste from a diverse mix of domestic municipalities, commercial and industrial customers, as well as a number of UK and Irish exporters.
Target sectorsWaste management is in our Utilities sector.
Acceptable element of market/usage riskAttero has good revenue visibility due to its long-term contracts with customers. It is well positioned within the Dutch market with two of the largest and most efficient EfW plants in the country, strategically positioned with good port, road and rail access for both import and domestic waste supply.
Geographical focusHeadquartered in the Netherlands, with customers in a number of Northern European countries.
€201mCommitted
50%Equity stake
Investment A
dviser’s review
3i Infrastructure plc Annual report and accounts 2018 17

Investment advisory teamProfiles of senior members
Phil joined 3i in 2007 and is Managing Partner and Head of 3i’s Infrastructure business and a member of 3i’s Executive Committee, Investment Committee and Group Risk Committee.
Prior to joining 3i, he was Division Director in Macquarie’s Infrastructure Funds business, where he managed investments in the transport sector.
Phil has over 20 years of infrastructure investment, advisory and finance experience from earlier roles at Barclays and WestLB.
Phil is a director of Wireless Infrastructure Group.
James is Chief Financial Officer of 3i’s Infrastructure business and joined in January 2016.
He manages the operational, financial and reporting requirements for the Infrastructure business within 3i Group, as well as performing CFO duties for 3i Infrastructure.
Prior to joining 3i, James was with Legal & General Investment Management, where he held a number of senior finance roles, including Finance Director of LGV Capital from 2007 to 2015.
John is a Partner in 3i’s Infrastructure team in London and joined 3i in November 2013.
John leads the portfolio management activity for the projects portfolio and is responsible for: setting the strategy for asset management activities; overseeing implementation of value protection and enhancement activities; and overseeing performance reporting.
He works closely with investee company non-executive directors and Infrastructure Managers Limited, the business’s main SPV management services provider.
Previously, John was a director at Barclays Infrastructure Funds Management Limited (‘BIFM’), St Modwen Properties plc, Land Securities Trillium and Vinci Investments, where he led PPP/PFI bidding activity.
John holds board positions at Cross London Trains and Wireless Infrastructure Group.
John CavillPartner
Stéphane is a Partner in 3i’s Infrastructure team in Paris and joined 3i in November 2013.
Stéphane leads 3i’s infrastructure business in France and is responsible for origination and execution of investment opportunities in projects across Europe. Stéphane joined 3i from BIFM where he was a director and prior to this was head of Egis Investment Partners.
Stéphane led the investment in Valorem and sits on the Board.
Stéphane GrandguillaumePartner
Phil WhiteManaging Partner
James DawesCFO
Investment Adviser’s review
3i Infrastructure plc Annual report and accounts 201818
Nigel is a Partner in 3i’s Infrastructure team in London and joined 3i in November 2013.
Nigel is involved in investment appraisal and management of investments in infrastructure projects in various funds managed by 3i. In the early 2000’s he led the formation and management of Infrastructure Investors (‘I2’), a pioneering secondary market infrastructure fund established as a joint venture between Barclays, Société Générale and 3i Group. He established, and continues to manage BIIF, a long-term “buy and hold” PPP fund which acquired I2 in 2009.
Previously, Nigel was a Managing Partner at BIFM and prior to that, head of PFI/PPP Advisory Services at PwC and worked at HM Treasury.
Scott joined 3i in 2007 and is a Partner in the Infrastructure team, and with Bernardo leads the team’s new investment origination and execution platform.
He has 15 years’ experience in European infrastructure, spanning utilities, transportation and social infrastructure.
Scott led the investments in Elenia, Cross London Trains and ESVAGT, as well as being a senior deal team member on Eversholt. He led the successful divestment of Elenia. He was also responsible for the successfully exited junior debt investments in Arqiva, Associated British Ports, Télédiffusion de France, Thames Water and Viridian.
He is currently a director on the boards of ESVAGT and Cross London Trains.
Bernardo is a Partner in 3i’s Infrastructure team in London and joined 3i in October 2015, and with Scott leads the team’s new investment origination and execution platform.
He was a senior deal team member on the recent investments by 3i Infrastructure in TCR, Infinis, Attero and Alkane Energy.
Bernardo was most recently a Partner at Antin Infrastructure, which manages funds investing in infrastructure opportunities across Europe.
Prior to Antin, Bernardo was Managing Director, Head of Acquisitions for Deutsche Bank’s European infrastructure fund. His prior experience was in utilities, as Head of M&A at Energias de Portugal, and in infrastructure advisory with UBS and Citigroup.
Bernardo holds a board position at TCR.
Bernardo SottomayorPartner
Nigel MiddletonPartner
Scott MoseleyPartner
Investment A
dviser’s review
3i Infrastructure plc Annual report and accounts 2018 19

Table 1 summarises the valuation and movements in the portfolio, as well as the return for each investment, for the year. In accordance with accounting standards, ‘Investments at fair value through profit or loss’ as reported in the Consolidated balance sheet includes, in addition to the portfolio asset valuation, the cash and other net assets held within intermediate unconsolidated holding companies. These amounts are set out at the foot of the table below, to provide a reconciliation between the Directors’ valuation of the portfolio assets and ‘Investments at fair value through profit or loss’ reported in the Consolidated financial statements. The basis of the portfolio information set out below is consistent with analyses in previous periods.
Table 1: Portfolio summary (31 March 2018, £m)
Portfolio assets
Directors’ valuation 31 March
2017Investment in the year
Divestment in the year
Value movement
Foreign exchange
translation
Directors’ valuation 31 March
2018
Allocated foreign
exchange hedging
Underlying portfolio
income in the year
Asset total return in the year6
Economic infrastructure businesses
Elenia 413.1 – (777.3)1 350.4 13.8 – (17.4) 15.8 362.6
AWG 280.8 – (398.4)1 117.6 – – – 7.5 125.1
Infinis 183.7 136.5 (10.5)1 1.0 – 310.7 – 12.0 13.0
WIG 78.4 193.72 – 28.3 – 300.4 – 7.3 35.6
Oystercatcher 203.3 2.3 – (17.6) (6.7) 181.3 6.0 15.9 (2.4)
TCR 164.1 4.72 – 7.5 3.2 179.5 (2.6) 11.1 19.2
XLT 125.6 – – 40.7 – 166.3 – 4.8 45.5
ESVAGT 112.7 47.52 – (11.2) 0.1 149.1 (0.1) 12.9 1.7
Valorem 50.0 – – 3.5 1.3 54.8 (1.6) 2.2 5.4
1,611.7 384.7 (1,186.2) 520.2 11.7 1,342.1 (15.7) 89.5 605.7
Projects
Greenfield projects3 0.1 – – – – 0.1 – – –
Operational projects
Elgin 48.7 – (0.2)1 (0.1) – 48.4 – 3.4 3.3
Octagon 45.6 – – 1.8 – 47.4 – 2.3 4.1
WODS 21.8 0.62 – (0.6) – 21.8 – 1.8 1.2
Dalmore 17.6 – (0.2)1 1.2 – 18.6 – 0.7 1.9
Mersey Gateway – 13.14 – (0.6) – 12.5 – 0.5 (0.1)
NMM 8.5 – – (1.2) 0.2 7.5 (0.3) 0.8 (0.5)
A12 6.0 – (0.1)1 (0.3) 0.2 5.8 (0.2) 0.6 0.3
Ayrshire College 5.0 0.12 – (0.2) – 4.9 – 0.5 0.3
153.3 13.8 (0.5) 0.0 0.4 167.0 (0.5) 10.6 10.5
India Fund
3i India Infrastructure Fund 40.9 – (1.1) 1.9 (4.9) 36.8 – – (3.0)
Total portfolio 1,805.9 398.5 (1,187.8) 522.1 7.2 1,545.9 (16.2) 100.1 613.2
Adjustments related to unconsolidated subsidiaries5 9.7 – (0.6) (2.7) – 6.4 1.5 (5.9) (7.1)
Reported in the Consolidated financial statements 1,815.6 398.5 (1,188.4) 526.6 – 1,552.3 (14.7) 94.2 606.1
1 Includes shareholder loan repaid in the year.2 Includes capitalised income.3 Investments in A9, La Santé, RIVM, Condorcet Campus, Hart van Zuid and A27/A1 greenfield projects.4 Drawdown of commitment in September 2017. The bridge opened to traffic on 14 October 2017 and is shown as operational in this report.5 Income statement adjustments explained in Table 8 and Balance sheet adjustments explained in Table 9 in the Financial review. The value movement
in unconsolidated subsidiaries includes a provision for the loss of value of £1.8 million for the A9 project from draft tax legislation in the Netherlands resulting from BEPS.
6 This comprises the aggregate of value movement, foreign exchange translation, allocated foreign exchange hedging and underlying portfolio income in the year.
PortfolioInvestment Adviser’s review
3i Infrastructure plc Annual report and accounts 201820

The movement in portfolio value was driven principally by the realisation of the Company’s holdings in Elenia and AWG for prices considerably above their opening valuation, and by new investments during the year, as well as by good value growth in the remaining portfolio. A reconciliation of the movement in portfolio value is shown in Chart 1. The portfolio summary shown in Table 1 shows the analysis of these movements by asset. Changes to portfolio valuations arise due to several factors, as shown in Table 2.
Economic infrastructure portfolioThe economic infrastructure portfolio generated a value gain of £520.2 million in the year (or £531.9 million including exchange movements). A large part of this was from the uplift in value achieved on the sales of Elenia and AWG.
Infinis increased in value, driven by follow-on investments totalling £136.5 million to fund the acquisition of Alkane and to support growth projects.
WIG increased in value from the further investment of £193.7 million, including capitalised interest of £3.6 million, to acquire a further stake in the business, bringing our equity ownership up to 93%.
Oystercatcher declined in value during the year. The five terminals continue to perform well both operationally and financially, with capacity substantially let and a good level of throughput. However, we have taken into account the softening of demand for gasoil storage experienced in the Amsterdam and Ghent terminals and for fuel oil storage in Singapore. The valuation of Oystercatcher is exposed to the euro and Singapore dollar exchange rate, and the value loss included negative currency movements in the year. The euro and Singapore dollar exposures are partially hedged, as described in Chart 2. We have refinanced the Oystercatcher debt, which is now all fixed-rate and long-dated. This benefited the valuation.
Movements in portfolio value
2,100
2,500
1,700
1,300
900
500Value movement
Exchangemovement2
Total: 529.3
7.2
Opening portfolio value at 1 April 2017
1,805.9
1,545.9
Closing portfolio value at 31 March2018
Divestment/capital repaid
(1,187.8)
Investment1
398.5
522.1
Chart 1: Reconciliation of the movement in portfolio value (for the year to 31 March 2018, £m)
1 Excludes investment commitments.2 Excludes movement in the foreign exchange hedging programme (see Chart 2).
Investment A
dviser’s review
3i Infrastructure plc Annual report and accounts 2018 21
TCR increased in value in the year, reflecting continued growth of the business.
XLT increased in value by 32% over the year. The discount rate has been reduced following the completion of the manufacturing programme and the delivery and acceptance of over 100 trains out of the 115 total fleet as at 31 March 2018 and the corresponding reduction in risk in the project.
ESVAGT increased in value after an investment of £47.5 million, including capitalised interest of £26.8 million, to support the development of the offshore wind pipeline. After a difficult start to the year, the market conditions in which ESVAGT operates are gradually improving. The oil price has increased from recent lows and emergency rescue and response vessel market supply dynamics are improving. In addition, ESVAGT is continuing to make good progress in the offshore wind segment. We refinanced the business, extending the term of the debt and benefiting the valuation.
Valorem increased in value in the year as the business continued to develop its pipeline of projects into operation and completed a refinancing of the portfolio.
Projects portfolioThe projects portfolio increased in value, reflecting the investment of £13.1 million in the Mersey Gateway project which reached operational status in the year.
3i India Infrastructure FundThe 3i India Infrastructure Fund (the ‘India Fund’) declined in value after exchange losses of £4.9 million as the Indian rupee weakened against sterling in the year, as shown in Chart 2. We have achieved a partial sale of the KMC roads portfolio within the India Fund and are pursuing exits for the remaining assets.
Movements in portfolio value continued
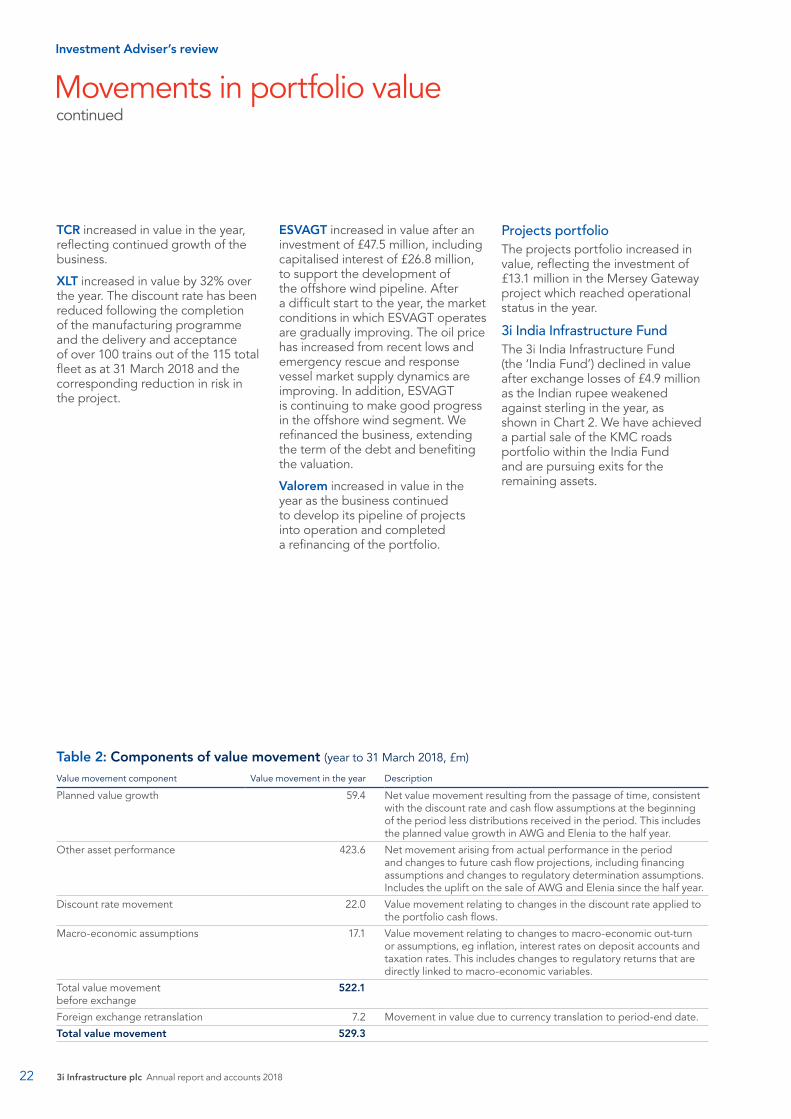
Table 2: Components of value movement (year to 31 March 2018, £m) Value movement component Value movement in the year Description
Planned value growth 59.4 Net value movement resulting from the passage of time, consistent with the discount rate and cash flow assumptions at the beginning of the period less distributions received in the period. This includes the planned value growth in AWG and Elenia to the half year.
Other asset performance 423.6 Net movement arising from actual performance in the period and changes to future cash flow projections, including financing assumptions and changes to regulatory determination assumptions. Includes the uplift on the sale of AWG and Elenia since the half year.
Discount rate movement 22.0 Value movement relating to changes in the discount rate applied to the portfolio cash flows.
Macro-economic assumptions 17.1 Value movement relating to changes to macro-economic out-turn or assumptions, eg inflation, interest rates on deposit accounts and taxation rates. This includes changes to regulatory returns that are directly linked to macro-economic variables.
Total value movement before exchange
522.1
Foreign exchange retranslation 7.2 Movement in value due to currency translation to period-end date.
Total value movement 529.3
Investment Adviser’s review
3i Infrastructure plc Annual report and accounts 201822
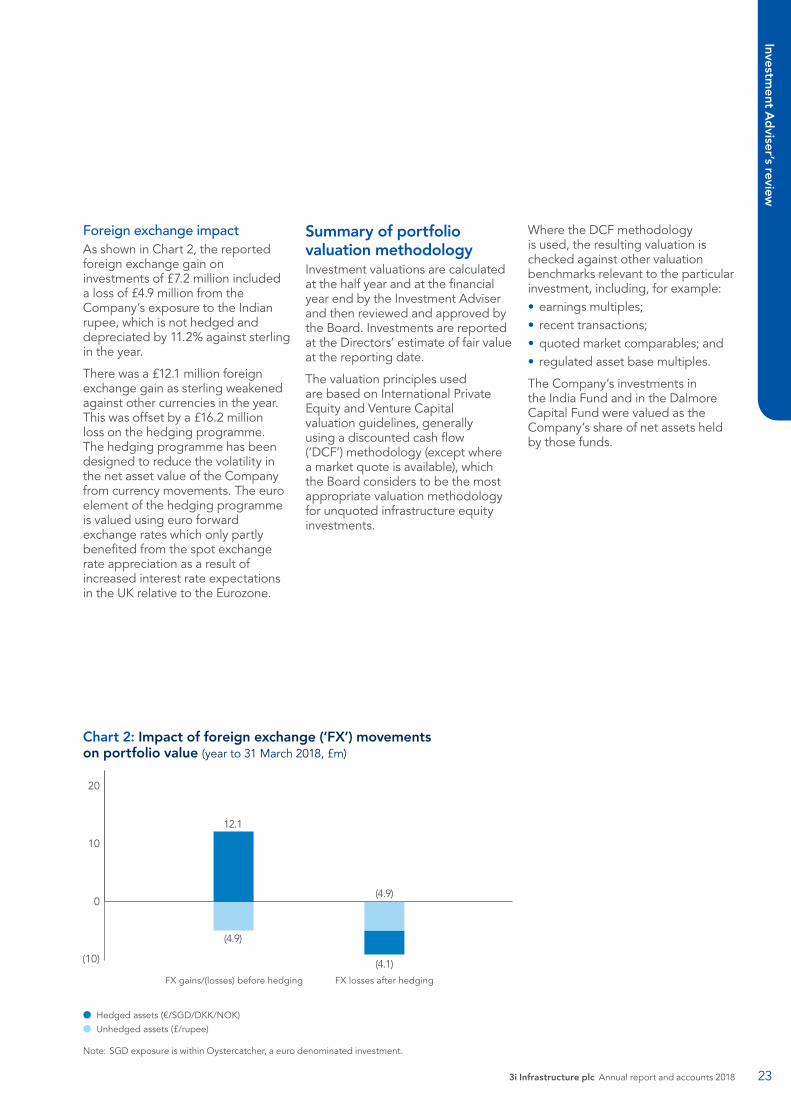
Foreign exchange impact As shown in Chart 2, the reported foreign exchange gain on investments of £7.2 million included a loss of £4.9 million from the Company’s exposure to the Indian rupee, which is not hedged and depreciated by 11.2% against sterling in the year.
There was a £12.1 million foreign exchange gain as sterling weakened against other currencies in the year. This was offset by a £16.2 million loss on the hedging programme. The hedging programme has been designed to reduce the volatility in the net asset value of the Company from currency movements. The euro element of the hedging programme is valued using euro forward exchange rates which only partly benefited from the spot exchange rate appreciation as a result of increased interest rate expectations in the UK relative to the Eurozone.
Summary of portfolio valuation methodologyInvestment valuations are calculated at the half year and at the financial year end by the Investment Adviser and then reviewed and approved by the Board. Investments are reported at the Directors’ estimate of fair value at the reporting date.
The valuation principles used are based on International Private Equity and Venture Capital valuation guidelines, generally using a discounted cash flow (‘DCF’) methodology (except where a market quote is available), which the Board considers to be the most appropriate valuation methodology for unquoted infrastructure equity investments.
Where the DCF methodology is used, the resulting valuation is checked against other valuation benchmarks relevant to the particular investment, including, for example:• earnings multiples;• recent transactions;• quoted market comparables; and• regulated asset base multiples.
The Company’s investments in the India Fund and in the Dalmore Capital Fund were valued as the Company’s share of net assets held by those funds.
10
20
0
(10)
FX gains/(losses) before hedging
12.1
(4.9)
(4.9)
(4.1)FX losses after hedging
Hedged assets (€/SGD/DKK/NOK)Unhedged assets (£/rupee)
Note: SGD exposure is within Oystercatcher, a euro denominated investment.
Chart 2: Impact of foreign exchange (‘FX’) movements on portfolio value (year to 31 March 2018, £m)
Investment A
dviser’s review
3i Infrastructure plc Annual report and accounts 2018 23
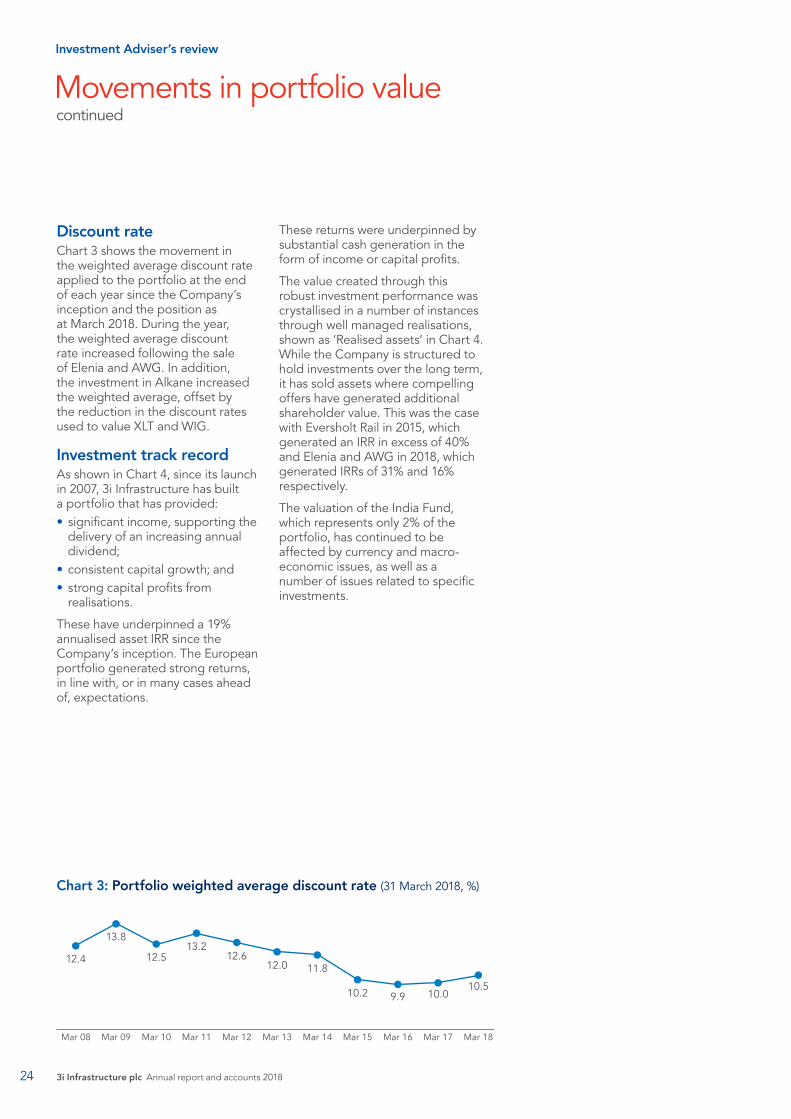
Discount rate Chart 3 shows the movement in the weighted average discount rate applied to the portfolio at the end of each year since the Company’s inception and the position as at March 2018. During the year, the weighted average discount rate increased following the sale of Elenia and AWG. In addition, the investment in Alkane increased the weighted average, offset by the reduction in the discount rates used to value XLT and WIG.
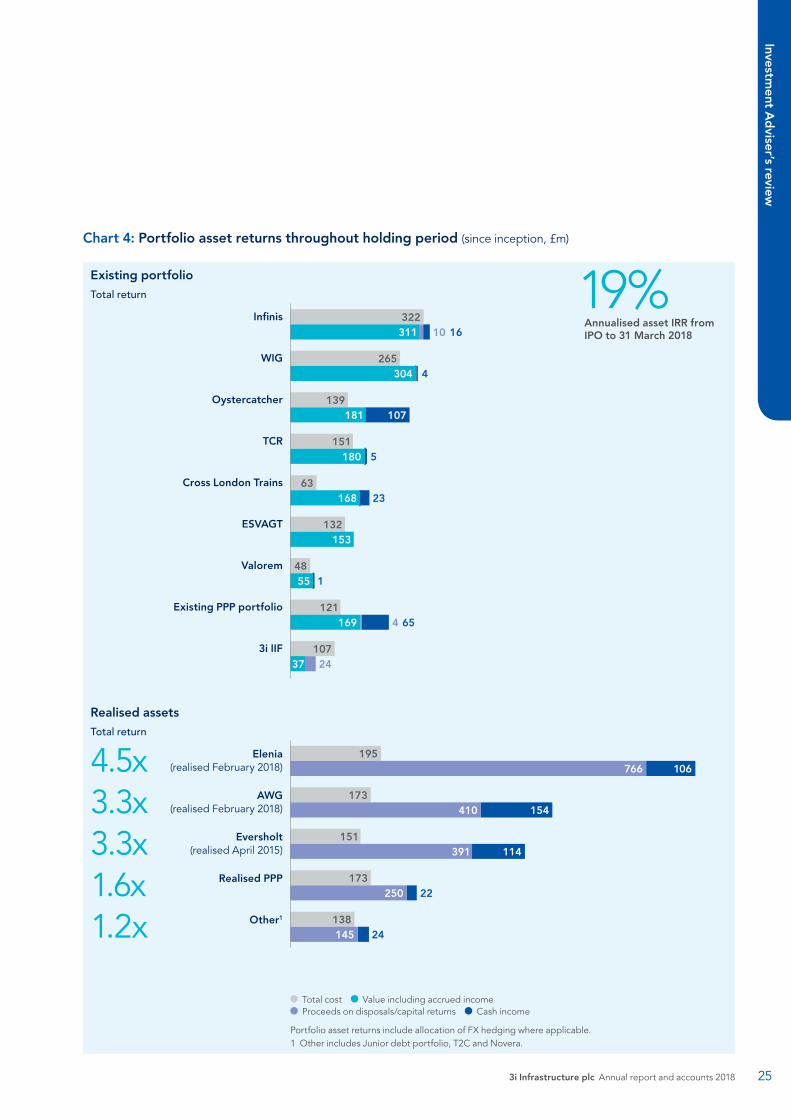
Investment track recordAs shown in Chart 4, since its launch in 2007, 3i Infrastructure has built a portfolio that has provided: • significant income, supporting the
delivery of an increasing annual dividend;
• consistent capital growth; and• strong capital profits from
realisations.
These have underpinned a 19% annualised asset IRR since the Company’s inception. The European portfolio generated strong returns, in line with, or in many cases ahead of, expectations.
These returns were underpinned by substantial cash generation in the form of income or capital profits.
The value created through this robust investment performance was crystallised in a number of instances through well managed realisations, shown as ‘Realised assets’ in Chart 4. While the Company is structured to hold investments over the long term, it has sold assets where compelling offers have generated additional shareholder value. This was the case with Eversholt Rail in 2015, which generated an IRR in excess of 40% and Elenia and AWG in 2018, which generated IRRs of 31% and 16% respectively.
The valuation of the India Fund, which represents only 2% of the portfolio, has continued to be affected by currency and macro-economic issues, as well as a number of issues related to specific investments.
Chart 3: Portfolio weighted average discount rate (31 March 2018, %)
Mar 08 Mar 09 Mar 10 Mar 11 Mar 14 Mar 16 Mar 17 Mar 18Mar 15Mar 13Mar 12
10.010.5
12.4
13.8
12.513.2
12.612.0
10.2 9.9
11.8
Movements in portfolio value continued
Investment Adviser’s review
3i Infrastructure plc Annual report and accounts 201824
Infinis
Total cost Value including accrued income Proceeds on disposals/capital returns Cash income
Portfolio asset returns include allocation of FX hedging where applicable.1 Other includes Junior debt portfolio, T2C and Novera.
Elenia (realised February 2018)
WIG
AWG (realised February 2018)
Oystercatcher
Eversholt (realised April 2015)
TCR
Realised PPP
Cross London Trains
Other1
ESVAGT
Valorem
Existing PPP portfolio
3i IIF
Chart 4: Portfolio asset returns throughout holding period (since inception, £m)
Existing portfolio
Realised assets
Total return
Total return
4.5x3.3x3.3x1.6x1.2x
173410 154
195766 106
139181 107
151391 114
63168
121169
322311 10 16
151180 5
132153
23
4855 1
265304 4
107
4 65
173250 22
138145 24
37 24
173410 154
195766 106
139181 107
151391 114
63168
121169
322311 10 16
151180 5
132153
23
4855 1
265304 4
107
4 65
173250 22
138145 24
37 24
19%Annualised asset IRR from IPO to 31 March 2018
Investment A
dviser’s review
3i Infrastructure plc Annual report and accounts 2018 25

Review of investments27 Infinis 28 Wireless Infrastructure Group (‘WIG’)29 Oystercatcher30 TCR31 Cross London Trains (‘XLT’)32 ESVAGT33 Valorem34 Projects portfolio
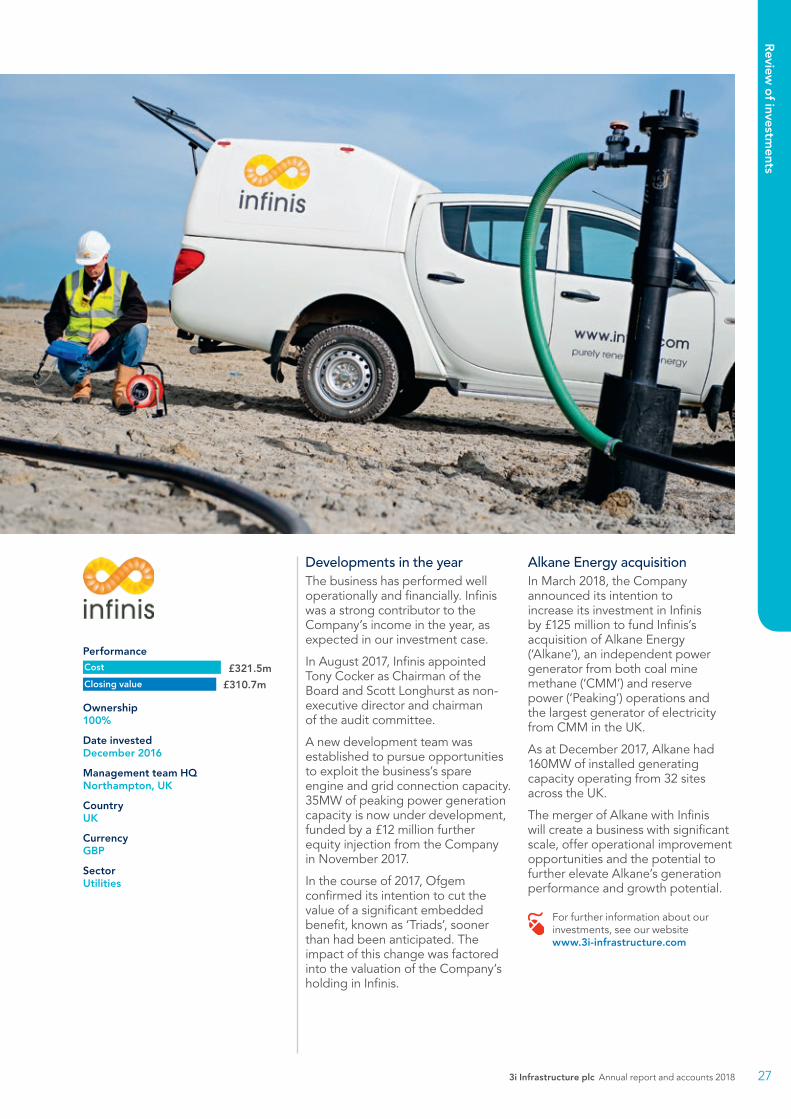
Developments in the year The business has performed well operationally and financially. Infinis was a strong contributor to the Company’s income in the year, as expected in our investment case.
In August 2017, Infinis appointed Tony Cocker as Chairman of the Board and Scott Longhurst as non-executive director and chairman of the audit committee.
A new development team was established to pursue opportunities to exploit the business’s spare engine and grid connection capacity. 35MW of peaking power generation capacity is now under development, funded by a £12 million further equity injection from the Company in November 2017.
In the course of 2017, Ofgem confirmed its intention to cut the value of a significant embedded benefit, known as ‘Triads’, sooner than had been anticipated. The impact of this change was factored into the valuation of the Company’s holding in Infinis.
Alkane Energy acquisitionIn March 2018, the Company announced its intention to increase its investment in Infinis by £125 million to fund Infinis’s acquisition of Alkane Energy (‘Alkane’), an independent power generator from both coal mine methane (‘CMM’) and reserve power (‘Peaking’) operations and the largest generator of electricity from CMM in the UK.
As at December 2017, Alkane had 160MW of installed generating capacity operating from 32 sites across the UK.
The merger of Alkane with Infinis will create a business with significant scale, offer operational improvement opportunities and the potential to further elevate Alkane’s generation performance and growth potential.
For further information about our investments, see our website www.3i-infrastructure.com
Ownership100%
Date investedDecember 2016
Management team HQNorthampton, UK
CountryUK
CurrencyGBP
SectorUtilities
Cost
Closing value
£321.5m
£310.7m
Performance
Review
of investm
ents
3i Infrastructure plc Annual report and accounts 2018 27

Follow-on investmentDuring the year, the Company invested a further £190 million in WIG to acquire co-shareholder Barings’ majority stake and a portion of the management’s holding. This brings the Company’s total ownership in WIG to 93.1%, with management retaining the balance of equity.
Developments in the year WIG is performing in line with expectations, driven by a stable core business that is underpinned by long term, inflation linked contracts.
During 2017, WIG supported its customers across existing and new infrastructure as they successfully delivered on their coverage targets.
WIG has a growing pipeline of opportunities to invest in fibre based neutral-host wireless infrastructure, such as distributed antenna systems and small cells, which can provide multi-operator coverage in densely populated areas such as shopping centres, office blocks and stadiums.
In Aberdeen, WIG deployed fibre based small cell infrastructure in partnership with Telefonica to create a 5G-ready network. WIG is also part of a consortium that has been awarded government funding to develop the UK’s largest real-world autonomous vehicle test bed in the West Midlands.
For further information about our investments, see our website www.3i-infrastructure.com
Ownership93%
Date investedJune 2016 and January 2018
Management team HQBellshill, UK
CountryUK
CurrencyGBP
SectorCommunications
Cost
Closing value
£264.8m
£300.4m
Performance
Review of investments
3i Infrastructure plc Annual report and accounts 201828
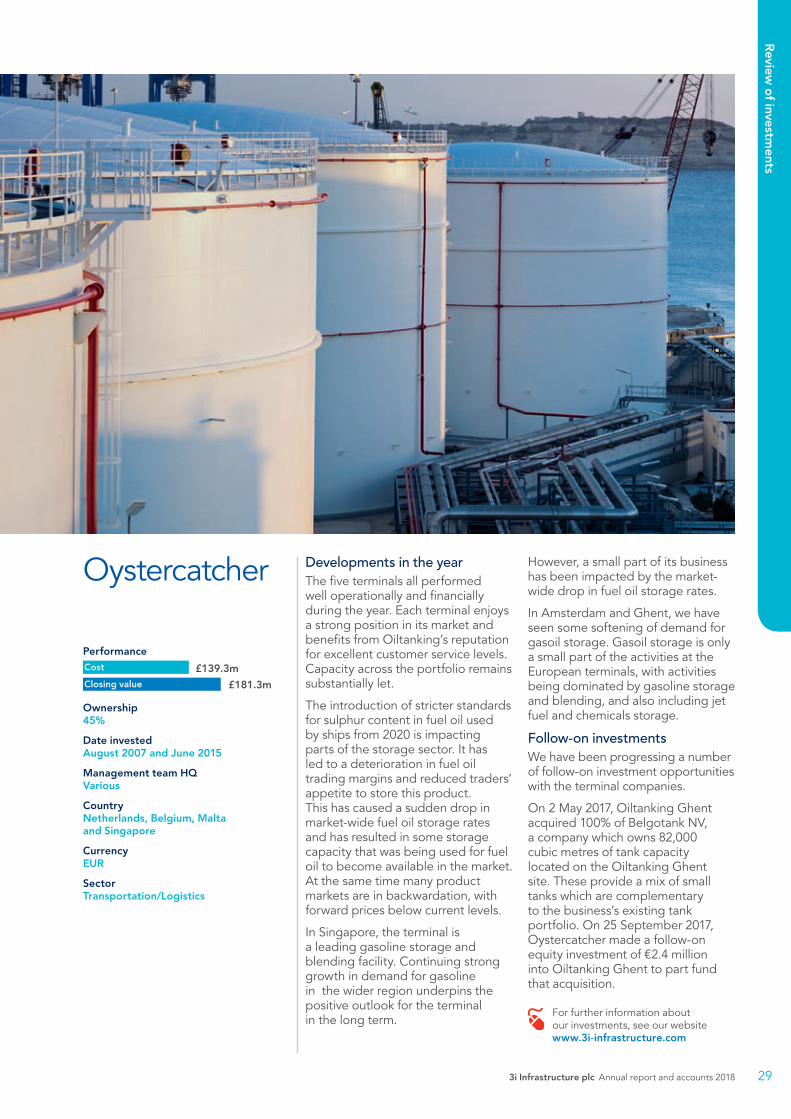
Developments in the yearThe five terminals all performed well operationally and financially during the year. Each terminal enjoys a strong position in its market and benefits from Oiltanking’s reputation for excellent customer service levels. Capacity across the portfolio remains substantially let.
The introduction of stricter standards for sulphur content in fuel oil used by ships from 2020 is impacting parts of the storage sector. It has led to a deterioration in fuel oil trading margins and reduced traders’ appetite to store this product. This has caused a sudden drop in market-wide fuel oil storage rates and has resulted in some storage capacity that was being used for fuel oil to become available in the market. At the same time many product markets are in backwardation, with forward prices below current levels.
In Singapore, the terminal is a leading gasoline storage and blending facility. Continuing strong growth in demand for gasoline in the wider region underpins the positive outlook for the terminal in the long term.
However, a small part of its business has been impacted by the market-wide drop in fuel oil storage rates.
In Amsterdam and Ghent, we have seen some softening of demand for gasoil storage. Gasoil storage is only a small part of the activities at the European terminals, with activities being dominated by gasoline storage and blending, and also including jet fuel and chemicals storage.
Follow-on investmentsWe have been progressing a number of follow-on investment opportunities with the terminal companies.
On 2 May 2017, Oiltanking Ghent acquired 100% of Belgotank NV, a company which owns 82,000 cubic metres of tank capacity located on the Oiltanking Ghent site. These provide a mix of small tanks which are complementary to the business’s existing tank portfolio. On 25 September 2017, Oystercatcher made a follow-on equity investment of €2.4 million into Oiltanking Ghent to part fund that acquisition.
For further information about our investments, see our website www.3i-infrastructure.com
Oystercatcher
Cost
Closing value
£139.3m
£181.3m
Performance
Ownership45%
Date investedAugust 2007 and June 2015
Management team HQVarious
CountryNetherlands, Belgium, Malta and Singapore
CurrencyEUR
SectorTransportation/Logistics
Review
of investm
ents
3i Infrastructure plc Annual report and accounts 2018 29
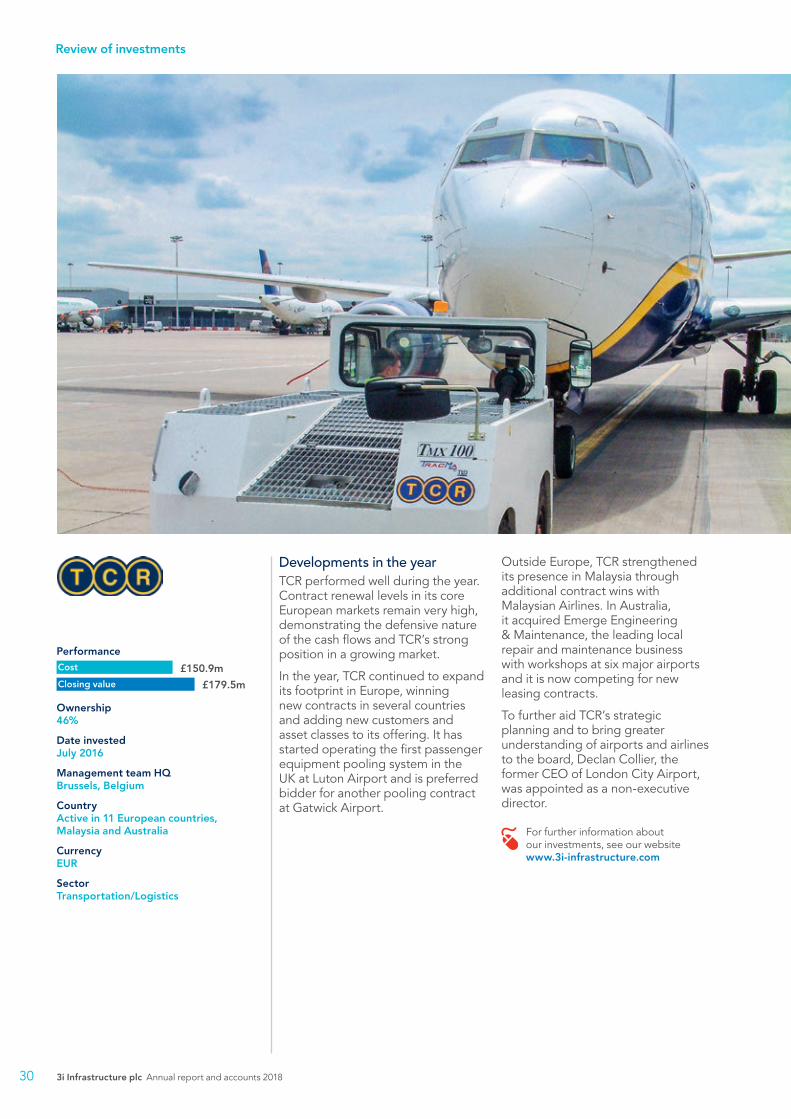
Developments in the year TCR performed well during the year. Contract renewal levels in its core European markets remain very high, demonstrating the defensive nature of the cash flows and TCR’s strong position in a growing market.
In the year, TCR continued to expand its footprint in Europe, winning new contracts in several countries and adding new customers and asset classes to its offering. It has started operating the first passenger equipment pooling system in the UK at Luton Airport and is preferred bidder for another pooling contract at Gatwick Airport.
Outside Europe, TCR strengthened its presence in Malaysia through additional contract wins with Malaysian Airlines. In Australia, it acquired Emerge Engineering & Maintenance, the leading local repair and maintenance business with workshops at six major airports and it is now competing for new leasing contracts.
To further aid TCR’s strategic planning and to bring greater understanding of airports and airlines to the board, Declan Collier, the former CEO of London City Airport, was appointed as a non-executive director.
For further information about our investments, see our website www.3i-infrastructure.com
Ownership46%
Date investedJuly 2016
Management team HQBrussels, Belgium
CountryActive in 11 European countries, Malaysia and Australia
CurrencyEUR
SectorTransportation/Logistics
Cost
Closing value
£150.9m
£179.5m
Performance
Review of investments
3i Infrastructure plc Annual report and accounts 201830
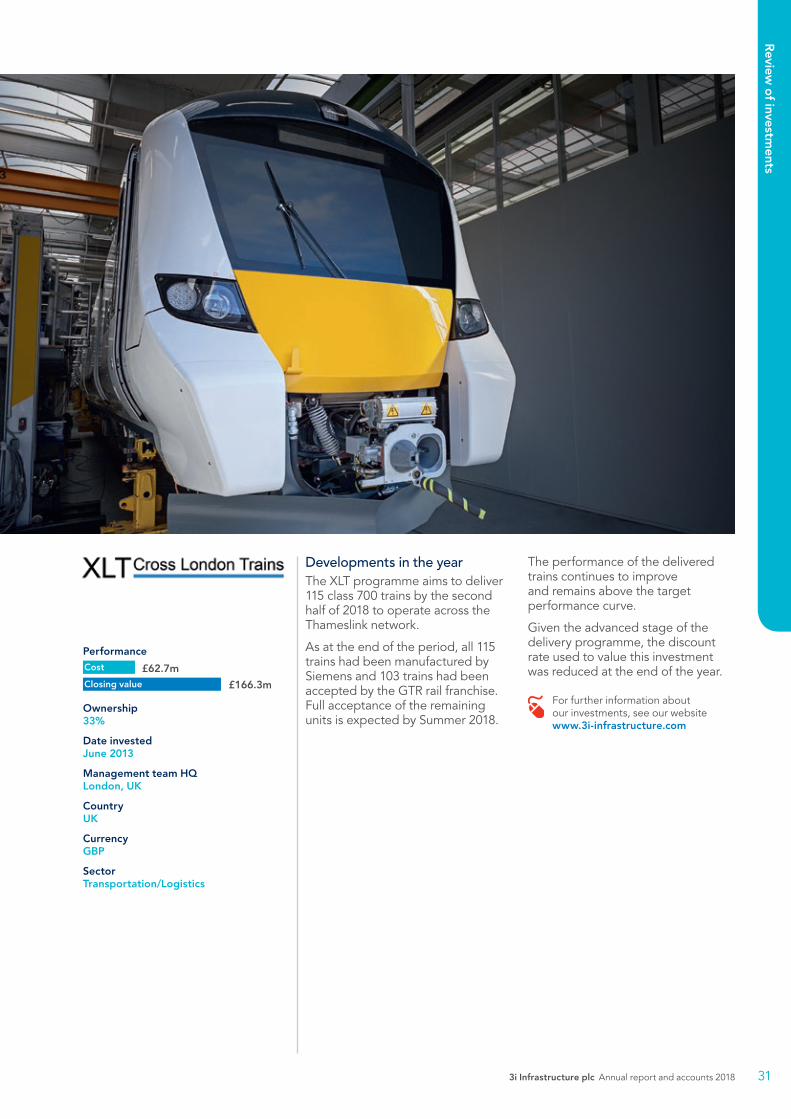
Developments in the yearThe XLT programme aims to deliver 115 class 700 trains by the second half of 2018 to operate across the Thameslink network.
As at the end of the period, all 115 trains had been manufactured by Siemens and 103 trains had been accepted by the GTR rail franchise. Full acceptance of the remaining units is expected by Summer 2018.
The performance of the delivered trains continues to improve and remains above the target performance curve.
Given the advanced stage of the delivery programme, the discount rate used to value this investment was reduced at the end of the year.
For further information about our investments, see our website www.3i-infrastructure.com
Ownership33%
Date investedJune 2013
Management team HQLondon, UK
CountryUK
CurrencyGBP
SectorTransportation/Logistics
Cost
Closing value
£62.7m
£166.3m
Performance
Review
of investm
ents
3i Infrastructure plc Annual report and accounts 2018 31

Developments in the year The market conditions in which ESVAGT operates are gradually improving. Increasing oil prices combined with improved emergency rescue and response vessel market supply dynamics are leading to increasing contract rates for ESVAGT’s tonnage.
Jakob Thomasen became chairman of ESVAGT in May 2018. Kristian Jakobsen (previous COO) was appointed as interim CEO in December 2017. Lars Bjørn Olsen is interim CFO since March 2018.
Offshore wind businessESVAGT has maintained its position as a service operations vessel market leader. In August 2017, it announced a new contract with MHI Vestas. The pipeline of new opportunities remains healthy in this high growth market.
RefinancingIn December 2017, ESVAGT completed a €376 million refinancing. As part of the refinancing, the Company invested DKK 175 million further equity (c.£21 million) into ESVAGT.
This refinancing replaces the debt taken on at acquisition and provides funding for further growth in ESVAGT’s offshore wind service business.
For further information about our investments, see our website www.3i-infrastructure.com
Ownership50%
Date investedSeptember 2015
Management team HQEsbjerg, Denmark
CountryDenmark, Norway and UK
CurrencyDKK
SectorNatural Resources/Energy
Cost
Closing value
£131.9m
£149.1m
Performance
Review of investments
3i Infrastructure plc Annual report and accounts 201832
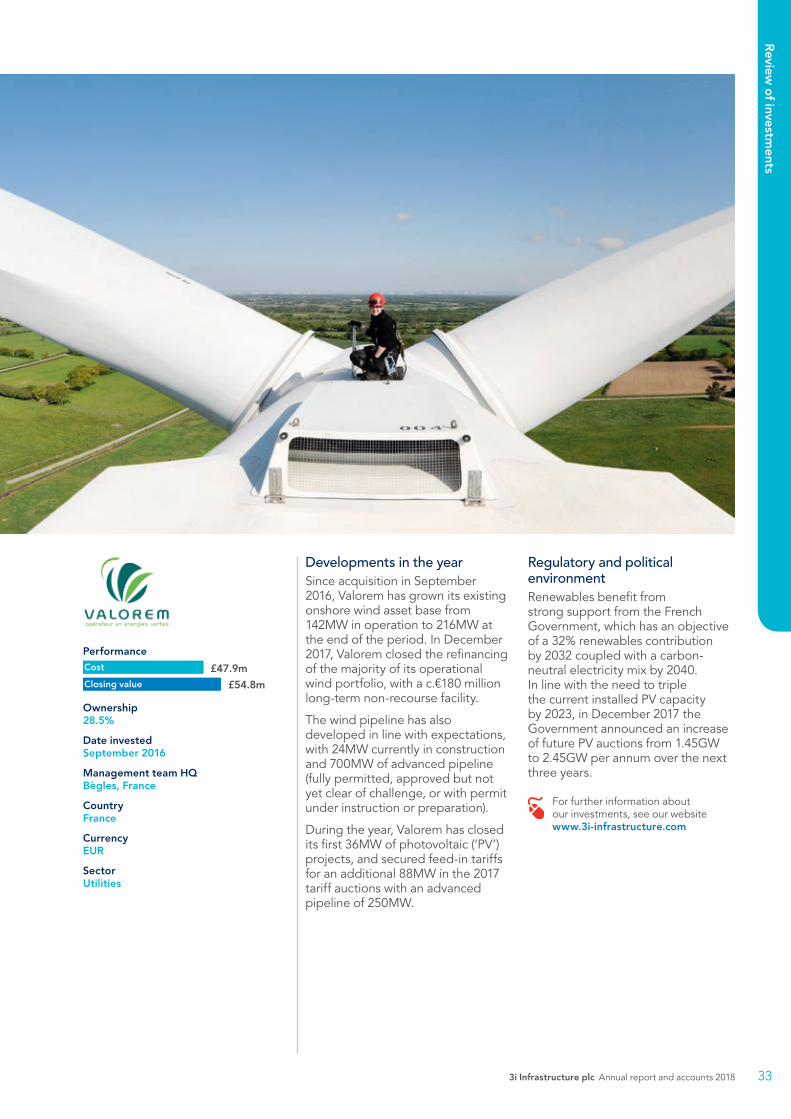
Developments in the year Since acquisition in September 2016, Valorem has grown its existing onshore wind asset base from 142MW in operation to 216MW at the end of the period. In December 2017, Valorem closed the refinancing of the majority of its operational wind portfolio, with a c.€180 million long-term non-recourse facility.
The wind pipeline has also developed in line with expectations, with 24MW currently in construction and 700MW of advanced pipeline (fully permitted, approved but not yet clear of challenge, or with permit under instruction or preparation).
During the year, Valorem has closed its first 36MW of photovoltaic (‘PV’) projects, and secured feed-in tariffs for an additional 88MW in the 2017 tariff auctions with an advanced pipeline of 250MW.
Regulatory and political environmentRenewables benefit from strong support from the French Government, which has an objective of a 32% renewables contribution by 2032 coupled with a carbon-neutral electricity mix by 2040. In line with the need to triple the current installed PV capacity by 2023, in December 2017 the Government announced an increase of future PV auctions from 1.45GW to 2.45GW per annum over the next three years.
For further information about our investments, see our website www.3i-infrastructure.com
Ownership28.5%
Date investedSeptember 2016
Management team HQBègles, France
CountryFrance
CurrencyEUR
SectorUtilities
Cost
Closing value
£47.9m
£54.8m
Performance
Review
of investm
ents
3i Infrastructure plc Annual report and accounts 2018 33
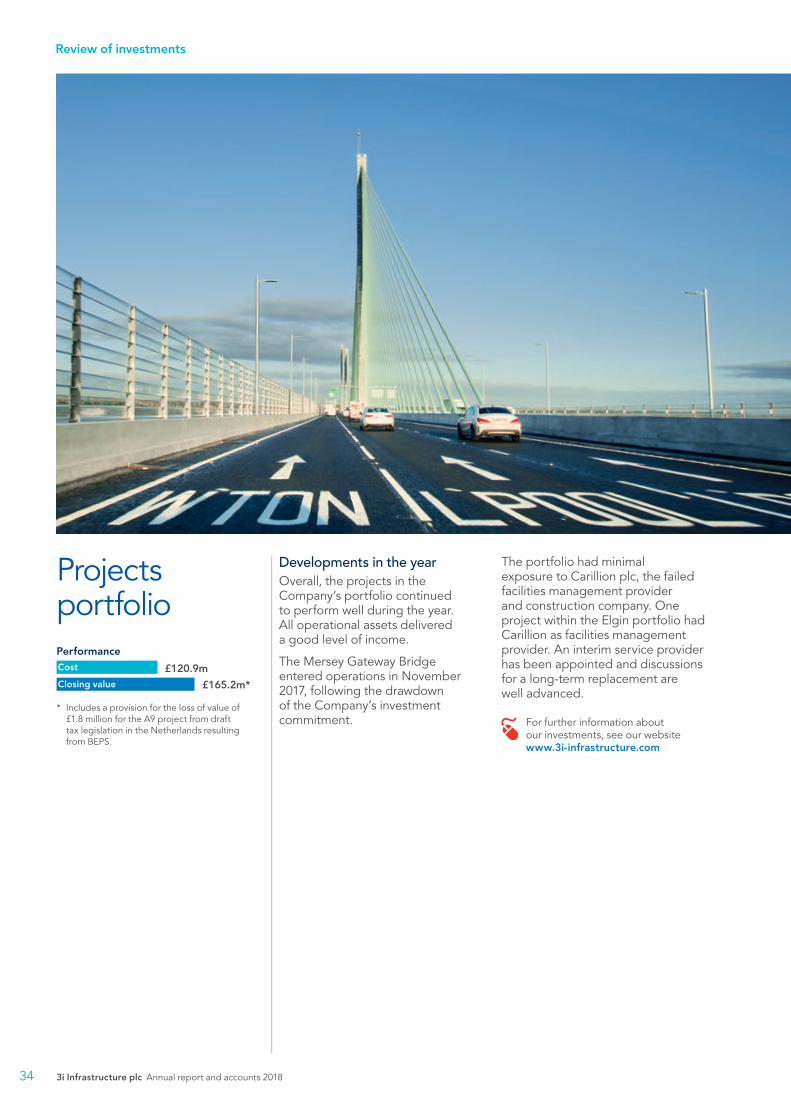
Developments in the yearOverall, the projects in the Company’s portfolio continued to perform well during the year. All operational assets delivered a good level of income.
The Mersey Gateway Bridge entered operations in November 2017, following the drawdown of the Company’s investment commitment.
The portfolio had minimal exposure to Carillion plc, the failed facilities management provider and construction company. One project within the Elgin portfolio had Carillion as facilities management provider. An interim service provider has been appointed and discussions for a long-term replacement are well advanced.
For further information about our investments, see our website www.3i-infrastructure.com
Projects portfolio
* Includes a provision for the loss of value of £1.8 million for the A9 project from draft tax legislation in the Netherlands resulting from BEPS.
Cost
Closing value
£120.9m
£165.2m*
Performance
Review of investments
3i Infrastructure plc Annual report and accounts 201834

Financial review, risk and sustainability36 Financial review45 Risk report52 Sustainability
Financial review
James DawesCFO, Infrastructure 10 May 2018
“We demonstrated our efficient balance sheet management, distributing surplus cash promptly and avoiding dilution of returns.”
Key financial measures (year to 31 March) 2018 2017
Total return1 £479.6m £146.3mNet asset value £1,710.2m £1,734.6mNet asset value per share 211.0p 169.0pTotal income2 £100.0m £85.6mPortfolio asset value2 £1,545.9m £1,805.9mCash balances2 £284.6m £20.0mTotal liquidity3 £534.0m £189.7m
1 IFRS Total comprehensive income for the year.2 Reconciliation of measures to the financial statement balances is set out in Tables 8 and 9.3 Includes cash balances of £282.0 million (2017: £17.1 million), unrestricted cash in subsidiaries of £2.6 million (2017: £2.9 million) and £249.4 million
(2017: £169.7 million) undrawn balances available under the Company’s revolving credit facility.
Financial review, risk and sustainability
36
The Company undertook a record level of activity in the year which delivered outstanding results. Two large realisations generated proceeds of £1.1 billion and the Company made £525 million of new investments and commitments. This required careful management of the balance sheet in order to avoid dilution of returns to shareholders from holding surplus cash balances, and to have the liquidity available for additional investments in WIG, Infinis, ESVAGT and Oystercatcher. We used the revolving credit facility (‘RCF’), including the accordion, to fund these investments so that approximately 20% of the proceeds from the realisations was reinvested before we received the cash.
The portfolio at the end of March 2018 has the income-generating capacity to support a higher level of dividend distribution to shareholders. We have rebased the target for FY19, increasing by 10% to 8.65 pence per share. This dividend is expected to be fully covered, and to grow progressively from this new level.
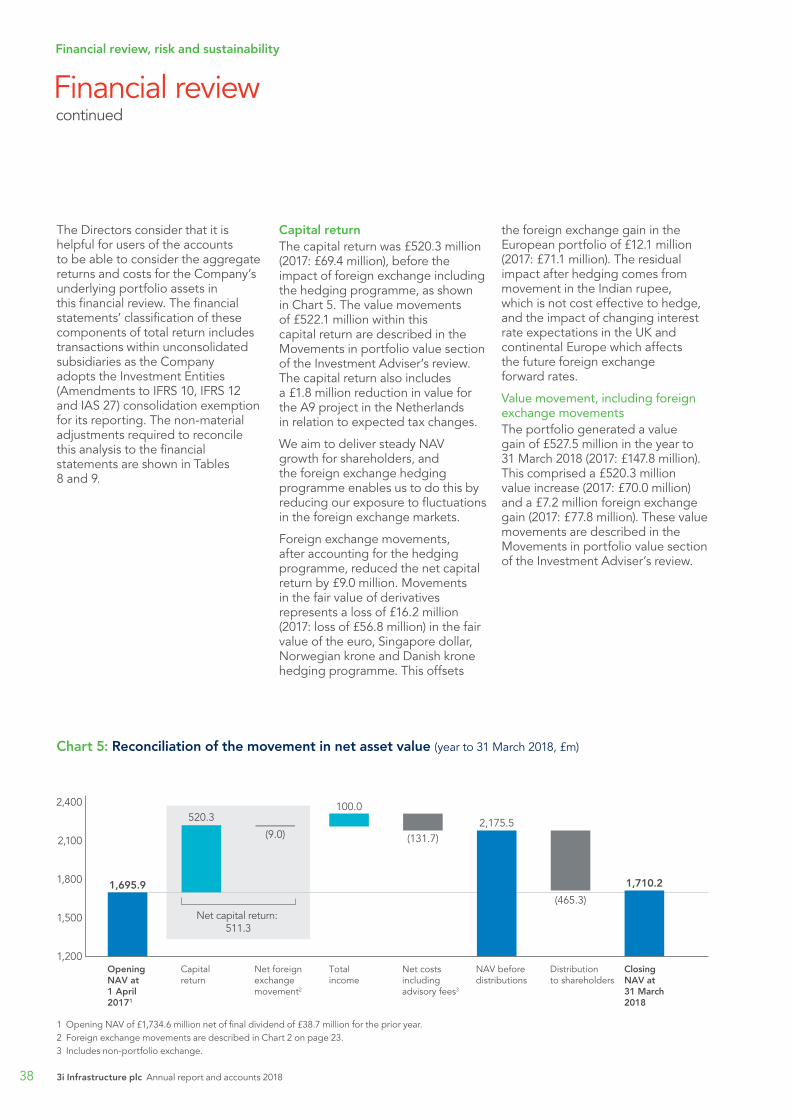
ReturnsTotal returnThe Company generated a total return for the year of £479.6 million, representing a 28.6% return on opening net asset value (2017: £146.3 million, 9.4%). This performance is considerably ahead of the target return of 8% to 10% per annum over the medium term, and significantly ahead of the total return for last year.
This performance was driven by the outstanding returns from the sales of AWG and Elenia but also driven by the delivery of planned cash flows and other asset outperformance. Changes in the valuation of the Company’s portfolio assets are described in the Movements in portfolio value section of the Investment Adviser’s review.
Total income of £100.0 million in the year has grown by 17% on last year, reflecting a full year of yield on investments made during the last financial year. The dividend to shareholders is fully covered for FY18, supported by this growth in income, together with non-income cash receipts of £56.4 million during the year, which was also higher than the £18.2 million from the prior year.
These non-income cash receipts reflect distributions from underlying portfolio companies, which would usually be income to the Company, but that are instead distributed as a repayment of investment for a variety of reasons.
Whilst non-income cash does not form part of the total return shown in Table 3, it is included when considering dividend coverage.
The Company’s performance is assessed by the Board based on the following measures:• capital return: unrealised value
movements due to changes to the carrying valuation of assets across the year (or since acquisition, if shorter) including the impact of foreign exchange movements relating to portfolio assets; or realised capital profits or losses generated from the sale or partial sale of portfolio assets above or below their carrying valuation;
• movement in fair value of derivatives for foreign currency hedging;
• total income: interest and dividends from underlying portfolio assets, interest on cash holdings and transaction fees receivable;
• costs: advisory and performance fees, Board and other operating costs, transaction fees payable and finance costs relating to the Company’s revolving credit facility; and
• other net income/costs: includes other income and foreign exchange movements.
Table 3 shows an analysis of these elements of the return.
Table 3: Summary total return (year to 31 March, £m) 2018 2017
Capital return 527.51 147.2
Movement in fair value of derivatives (16.2) (56.8)
Net capital return 511.3 90.4
Total income 100.0 85.6
Costs (133.0) (34.3)
Other net income/(costs) including exchange movements 1.3 4.6
Total return 479.6 146.3
1 Includes a provision for the loss of value of £1.8 million for the A9 project from draft tax legislation in the Netherlands resulting from BEPS.
Financial review, risk and
sustainability
3i Infrastructure plc Annual report and accounts 2018 37
The Directors consider that it is helpful for users of the accounts to be able to consider the aggregate returns and costs for the Company’s underlying portfolio assets in this financial review. The financial statements’ classification of these components of total return includes transactions within unconsolidated subsidiaries as the Company adopts the Investment Entities (Amendments to IFRS 10, IFRS 12 and IAS 27) consolidation exemption for its reporting. The non-material adjustments required to reconcile this analysis to the financial statements are shown in Tables 8 and 9.
Capital returnThe capital return was £520.3 million (2017: £69.4 million), before the impact of foreign exchange including the hedging programme, as shown in Chart 5. The value movements of £522.1 million within this capital return are described in the Movements in portfolio value section of the Investment Adviser’s review. The capital return also includes a £1.8 million reduction in value for the A9 project in the Netherlands in relation to expected tax changes.
We aim to deliver steady NAV growth for shareholders, and the foreign exchange hedging programme enables us to do this by reducing our exposure to fluctuations in the foreign exchange markets.
Foreign exchange movements, after accounting for the hedging programme, reduced the net capital return by £9.0 million. Movements in the fair value of derivatives represents a loss of £16.2 million (2017: loss of £56.8 million) in the fair value of the euro, Singapore dollar, Norwegian krone and Danish krone hedging programme. This offsets
the foreign exchange gain in the European portfolio of £12.1 million (2017: £71.1 million). The residual impact after hedging comes from movement in the Indian rupee, which is not cost effective to hedge, and the impact of changing interest rate expectations in the UK and continental Europe which affects the future foreign exchange forward rates.
Value movement, including foreign exchange movementsThe portfolio generated a value gain of £527.5 million in the year to 31 March 2018 (2017: £147.8 million). This comprised a £520.3 million value increase (2017: £70.0 million) and a £7.2 million foreign exchange gain (2017: £77.8 million). These value movements are described in the Movements in portfolio value section of the Investment Adviser’s review.
1 Opening NAV of £1,734.6 million net of final dividend of £38.7 million for the prior year.2 Foreign exchange movements are described in Chart 2 on page 23. 3 Includes non-portfolio exchange.
Chart 5: Reconciliation of the movement in net asset value (year to 31 March 2018, £m)
1,695.9
520.3
(131.7)(9.0)
100.0
2,175.5
(465.3)
1,710.2
Opening NAV at 1 April 20171
Totalincome
Net foreignexchangemovement2
Net costs including advisory fees3
NAV before distributions
Distributionto shareholders
Closing NAV at 31 March2018
Capitalreturn
2,400
2,100
1,800
1,500
1,200
Net capital return: 511.3
Financial review continued
Financial review, risk and sustainability
3i Infrastructure plc Annual report and accounts 201838
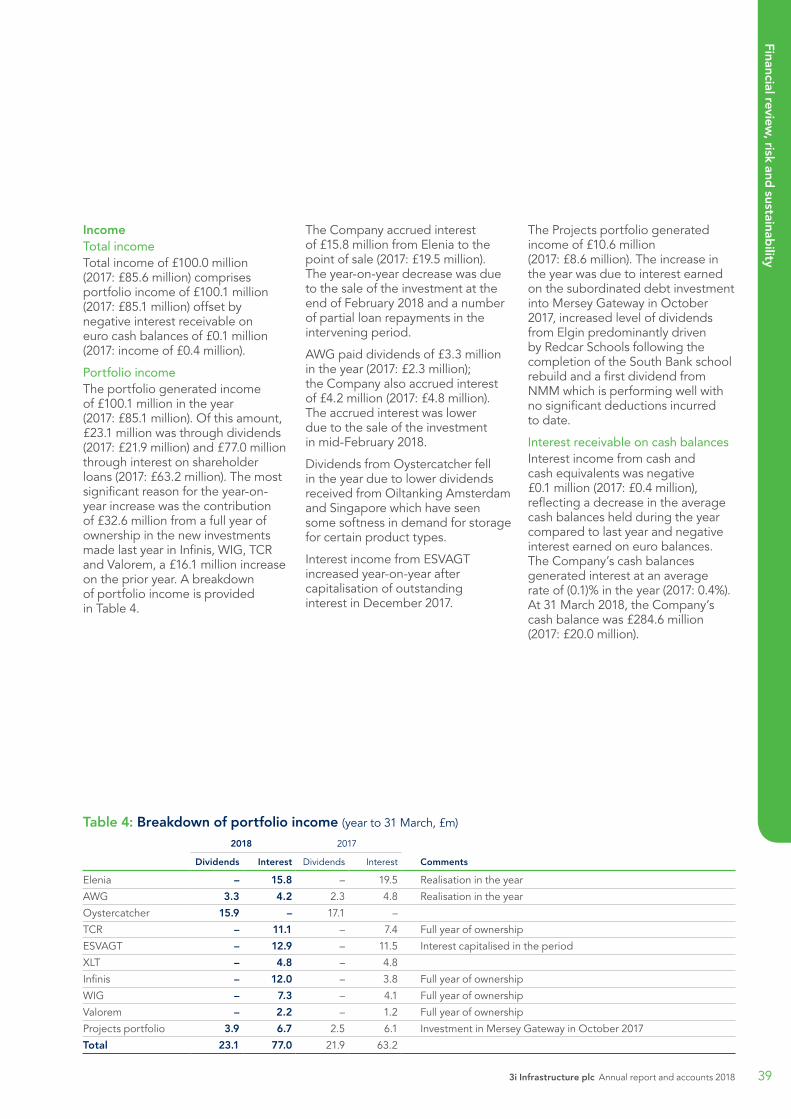
IncomeTotal incomeTotal income of £100.0 million (2017: £85.6 million) comprises portfolio income of £100.1 million (2017: £85.1 million) offset by negative interest receivable on euro cash balances of £0.1 million (2017: income of £0.4 million).
Portfolio incomeThe portfolio generated income of £100.1 million in the year (2017: £85.1 million). Of this amount, £23.1 million was through dividends (2017: £21.9 million) and £77.0 million through interest on shareholder loans (2017: £63.2 million). The most significant reason for the year-on-year increase was the contribution of £32.6 million from a full year of ownership in the new investments made last year in Infinis, WIG, TCR and Valorem, a £16.1 million increase on the prior year. A breakdown of portfolio income is provided in Table 4.
The Company accrued interest of £15.8 million from Elenia to the point of sale (2017: £19.5 million). The year-on-year decrease was due to the sale of the investment at the end of February 2018 and a number of partial loan repayments in the intervening period.
AWG paid dividends of £3.3 million in the year (2017: £2.3 million); the Company also accrued interest of £4.2 million (2017: £4.8 million). The accrued interest was lower due to the sale of the investment in mid-February 2018.
Dividends from Oystercatcher fell in the year due to lower dividends received from Oiltanking Amsterdam and Singapore which have seen some softness in demand for storage for certain product types.
Interest income from ESVAGT increased year-on-year after capitalisation of outstanding interest in December 2017.
The Projects portfolio generated income of £10.6 million (2017: £8.6 million). The increase in the year was due to interest earned on the subordinated debt investment into Mersey Gateway in October 2017, increased level of dividends from Elgin predominantly driven by Redcar Schools following the completion of the South Bank school rebuild and a first dividend from NMM which is performing well with no significant deductions incurred to date.
Interest receivable on cash balancesInterest income from cash and cash equivalents was negative £0.1 million (2017: £0.4 million), reflecting a decrease in the average cash balances held during the year compared to last year and negative interest earned on euro balances. The Company’s cash balances generated interest at an average rate of (0.1)% in the year (2017: 0.4%). At 31 March 2018, the Company’s cash balance was £284.6 million (2017: £20.0 million).
Table 4: Breakdown of portfolio income (year to 31 March, £m)
2018 2017
Dividends Interest Dividends Interest Comments
Elenia – 15.8 – 19.5 Realisation in the year
AWG 3.3 4.2 2.3 4.8 Realisation in the year
Oystercatcher 15.9 – 17.1 –
TCR – 11.1 – 7.4 Full year of ownership
ESVAGT – 12.9 – 11.5 Interest capitalised in the period
XLT – 4.8 – 4.8
Infinis – 12.0 – 3.8 Full year of ownership
WIG – 7.3 – 4.1 Full year of ownership
Valorem – 2.2 – 1.2 Full year of ownership
Projects portfolio 3.9 6.7 2.5 6.1 Investment in Mersey Gateway in October 2017
Total 23.1 77.0 21.9 63.2
Financial review, risk and
sustainability
3i Infrastructure plc Annual report and accounts 2018 39

CostsAdvisory fees and performance fees During the year to 31 March 2018, the Company and its unconsolidated subsidiaries incurred advisory fees of £33.2 million (2017: £24.3 million). The increase is due to new investment activity in the year. The advisory fee, payable to 3i plc, is calculated as 1.0% to 1.5% of the Gross Investment Value, which is based on the opening portfolio value and the cost of any new investments or commitments made during the year. The advisory fee for new project investments is 1.0%. For non-project investments the advisory fee is 1.5% reducing to 1.25% for any proportion of an asset held for more than five years. As several of the Company’s investments have been held for more than five years, the advisory fee rate chargeable for those investments (eg AWG, three of the five terminal investments held within Oystercatcher, Elenia, Octagon, Elgin, a portion of the Dalmore investment and the various assets within the 3i India Infrastructure Fund) is 1.25%.
An annual performance fee is also payable by the Company, amounting to 20% of returns above a hurdle of 8% of the growth in net asset value per annum per share and subject to a high water mark requirement. This hurdle was exceeded for the year ended 31 March 2018 resulting in a performance fee payable to 3i plc in respect of the year ended 31 March 2018 of £89.8 million (2017: £3.9 million). For a more
detailed explanation of how advisory and performance fees are calculated and of the high water mark definition, please refer to Note 18 in the financial statements.
Fees payableFees payable on investment activities include costs for transactions that did not reach, or have yet to reach, completion and the reversal of costs for transactions that have successfully reached completion and were subsequently borne by the portfolio company. For the year to 31 March 2018, fees payable totalled £0.4 million (2017: credit of £1.0 million).
Other operating and finance costsOperating expenses, comprising Directors’ fees, service provider costs and other professional fees, totalled £2.8 million in the year (2017: £2.6 million). Other professional fees included the investor perception study and advice on the return of capital and the impact and mitigation of BEPS risk.
Finance costs of £6.8 million (2017: £4.5 million) in the year comprised £5.2 million of arrangement, commitment and utilisation fees for the Company’s £300 million revolving credit facility, together with £1.6 million in relation to the arrangement and commitment fees for the additional £200 million accordion increase in the facility which was arranged and subsequently cancelled during the year.
Ongoing charges ratioThe ongoing charges ratio measures annual operating costs, as disclosed in the table below, against the average net asset value over the reporting period.
The Company’s ongoing charges ratio is calculated in accordance with the Association of Investment Companies (‘AIC’) recommended methodology, and was 2.06% for the year to 31 March 2018 (2017: 1.71%). The ongoing charges ratio is higher in periods where new investment levels are high and new equity is raised or capital is returned to shareholders.
The AIC methodology does not include performance fees or finance costs. However, the AIC recommends that the impact of performance fees on the ongoing charges ratio is noted, where performance fees are payable. The cost items that contributed to the ongoing charges ratio are shown below. The ratio including the performance fee was 7.18% (2017: 1.96%). The total return of 28.6% for the year is after deducting this performance fee and ongoing charges.
Table 5: Ongoing charges (year to 31 March, £m) 2018 2017
Investment Adviser’s fee 33.2 24.3
Auditor’s fee 0.3 0.3
Directors’ fees and expenses 0.5 0.5
Other ongoing costs 2.0 1.8
Total ongoing charges 36.0 26.9
Ongoing charges ratio 2.06% 1.71%
Financial review continued
Financial review, risk and sustainability
3i Infrastructure plc Annual report and accounts 201840
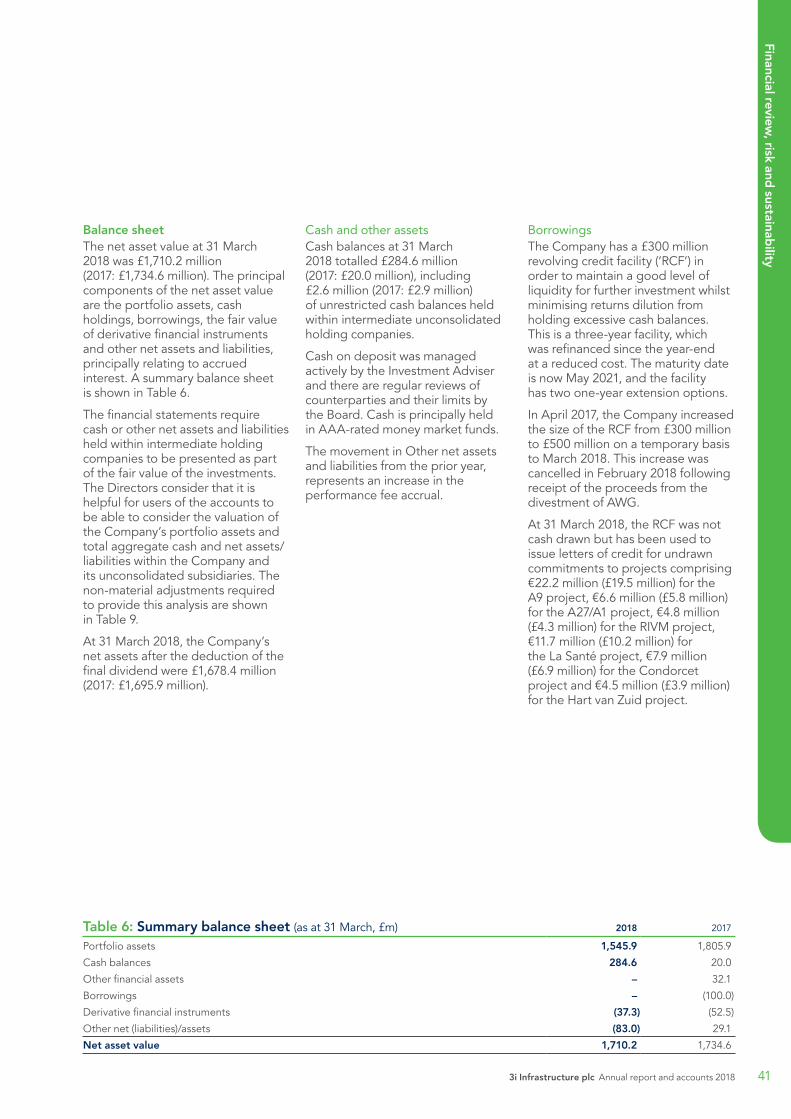
Balance sheetThe net asset value at 31 March 2018 was £1,710.2 million (2017: £1,734.6 million). The principal components of the net asset value are the portfolio assets, cash holdings, borrowings, the fair value of derivative financial instruments and other net assets and liabilities, principally relating to accrued interest. A summary balance sheet is shown in Table 6.
The financial statements require cash or other net assets and liabilities held within intermediate holding companies to be presented as part of the fair value of the investments. The Directors consider that it is helpful for users of the accounts to be able to consider the valuation of the Company’s portfolio assets and total aggregate cash and net assets/liabilities within the Company and its unconsolidated subsidiaries. The non-material adjustments required to provide this analysis are shown in Table 9.
At 31 March 2018, the Company’s net assets after the deduction of the final dividend were £1,678.4 million (2017: £1,695.9 million).
Cash and other assetsCash balances at 31 March 2018 totalled £284.6 million (2017: £20.0 million), including £2.6 million (2017: £2.9 million) of unrestricted cash balances held within intermediate unconsolidated holding companies.
Cash on deposit was managed actively by the Investment Adviser and there are regular reviews of counterparties and their limits by the Board. Cash is principally held in AAA-rated money market funds.
The movement in Other net assets and liabilities from the prior year, represents an increase in the performance fee accrual.
Borrowings The Company has a £300 million revolving credit facility (‘RCF’) in order to maintain a good level of liquidity for further investment whilst minimising returns dilution from holding excessive cash balances. This is a three-year facility, which was refinanced since the year-end at a reduced cost. The maturity date is now May 2021, and the facility has two one-year extension options.
In April 2017, the Company increased the size of the RCF from £300 million to £500 million on a temporary basis to March 2018. This increase was cancelled in February 2018 following receipt of the proceeds from the divestment of AWG.
At 31 March 2018, the RCF was not cash drawn but has been used to issue letters of credit for undrawn commitments to projects comprising €22.2 million (£19.5 million) for the A9 project, €6.6 million (£5.8 million) for the A27/A1 project, €4.8 million (£4.3 million) for the RIVM project, €11.7 million (£10.2 million) for the La Santé project, €7.9 million (£6.9 million) for the Condorcet project and €4.5 million (£3.9 million) for the Hart van Zuid project.
Table 6: Summary balance sheet (as at 31 March, £m) 2018 2017
Portfolio assets 1,545.9 1,805.9
Cash balances 284.6 20.0
Other financial assets – 32.1
Borrowings – (100.0)
Derivative financial instruments (37.3) (52.5)
Other net (liabilities)/assets (83.0) 29.1
Net asset value 1,710.2 1,734.6
Financial review, risk and
sustainability
3i Infrastructure plc Annual report and accounts 2018 41

Return of capital and share consolidation On 21 February 2018, the Company announced that it would return £425 million to shareholders by way of a special dividend of 41.4 pence per share, to enable shareholders to participate directly in the exceptional value generated by the sale of Elenia and AWG. The Company also announced a 15 for 19 share consolidation, which was approved by shareholders at the Extraordinary General Meeting (‘EGM’) on 14 March 2018, to neutralise the impact of the payment of the special dividend on the share price. The special dividend was paid to shareholders on 29 March 2018. The Company now has a total of 810,434,010 shares in issue. Trading in the new ordinary shares commenced on 15 March 2018.
Net asset value per shareThe total net asset value per share at 31 March 2018 was 211.0 pence (2017: 169.0 pence). This reduces to 207.1 pence (2017: 165.2 pence) after the payment of the final dividend of 3.925 pence (2017: 3.775 pence). There are no dilutive securities in issue.
Dividend and dividend coverThe Board has proposed a dividend for the year of 7.85 pence per share, or £72.1 million in aggregate (2017: 7.55 pence; £77.5 million). This is in line with the Company’s target announced in May last year.
When considering the coverage of the proposed dividend, the Board assesses the income earned from the portfolio, interest received on cash balances and any additional non-income cash distributions from portfolio assets which do not follow from a disposal of the underlying assets, as well as the level of ongoing operational costs incurred in the year. The Board also takes into account any surpluses retained from previous years, and net capital profits generated through asset realisations, which it considers available as dividend reserves for distribution.
Table 7 below shows the calculation of dividend coverage and dividend reserves. The final dividend cover surplus is £43.6 million (2017: shortfall of £3.3 million). The Board is therefore proposing that the final dividend payment is made in line with the Company’s FY18 full year dividend target. The retained amount available for distribution, following the payment of the final dividend, will be £345.3 million (2017: £42.4 million).
Alternative Performance Measures (‘APMs’)We assess our performance using a variety of measures that are not specifically defined under IFRS and are therefore termed APMs. The APMs that we use may not be directly comparable with those used by other companies.
These APMs are used to present a clearer picture of how the Company has performed over the year and are all financial measures of historical performance. They are consistent with the APMs we have presented in prior periods.
• Total return on opening NAV reflects the performance of the capital deployed by the Company during the year. This measure is not influenced by movements in share price or ordinary dividends to shareholders.
• The NAV per share is a common measure of the underlying asset base attributable to each ordinary share of the Company and is a useful comparator to the share price.
• Total income and non-income cash are used to assess dividend coverage based on distributions received from the investment portfolio.
• Investment value including commitments measures the total value of shareholders capital deployed by the Company.
Table 7: Dividend cover (year to 31 March 2018) £m
Total income, other income and non-income cash 158.5
Operating costs including advisory fees (42.8)
Dividends paid and proposed (72.1)
Dividend surplus for the year 43.6
Dividend reserves brought forward from prior year 42.4
Realised profits or losses over cost on disposed assets 774.1
Special dividend paid (425.0)
Performance fees (89.8)
Dividend reserves carried forward 345.3
Financial review continued
Financial review, risk and sustainability
3i Infrastructure plc Annual report and accounts 201842
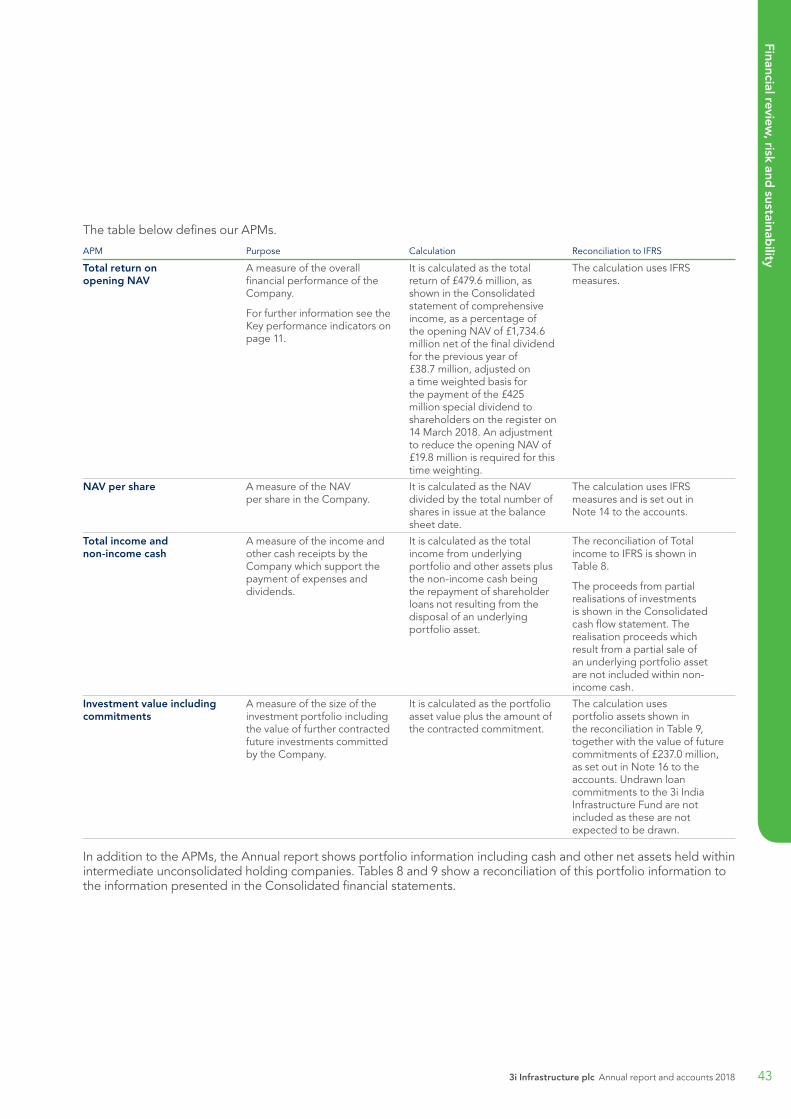
The table below defines our APMs.
APM Purpose Calculation Reconciliation to IFRS
Total return on opening NAV
A measure of the overall financial performance of the Company.
For further information see the Key performance indicators on page 11.
It is calculated as the total return of £479.6 million, as shown in the Consolidated statement of comprehensive income, as a percentage of the opening NAV of £1,734.6 million net of the final dividend for the previous year of £38.7 million, adjusted on a time weighted basis for the payment of the £425 million special dividend to shareholders on the register on 14 March 2018. An adjustment to reduce the opening NAV of £19.8 million is required for this time weighting.
The calculation uses IFRS measures.
NAV per share A measure of the NAV per share in the Company.
It is calculated as the NAV divided by the total number of shares in issue at the balance sheet date.
The calculation uses IFRS measures and is set out in Note 14 to the accounts.
Total income and non-income cash
A measure of the income and other cash receipts by the Company which support the payment of expenses and dividends.
It is calculated as the total income from underlying portfolio and other assets plus the non-income cash being the repayment of shareholder loans not resulting from the disposal of an underlying portfolio asset.
The reconciliation of Total income to IFRS is shown in Table 8.
The proceeds from partial realisations of investments is shown in the Consolidated cash flow statement. The realisation proceeds which result from a partial sale of an underlying portfolio asset are not included within non-income cash.
Investment value including commitments
A measure of the size of the investment portfolio including the value of further contracted future investments committed by the Company.
It is calculated as the portfolio asset value plus the amount of the contracted commitment.
The calculation uses portfolio assets shown in the reconciliation in Table 9, together with the value of future commitments of £237.0 million, as set out in Note 16 to the accounts. Undrawn loan commitments to the 3i India Infrastructure Fund are not included as these are not expected to be drawn.
In addition to the APMs, the Annual report shows portfolio information including cash and other net assets held within intermediate unconsolidated holding companies. Tables 8 and 9 show a reconciliation of this portfolio information to the information presented in the Consolidated financial statements.
Financial review, risk and
sustainability
3i Infrastructure plc Annual report and accounts 2018 43
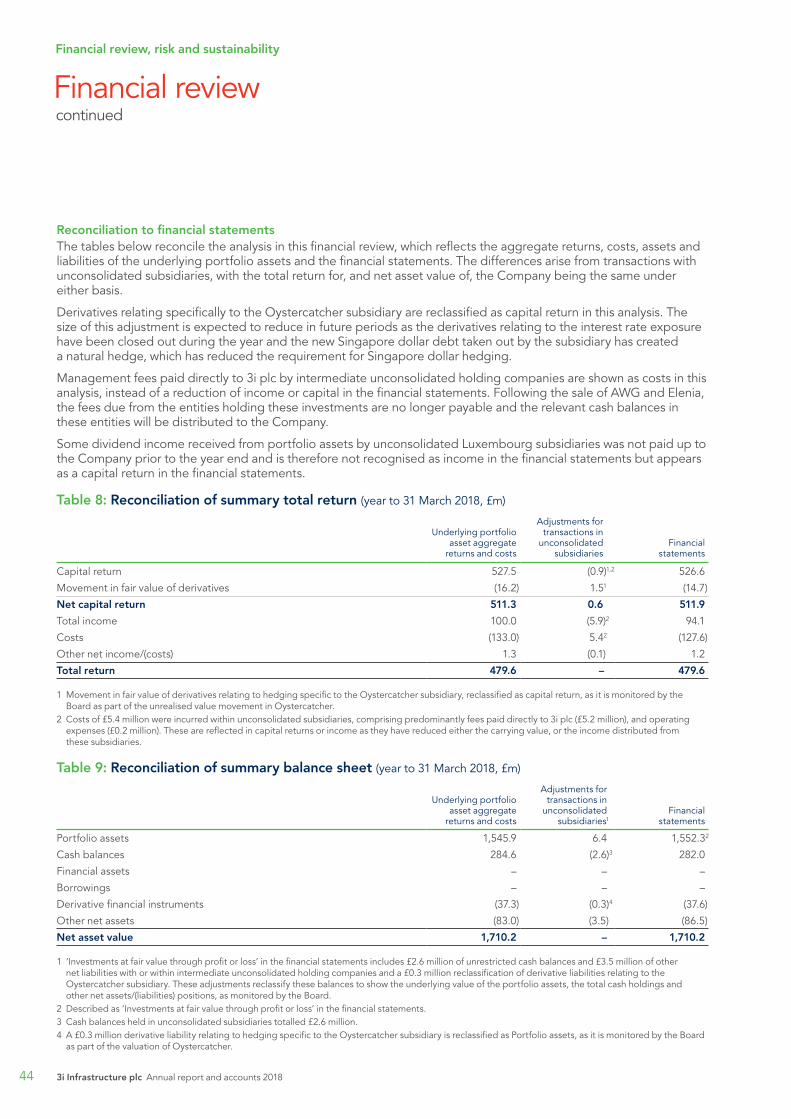
Reconciliation to financial statementsThe tables below reconcile the analysis in this financial review, which reflects the aggregate returns, costs, assets and liabilities of the underlying portfolio assets and the financial statements. The differences arise from transactions with unconsolidated subsidiaries, with the total return for, and net asset value of, the Company being the same under either basis.
Derivatives relating specifically to the Oystercatcher subsidiary are reclassified as capital return in this analysis. The size of this adjustment is expected to reduce in future periods as the derivatives relating to the interest rate exposure have been closed out during the year and the new Singapore dollar debt taken out by the subsidiary has created a natural hedge, which has reduced the requirement for Singapore dollar hedging.
Management fees paid directly to 3i plc by intermediate unconsolidated holding companies are shown as costs in this analysis, instead of a reduction of income or capital in the financial statements. Following the sale of AWG and Elenia, the fees due from the entities holding these investments are no longer payable and the relevant cash balances in these entities will be distributed to the Company.
Some dividend income received from portfolio assets by unconsolidated Luxembourg subsidiaries was not paid up to the Company prior to the year end and is therefore not recognised as income in the financial statements but appears as a capital return in the financial statements.
Table 8: Reconciliation of summary total return (year to 31 March 2018, £m)
Underlying portfolio asset aggregate
returns and costs
Adjustments for transactions in
unconsolidated subsidiaries
Financial statements
Capital return 527.5 (0.9)1,2 526.6
Movement in fair value of derivatives (16.2) 1.51 (14.7)
Net capital return 511.3 0.6 511.9
Total income 100.0 (5.9)2 94.1
Costs (133.0) 5.42 (127.6)
Other net income/(costs) 1.3 (0.1) 1.2
Total return 479.6 – 479.6
1 Movement in fair value of derivatives relating to hedging specific to the Oystercatcher subsidiary, reclassified as capital return, as it is monitored by the Board as part of the unrealised value movement in Oystercatcher.
2 Costs of £5.4 million were incurred within unconsolidated subsidiaries, comprising predominantly fees paid directly to 3i plc (£5.2 million), and operating expenses (£0.2 million). These are reflected in capital returns or income as they have reduced either the carrying value, or the income distributed from these subsidiaries.
Table 9: Reconciliation of summary balance sheet (year to 31 March 2018, £m)
Underlying portfolio asset aggregate
returns and costs
Adjustments for transactions in
unconsolidated subsidiaries1
Financial statements
Portfolio assets 1,545.9 6.4 1,552.32
Cash balances 284.6 (2.6)3 282.0
Financial assets – – –
Borrowings – – –
Derivative financial instruments (37.3) (0.3)4 (37.6)
Other net assets (83.0) (3.5) (86.5)
Net asset value 1,710.2 – 1,710.2
1 ‘Investments at fair value through profit or loss’ in the financial statements includes £2.6 million of unrestricted cash balances and £3.5 million of other net liabilities with or within intermediate unconsolidated holding companies and a £0.3 million reclassification of derivative liabilities relating to the Oystercatcher subsidiary. These adjustments reclassify these balances to show the underlying value of the portfolio assets, the total cash holdings and other net assets/(liabilities) positions, as monitored by the Board.
2 Described as ‘Investments at fair value through profit or loss’ in the financial statements.3 Cash balances held in unconsolidated subsidiaries totalled £2.6 million.4 A £0.3 million derivative liability relating to hedging specific to the Oystercatcher subsidiary is reclassified as Portfolio assets, as it is monitored by the Board
as part of the valuation of Oystercatcher.
Financial review continued
Financial review, risk and sustainability
3i Infrastructure plc Annual report and accounts 201844
The Board manages risks through updates from the Investment Adviser and other service providers and through representation on portfolio companies’ boards by investment advisory team members.
In addition to the Audit and Risk Committee, a number of other committees contribute to the Company’s overall risk governance structure including the Investment Committee and the Management Engagement Committee.
Further detail on these committees can be found in the Governance section of this report on page 54.
Risk review processThe Company’s risk review process includes the monitoring of key strategic and financial metrics considered to be indicators of potential changes in its risk profile. The review includes, but is not limited to, the following:
• regular updates on the operational and financial performance of portfolio companies;
• infrastructure and broader market overviews;
• specific reviews in the year on cyber and terrorism related risk;
• experience of investment processes;
Approach to risk governanceThe Board is ultimately responsible for the risk management of the Company. It seeks to achieve an appropriate balance between mitigating risk and generating attractive risk-adjusted returns for shareholders. Integrity and responsibility are embedded in the Company’s approach to risk management.
The Board exercises oversight of the risk framework, methodology and process through the Audit and Risk Committee. The risk framework is designed to provide a structured and consistent process for identifying, assessing and responding to risks. The Committee ensures that there is a consistent approach to risk across the Company’s strategy, business objectives, policies and procedures.
The Company is also reliant on the risk management framework of the Investment Adviser and other key service providers, as well as on the risk management operations of each portfolio company.
Risk report
Wendy DormanChairman, Audit and Risk Committee10 May 2018
“Assessment and management of risk is not just a periodic exercise, it runs through everything we do as a Board.”
Financial review, risk and
sustainability
45

Strategic considerations
New or emerging risks
Risk appetite
Risk assessment Strategy and business model
Risk related reporting
• Monthly management accounts
• Internal and external audit reports
• Service provider control reports
• Risk logs
• Compliance reports
• Risk appetite
• Viability statement
• Internal controls
• Going concern
• Statutory/accounting disclosures
Control and mitigation
Monitoring and measurement
Risk management
Controls assessment
Internal controls
Assurance work
Mitigation
Stress testing
Risk limits
Sensitivity/headroom analysis
Risk framework
Internal External – Annual report
• key macro-economic indicators and their impact on the performance and valuation of portfolio companies;
• liquidity management;• compliance with regulatory
obligations;• analysis of the impact of
international initiatives such as the OECD’s Action Plan on Base Erosion and Profit Shifting and the Common Reporting Standard, the EU Alternative Investment Fund Managers Directive, General Data Protection Regulation (‘GDPR’), Packaged Retail and Insurance-based Investment Products (‘PRIIPs’) Regulation, Markets in Financial Instruments Directive (‘MIFID II’), the US Foreign Account Tax Compliance Act; and
• review of the Company’s risk log.
The Audit and Risk Committee uses the above to identify a number of key risks. It then evaluates the impact and likelihood of each key risk, with reference to the Company’s strategy and business model. The adequacy of the mitigation plans and controls are then assessed and, if necessary, additional actions are agreed and then reviewed at the subsequent meeting.
The Committee maintains a risk matrix, onto which the key risks are mapped by impact and likelihood. The principal risks are identified on the risk matrix as those with the highest combination of impact and likelihood scores. The Company considers these principal risks in greater detail with regard to the assessment of the Company’s viability. A number of scenarios have been developed to reflect likely outcomes should the principal risks be experienced, as well as consideration of stressed scenarios that could result in the Company ceasing to be viable.
The Company is an investment company, therefore the stressed scenarios reflect cash flow from investments being reduced, such that debt covenants are breached and liabilities cannot be met. The Investment Adviser models the impact of these scenarios on the Company and reports the results to the Board. The modelling relates to the Company’s investment portfolio, as the Company is an investment company and this is therefore most relevant to an assessment of viability. The resulting assessment of viability is included in this Risk report.
Risk appetiteThe Committee has reviewed the risk matrix, and set out the Company’s appetite for each of the key risks. As an investment company, the Company seeks to take investment risk. The appetite for investment risk is described in the Investment policy and on page 6, with a risk/return graph which shows the investment focus of the Company. The Company seeks to limit or manage exposure to other risks to acceptable levels.
Risk report continued
Financial review, risk and sustainability
3i Infrastructure plc Annual report and accounts 201846
Review of significant key risksThe disclosures on pages 47 and 48 are not an exhaustive list of risks and uncertainties faced by the Company, but rather a summary of significant key risks which are under active review by the Board. These significant key risks have the potential to affect materially the achievement of the Company’s strategic objectives and impact its financial performance. This disclosure shows developments in these significant key risks for the year. The risks that have been identified as principal risks are described in more detail in the Principal risks and mitigations table on pages 50 and 51.
The Company’s risk profile and appetite remains broadly stable.
External risks – market and competitionThe markets in which the Company seeks to invest, and in particular the European economic infrastructure market, are competitive, with strong demand for new investments. This has supported value gains for existing assets in the portfolio and realisations. In this challenging environment, the Investment Adviser continues to leverage its network and skills to make investments that can continue to deliver attractive risk-adjusted returns to the Company’s shareholders.
The terms on which the UK will leave the EU have progressed and are now looking likely to conclude in 2020, but the final details remain uncertain and could create a generally less favourable financial environment for the Company and its investments. The majority of the Company’s investments are in domestic businesses with limited cross-border trading. This mitigates the risk to the Company of the UK leaving the EU without a trade deal.
Inflation, particularly in the UK, was running ahead of long-term targets during the year. This has been beneficial for the assets with inflation-linked revenues, such as WIG and Infinis, although partially offset by increases in costs.
Interest rates have risen slightly in the year but remained low. This had positive implications for some of the portfolio assets and allowed for the favourable refinancing of debt in ESVAGT and Oystercatcher, and the operational wind portfolio in Valorem.
There was significant currency volatility in the year, with sterling depreciating by 2.6% against the euro in response to continuing uncertainty concerning the UK leaving the EU. The Company’s objective is to hedge substantially its direct euro and Danish krone exposures and indirect Singapore dollar and Norwegian krone exposures. The revaluation of the hedging programme is impacted by movements in forward exchange rates which are not necessarily matched exactly by an equivalent change in the spot exchange rate at which the assets are translated.
The exposure to the Indian rupee remains unhedged. In relation to this exposure, the Board’s assessment remains that the cost of hedging the exposure would outweigh the potential benefits, primarily due to the significant interest rate differential between sterling and rupee.
The Board monitors the effectiveness of the Company’s hedging policy on a regular basis. During the year, the foreign exchange gains were offset by movements in the foreign exchange hedging derivatives.
The revenues of Infinis are underpinned by the inflation-linked UK Renewables Obligation Certificate (‘ROC’) regime until 2027, while the valuation of the business is also dictated by the evolution of long-term power prices and to fluctuations in the power price.
The recovery and stabilisation of the oil price during the year has led to increasing contract rates and utilisation for ESVAGT’s tonnage.
The introduction of stricter standards for sulphur content in fuel oil used by ships from 2020 is impacting parts of the oil storage sector. It has led to a deterioration in fuel oil trading margins, and reduced traders’ appetite to store this product. This has caused a sudden drop in market wide fuel oil storage rates and has also caused some storage capacity that was being used for fuel oil, and that in some instances can also accommodate gasoil, to become available in the market. At the same time many product markets are in backwardation. Oystercatcher has seen some softening of demand for storage of certain product types as a result of these market changes.
External risks – regulatory and taxWe have continued to monitor the development of tax changes recommended by the OECD’s Base Erosion and Profit Shifting (‘BEPS’) project. Of the 15 ‘BEPS Actions’ comprising the BEPS project, the two which have been identified as most relevant to the Company and its investments are Action 4 – ‘Limit base erosion via interest deductions’, and Action 6 – ‘Prevent treaty abuse’.
In relation to BEPS Action 4, the expected impact of interest deductibility rules in the UK and some European countries has been reflected in the valuation of the Company’s investments as at 31 March 2018. A number of other European jurisdictions have tax regimes which already limit interest deductions and further changes are not therefore expected to have a material impact.
Financial review, risk and
sustainability
3i Infrastructure plc Annual report and accounts 2018 47

In June 2017, representatives from 68 countries and jurisdictions signed a Multilateral Instrument which provides a mechanism for amending tax treaties for several of the BEPS recommendations including those concerning BEPS Action 6, prevention of treaty abuse. Following domestic ratification by more than five countries or jurisdictions, this will come into effect from 1 January 2019. In order to mitigate the risk of tax leakage for the Company, the Board intend to move the tax domicile and management of the Company to the UK with effect from 1 October 2018. We are pursuing a project plan to achieve this, which includes an application to HMRC for UK approved investment trust status.
The Company’s investment in Infinis is exposed to regulatory risk around ‘embedded benefits’. In June 2017, Ofgem confirmed its intention to cut the value of one of those benefits, known as ‘Triads’, which is reflected in the valuation of Infinis. Ofgem will publish the conclusions of its Significant Code Review by early 2019, with implementation due to come into effect from the 2020/21 charging year. This is not expected to have a material impact on the value of Infinis.
Strategic risksThe Company manages its balance sheet and liquidity position actively, seeking to maintain adequate liquidity to pursue new investment opportunities, while not diluting shareholder returns by holding surplus cash balances. Following the receipt of proceeds from the sale of Elenia and AWG, the Company returned £425 million to shareholders as a special dividend on 29 March 2018.
The Company has sufficient cash available to complete the committed investment in Attero, and has good liquidity available for future investment through the RCF which has been refinanced since the year-end. The facility has a £200 million accordion feature which the Company could seek to exercise if required.
The projects portfolio is based on long-term contracts with public sector counterparties. There is a risk, particularly in the UK, that the public sector may wish to terminate these contracts early. In most cases, the contracts have robust provisions which set out the basis on which investors will be compensated in the event of early termination at the request of the public sector. Where such provisions do not exist, termination and associated compensation is subject to mutual agreement. The Company’s projects portfolio is widely diversified by counterparty and legal jurisdiction, and represents 12% of the total portfolio including investment commitments, of which 8% is UK PFIs. Overall, we consider the risk of a material loss arising from widespread early termination of the projects to be low.
At the start of the financial year, Elenia represented 22% of portfolio value including investment commitments. This increased to 25% at the half year. Together with AWG, the two largest investments in the portfolio represented 40% of portfolio value at the half year. Following the sale of Elenia and AWG, the portfolio is more evenly balanced across investments, with no investments above 20% of portfolio value.
Investment risksThe Company made six investments and commitments during the year, in Attero, Alkane Energy through Infinis, and follow-ons in Oystercatcher, WIG, Infinis and ESVAGT. In line with the Company’s investment focus, described on page 6, these new investments have characteristics which may increase volatility in returns from time to time, for example from exposure to market power prices or demand risk.
Ongoing access to debt markets is important to assets in the portfolio, particularly as existing debt matures. Changes in the terms and availability of debt finance, including from underlying performance of portfolio assets, could impact valuations. The refinancing undertaken for ESVAGT, Oystercatcher and the operational portfolio in Valorem mitigates against this risk by extending the maturity of debt.
The performance of the investments in the India Fund remains weak. The remaining portfolio, which now represents less than 2% of the Company’s portfolio, is being managed for realisation.
OperationalThe key areas of operational risk include the loss of key personnel at the Investment Adviser, and whether the Investment Adviser’s team can continue to support the delivery of the Company’s objectives. The Board monitors the performance of the Investment Adviser through the Management Engagement Committee. It also monitors the performance of key service providers, receiving reports of any significant control breaches. The Board reviewed its own reporting on cyber risk during the year, assessed its service providers and considered cyber risk and terrorism risk within portfolio companies.
Risk report continued
Financial review, risk and sustainability
3i Infrastructure plc Annual report and accounts 201848

Viability statementThe Directors consider the long-term prospects of the Company to be favourable. The Company has a diverse portfolio of infrastructure investments, producing good and reasonably predictable levels of income which cover the dividend and costs. The Investment Adviser has a strong track record of investing selectively in good businesses and projects, and driving value through an engaged asset management approach. The Directors consider that this portfolio can continue to meet the Company’s objectives.
The Directors have assessed the viability of the Company over a three-year period to March 2021. The Directors have taken account of the current position of the Company, and the principal risks it faces which are documented in this Risk report.
The Directors have considered the potential impact on the Company of a number of scenarios in addition to the Company’s business plan and recent forecasts, which quantify the financial impact of the principal risks occurring. These scenarios represent severe but remote circumstances that the Company could experience, including a significant impairment in the value of the portfolio and a reduction in the cash flows available from portfolio companies from a variety of causes.
The assessment was conducted over several months, during which the scenarios to be analysed were evaluated by the Board, the assumptions set, and the analysis produced and reviewed. The analysis included the impact of changes in taxation under the OECD’s BEPS initiative, a Brexit outcome that is unfavourable to the Company, consideration of dramatic political events and widespread economic turmoil, and the loss of a large investment. The implications of changes in the inflation, interest rate and foreign exchange environment were also considered, separately and in combination.
The results of this stress testing showed that the Company would be able to withstand the impact of these scenarios occurring over the three-year period. The Directors also considered scenarios that would represent a serious threat to its liquidity and viability in the time period. These scenarios were considered to be remote, such as a fall in equity value of the portfolio of materially more than 50% whilst being fully drawn on the revolving credit facility including the accordion, or an equivalent fall in income.
The Directors consider that a three-year period to March 2021 is an appropriate period to review for assessing the Company’s viability. This reflects greater predictability of the Company’s cash flows over that time period, the term of the Company’s Revolving Credit Facility, and increased uncertainty surrounding economic, political and regulatory changes over the longer term.
Based on this assessment, the Directors have a reasonable expectation that the Company will be able to continue in operation and meet its liabilities as they fall due over the three-year period to March 2021.
Financial review, risk and
sustainability
3i Infrastructure plc Annual report and accounts 2018 49
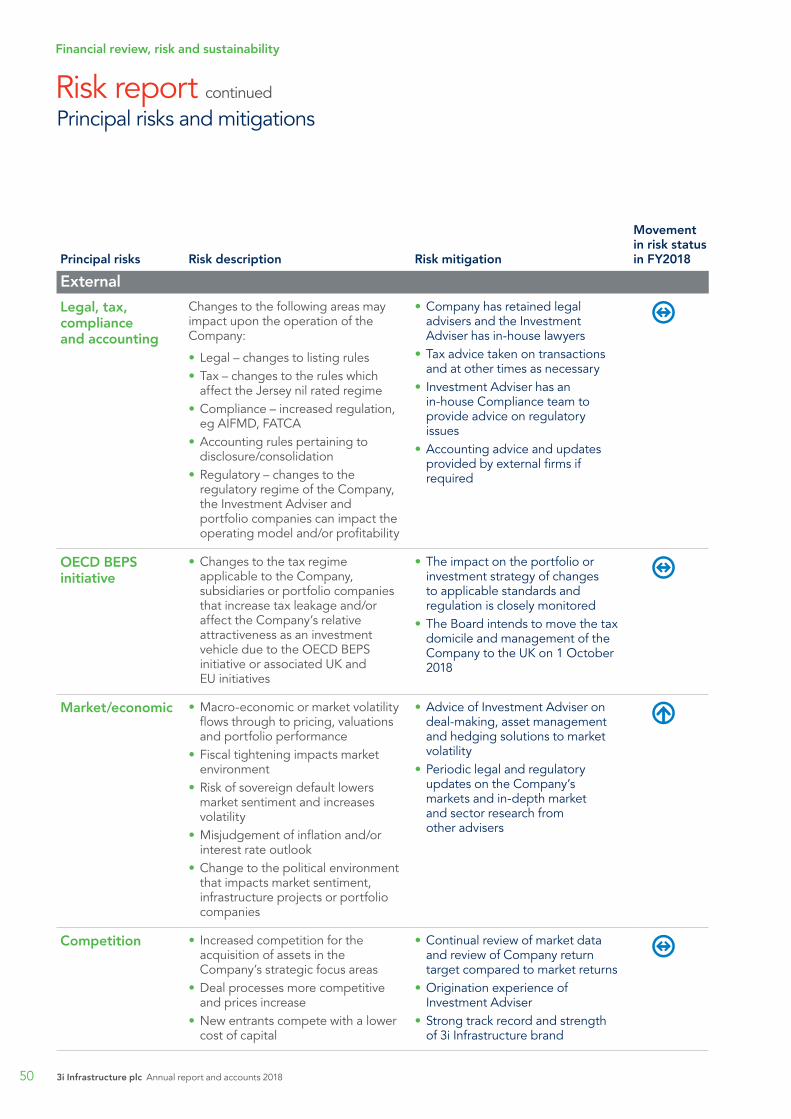
Principal risks Risk description Risk mitigation
Movement in risk status in FY2018
External
Legal, tax, compliance and accounting
Changes to the following areas may impact upon the operation of the Company:
• Legal – changes to listing rules• Tax – changes to the rules which
affect the Jersey nil rated regime• Compliance – increased regulation,
eg AIFMD, FATCA • Accounting rules pertaining to
disclosure/consolidation• Regulatory – changes to the
regulatory regime of the Company, the Investment Adviser and portfolio companies can impact the operating model and/or profitability
• Company has retained legal advisers and the Investment Adviser has in-house lawyers
• Tax advice taken on transactions and at other times as necessary
• Investment Adviser has an in-house Compliance team to provide advice on regulatory issues
• Accounting advice and updates provided by external firms if required
OECD BEPS initiative
• Changes to the tax regime applicable to the Company, subsidiaries or portfolio companies that increase tax leakage and/or affect the Company’s relative attractiveness as an investment vehicle due to the OECD BEPS initiative or associated UK and EU initiatives
• The impact on the portfolio or investment strategy of changes to applicable standards and regulation is closely monitored
• The Board intends to move the tax domicile and management of the Company to the UK on 1 October 2018
Market/economic • Macro-economic or market volatility flows through to pricing, valuations and portfolio performance
• Fiscal tightening impacts market environment
• Risk of sovereign default lowers market sentiment and increases volatility
• Misjudgement of inflation and/or interest rate outlook
• Change to the political environment that impacts market sentiment, infrastructure projects or portfolio companies
• Advice of Investment Adviser on deal-making, asset management and hedging solutions to market volatility
• Periodic legal and regulatory updates on the Company’s markets and in-depth market and sector research from other advisers
Competition • Increased competition for the acquisition of assets in the Company’s strategic focus areas
• Deal processes more competitive and prices increase
• New entrants compete with a lower cost of capital
• Continual review of market data and review of Company return target compared to market returns
• Origination experience of Investment Adviser
• Strong track record and strength of 3i Infrastructure brand
Risk report continued
Principal risks and mitigations
Financial review, risk and sustainability
3i Infrastructure plc Annual report and accounts 201850
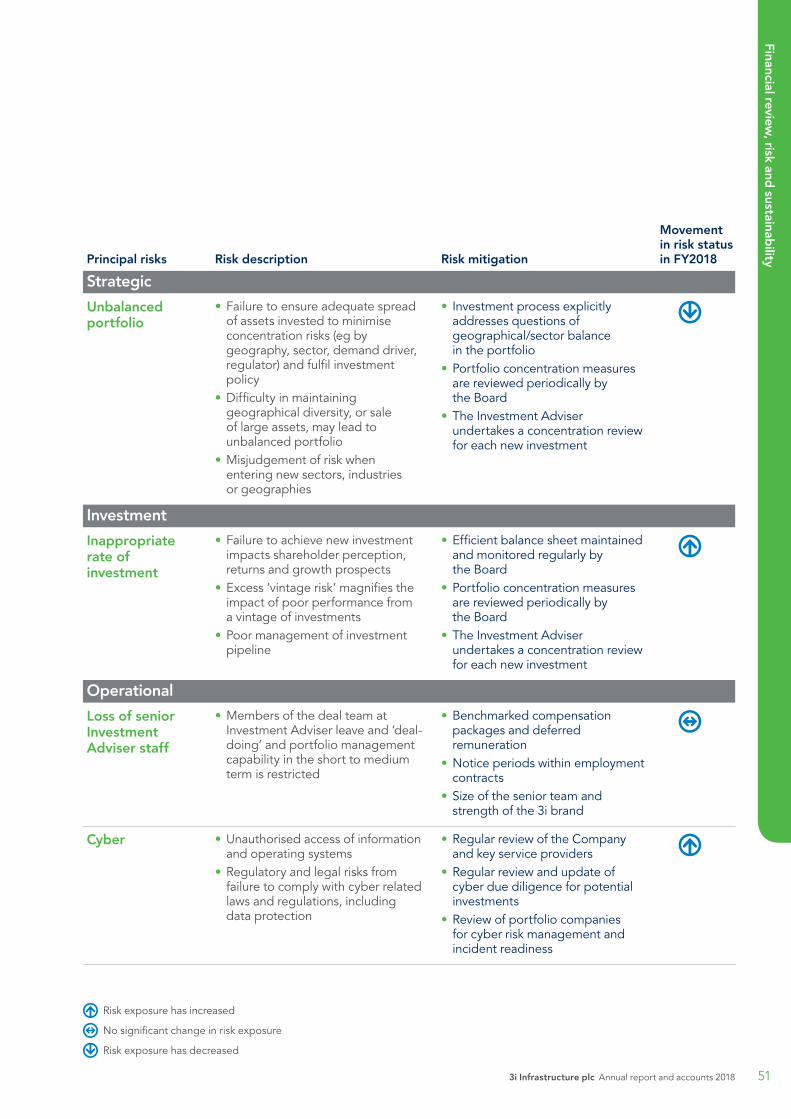
Principal risks Risk description Risk mitigation
Movement in risk status in FY2018
Strategic
Unbalanced portfolio
• Failure to ensure adequate spread of assets invested to minimise concentration risks (eg by geography, sector, demand driver, regulator) and fulfil investment policy
• Difficulty in maintaining geographical diversity, or sale of large assets, may lead to unbalanced portfolio
• Misjudgement of risk when entering new sectors, industries or geographies
• Investment process explicitly addresses questions of geographical/sector balance in the portfolio
• Portfolio concentration measures are reviewed periodically by the Board
• The Investment Adviser undertakes a concentration review for each new investment
Investment
Inappropriate rate of investment
• Failure to achieve new investment impacts shareholder perception, returns and growth prospects
• Excess ‘vintage risk’ magnifies the impact of poor performance from a vintage of investments
• Poor management of investment pipeline
• Efficient balance sheet maintained and monitored regularly by the Board
• Portfolio concentration measures are reviewed periodically by the Board
• The Investment Adviser undertakes a concentration review for each new investment
Operational
Loss of senior Investment Adviser staff
• Members of the deal team at Investment Adviser leave and ‘deal-doing’ and portfolio management capability in the short to medium term is restricted
• Benchmarked compensation packages and deferred remuneration
• Notice periods within employment contracts
• Size of the senior team and strength of the 3i brand
Cyber • Unauthorised access of information and operating systems
• Regulatory and legal risks from failure to comply with cyber related laws and regulations, including data protection
• Regular review of the Company and key service providers
• Regular review and update of cyber due diligence for potential investments
• Review of portfolio companies for cyber risk management and incident readiness
Risk exposure has increased
No significant change in risk exposure
Risk exposure has decreased
Financial review, risk and
sustainability
3i Infrastructure plc Annual report and accounts 2018 51
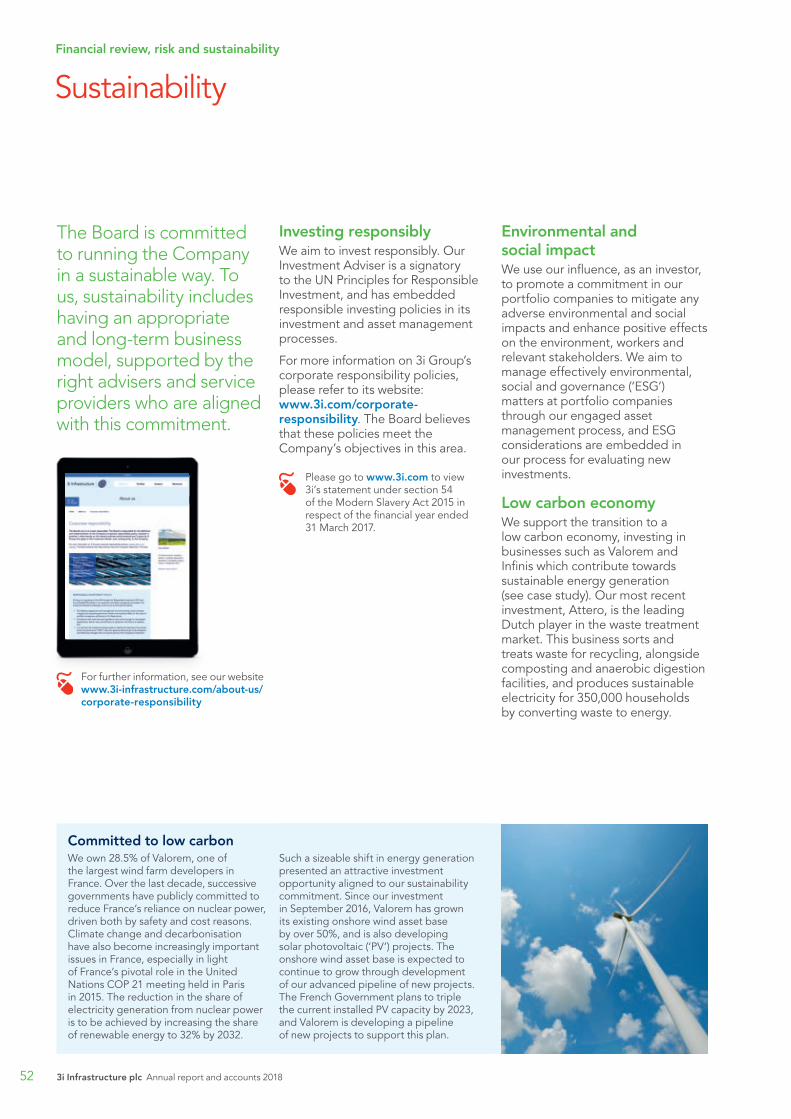
Sustainability
The Board is committed to running the Company in a sustainable way. To us, sustainability includes having an appropriate and long-term business model, supported by the right advisers and service providers who are aligned with this commitment.
Investing responsiblyWe aim to invest responsibly. Our Investment Adviser is a signatory to the UN Principles for Responsible Investment, and has embedded responsible investing policies in its investment and asset management processes.
For more information on 3i Group’s corporate responsibility policies, please refer to its website: www.3i.com/corporate-responsibility. The Board believes that these policies meet the Company’s objectives in this area.
Please go to www.3i.com to view 3i’s statement under section 54 of the Modern Slavery Act 2015 in respect of the financial year ended 31 March 2017.
Environmental and social impactWe use our influence, as an investor, to promote a commitment in our portfolio companies to mitigate any adverse environmental and social impacts and enhance positive effects on the environment, workers and relevant stakeholders. We aim to manage effectively environmental, social and governance (‘ESG’) matters at portfolio companies through our engaged asset management process, and ESG considerations are embedded in our process for evaluating new investments.
Low carbon economyWe support the transition to a low carbon economy, investing in businesses such as Valorem and Infinis which contribute towards sustainable energy generation (see case study). Our most recent investment, Attero, is the leading Dutch player in the waste treatment market. This business sorts and treats waste for recycling, alongside composting and anaerobic digestion facilities, and produces sustainable electricity for 350,000 households by converting waste to energy.
Committed to low carbonWe own 28.5% of Valorem, one of the largest wind farm developers in France. Over the last decade, successive governments have publicly committed to reduce France’s reliance on nuclear power, driven both by safety and cost reasons. Climate change and decarbonisation have also become increasingly important issues in France, especially in light of France’s pivotal role in the United Nations COP 21 meeting held in Paris in 2015. The reduction in the share of electricity generation from nuclear power is to be achieved by increasing the share of renewable energy to 32% by 2032.
Such a sizeable shift in energy generation presented an attractive investment opportunity aligned to our sustainability commitment. Since our investment in September 2016, Valorem has grown its existing onshore wind asset base by over 50%, and is also developing solar photovoltaic (‘PV’) projects. The onshore wind asset base is expected to continue to grow through development of our advanced pipeline of new projects. The French Government plans to triple the current installed PV capacity by 2023, and Valorem is developing a pipeline of new projects to support this plan.
For further information, see our website www.3i-infrastructure.com/about-us/corporate-responsibility
Financial review, risk and sustainability
3i Infrastructure plc Annual report and accounts 201852
Benefits for communitiesInvesting in infrastructure assets has economic and social sustainability benefits for communities in our target markets. We act as a conduit for institutional and retail savings into these assets, helping our shareholders to achieve their own return objectives in a sustainable way with low levels of volatility and little correlation to wider equity markets.
GovernanceWe govern the Company and, through the Investment Adviser, the assets in which we invest so as to support our sustainability objectives. More detail on the Company’s governance can be found in the Governance section of this report. The Investment Adviser’s engaged asset management approach seeks to improve and enhance the governance of businesses that we acquire, through implementing and upgrading policies and procedures as a priority following a new investment, working with management teams to define long term sustainable business plans, and working with lenders and other providers of finance to put in place sustainable financing. Details of the Company’s policies relating to the UK Bribery Act, Modern Slavery Act, procurement, prompt payment, and the environment can be found on our website.
Regulation and taxWe aim to act lawfully and with integrity, including complying with all regulatory and statutory obligations and disclosure requirements. We maintain open and constructive relationships with regulators, including the Jersey Financial Services Commission and the UK Financial Conduct Authority. We encourage our portfolio companies to comply with their respective statutory obligations, and monitor this through our engaged asset management process. We intend to move the tax domicile and management of the Company to the UK with effect from 1 October 2018, with an application to HMRC for UK approved investment trust status.
RelationshipsWe value our relationships with our shareholders and lenders, and ensure time and effort is spent in building and maintaining these relationships. Further detail can be found in the Relations with shareholders section on page 67 of this report. On 30 April 2018, we put in place a new revolving credit facility with our existing bank group demonstrating their support for the Company and the long-term relationships that we have built with our lenders.
Cyber securityCyber security is a critical issue for all businesses. We conducted a specific review of cyber risk in our portfolio companies. This review was informed by the use of a specialist consultancy firm appointed by the Investment Adviser to assess cyber risks and controls across the portfolio. A number of actions were identified to improve resilience, and the delivery of these actions is monitored through our engaged asset management process.
By engaging with our portfolio companies on ESG matters in a consistent, structured, and informed way, utilising specialist resources where appropriate and sharing best practice, we can improve the sustainability of the companies and of the portfolio as a whole.
This Strategic report is approved by order of the Board.
Authorised signatory
Link Alternative Fund Services (Jersey) Limited
Company Secretary 10 May 2018
Financial review, risk and
sustainability
3i Infrastructure plc Annual report and accounts 2018 53
Governance and accounts55 Introduction to Governance56 Leadership62 Effectiveness67 Relations with shareholders68 Accountability73 Remuneration75 Directors’ statement78 Independent auditor’s report
to the members of 3i Infrastructure plc84 Consolidated statement
of comprehensive income85 Consolidated statement
of changes in equity86 Consolidated balance sheet87 Consolidated cash flow statement87 Reconciliation of net cash flow
to movement in net debt88 Significant accounting policies93 Notes to the accounts108 Investment policy109 Portfolio valuation methodology110 Information for shareholders
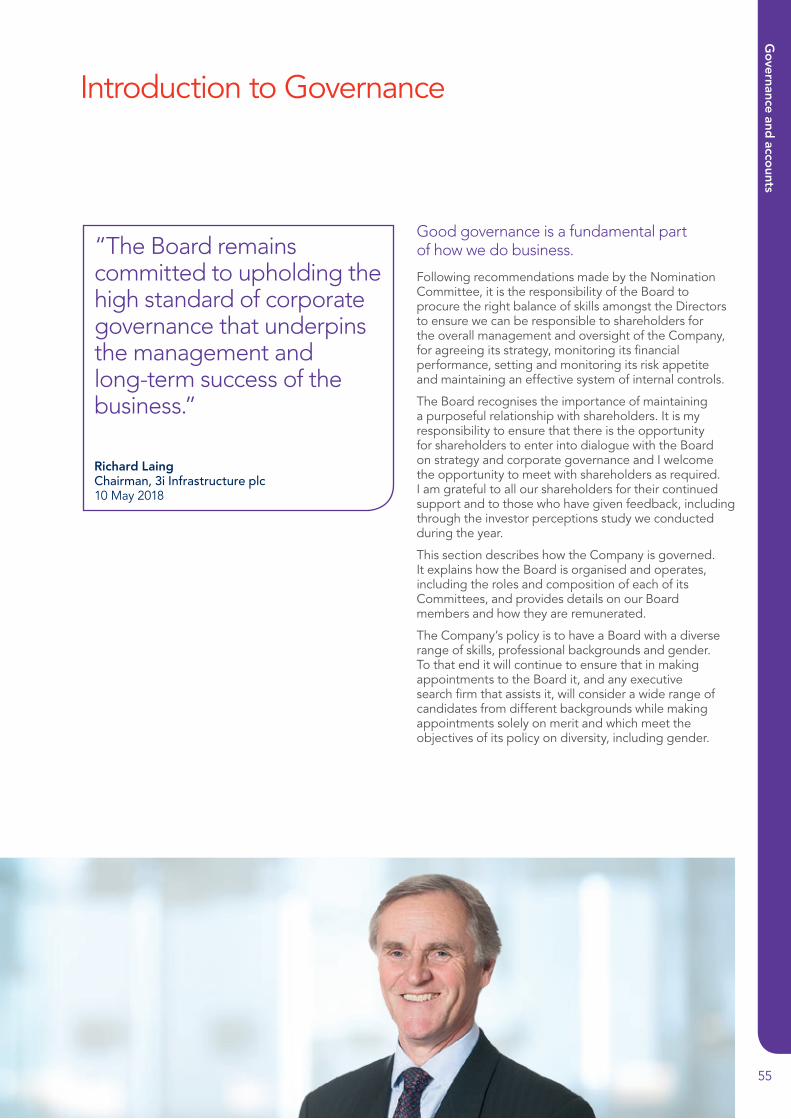
Introduction to Governance
Good governance is a fundamental part of how we do business.
Following recommendations made by the Nomination Committee, it is the responsibility of the Board to procure the right balance of skills amongst the Directors to ensure we can be responsible to shareholders for the overall management and oversight of the Company, for agreeing its strategy, monitoring its financial performance, setting and monitoring its risk appetite and maintaining an effective system of internal controls.
The Board recognises the importance of maintaining a purposeful relationship with shareholders. It is my responsibility to ensure that there is the opportunity for shareholders to enter into dialogue with the Board on strategy and corporate governance and I welcome the opportunity to meet with shareholders as required. I am grateful to all our shareholders for their continued support and to those who have given feedback, including through the investor perceptions study we conducted during the year.
This section describes how the Company is governed. It explains how the Board is organised and operates, including the roles and composition of each of its Committees, and provides details on our Board members and how they are remunerated.
The Company’s policy is to have a Board with a diverse range of skills, professional backgrounds and gender. To that end it will continue to ensure that in making appointments to the Board it, and any executive search firm that assists it, will consider a wide range of candidates from different backgrounds while making appointments solely on merit and which meet the objectives of its policy on diversity, including gender.
Richard LaingChairman, 3i Infrastructure plc10 May 2018
“The Board remains committed to upholding the high standard of corporate governance that underpins the management and long-term success of the business.”
55
Governance and
accounts

Leadership
Board of Directors
Robert JenningsNon-executive Director
Wendy DormanNon-executive Director
Richard LaingNon-executive Chairman
Doug BannisterNon-executive Director
Robert brings significant experience as a corporate financier in the UK, European and Asian infrastructure markets. In his career he has focused particularly on railways and water but also has experience of airports, ports and ferries and renewable energy. He previously worked in HM Treasury as a special adviser to the transport team.
He has been Chairman of Sequoia Economic Infrastructure Income Fund Limited since its inception in 2015, and is the Department for Transport nominated non-executive director with Crossrail Limited.
He was Chairman of Southern Water until February 2017.
He qualified as a Chartered Accountant early in his career and was joint head of UBS’s Infrastructure Advisory business until he retired from the bank in 2007.
Board member since 1 February 2018, resident in the UK.
Richard brings long-standing experience of investing in international infrastructure along with a deep knowledge of investment companies and financial matters.
Richard was Chief Executive of CDC Group plc from 2004 to 2011, having joined the organisation in 2000 as Finance Director. Prior to CDC, he spent 15 years at De La Rue, latterly as the Group Finance Director. He also worked in agribusiness and at PricewaterhouseCoopers and Marks & Spencer. His current non-executive appointments include chairman roles at Perpetual Income and Growth Investment Trust plc and Miro Forestry, and director roles at JPMorgan Emerging Markets Investment Trust plc and Plan International UK.
He is a Fellow of the Institute of Chartered Accountants in England and Wales (FCA).
Board member since 1 January 2016, resident in the UK.
Chairman of the Nomination Committee and Management Engagement Committee.
Doug has over 25 years of experience in the transportation sector, having led businesses trading around the world for P&O Nedlloyd and Maersk Line. He became Group CEO of the Ports of Jersey (Airport & Harbours) in 2011, with responsibility for the Island’s strategic aviation and maritime assets.
Doug provides experience in turnaround, restructuring and transformation of capital intense businesses to the Board, as well as specific knowledge in transportation and distribution sectors.
In 2016, Doug was awarded the Institute of Directors Jersey Director of the Year for large businesses.
Board member since 1 January 2015, resident in Jersey.
Wendy brings to the Board leadership and corporate governance experience, alongside expertise in accounting and taxation.
Wendy has over 25 years’ tax experience, principally in the taxation of UK and offshore investment funds, advising on tax aspects of fund structuring, risk mitigation and compliance. She led the Channel Islands tax practice of PwC from 2008 to 2015. Wendy was Chairman of the Jersey branch of the Institute of Directors from 2014 to 2016 and is a former President of the Jersey Society of Chartered and Certified Accountants.
She is a non-executive director of Jersey Electricity plc and Jersey Finance Limited and Chairman of the Audit and Risk Committee of CQS New City High Yield Fund Limited.
Wendy is a Chartered Accountant.
Board member since 1 March 2015, resident in Jersey.
Chairman of the Audit and Risk Committee.
3i Infrastructure plc Annual report and accounts 2018
Governance and accounts
56

Ian LobleyNon-executive Director
Paul MastertonNon-executive Director, Senior Independent Director
Paul brings extensive experience in leading and developing large companies, mergers and acquisitions, together with an international business perspective having worked in the USA, Europe and Asia.
He spent 25 years with RR Donnelley, latterly as president for the company’s businesses in Europe, Russia and India. More recently Paul chaired and led the formation of Digital Jersey, a development agency, and brings a digital technology perspective to the Board.
His current non-executive appointments include Insurance Corporation CI (Chair), Jersey Development Company (Senior Independent Director), and the Channels Islands Competition & Regulation Authority.
Board member since April 2013, resident in Jersey.
Chairman of the Remuneration Committee.
Ian has been a Partner at 3i since 1994 and has been an active investor and board member across Europe, Asia and the USA.
In his role as Managing Partner – Asset Management, Ian has responsibility for investments in companies across a variety of sectors and is an experienced board member across multiple geographies.
Over 30 years of investing and asset management, combined with an engineering background, allows Ian to bring valuable experience and insight into the assessment of new investments and the management of the portfolio to the 3 Infrastructure board. He is a member of the 3i Group Investment Committee.
Board member since 6 May 2014, resident in the UK.
3i Infrastructure plc Annual report and accounts 2018 57
Governance and
accounts
The Board encourages a culture of strong governance across the business, and adheres to the requirements of the UK Corporate Governance Code (the ‘Code’).
LeadershipThe Board provides leadership either directly or through the operation of its Committees. The Chairman is ultimately responsible for the make-up and composition of the Board to best deliver the business strategy.
Further detail on leadership can be found on page 56
EffectivenessThe Board sets the strategic objectives and approves and monitors performance against budgets and forecasts. An evaluation process is regularly undertaken to ensure Board members have the necessary skills.
Further detail on effectiveness can be found on page 62
Relations with shareholdersMaintaining strong relationships with both private and institutional shareholders is crucial in helping us achieve our aims. We hold meetings and events throughout the year to maintain an open and transparent dialogue with them.
Further detail on relations with shareholders can be found on page 67
AccountabilityThe Board is responsible for establishing and maintaining the risk management and internal control systems and exercises oversight of the risk management framework through the Audit and Risk Committee.
Further detail on accountability can be found on page 68
RemunerationThe role of the Remuneration Committee is to determine and maintain a fair reward structure that attracts and retains the right talent and incentivises non-executive Directors to deliver strategic objectives and maintain stability of management.
Further detail on remuneration can be found on page 73
Oversight of the Investment AdviserThe Management Engagement Committee oversees the relationship with the Investment Adviser and monitors its performance.
Further detail on oversight of the Investment Adviser can be found on page 72
The Directors’ statement contains the corporate governance statement required by FCA Disclosure and Transparency Rule 7.2.
The Company is committed to upholding the highest standards of corporate governance. It observes the requirements of the UK Corporate Governance Code (the ‘Code’), a copy of which is available from the Financial Reporting Council website (www.frc.org.uk), subject to the FCA’s Listing Rule 15.6.6(2), and to the extent applicable to the Company, given that it has no Executive Directors. The Code applies to all companies with a Premium Listing on the London Stock Exchange, irrespective of their country of incorporation.
The Company complied with all the provisions of the Code for the financial year ended 31 March 2018 except as set out below:
a) the role of the chief executive, b) executive directors’ remuneration, c) the need for an internal audit function. The Board considers that these provisions are not relevant to the Company as it is an externally managed investment company. In particular, all of the Company’s day-to-day management and administrative functions are outsourced to third parties. As a result, the Company has no executive directors, employees or internal operations. The Company has therefore not reported further in respect of these provisions.
The Board adopted a code for Directors’ dealings in ordinary shares following the implementation of the EU Market Abuse Regulation (‘MAR’) on 3 July 2016. The Board is responsible for taking all proper and reasonable steps to ensure compliance with MAR by the Directors.
Leadership
Governance structure
3i Infrastructure plc Annual report and accounts 2018
Governance and accounts
58
Leadership
Role of the Board
Overview3i Infrastructure has no employees and its investment and portfolio monitoring activities are carried out by 3i Investments plc, its Investment Adviser, under the Investment Advisory Agreement. It is the Board’s responsibility to ensure that the Company has a clear strategy and that its Investment Adviser has the resources and structures to support the delivery of this strategy.
The Board also has direct access to the Company’s external advisers, including the Company’s corporate brokers, financial adviser and legal advisers. The Board receives advice on a range of subjects but particularly on the infrastructure market, UK and Jersey legal matters and equity market issues.
Board of Directors and CommitteesThe Board is assisted in its activities by a number of standing committees of the Board and, in undertaking its duties, it delegates certain authorities and decisions to these Committees. The Board reviews the membership of these Committees on a regular basis. The Board committee structure, together with a summary of the roles and composition of the Committees, is outlined in the table on page 60.
The Chairman is responsible for the leadership of the Board and ensuring its effectiveness. He is also responsible for organising the business of the Board and setting its agenda. In addition to the Chairman, there are currently four independent non-executive Directors and one 3i Group plc nominee, who is not considered to be independent.
The Committees have terms of reference, which are available on www.3i-infrastructure.com
Further details on the key responsibilities and areas of focus of the Board and its Committees, as well as details on attendance at full Board meetings, are set out on pages 61 to 74.
Changes to the Board of DirectorsOn 31 December 2017, Steven Wilderspin stepped down as a Director of the Company after 10 years’ service on the Board and Wendy Dorman was appointed as Chair of the Audit and Risk Committee in his stead with effect from 1 January 2018. Robert Jennings was appointed as an independent non-executive Director with effect from 1 February 2018.
The Board’s responsibilities and processesThe Board is responsible to shareholders for the overall management of the Company. It determines matters including financial strategy and planning and takes all investment and divestment decisions, taking into account the advice it receives from the Investment Adviser who provides reports and papers that are circulated to the Directors in a timely manner in preparation for Board and Committee meetings. These papers are supplemented by information specifically requested by the Directors from time to time.
The Board has put in place an organisational structure to ensure the efficient performance of its responsibilities. This is further described under the heading ‘Internal control’ on page 65.
3i Infrastructure plc Annual report and accounts 2018 59
Governance and
accounts

The ChairmanThe Chairman, Richard Laing, leads the Board in the determination and implementation of its strategy. The Chairman is responsible for organising the business of the Board, ensuring its effectiveness and setting its agenda. The Chairman also acts as the Company’s appointed member to the Advisory Board for the 3i India Infrastructure Fund. He receives no additional remuneration for this role. The Chairman facilitates the effective contribution of all the Directors and constructive relations between the Company’s advisers, including the Investment Adviser, and the Directors. The Chairman maintains direct links with the Company’s advisers and ensures that regular reports from them are circulated to the Directors to enable the Directors to remain aware of shareholders’ views. The Chairman ensures, with the co-operation of the Investment Adviser, that a programme of effective communications with shareholders is in place, including with the Chairman and Senior Independent Director, when shareholders so wish.
Senior Independent DirectorPaul Masterton is the Senior Independent Director. In accordance with the Code, any shareholder concerns can be conveyed to the Senior Independent Director. The contact details of the Senior Independent Director are freely available on the Company’s website or through the Company Secretary.
DirectorsThe Board comprises the Chairman and five non-executive Directors. Biographical details for each of the Directors are set out on pages 56 and 57. All Directors served throughout the year under review, with the exception of Steven Wilderspin, who served until 31 December 2017 and Robert Jennings, who was appointed with effect from 1 February 2018.
No Director has a service contract with the Company, nor are any such contracts proposed. The Directors were elected or re-elected at the Company’s AGM, with Robert Jennings standing for election for the first time at the forthcoming AGM on 5 July 2018. Each of the Directors has an appointment letter which reflects the best practice guidelines published in December 2011 by the Institute of Chartered Secretaries and Administrators.
Following the formal appraisal process of Directors, and in accordance with Section B.7.2 of the Code, the Chairman will propose the election or re-election of all Directors at the forthcoming AGM.
Copies of the appointment letters are available from the Company Secretary upon request.
Leadership
Role of the Board continued
3i Infrastructure plc Board Committees
Audit and Risk CommitteeFinancial reporting, risk and internal controls
Management Engagement CommitteeMonitoring of the performance of the Investment Adviser
Investment CommitteeAcquisition, monitoring and disposal of investments
Remuneration CommitteeDirector remuneration
Nomination CommitteeBoard appointments and size, balance and composition
Disclosure CommitteeTimely and accurate of disclosure of all information
Wendy Dorman(Chair)
Doug BannisterRobert JenningsPaul Masterton
Richard Laing(Chair)
Doug BannisterWendy DormanRobert JenningsPaul Masterton
All Directors Paul Masterton(Chair)
Doug BannisterWendy DormanRobert JenningsRichard Laing
Richard Laing(Chair)
Wendy DormanPaul Masterton
Richard LaingDoug BannisterWendy DormanRobert JenningsPaul Masterton
See more onpage 68
See more onpage 72
See more onpage 73
See more onpage 71
3i Infrastructure plc Annual report and accounts 2018
Governance and accounts
60
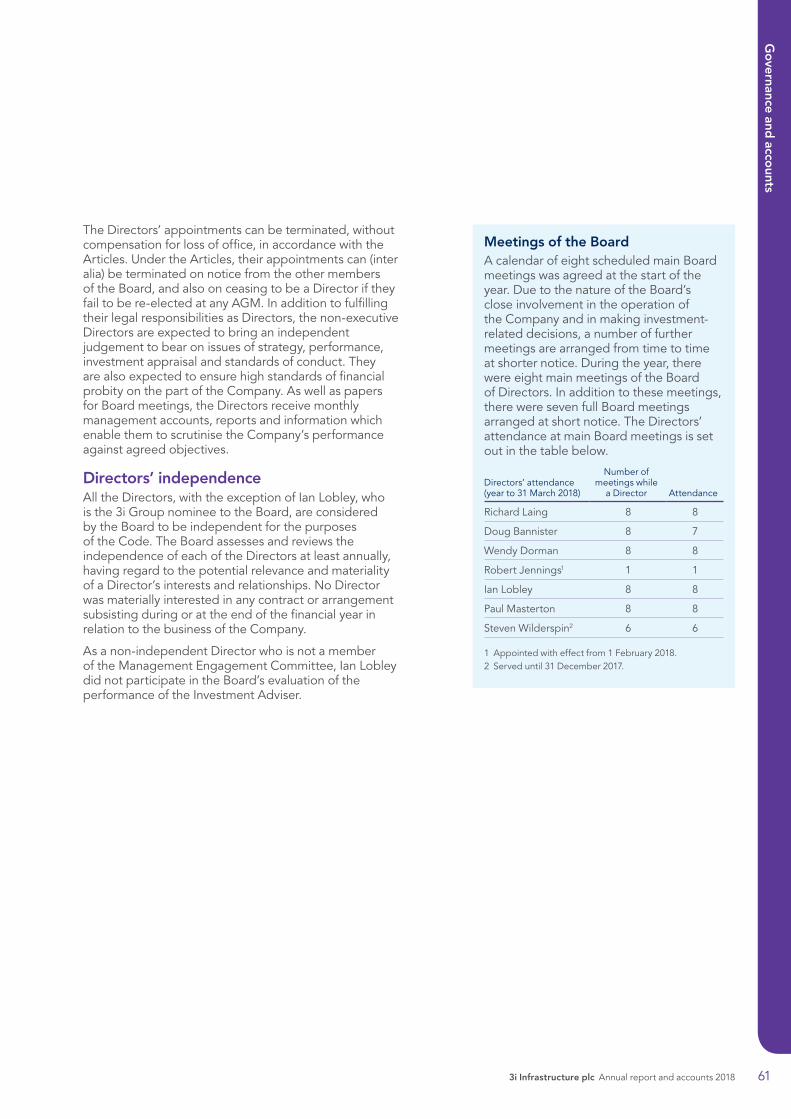
Meetings of the BoardA calendar of eight scheduled main Board meetings was agreed at the start of the year. Due to the nature of the Board’s close involvement in the operation of the Company and in making investment-related decisions, a number of further meetings are arranged from time to time at shorter notice. During the year, there were eight main meetings of the Board of Directors. In addition to these meetings, there were seven full Board meetings arranged at short notice. The Directors’ attendance at main Board meetings is set out in the table below.
Directors’ attendance (year to 31 March 2018)
Number of meetings while
a Director Attendance
Richard Laing 8 8
Doug Bannister 8 7
Wendy Dorman 8 8
Robert Jennings1 1 1
Ian Lobley 8 8
Paul Masterton 8 8
Steven Wilderspin2 6 6
1 Appointed with effect from 1 February 2018.2 Served until 31 December 2017.
The Directors’ appointments can be terminated, without compensation for loss of office, in accordance with the Articles. Under the Articles, their appointments can (inter alia) be terminated on notice from the other members of the Board, and also on ceasing to be a Director if they fail to be re-elected at any AGM. In addition to fulfilling their legal responsibilities as Directors, the non-executive Directors are expected to bring an independent judgement to bear on issues of strategy, performance, investment appraisal and standards of conduct. They are also expected to ensure high standards of financial probity on the part of the Company. As well as papers for Board meetings, the Directors receive monthly management accounts, reports and information which enable them to scrutinise the Company’s performance against agreed objectives.
Directors’ independenceAll the Directors, with the exception of Ian Lobley, who is the 3i Group nominee to the Board, are considered by the Board to be independent for the purposes of the Code. The Board assesses and reviews the independence of each of the Directors at least annually, having regard to the potential relevance and materiality of a Director’s interests and relationships. No Director was materially interested in any contract or arrangement subsisting during or at the end of the financial year in relation to the business of the Company.
As a non-independent Director who is not a member of the Management Engagement Committee, Ian Lobley did not participate in the Board’s evaluation of the performance of the Investment Adviser.
3i Infrastructure plc Annual report and accounts 2018 61
Governance and
accounts
Effectiveness
Board activity during the year
The Board’s responsibilities are set out on page 59. The principal matters considered by the Board during the year in relation to those responsibilities included the following:
Matters reserved for the Board
The Board has approved a formal schedule of matters reserved to it and the Audit and Risk Committee for decision. The matters reserved for the Board include:• approval of the Company’s overall strategy, plans and annual operating budget; • approval of the Company’s half-yearly and annual financial statements and changes
in the Company’s accounting policies or practices; • approval of changes relating to the capital structure of the Company or its
regulated status; • approval of the appointment and removal of the Investment Adviser and annual
review and continued approval of key agreements with service providers, including the Investment Advisory Agreement with 3i Investments plc; and
• approval of major changes in the nature of business operations or investment policy.
Investment activity • approval of new investment decisions, including the decision to invest in Attero, Alkane Energy and follow-ons in ESVAGT, Oystercatcher, WIG and Infinis;
• approval of divestment decisions for Elenia and AWG;• review of regular reports from the Investment Adviser relating to the infrastructure
market and early stage work-in-progress investment opportunities; and• ongoing review of market opportunities in a number of European and target
geographies.
Strategy and returns An explanation of the business model and strategy for delivering the objectives of the Company is set out on pages 8 to 10.
The Board conducted a review of the Company’s strategy through a series of Board meetings, taking advice from the Investment Adviser, the Company’s corporate brokers and financial adviser. These meetings involved the following:• review of the infrastructure market segments in which the Company operates, and
of competitors’ activity and the returns available from investing in those markets;• approval to maintain the Company’s target total return at 8–10% over
the medium term;• approval to maintain the dividend policy targeting a progressive annual dividend
per share;• approval of the dividend target for FY18 of 7.85 pence per share, as announced
with the Company’s full-year results to 31 March 2017;• regular reviews of portfolio asset performance, including the underlying
performance of assets within the India Fund and review of the expected future returns from the portfolio;
• review of the recommendations of the Investment Adviser on the valuation of portfolio investments, including the benchmarking of those valuations in the context of prevailing market conditions; and
• review of an investor perception study commissioned by the Board and regular reviews of feedback from shareholders following strategic and financial announcements.
3i Infrastructure plc Annual report and accounts 2018
Governance and accounts
62

Manage relations with the Investment Adviser
• a review with the Investment Adviser of its origination and asset management capabilities;
• formal evaluation of the performance of the Investment Adviser; and
• a review of the merits of moving to an investment management agreement, and the terms of such an agreement with 3i Investments plc, with the intention of moving the tax domicile and management of the Company to the UK with effect from 1 October 2018.
Financial management
• management of the Company’s liquidity and review of the Company’s liquidity policy;• approval for the Company to return £425 million of capital to shareholders through
a special dividend and also for a 15 for 19 share consolidation;• review of the Company’s existing revolving credit facility (‘RCF’) and approval in
April 2017 to extend this three-year facility by one year to May 2020, with a further extension in May 2018 to May 2021 through a refinancing of the facility;
• approval in April 2017 of an increase in the size of the RCF from £300 million to £500 million on a temporary basis to March 2018. This increase was cancelled in February 2018 following receipt of the proceeds from the divestment of AWG;
• ongoing review of foreign exchange hedging;• review and ongoing monitoring of the OECD’s Action Plan on Base Erosion and
Profit Shifting;• approval of the Company’s annual budget for the year to 31 March 2018; and• assessment of the Company’s viability through consideration of scenario
and stress testing.
Other matters considered by the Board included:• succession planning;• the Board considered the market practice for offering a scrip dividend alternative
to shareholders;• compliance with PRIIPs regulation and approval of the Company’s Key Information
Document; and• the impact of and adherence to GDPR regulation.
3i Infrastructure plc Annual report and accounts 2018 63
Governance and
accounts

Effectiveness
Evaluation and training
The following recommendations were made following the review this year:• to continue to address the future composition and
succession requirements for the Board, particularly in light of the intention to move management of the Company to the UK;
• to have greater review of the effectiveness of past decisions; and
• to increase focus on risk mitigation plans across the portfolio and the differentiation of strategy relative to other UK listed infrastructure companies.
It is envisaged that the Board evaluation next year will follow up on the themes and recommendations from this review to ensure that progress is assessed and measured.
Investment AdviserThe Board has a Management Engagement Committee (comprising all Board members, with the exception of Ian Lobley, the 3i Group nominee Director) which carries out the annual evaluation of the Investment Adviser required under the Listing Rules and which manages the relationship with the Investment Adviser on behalf of the Company. During the year, the Committee assessed the performance of the Investment Adviser. Following its assessment, and based on the good performance of the Investment Adviser, the Directors believe that the continued appointment of the Investment Adviser on the terms set out in Note 18 on page 105 is in the interest of shareholders.
The Company SecretaryThe Company has appointed Link Alternative Fund Services (Jersey) Limited (formerly known as Capita Financial Administrators (Jersey) Limited) as Company Secretary.
All Directors have access to the advice and services of the Company Secretary, which advises the Board, through the Chairman, on governance matters. The Company’s Articles of Association (the ‘Articles’) and the schedule of matters reserved for the Board provide that the appointment and removal of the Company Secretary would be a matter for the full Board.
The Board reviewed the Company Secretary’s performance during the year and approved its continued appointment.
The Board intends to move management of the Company to the UK with effect from 1 October 2018. The provision of residual services required to remain in Jersey is under review as part of the project plan to change domicile.
Performance evaluationBoard and CommitteesThe Company engaged Lintstock, a specialist consultancy that is independent of the Company and the Investment Adviser, in 2017 to undertake an evaluation of the performance of the Board of Directors and its Committees. The Lintstock engagement spans a three-year period, with this, the second year, involving the completion by all Directors of a questionnaire. The Managing Partner and Chief Financial Officer from the Investment Adviser also completed the questionnaire.
The anonymity of all respondents to the questionnaire was maintained in order to promote the open and frank exchange of views.
Lintstock subsequently produced a report for the Board addressing the following:• the composition of the Board, and the attributes
required in new non-executive appointments;• the Board’s understanding of the views and
requirements of investors, and of the infrastructure markets in which the company invests;
• the relationships between Board members including the atmosphere of meetings;
• the performance of and the Board’s relationship with the Investment Adviser;
• the management and focus of the Board meetings, and the quality of the information and support provided to the Board;
• the Board’s oversight of risk and strategy, and the overall effectiveness of the annual strategy day;
• the Directors’ views of the top strategic issues facing the Company; and
• the performance of the Audit and Risk, Nomination and Remuneration Committees, the Chairman, and that of individual Directors.
The Board noted that the results of the review showed a high degree of overall satisfaction with the composition and expertise of the Board, and the dynamics between Directors. The performance of the Board was seen to have improved since the previous year’s review. The effectiveness of the Investment Adviser was also rated very highly.
It was noted that progress had been made against the recommendations made in the previous year’s review, with consideration given to a number of issues such as: the composition of the Board including expertise, thought processes and style of Directors; preparation for when Directors stand down; and succession planning. The relationship with the Investment Adviser was rated highly, with ongoing improvement in the information provided to the Board and increased contact with the wider investment advisory team.
3i Infrastructure plc Annual report and accounts 2018
Governance and accounts
64

Appointment and re-election of DirectorsThe appointment and replacement of Directors is governed by the Articles, the Companies (Jersey) Law 1991 and related legislation. The Articles provide that at each Annual General Meeting of the Company all the directors at the date of notice convening the annual general meeting shall retire from office and each director may offer himself or herself for election. In addition, under the Code, all directors of FTSE 350 companies should be subject to annual election by shareholders. As a result, all Directors will voluntarily retire and stand for election or re-election at the 2018 AGM.
Portfolio management and voting policyIn relation to unquoted investments, the Company’s approach is to seek to add value to the businesses in which it invests through the extensive experience, resources and contacts of the Investment Adviser’s team. In relation to quoted equity investments, the Company’s policy is to exercise voting rights on matters affecting the interests of the Company.
Internal controlThe Board is ultimately responsible for the Group’s system of internal control. The Audit and Risk Committee performed its annual review of the system’s effectiveness and reported its conclusions to the Board. The internal control system, which has been in place throughout the year and up to the date of approval of the Annual report, is designed to manage rather than eliminate the risk of failure to achieve business objectives and can provide only reasonable and not absolute assurance against material misstatement or loss.
The Board has contractually delegated investment advisory and support services to its key service providers and their contractual obligations encompass the implementation of systems of internal control, including financial, operational and compliance controls and risk management. The Audit and Risk Committee of the Company receives reports on the control systems and their operation from its main service providers, including from the internal audit and compliance departments of the Investment Adviser, and is responsible for reviewing these reports for determining the effectiveness of internal controls.
In addition, the Board regularly reviews the principal risks faced by the Company and any entries in the Company’s risk log.
Training and developmentThe Company has developed a framework within which training for Directors is planned, with the objective of ensuring that the Directors understand the duties and responsibilities of being a director of a listed company and the business environment of the Company. All Directors are required continually to update their skills and maintain their familiarity with the Company and its business. Presentations on different aspects of the Company’s business are made regularly to the Board, usually by the Investment Adviser, but on occasion by other advisers, including the Company’s corporate brokers and financial adviser, and the Company’s legal advisers.
On appointment, all Directors have discussions with the Chairman and Company Secretary, following which appropriate briefings on the responsibilities of Directors, the Company’s business, the Company’s procedures and, where appropriate, briefings on the infrastructure market are arranged with the Investment Adviser and other experts. The Company provides opportunities for Directors to obtain a thorough understanding of the Company’s business and the industry it operates in by meeting senior members of the investment advisory team who in turn can arrange, as required, visits to portfolio investments or support teams.
This year, the Directors received presentations on aspects of the infrastructure market and briefings in relation to changes to laws and regulations in Jersey and the UK, which included briefings on PRIIPS, GDPR, MiFID II and OECD Base Erosion and Profit Shifting (‘BEPS’).
The Company has procedures for Directors to take independent legal or other professional advice about the performance of their duties.
3i Infrastructure plc Annual report and accounts 2018 65
Governance and
accounts
Effectiveness
Evaluation and training continued
The Company’s control policies and procedures, which are in accordance with the Financial Reporting Council’s guidance on risk management, internal control and related financial and business reporting, have been in place throughout the financial year and up to the date this report was approved. Key controls are outlined below:• the Investment Advisory and Support Services
agreements specifically define the roles and responsibilities of the Investment Adviser and the service providers. These agreements set out information and reporting systems for monitoring the Company’s investments and their performance;
• the Board considers and approves the Company’s strategy and approves a budget on an annual basis;
• reports on the planning, forecasting and controlling of expenditure and the making of investments are regularly submitted to the Board and reviewed in detail;
• the Investment Adviser’s procedures for evaluating investments include detailed appraisals and due diligence that are reviewed by the Board as appropriate;
• the Investment Adviser and the service providers prepare valuations and management accounts which allow the Board to assess the Company’s activities and review its performance;
• the Investment Adviser’s compliance and internal audit departments continually review the Investment Adviser’s operations. The Audit and Risk Committee has access to relevant sections of their reports;
• the Investment Adviser and the service providers prepare the half-yearly and annual accounts of the Group and monitor all associated financial reporting processes that are reviewed by the Board as appropriate; and
• the Investment Adviser and the service providers notify the Board of any changes in accounting standards which may impact the Company’s significant accounting policies or any other statutory requirements which may subsequently impact the financial statements.
The Company does not have a separate internal audit function as it is not deemed appropriate given the structure of the Company. This is reviewed annually by the Audit and Risk Committee.
Principles and processesThe Company adopts a set of key controls including:
• a planning framework which incorporates a Board- approved medium-term strategy;
• formal business and operating risk reviews which evaluate the potential financial impact and likelihood of identified risks and possible new risk areas;
• the setting of control, mitigation and monitoring procedures and the review of actual occurrences, identifying lessons to be learned;
• a comprehensive system of financial reporting to the Board, based on an annual budget with monthly reporting of actual results, analysis of variances, scrutiny of key performance measures and regular reforecasting;
• regular treasury reports to the Board, which analyse the funding requirements, track the generation and use of capital and the volume of liquidity and record the level of compliance with the Company’s funding objectives;
• well defined procedures governing the appraisal and approval of investments, including detailed investment and divestment approval procedures, incorporating appropriate levels of authority and regular post-investment reviews; and
• an Audit and Risk Committee which considers significant control matters and receives relevant reports from key service providers’ compliance or internal audit functions.
3i Infrastructure plc Annual report and accounts 2018
Governance and accounts
66

The Company’s website provides a description of its strategy and portfolio, as well as a full archive of news and historical financial information and details of forthcoming events for shareholders and analysts.
www.3i-infrastructure.com
Relations with shareholders
Approach to Investor RelationsThe Board recognises the importance of maintaining a purposeful relationship with shareholders and the Company has a comprehensive Investor Relations programme, devised and implemented by the Investment Adviser, to help existing and potential investors to understand its activities, strategy and financial performance. The Chairman maintains a dialogue with shareholders on strategy and corporate governance as required and shareholders are offered the opportunity to meet with the Chairman and with the Senior Independent Director. The Board receives updates from the Chairman and the Investment Adviser following shareholder meetings, as well as updates from the Company’s brokers on shareholder issues. Directors are invited to attend the Company’s presentations to analysts and have the opportunity to meet shareholders at the AGM.
Board oversight The Investment Adviser briefs the Board on a regular basis on the implementation of the Investor Relations programme and on feedback received from analysts and investors. Any significant concern raised by shareholders in relation to the Company is communicated to the Board. Research published by investment banks on the Company is circulated to the Board on a regular basis.
The Company commissioned an investor perceptions study by Rothschild to obtain feedback from shareholders. This confirmed the favourable opinion shareholders have of the Company’s strategy, financial management and governance.
The Board also receives periodic feedback from existing shareholders and potential investors through the Company’s corporate brokers and advisers: JPMorgan Cazenove, RBC Capital Markets and Scott Harris.
Annual General Meeting The Company uses its AGM as an opportunity to communicate with its shareholders. At the meeting, business presentations are generally made by the Chairman and the Investment Adviser. The Senior Independent Director and chairman of the Audit and Risk Committee are also generally available to answer shareholders’ questions.
Extraordinary General Meeting The Company held an EGM on 14 March 2018 at which shareholders approved a share consolidation of 15 new ordinary shares for 19 existing ordinary shares, undertaken in conjunction with a special dividend of 41.4 pence per existing ordinary share.
Capital Markets day The Company held a Capital Markets day on 14 March 2018 for shareholders and analysts. Presentations were given by members of the investment advisory team and portfolio company management.
Annual and half-yearly results presentations The Chairman and Investment Adviser present the annual and half-yearly results to a broad group of analysts.
Individual investors Individual investors are encouraged to engage with the Company and provide feedback through the Company Secretary, who can be contacted at [email protected] or by telephone on +44 (0)1534 847 410.
Institutional investor programme
May
The Investment Adviser meets with existing and potential investors as required following the release of the Company’s annual results. The Investment Adviser holds regular meetings with existing and potential investors in the UK and internationally to communicate the strategy and performance of the Company.
July
The AGM is an opportunity for the Company’s Directors and members of the Investment Advisory team to meet attending investors in person.
Nov
Following the release of the Company’s half-year results, the Investment Adviser holds meetings with existing and potential investors in the UK and internationally to communicate the strategy and performance of the Company.
These meetings continue throughout the year, as required.
3i Infrastructure plc Annual report and accounts 2018 67
Governance and
accounts
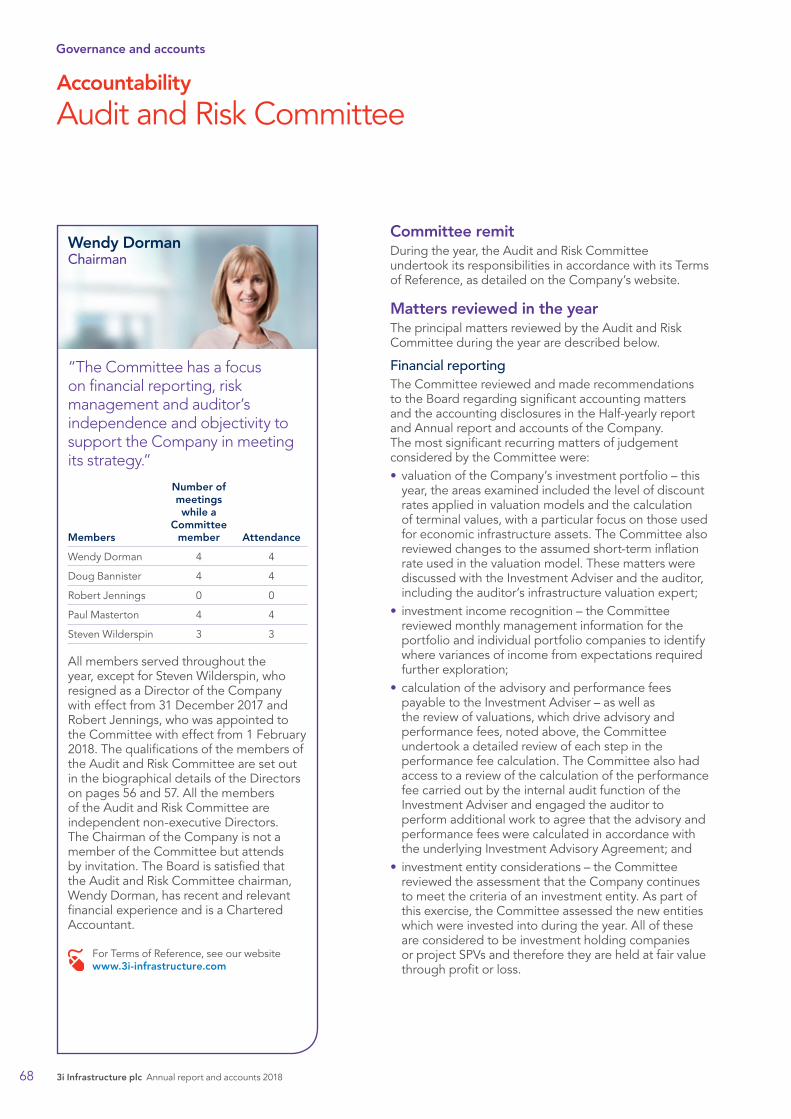
Accountability
Audit and Risk Committee
“The Committee has a focus on financial reporting, risk management and auditor’s independence and objectivity to support the Company in meeting its strategy.”
Members
Number of meetings while a
Committee member Attendance
Wendy Dorman 4 4
Doug Bannister 4 4
Robert Jennings 0 0
Paul Masterton 4 4
Steven Wilderspin 3 3
All members served throughout the year, except for Steven Wilderspin, who resigned as a Director of the Company with effect from 31 December 2017 and Robert Jennings, who was appointed to the Committee with effect from 1 February 2018. The qualifications of the members of the Audit and Risk Committee are set out in the biographical details of the Directors on pages 56 and 57. All the members of the Audit and Risk Committee are independent non-executive Directors. The Chairman of the Company is not a member of the Committee but attends by invitation. The Board is satisfied that the Audit and Risk Committee chairman, Wendy Dorman, has recent and relevant financial experience and is a Chartered Accountant.
For Terms of Reference, see our website www.3i-infrastructure.com
Committee remitDuring the year, the Audit and Risk Committee undertook its responsibilities in accordance with its Terms of Reference, as detailed on the Company’s website.
Matters reviewed in the yearThe principal matters reviewed by the Audit and Risk Committee during the year are described below.
Financial reportingThe Committee reviewed and made recommendations to the Board regarding significant accounting matters and the accounting disclosures in the Half-yearly report and Annual report and accounts of the Company. The most significant recurring matters of judgement considered by the Committee were:• valuation of the Company’s investment portfolio – this
year, the areas examined included the level of discount rates applied in valuation models and the calculation of terminal values, with a particular focus on those used for economic infrastructure assets. The Committee also reviewed changes to the assumed short-term inflation rate used in the valuation model. These matters were discussed with the Investment Adviser and the auditor, including the auditor’s infrastructure valuation expert;
• investment income recognition – the Committee reviewed monthly management information for the portfolio and individual portfolio companies to identify where variances of income from expectations required further exploration;
• calculation of the advisory and performance fees payable to the Investment Adviser – as well as the review of valuations, which drive advisory and performance fees, noted above, the Committee undertook a detailed review of each step in the performance fee calculation. The Committee also had access to a review of the calculation of the performance fee carried out by the internal audit function of the Investment Adviser and engaged the auditor to perform additional work to agree that the advisory and performance fees were calculated in accordance with the underlying Investment Advisory Agreement; and
• investment entity considerations – the Committee reviewed the assessment that the Company continues to meet the criteria of an investment entity. As part of this exercise, the Committee assessed the new entities which were invested into during the year. All of these are considered to be investment holding companies or project SPVs and therefore they are held at fair value through profit or loss.
Wendy DormanChairman
3i Infrastructure plc Annual report and accounts 2018
Governance and accounts
68
The Committee considered the requirements of the UK Companies Act 2006 (Strategic Report and Directors’ Report) Regulations 2013 with which it is complying voluntarily, in line with best practice reporting. The Committee specifically reviewed the Annual report and accounts to conclude whether the financial reporting is fair, balanced, understandable, comprehensive and consistent with how the Board assesses the performance of the Company’s business during the financial year, as required for companies with a Premium Listing under the Code. As part of this review, the Committee considered if the Annual report and accounts provided the information necessary to shareholders to assess the Company’s position, performance, strategy and business model and reviewed the description of the Company’s Key Performance Indicators.
In addition to the above matters, the Committee reviewed the following areas:• valuation of derivative financial instruments; • post balance sheet events;
• the impact of upcoming accounting standards;
• the section on significant accounting polices was restructured to acknowledge the comments made in the Financial Reporting Council’s recently published Corporate reporting thematic review; and
• other changes in presentation within the report to improve clarity for users.
The Committee also reviewed its Terms of Reference to ensure that the Committee is still operating effectively.
The Committee presented its conclusions on the above areas to the Board and advised the Board that it considered the Annual report and accounts, taken as a whole, to be fair, balanced and understandable and that it provides the information necessary for the shareholders to assess the Company’s position, performance, business model and strategy.
External auditShareholders approved at the AGM in July 2017 that Deloitte LLP be appointed as external auditor for the year ended 31 March 2018. Jacqueline Holden has been the audit partner for Deloitte LLP since appointment. Deloitte LLP replaced Ernst and Young LLP who had been the Company’s auditor since inception in 2007. There were no matters in connection with Ernst & Young LLP’s retirement as auditor which needed to be brought to the attention of shareholders.
The Audit and Risk Committee reviewed the effectiveness of the external audit process during the year, considering performance, objectivity, independence and relevant experience demonstrated by reports and presentations from the audit team and discussion with the Investment Adviser, and concluded that Deloitte LLP’s appointment as the Company’s auditor should be continued.
The Committee monitors the external auditor’s independence and objectivity, taking into consideration relevant professional and regulatory requirements. As part of this review, the Committee monitors the Company’s policy for non-audit services to ensure that the provision of such services by the external auditor does not impair the auditor’s independence or objectivity. The Committee reviewed and updated the policy for non-audit services during the year. In order to safeguard auditor objectivity and independence, the chairman of the Audit and Risk Committee is required to approve all non-audit work undertaken by the auditor for the Company and its subsidiaries in advance, and as a general rule the auditor will not be engaged on investment-related work. However, exceptions to this may be permitted if (i) the Company is acting in a consortium, (ii) the auditor is considered a specialist in the sector, or (iii) the auditor is best placed to undertake the work through its knowledge of the Company’s financial systems, procedures and internal controls.
3i Infrastructure plc Annual report and accounts 2018 69
Governance and
accounts
Accountability
Audit and Risk Committee continued
Deloitte LLP and its associates provided non-audit services to the consolidated Group for fees totalling £55,765 for the year to 31 March 2018 (2017: fees paid to Ernst & Young LLP totalled £364,156). This related to agreed-upon procedures on the advisory and performance fees (£7,000), a review of the interim financial statements (£40,000) and an interim dividend report for two of the Luxembourg subsidiaries (£8,765). In this financial year, in line with the Company’s policy, Deloitte LLP provided non-audit services during the year in relation to certain non-consolidated investee companies. The fees for these services are ordinarily borne by the underlying investee companies or unconsolidated subsidiaries, and therefore are not included in the expenses of the Group. In assessing the auditor’s independence, the Committee reviews the total amount of fees paid to the auditor in accordance with the stated policy on non-audit services, regardless of whether they are borne by the Group or by the investee companies.
RiskDuring the year the Committee:• reviewed and updated the risk matrix, where
appropriate, to reflect the Company’s key risks; • conducted detailed risk reviews of BEPS, Cyber security
and Terrorism, as detailed in the Risk report on pages 45, 47 and 48; and
• considered the presentation of risk-related matters in the Annual report and accounts.
Other mattersOther matters reviewed by the Committee during the year were:• the effectiveness of the internal control environment
of the Company and the Company’s compliance with its regulatory requirements;
• the coverage of the proposed interim and final dividends, including a review of the Board’s assessment of the coverage of dividend payments through income generated by the Company, non-income cash distributions received from portfolio companies, net capital profits generated from the sale of portfolio assets and retained reserves;
• tax, governance and regulatory considerations relating to the intended move to UK management and tax domicile;
• the Company’s compliance with its regulatory obligations in Jersey, including a review of compliance with the Codes of Practice for Certified Funds;
• the Group structure with consideration being made to ensuring it was still appropriate for current legislation; and
• the results of the Investment Adviser’s internal audit and compliance work in respect of the Investment Adviser’s obligations to the Company.
The Committee reported to the Board on how it has discharged its responsibilities and reported to the Board the key matters arising at each meeting. All recommendations were accepted by the Board.
Wendy DormanChairman, Audit and Risk Committee10 May 2018
3i Infrastructure plc Annual report and accounts 2018
Governance and accounts
70
Accountability
Report of the Nomination Committee
The Committee is responsible for adopting a formal and transparent procedure for the appointment of new Directors, including interviewing potential candidates. Final decisions on nominations, however, are taken by the entire Board. The Nomination Committee can use the services of external search consultancies when new Directors are being recruited. As well as seeking an appropriate balance of expertise and experience, especially in finance and infrastructure, the nominations process has to take account of the residence of Directors and the split between UK and Jersey resident Directors.
Matters reviewed in the yearThe Committee has undertaken succession planning, to ensure that processes and plans are in place with regards to Board appointments dealing with succession and diversity.
The Committee recommended the appointment of Robert Jennings as a new independent Director to the Board. The appointment of Robert Jennings to the Board is consistent with the Company’s policy on diversity set out in the introduction on page 55.
Established succession plans led to the appointment of Wendy Dorman as Chairman of the Audit and Risk Committee during the year following the retirement of Steven Wilderspin from the Board at the end of 2017, and the appointment of Paul Masterton as Senior Independent Director in the previous year following the retirement of Phil Austin at the end of 2016.
The Committee also reviewed its Terms of Reference to ensure that the Committee is still operating effectively.
Richard LaingChairman, Nomination Committee10 May 2018
“The Committee aims to ensure that the Board composition is balanced and effective.”
Members
Number of meetings while a
Committee member Attendance
Richard Laing 4 4
Wendy Dorman 4 4
Paul Masterton 4 4
In addition, there were several informal discussions held between the members in relation to matters agreed at the scheduled meetings.
For Terms of Reference, see our website www.3i-infrastructure.com
Richard LaingChairman
3i Infrastructure plc Annual report and accounts 2018 71
Governance and
accounts
Accountability
Report of the Management Engagement Committee
Richard LaingChairman
“Management of the relationship with the Investment Adviser is key to the performance of the Company.”
Members
Number of meetings while a
Committee member Attendance
Richard Laing 7 7
Doug Bannister 7 7
Wendy Dorman 7 7
Robert Jennings 1 1
Paul Masterton 7 7
Steven Wilderspin 5 5
All members served throughout the year, except for Steven Wilderspin, who resigned as a Director of the Company with effect from 31 December 2017 and Robert Jennings who was appointed to the Committee with effect from 1 February 2018.
While the remit of the Committee is to manage all aspects of the relationship with the Investment Adviser, its principal function is to consider annually, and recommend to the Board, whether the continued appointment of the Investment Adviser is in the best interests of the Company and its shareholders and to give reasons for its recommendation. The Committee also reviews the terms of the Investment Advisory Agreement.
For Terms of Reference, see our website www.3i-infrastructure.com
The Committee monitored the overall relationship with the Investment Adviser and among specific topics it: • monitored and reviewed the Investment Adviser’s
performance against the Company’s targets and general market conditions;
• reviewed the quality, timeliness, accuracy and relevance of the information provided to the Board, including recommendations on new investments and disposals, and reviews of portfolio company performance;
• reviewed reports from industry analysts, comparing the performance of listed infrastructure investment companies, including an analysis of the terms of their advisory agreements and fees charged;
• reviewed the fees charged to the Company by the Investment Adviser for the provision of its advisory services;
• reviewed non-investment services provided by the Investment Adviser; and
• initiated the preparation of a new Management Agreement, with appropriate terms and fees, with the intention of moving tax domicile and management of the Company to the UK with effect from 1 October 2018.
The Committee concluded that the continued appointment of 3i Investments plc as Investment Adviser is in the best interest of shareholders.
Richard LaingChairman, Nomination Committee10 May 2018
3i Infrastructure plc Annual report and accounts 2018
Governance and accounts
72
Remuneration
Report of the Remuneration Committee
“The Remuneration Committee, comprising independent non‑executive Directors, sets the remuneration of the Chairman and members of the Board.”
Members
Number of meetings while a
Committee member Attendance
Paul Masterton 2 2
Doug Bannister 2 2
Wendy Dorman 2 2
Robert Jennings 1 1
Richard Laing 2 2
Steven Wilderspin 1 1
The Remuneration Committee is charged with reviewing the scale and structure of the non-executive Directors’ remuneration, and for the year under review was constituted by all the independent non-executive Directors. All members served throughout the year, except for Steven Wilderspin, who resigned as a Director of the Company with effect from 31 December 2017 and Robert Jennings, who was appointed with effect from 1 February 2018.
For Terms of Reference, see our website www.3i-infrastructure.com
Paul MastertonChairman
Remuneration policyThe remuneration of each of the Directors is subject to fixed fee arrangements and none of the Directors received any additional remuneration or incentives in respect of his or her services as a Director of the Company. During the financial year to 31 March 2018, the Directors who served during that period were due the following:
Directors’ fees
Amount paid in the year ending 31 March 2018
£
Amount paid in the year ending 31 March 2017
£
Richard Laing 140,000 140,000
Doug Bannister 53,583 53,000
Wendy Dorman 55,333 53,000
Robert Jennings1 9,000 0
Ian Lobley2 48,500 45,000
Paul Masterton 60,583 54,750
Steven Wilderspin3 45,333 60,000
1 Appointed with effect from 1 February 2018.2 Fee payable to 3i Group plc.3 Served until 31 December 2017.
Directors’ fees for the year under review were calculated on the following basis, noting the below changes which took effect from 1 September 2017 following the approval of the Directors’ remuneration report at the 2017 AGM:i) The individual base fee of £45,000 was combined with
the current £5,000 for Jersey directors to establish a new base fee of £50,000.
ii) All directors, irrespective of place of residence, receive the same base fee.
iii) The base fee was increased by £1,000, with effect from 1 September 2017, resulting in a new base fee of £51,000 for each Director.
There was no change in the fee for the Chairman of the Board.
3i Infrastructure plc Annual report and accounts 2018 73
Governance and
accounts
Remuneration
Report of the Remuneration Committee continued
Directors’ fees
Annual fee for year to
31 March 2018 £
Annual fee for year to
31 March 2017 £
Chairman’s fee 140,000 140,000
Non-executive Director base fee
51,000 since 1 September
2017
45,000
Additional fee for the Senior Independent Director
7,000 7,000
Additional fee for the Audit and Risk Committee Chairman
10,000 10,000
Additional fee for Audit and Risk Committee members
3,000 3,000
Additional fee for Directors resident in Jersey
0 since 1 September
2017
5,000
Remuneration review During the year, the Committee considered the remuneration of Directors, and taking into account the current activities and time commitment of the various roles of the Board and Committee members, did not recommend any changes.
Paul MastertonChairman, Remuneration Committee10 May 2018
3i Infrastructure plc Annual report and accounts 2018
Governance and accounts
74
Directors’ statement
Principal activityThe Company is a closed-ended investment company that invests in infrastructure businesses and assets. The Directors do not anticipate any change in the principal activity of the Company in the foreseeable future. Its unconsolidated subsidiaries are shown on pages 106 and 107.
RegulationThe Company is incorporated in Jersey and is regulated as a collective investment fund under the Collective Investment Funds (Jersey) Law 1988. It has a Premium Listing on the London Stock Exchange.
AIFMDThe Alternative Investment Fund Managers Directive (the ‘Directive’) entered into force on 22 July 2013.
The Company is a non-EU Alternative Investment Fund (‘AIF’) and is internally managed, which means that the Board of the Company also performs the functions of an Alternative Investment Fund Manager (‘AIFM’) under the Directive and the AIF and the AIFM are the same entity. As a non-EU AIFM, the Company is currently outside the full scope of the Directive, but is subject to a number of the Directive’s requirements when it markets the Company’s securities within the EU, depending on when and how such marketing of securities is performed.
NMPIOn 31 January 2014, the Company issued a statement noting the changes to the UK Financial Conduct Authority (‘FCA’) rules regarding the restrictions on the retail distribution of unregulated collective investment schemes and close substitutes (‘non-mainstream pooled investments’, or ‘NMPIs’), which came into effect on 1 January 2014.
In this statement, the Company asserted that its shares are excluded from these rules and therefore the restrictions relating to NMPIs will not apply to its shares.
It is the Board’s intention that the Company will continue to conduct its affairs in such a manner that the Company’s shares will continue to be excluded from the FCA’s rules relating to NMPIs.
Results and dividendsThe Financial statements of the Company and its consolidated subsidiary (together referred to as the ‘Group’) for the year appear on pages 84 to 87. Total comprehensive income for the year was £479.6 million (2017: £146.3 million). An interim dividend of 3.925 pence per share (2017: 3.775 pence) in respect of the year to 31 March 2018 was paid on 8 January 2018. A special dividend of 41.4 pence per share was paid on 29 March 2018. The Directors recommend that a final dividend
of 3.925 pence per share (2017: 3.775 pence) be paid in respect of the year to 31 March 2018 to shareholders on the register at the close of business on 15 June 2018. The distribution of the dividend payments between interim and final dividends is evaluated by the Board each year, according to the Company’s performance, portfolio income generation and other factors, such as profits generated on the realisation of portfolio assets. The Company will be targeting a dividend for FY19 of 8.65 pence per share.
Strategy, performance and principal risksThe Strategic report on pages 1 to 53 provides a review of the performance and position of the Company, together with a description of the principal risks and uncertainties that it faces.
OperationsThe Company has a non-executive Board of Directors and no employees. The Board acts as the Company’s Investment Committee and is responsible for the determination and supervision of the investment policy and for the approval of investment opportunities sourced by the Investment Adviser.
The Board also supervises the monitoring of existing investments and approves divestments and further financing of portfolio assets.
Advisory arrangements3i Investments plc (‘3i Investments’), a wholly-owned subsidiary of 3i Group plc (‘3i Group’), acts as Investment Adviser to the Company. The investment advisory team provides advice to the Company on the origination and completion of new investments, on the realisation of investments, on funding requirements, as well as on the management of the investment portfolio. It provides its services under an Investment Advisory Agreement (the ‘IAA’), which includes an investment exclusivity arrangement in respect of investment opportunities within the Company’s investment policy.
Other significant service arrangementsIn addition to the arrangements described above, 3i plc and 3i Investments, in relation to certain regulatory services, have been appointed by the Company to provide support services to the Group, including treasury and accounting services, investor relations and other back office support services. The amounts payable under these arrangements are described in more detail in Note 18 on page 105.
Link Alternative Fund Services (Jersey) Limited acts as the Administrator and Company Secretary to the Company.
3i Infrastructure plc Annual report and accounts 2018 75
Governance and
accounts
Directors’ statement continued
Revolving Credit FacilityThe Company has a £300 million revolving credit facility (‘RCF’) in order to maintain an appropriate level of liquidity for further investment whilst minimising returns dilution from holding excessive cash balances. This is a three-year facility, and the maturity date was extended in April 2017 by one year to May 2020.
In April 2017, the Company increased the size of the RCF from £300 million to £500 million on a temporary basis to March 2018. This increase was cancelled in February 2018 following receipt of the proceeds on the divestment of AWG.
In April 2018, the Company refinanced the RCF with the existing lenders. The new RCF has a lower margin and non-utilisation fees, and a maturity date of May 2021 with two one-year extension options.
Share capital The issued share capital of the Company as at 31 March 2018 was 810,434,010 ordinary shares (2017: 1,026,549,746). The reduction in issued share capital was a result of the 15 for 19 share consolidation on 15 March 2018.
Major interests in ordinary sharesNotifications of the following voting interests in the Company’s ordinary share capital as at 31 March 2018 and 30 April 2018, which are disclosable in accordance with Chapter 5 of the FCA’s Disclosure and Transparency Rules, are as follows:
Interest in ordinary shares
Number of ordinary
shares1 as at 31 March
2018
% of issued share
capital
Number of ordinary
shares1 as at 30 April
2018
% of issued share
capital
3i Group plc (and subsidiaries) 272,137,294 33.58 272,137,294 33.58
Schroders plc 67,405,098 8.32 63,504,473 7.84
1 Each ordinary share carries the right to one vote.
Directors’ interestsIn accordance with FCA Listing Rule 9.8.6(R)(1), Directors’ interests in the shares of the Company (in respect of which transactions are notifiable to the Company under FCA Disclosure and Transparency Rule 3.1.2(R)) as at 31 March 2018 are shown below:
Directors’ interests and beneficial interests1
Ordinary shares at 31 March 2018
Richard Laing 30,000
Doug Bannister 9,868
Wendy Dorman 18,947
Ian Lobley 0
Paul Masterton 21,194
Robert Jennings 50,000
1 No options have ever been granted since the inception of the Company.
In the period from 1 April 2018 to 30 April 2018, there were no changes in the interests of each serving Director.
Directors’ authority to buy back sharesThe Company did not purchase any of its own shares during the year. The current authority of the Company to make market purchases of up to 14.99% of the issued ordinary share capital expires at the next AGM, to be held on 5 July 2018 (‘the 2018 AGM’). The Company will seek to renew such authority until the end of the AGM in 2019, specifying the maximum and minimum price at which shares can be bought back. Any buyback of ordinary shares will be made subject to Jersey law and the making and timing of any buybacks will be at the absolute discretion of the Directors. Such purchases will also only be made in accordance with the Listing Rules of the FCA which provide that the price paid must not be more than the higher of: (i) 5% above the average middle market quotations for the ordinary shares for the five business days before the shares are purchased; and (ii) the higher of the last independent trade and the highest current independent bid on the London Stock Exchange at such time.
Directors’ conflicts of interestsThe Directors have a statutory duty to avoid conflicts of interest with the Company. The Company’s Articles of Association enable the Directors to approve conflicts of interest and include other conflict of interest provisions. The Company has implemented processes to identify potential and actual conflicts of interest. Such conflicts are then considered for approval by the Board, subject, if necessary, to appropriate conditions.
Directors’ indemnitiesThe Company’s Articles of Association provide that, subject to the provisions of the Statutes, every Director of the Company shall be indemnified out of the assets of the Company against all liabilities and expenses incurred by him or her in the actual or purported execution or discharge of his or her duties. ‘Statutes’ here refers to the Companies (Jersey) Law 1991 and every other statute, regulation or order for the time being in force concerning companies registered under the Companies (Jersey) Law 1991. In addition, the Company has entered into indemnity agreements for the benefit of its Directors and these remain in force at the date of this report.
The Company also had directors’ and officers’ liability insurance in place in the year.
3i Infrastructure plc Annual report and accounts 2018
Governance and accounts
76
Statement of Directors’ responsibilitiesThe Directors are responsible for preparing the Annual report and accounts in accordance with applicable law and regulations and those International Financial Reporting Standards (‘IFRSs’) which have been adopted by the European Union.
As a company listed on the London Stock Exchange, 3i Infrastructure is subject to the FCA’s Listing Rules and Disclosure and Transparency Rules, as well as to all applicable laws and regulations of Jersey, where it is incorporated.
Jersey company law requires the Directors to prepare financial statements for each financial period in accordance with generally accepted accounting principles. The Financial statements of the Group are required by law to give a true and fair view of the state of affairs of the Group at the period end and of the profit or loss of the Group for the period then ended.
In preparing these Financial statements, the Directors should:
• select suitable accounting policies and then apply them consistently;
• make judgements and estimates that are reasonable;• specify which generally accepted accounting principles
have been adopted in their preparation; and• prepare the Financial statements on the going concern
basis, unless it is inappropriate to presume that the Company will continue in business.
The Directors are responsible for keeping accounting records which are sufficient to show and explain the Group’s transactions and are such as to disclose with reasonable accuracy at any time the financial position of the Group and enable them to ensure that the Financial statements prepared by the Group comply with the requirements of the Companies (Jersey) Law 1991. They are also responsible for safeguarding the assets of the Group and hence for taking reasonable steps for the prevention and detection of fraud and other irregularities.
The Directors are also responsible for preparing the Annual report and accounts and the Directors confirm that they consider that, taken as a whole, the Annual report and accounts is fair, balanced and understandable and provides the information necessary for shareholders to assess the Company’s performance, business model and strategy.
In accordance with the FCA’s Disclosure and Transparency Rules, the Directors confirm to the best of their knowledge that:a) the Financial statements, prepared in accordance
with applicable accounting standards, give a true and fair view of the assets, liabilities, financial position and profit or loss of the Group taken as a whole; and
b) the Annual report and accounts include a fair review of the development and performance of the business and the position of the Group taken as a whole, together with a description of the principal risks and uncertainties faced by the Company.
The Directors of the Company and their functions are listed on pages 56, 57 and 60.
The Directors have acknowledged their responsibilities in relation to the Financial statements for the year to 31 March 2018.
Going concernThe Company’s business activities, together with the factors likely to affect its future development, performance and position are set out in the Strategic report on pages 1 to 53 and in the Financial statements and related Notes on pages 84 to 107. The financial position of the Group, its cash flows, liquidity position and borrowing facilities are described in the Financial statements and related Notes on pages 84 to 107. In addition, Note 9 to the Financial statements includes the Company’s objectives, policies and processes for managing its capital, its financial risk management objectives, details of its financial instruments and hedging activities, and its exposures to credit risk and liquidity risk.
The Company has liquid financial resources and a strong investment portfolio providing a predictable income yield and an expectation of medium-term capital growth. As a consequence, the Directors believe that the Group is well placed to manage its business risks successfully and to cover its dividend in the next financial year. After making enquiries, the Directors have a reasonable expectation that the Company has adequate resources to continue in operational existence for the foreseeable future. Accordingly, they continue to adopt the going concern basis in preparing the Annual report and accounts.
By order of the Board Authorised signatory
Link Alternative Fund Services (Jersey) LimitedCompany Secretary10 May 2018
Registered Office: 12 Castle Street St. Helier Jersey JE2 3RT Channel Islands
3i Infrastructure plc Annual report and accounts 2018 77
Governance and
accounts
3i Infrastructure plc Annual report and accounts 2018
Governance and accounts
78
Independent auditor’s report to the members of 3i Infrastructure plc
Report on the audit of the financial statementsOpinionIn our opinion the financial statements:• give a true and fair view of the state of the Group’s affairs as at 31 March 2018 and of the Group’s profit
for the year then ended;• have been properly prepared in accordance with International Financial Reporting Standards (IFRSs)
as adopted by the European Union; and• have been properly prepared in accordance with Companies (Jersey) Law 1991.
We have audited the financial statements of 3i Infrastructure plc (the ‘Company’) and its subsidiary (the ‘Group’) which comprise:• the consolidated statement of comprehensive income;• the consolidated statement of changes in equity;• the consolidated balance sheet;• the consolidated cash flow statement;• the reconciliation of net cash flow to movement in net debt;• the statement of significant accounting policies; and• the related notes 1 to 19.
The financial reporting framework that has been applied in their preparation is applicable law and IFRSs as adopted by the European Union.
Basis for opinionWe conducted our audit in accordance with International Standards on Auditing (UK) (ISAs (UK)) and applicable law. Our responsibilities under those standards are further described in the auditor’s responsibilities for the audit of the financial statements section of our report.
We are independent of the Group in accordance with the ethical requirements that are relevant to our audit of the financial statements in the UK, including the Financial Reporting Council’s (FRC’s) Ethical Standard as applied to listed public interest entities, and we have fulfilled our other ethical responsibilities in accordance with these requirements. We confirm that the non-audit services prohibited by the FRC’s Ethical Standard were not provided to the Group.
We believe that the audit evidence we have obtained is sufficient and appropriate to provide a basis for our opinion.
While the parent company is not a public interest entity subject to European Regulation 537/2014, the directors have decided that the parent company should follow the same requirements as if that Regulation applied to the parent company.
3i Infrastructure plc Annual report and accounts 2018 79
Governance and
accounts
Summary of our audit approach
Key audit matters The key audit matters that we identified in the current year were:
• the valuation of the investments; and
• the calculation of performance fee.
These key audit matters are consistent with the previous auditor’s report except as detailed below.
Materiality The materiality that we used for the Group financial statements was £17.1 million which was determined on the basis of 1% of the Group’s net assets.
In addition to net assets, a lower materiality threshold of £2.0 million based upon 2% of investment income was applied to amounts in the statement of comprehensive income excluding fair value movements on investments and derivatives.
Scoping The Group comprises of 3i Infrastructure plc and its single direct subsidiary, both of which are in full scope for our audit.
Significant changes in our approach
Last year the previous auditor’s report included the incomplete or inaccurate recognition of investment income as a key audit matter which is not included in our report this year.
Conclusions relating to going concern, principal risks and viability statement
Going concern We have reviewed the directors’ statement on page 77 about whether they considered it appropriate to adopt the going concern basis of accounting in preparing the financial statements and their identification of any material uncertainties to the Group’s ability to continue to do so over a period of at least twelve months from the date of approval of the financial statements.
We are required to state whether we have anything material to add or draw attention to in relation to that statement required by Listing Rule 9.8.6R(3) and report if the statement is materially inconsistent with our knowledge obtained in the audit.
We confirm that we have nothing material to report, add or draw attention to in respect of these matters.
Principal risks and viability statement
Based solely on reading the directors’ statements and considering whether they were consistent with the knowledge we obtained in the course of the audit, including the knowledge obtained in the evaluation of the directors’ assessment of the Group’s ability to continue as a going concern, we are required to state whether we have anything material to add or draw attention to in relation to:
• the disclosures on pages 50-51 that describe the principal risks and explain how they are being managed or mitigated;
• the directors’ confirmation on page 47 that they have carried out a robust assessment of the principal risks facing the Group, including those that would threaten its business model, future performance, solvency or liquidity; or
• the directors’ explanation on page 49 as to how they have assessed the prospects of the Group, over what period they have done so and why they consider that period to be appropriate, and their statement as to whether they have a reasonable expectation that the Group will be able to continue in operation and meet its liabilities as they fall due over the period of their assessment, including any related disclosures drawing attention to any necessary qualifications or assumptions.
We are also required to report whether the directors’ statement relating to the prospects of the Group required by Listing Rule 9.8.6R(3) is materially inconsistent with our knowledge obtained in the audit.
We confirm that we have nothing material to report, add or draw attention to in respect of these matters.
3i Infrastructure plc Annual report and accounts 2018
Governance and accounts
80
Key audit mattersKey audit matters are those matters that, in our professional judgement, were of most significance in our audit of the financial statements of the year and include the most significant assessed risks of material misstatement (whether or not due to fraud) that we identified. These matters included those which had the greatest effect on: the overall audit strategy, the allocation of resources in the audit; and directing the efforts of the engagement team.
These matters were addressed in the context of our audit of the financial statements as a whole, and in forming our opinion thereon, and we do not provide a separate opinion on these matters.
Valuation of Investments
Key audit matter description
A key audit matter for the consolidated financial statements is the valuation of the Group’s investments in unquoted companies and unlisted funds at fair value through profit and loss (2018: £1,552.3 million, 2017: £1,815.6 million). The balance has fallen in the year following the sale of Anglian Water Group and Elenia which completed in February 2018. Certain assumptions used in the determination of fair value are a key source of estimation uncertainty, which is why we consider there to be a risk of material misstatement as well as a potential fraud risk. As a liquid market does not exist for a majority of the investments, they are measured using a range of different valuation techniques, with discounted cash flow methodology being the most prevalent technique. The complex nature of this methodology, combined with the number of significant judgements, means there is a risk that the fair value of the investments could be misstated. The key judgements have been summarised as:
• Discount rates – the determination of the appropriate discount rate for each investment that is reflective of current market conditions and the specific risks of the investment;
• Macro-economic assumptions – these include inflation and deposit rates;
• Tax considerations – the potential impact of OECD BEP’s Action 6 on the overall structure; and
• Forecasted future cash flows – specific investments use certain assumptions in the cash flow forecasts that are particularly complex and judgemental.
This key audit matter is also discussed on page 68 in the Report of the Audit and Risk Committee and disclosed in the significant accounting policies as a key source of estimation uncertainty on pages 89 and portfolio valuation methodology on page 109.
How the scope of our audit responded to the key audit matter
We performed the following procedures with assistance from our valuation experts:
• Tested the operating effectiveness of controls around the overall valuation process;
• Challenged the Investment Adviser concerning the discount rates applied to investments, and benchmarked them to relevant listed comparable peers and transactions;
• Challenged macro-economic assumptions by reference to observable market data and forecasts;
• Engaged with tax specialists to assess the potential impact of BEPS Action 6 on the fair value of the investments;
• Employed audit analytics on the valuation models to assess them for integrity and material formula errors;
• Reviewed the historical accuracy of the Investment Adviser’s cash flow forecasts against actual results; and
• Reviewed and challenged forecasted cash flows, in particular movements since acquisition or the prior year and changes made in underlying forecast models.
Key observations
We concluded that the valuation of investments was not materially misstated.
Independent auditor’s report to the members of 3i Infrastructure plc continued
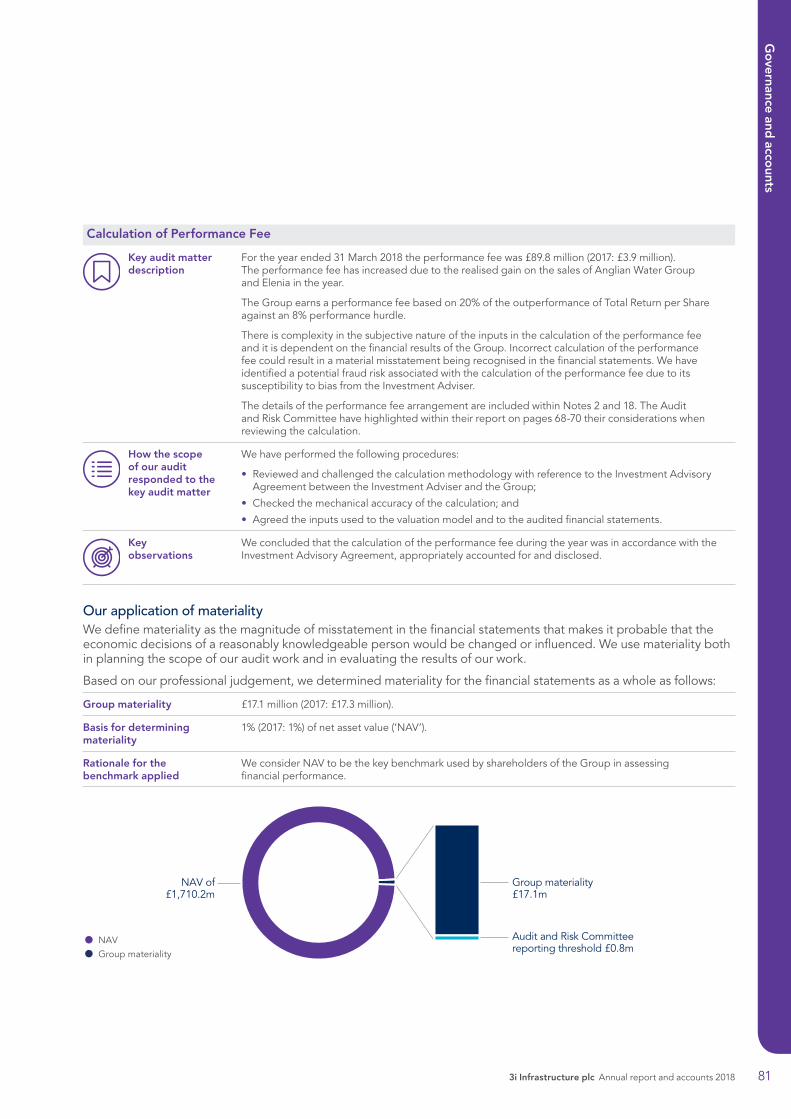
3i Infrastructure plc Annual report and accounts 2018 81
Governance and
accounts
Calculation of Performance Fee
Key audit matter description
For the year ended 31 March 2018 the performance fee was £89.8 million (2017: £3.9 million). The performance fee has increased due to the realised gain on the sales of Anglian Water Group and Elenia in the year.
The Group earns a performance fee based on 20% of the outperformance of Total Return per Share against an 8% performance hurdle.
There is complexity in the subjective nature of the inputs in the calculation of the performance fee and it is dependent on the financial results of the Group. Incorrect calculation of the performance fee could result in a material misstatement being recognised in the financial statements. We have identified a potential fraud risk associated with the calculation of the performance fee due to its susceptibility to bias from the Investment Adviser.
The details of the performance fee arrangement are included within Notes 2 and 18. The Audit and Risk Committee have highlighted within their report on pages 68-70 their considerations when reviewing the calculation.
How the scope of our audit responded to the key audit matter
We have performed the following procedures:
• Reviewed and challenged the calculation methodology with reference to the Investment Advisory Agreement between the Investment Adviser and the Group;
• Checked the mechanical accuracy of the calculation; and
• Agreed the inputs used to the valuation model and to the audited financial statements.
Key observations
We concluded that the calculation of the performance fee during the year was in accordance with the Investment Advisory Agreement, appropriately accounted for and disclosed.
Our application of materialityWe define materiality as the magnitude of misstatement in the financial statements that makes it probable that the economic decisions of a reasonably knowledgeable person would be changed or influenced. We use materiality both in planning the scope of our audit work and in evaluating the results of our work.
Based on our professional judgement, we determined materiality for the financial statements as a whole as follows:
Group materiality £17.1 million (2017: £17.3 million).
Basis for determining materiality
1% (2017: 1%) of net asset value (‘NAV’).
Rationale for the benchmark applied
We consider NAV to be the key benchmark used by shareholders of the Group in assessing financial performance.
NAV of£1,710.2m
Group materiality£17.1m
Audit and Risk Committee reporting threshold £0.8m
NAVGroup materiality
3i Infrastructure plc Annual report and accounts 2018
Governance and accounts
82
A lower materiality threshold of £2.0 million based upon 2% of investment income has also been used. This has been applied to all non-fair value movements affecting the comprehensive income for the year. A lower materiality threshold has been used to obtain sufficient coverage on comprehensive income.
We agreed with the Audit and Risk Committee that we would report to the Committee all audit differences in excess of £0.8 million (2017: £0.8 million), as well as differences below that threshold that, in our view, warranted reporting on qualitative grounds. We also report to the Audit and Risk Committee on disclosure matters that we identified when assessing the overall presentation of the financial statements.
An overview of the scope of our auditOur audit was scoped by obtaining an understanding of the Group and its environment, including group-wide controls, and assessing the risks of material misstatement at the group level. Both 3i Infrastructure plc and its single direct subsidiary are in full scope for the purposes of our audit and all the audit work is performed directly by the Group audit team.
Other information
The directors are responsible for the other information. The other information comprises the information included in the annual report, other than the financial statements and our auditor’s report thereon.
Our opinion on the financial statements does not cover the other information and we do not express any form of assurance conclusion thereon.
In connection with our audit of the financial statements, our responsibility is to read the other information and, in doing so, consider whether the other information is materially inconsistent with the financial statements or our knowledge obtained in the audit or otherwise appears to be materially misstated.
If we identify such material inconsistencies or apparent material misstatements, we are required to determine whether there is a material misstatement in the financial statements or a material misstatement of the other information. If, based on the work we have performed, we conclude that there is a material misstatement of this other information, we are required to report that fact.
In this context, matters that we are specifically required to report to you as uncorrected material misstatements of the other information include where we conclude that:
Fair, balanced and understandable – the statement given by the directors that they consider the annual report and financial statements taken as a whole is fair, balanced and understandable and provides the information necessary for shareholders to assess the Group’s position and performance, business model and strategy, is materially inconsistent with our knowledge obtained in the audit; or
Audit and Risk Committee reporting – the section describing the work of the Audit and Risk Committee does not appropriately address matters communicated by us to the Audit and Risk Committee; or
Directors’ statement of compliance with the UK Corporate Governance Code – the parts of the directors’ statement required under the Listing Rules relating to the Company’s compliance with the UK Corporate Governance Code containing provisions specified for review by the auditor in accordance with Listing Rule 9.8.10R (2) do not properly disclose a departure from a relevant provision of the UK Corporate Governance Code.
We have nothing to report in respect of these matters.
Responsibilities of directorsAs explained more fully in the statement of directors’ responsibilities, the directors are responsible for the preparation of the financial statements and for being satisfied that they give a true and fair view, and for such internal control as the directors determine is necessary to enable the preparation of financial statements that are free from material misstatement, whether due to fraud or error.
In preparing the financial statements, the directors are responsible for assessing the Group’s ability to continue as a going concern, disclosing as applicable, matters related to going concern and using the going concern basis of accounting unless the directors either intend to liquidate the Group or to cease operations, or have no realistic alternative but to do so.
Independent auditor’s report to the members of 3i Infrastructure plc continued
3i Infrastructure plc Annual report and accounts 2018 83
Governance and
accounts
Auditor’s responsibilities for the audit of the financial statementsOur objectives are to obtain reasonable assurance about whether the financial statements as a whole are free from material misstatement, whether due to fraud or error, and to issue an auditor’s report that includes our opinion. Reasonable assurance is a high level of assurance, but is not a guarantee that an audit conducted in accordance with ISAs (UK) will always detect a material misstatement when it exists. Misstatements can arise from fraud or error and are considered material if, individually or in the aggregate, they could reasonably be expected to influence the economic decisions of users taken on the basis of these financial statements.
A further description of our responsibilities for the audit of the financial statements is located on the FRC’s website at: www.frc.org.uk/auditorsresponsibilities. This description forms part of our auditor’s report.
Use of our reportThis report is made solely to the Company’s members, as a body, in accordance with Article 113A of the Companies (Jersey) Law 1991. Our audit work has been undertaken so that we might state to the Company’s members those matters we are required to state to them in an auditor’s report and for no other purpose. To the fullest extent permitted by law, we do not accept or assume responsibility to anyone other than the Company and the Company’s members as a body, for our audit work, for this report, or for the opinions we have formed.
Report on other legal and regulatory requirementsMatters on which we are required to report by exception
Adequacy of explanations received and accounting records
Under the Companies (Jersey) Law 1991 we are required to report to you if, in our opinion:
• we have not received all the information and explanations we require for our audit; or
• proper accounting records have not been kept by the Company, or proper returns adequate for our audit have not been received from branches not visited by us; or
• the financial statements are not in agreement with the accounting records and returns.
We have nothing to report in respect of these matters.
Other matters
Auditor tenure Following the recommendation of the Audit and Risk Committee, we were appointed by the shareholders on 6 July 2017 at the Annual General Meeting to audit the financial statements for the year ending 31 March 2018 and subsequent financial periods. The period of total uninterrupted engagement including previous renewals and reappointments of the firm is one year.
Consistency of the audit report with the additional report to the Audit and Risk Committee
Our audit opinion is consistent with the additional report to the Audit and Risk Committee we are required to provide in accordance with ISAs (UK).
Jacqueline Holden, FCA For and on behalf of Deloitte LLP Recognized Auditor London, United Kingdom 10 May 2018
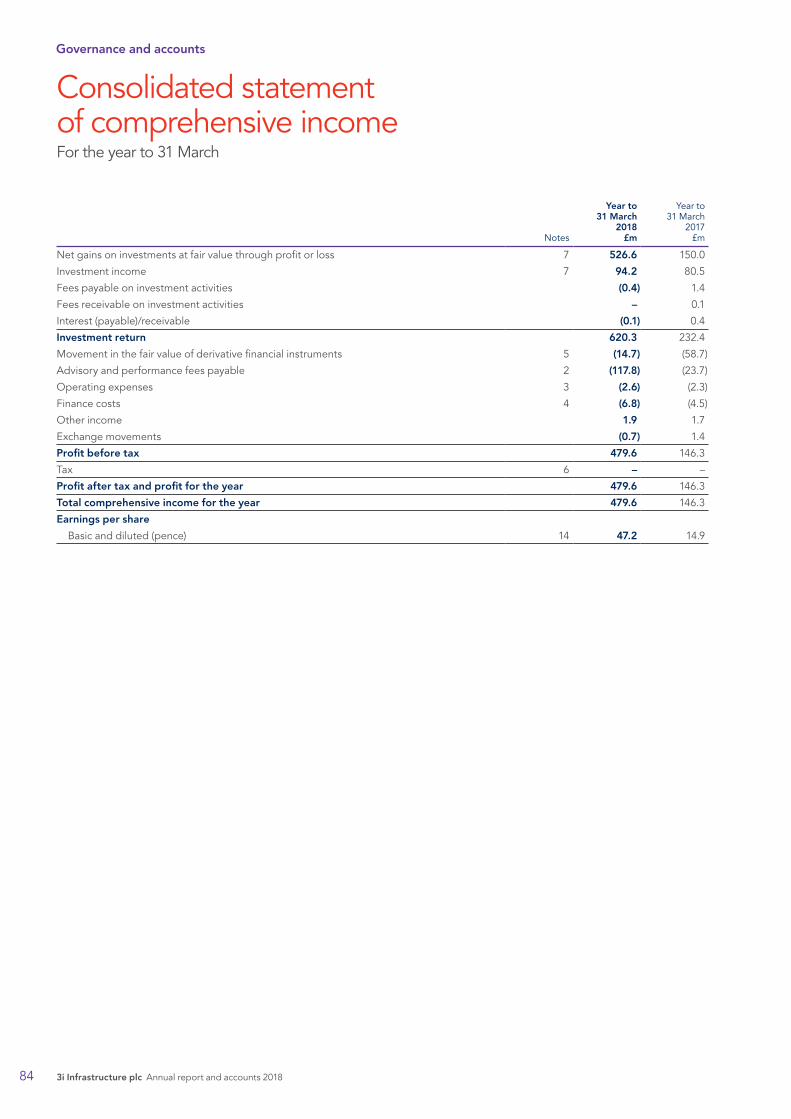
Notes
Year to31 March
2018£m
Year to31 March
2017£m
Net gains on investments at fair value through profit or loss 7 526.6 150.0
Investment income 7 94.2 80.5
Fees payable on investment activities (0.4) 1.4
Fees receivable on investment activities – 0.1
Interest (payable)/receivable (0.1) 0.4
Investment return 620.3 232.4
Movement in the fair value of derivative financial instruments 5 (14.7) (58.7)
Advisory and performance fees payable 2 (117.8) (23.7)
Operating expenses 3 (2.6) (2.3)
Finance costs 4 (6.8) (4.5)
Other income 1.9 1.7
Exchange movements (0.7) 1.4
Profit before tax 479.6 146.3
Tax 6 – –
Profit after tax and profit for the year 479.6 146.3
Total comprehensive income for the year 479.6 146.3
Earnings per share
Basic and diluted (pence) 14 47.2 14.9
Consolidated statement of comprehensive incomeFor the year to 31 March
3i Infrastructure plc Annual report and accounts 2018
Governance and accounts
84
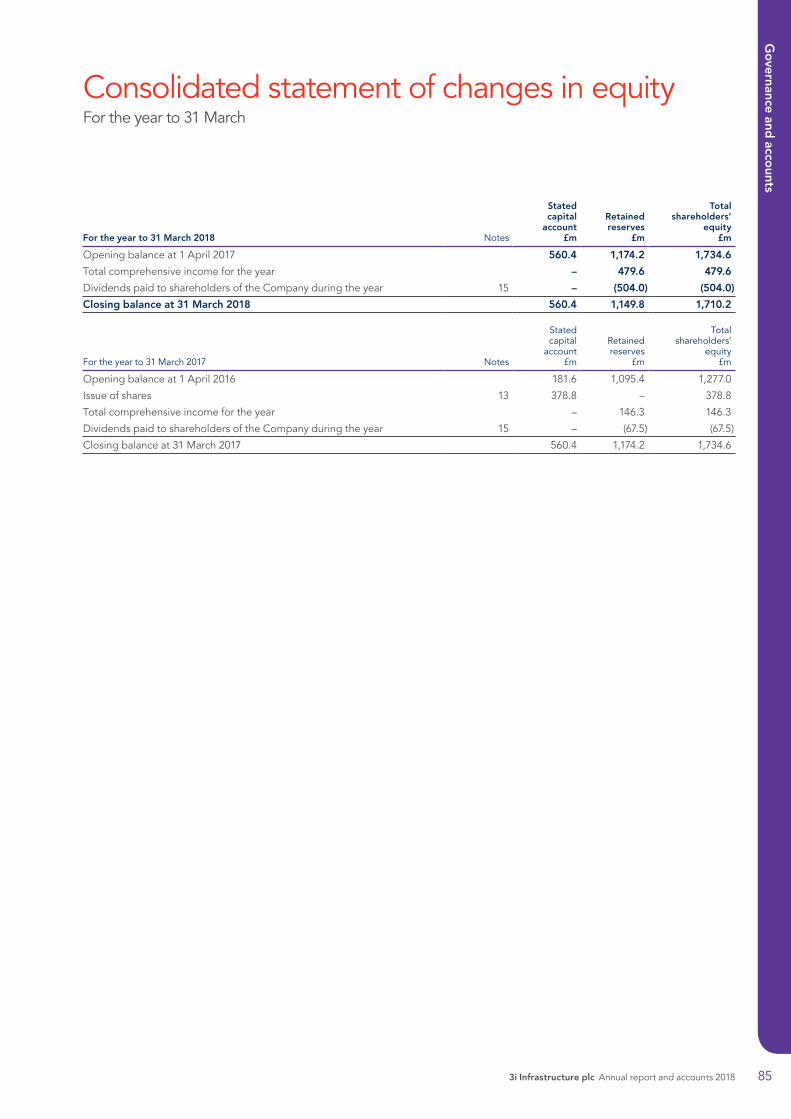
For the year to 31 March 2018 Notes
Statedcapital
account£m
Retainedreserves
£m
Totalshareholders’
equity£m
Opening balance at 1 April 2017 560.4 1,174.2 1,734.6
Total comprehensive income for the year – 479.6 479.6
Dividends paid to shareholders of the Company during the year 15 – (504.0) (504.0)
Closing balance at 31 March 2018 560.4 1,149.8 1,710.2
For the year to 31 March 2017 Notes
Statedcapital
account£m
Retainedreserves
£m
Totalshareholders’
equity£m
Opening balance at 1 April 2016 181.6 1,095.4 1,277.0
Issue of shares 13 378.8 – 378.8
Total comprehensive income for the year – 146.3 146.3
Dividends paid to shareholders of the Company during the year 15 – (67.5) (67.5)
Closing balance at 31 March 2017 560.4 1,174.2 1,734.6
Consolidated statement of changes in equityFor the year to 31 March
3i Infrastructure plc Annual report and accounts 2018 85
Governance and
accounts

Consolidated balance sheetAs at 31 March
Notes2018
£m2017
£m
Assets
Non-current assets
Investments at fair value through profit or loss 7 1,552.3 1,815.6
Investment portfolio 1,552.3 1,815.6
Derivative financial instruments 10 1.5 4.4
Total non-current assets 1,553.8 1,820.0
Current assets
Derivative financial instruments 10 4.3 1.3
Trade and other receivables 8 14.1 35.1
Other financial assets – 32.1
Cash and cash equivalents 282.0 17.1
Total current assets 300.4 85.6
Total assets 1,854.2 1,905.6
Liabilities
Non-current liabilities
Derivative financial instruments 10 (29.7) (43.4)
Trade and other payables 12 (5.9) (3.8)
Loans and borrowings 11 – (100.0)
Total non-current liabilities (35.6) (147.2)
Current liabilities
Derivative financial instruments 10 (13.7) (18.4)
Trade and other payables 12 (94.7) (5.4)
Total current liabilities (108.4) (23.8)
Total liabilities (144.0) (171.0)
Net assets 1,710.2 1,734.6
Equity
Stated capital account 13 560.4 560.4
Retained reserves 1,149.8 1,174.2
Total equity 1,710.2 1,734.6
Net asset value per share
Basic and diluted (pence) 14 211.0 169.0
The Financial statements and related Notes were approved and authorised for issue by the Board of Directors on 10 May 2018 and signed on its behalf by:
Wendy DormanDirector
3i Infrastructure plc Annual report and accounts 2018
Governance and accounts
86
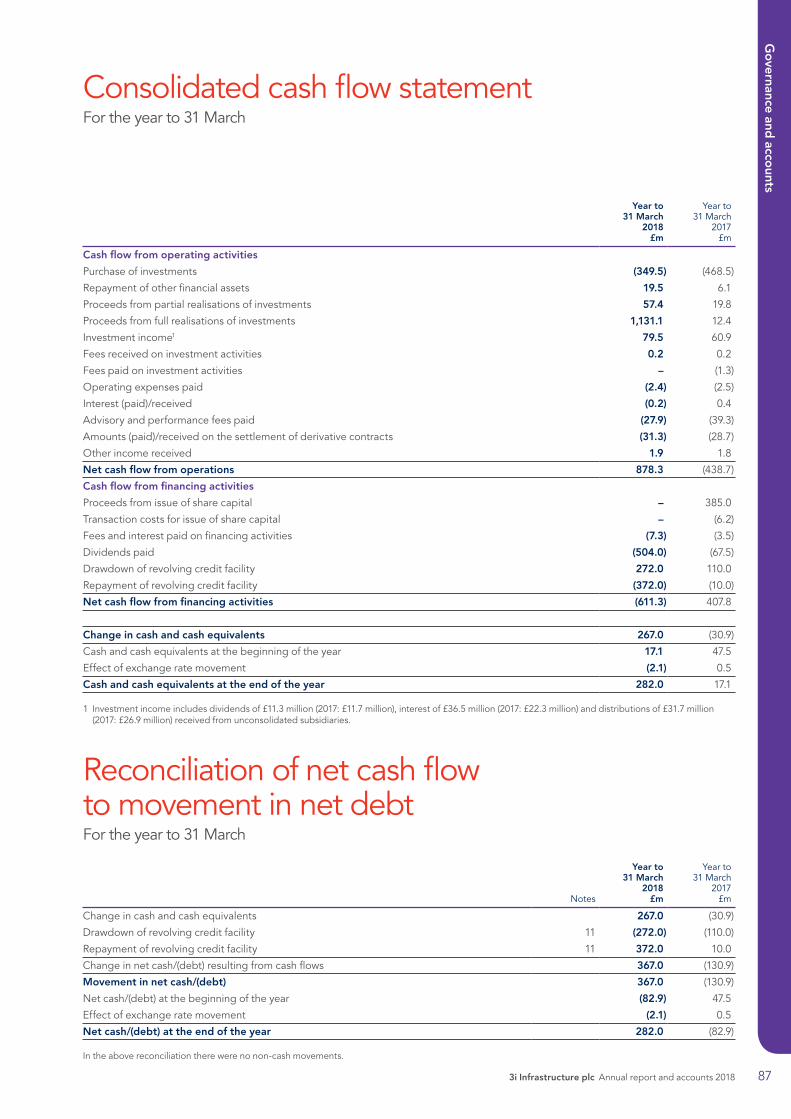
Year to31 March
2018£m
Year to31 March
2017£m
Cash flow from operating activities
Purchase of investments (349.5) (468.5)
Repayment of other financial assets 19.5 6.1
Proceeds from partial realisations of investments 57.4 19.8
Proceeds from full realisations of investments 1,131.1 12.4
Investment income1 79.5 60.9
Fees received on investment activities 0.2 0.2
Fees paid on investment activities – (1.3)
Operating expenses paid (2.4) (2.5)
Interest (paid)/received (0.2) 0.4
Advisory and performance fees paid (27.9) (39.3)
Amounts (paid)/received on the settlement of derivative contracts (31.3) (28.7)
Other income received 1.9 1.8
Net cash flow from operations 878.3 (438.7)
Cash flow from financing activities
Proceeds from issue of share capital – 385.0
Transaction costs for issue of share capital – (6.2)
Fees and interest paid on financing activities (7.3) (3.5)
Dividends paid (504.0) (67.5)
Drawdown of revolving credit facility 272.0 110.0
Repayment of revolving credit facility (372.0) (10.0)
Net cash flow from financing activities (611.3) 407.8
Change in cash and cash equivalents 267.0 (30.9)
Cash and cash equivalents at the beginning of the year 17.1 47.5
Effect of exchange rate movement (2.1) 0.5
Cash and cash equivalents at the end of the year 282.0 17.1
1 Investment income includes dividends of £11.3 million (2017: £11.7 million), interest of £36.5 million (2017: £22.3 million) and distributions of £31.7 million (2017: £26.9 million) received from unconsolidated subsidiaries.
Consolidated cash flow statementFor the year to 31 March
Notes
Year to31 March
2018£m
Year to31 March
2017£m
Change in cash and cash equivalents 267.0 (30.9)
Drawdown of revolving credit facility 11 (272.0) (110.0)
Repayment of revolving credit facility 11 372.0 10.0
Change in net cash/(debt) resulting from cash flows 367.0 (130.9)
Movement in net cash/(debt) 367.0 (130.9)
Net cash/(debt) at the beginning of the year (82.9) 47.5
Effect of exchange rate movement (2.1) 0.5
Net cash/(debt) at the end of the year 282.0 (82.9)
In the above reconciliation there were no non-cash movements.
Reconciliation of net cash flow to movement in net debtFor the year to 31 March
3i Infrastructure plc Annual report and accounts 2018 87
Governance and
accounts
Significant accounting policies
Corporate information3i Infrastructure plc (the ‘Company’) is a company incorporated in Jersey, Channel Islands. The Consolidated financial statements for the year to 31 March 2018 comprise the financial statements of the Company and its consolidated subsidiary as defined in IFRS 10 Consolidated Financial Statements (together referred to as the ‘Group’). The Companies (Jersey) Law 1991 does not require the directors of a company to present separate financial statements where consolidated financial statements are presented and therefore the financial results and position of the Company are not presented alongside the consolidated financial statements of the Group.
The financial statements were authorised for issue by the Board of Directors on 10 May 2018.
Statement of complianceThese financial statements have been prepared in accordance with International Financial Reporting Standards, International Accounting Standards and their interpretations issued as adopted for use in the European Union (‘IFRS’).
These financial statements have also been prepared in accordance with and in compliance with the Companies (Jersey) Law 1991.
Basis of preparationThe financial statements are prepared on a going concern basis as disclosed in the Directors’ statement, as the Directors are satisfied that the Group has the resources to continue in business for the foreseeable future. In making this assessment, the Directors have considered a wide range of information relating to present and future conditions, including future projections of profitability and cash flows.
The financial statements of the Group are presented in sterling, the functional currency of the Company, rounded to the nearest hundred thousand pounds (£0.1 million) except where otherwise indicated.
The preparation of financial statements in conformity with IFRS requires the Board to make judgements, estimates and assumptions that affect the application of policies and reported amounts of assets and liabilities, income and expenses. The estimates and associated assumptions are based on experience and other factors that are believed to be reasonable under the circumstances, the results of which form the basis of determining the carrying values of assets and liabilities that are not readily apparent from other sources. Actual results may differ from these estimates.
Basis of consolidationIn accordance with IFRS 10 (as amended), entities that meet the definition of an investment entity are required to fair value certain subsidiaries through profit or loss in accordance with IAS 39 Financial Instruments: Recognition and Measurement, rather than consolidate their results. However, those subsidiaries that are not themselves investment entities and provide investment-related services to the Company are consolidated.
Intragroup balances between the Company and the consolidated subsidiary, 3i Infrastructure Seed Assets GP Limited, a UK incorporated and 100% owned company, and any unrealised gains and losses or income and expenses arising from intragroup transactions, are eliminated in preparing the consolidated financial statements. There will be no elimination in relation to transactions between the Company and subsidiaries held at fair value.
Key judgementsThe preparation of financial statements in accordance with IFRS requires the Directors to exercise judgement in the process of applying the accounting policies defined below. The following policies are areas where a higher degree of judgement has been applied in the preparation of the financial statements.
(i) Assessment as investment entity – Entities that meet the definition of an investment entity within IFRS 10 are required to measure their subsidiaries at fair value through profit or loss rather than consolidate them unless they provided investment-related services to the Company. To determine that the Company continues to meet the definition of an investment entity, the Company is required to satisfy the following three criteria:
(a) the Company obtains funds from one or more investors for the purpose of providing those investor(s) with investment management services;
(b) the Company commits to its investor(s) that its business purpose is to invest funds solely for returns from capital appreciation, investment income, or both; and
(c) the Company measures and evaluates the performance of substantially all of its investments on a fair value basis.
The Company meets the criteria as follows:
• the stated strategy of the Company is to deliver stable returns to shareholders through a mix of income yield and capital appreciation;
3i Infrastructure plc Annual report and accounts 2018
Governance and accounts
88

• the Company provides investment management services and has several investors who pool their funds to gain access to infrastructure related investment opportunities that they might not have had access to individually; and
• the Company has elected to measure and evaluate the performance of all of its investments on a fair value basis. The fair value method is used to represent the Company’s performance in its communication to the market, including investor presentations. In addition, the Company reports fair value information internally to Directors, who use fair value as the primary measurement attribute to evaluate performance.
The Directors are of the opinion that the Company has all the typical characteristics of an investment entity and continues to meet the definition in the standard. This conclusion will be reassessed on an annual basis.
(ii) Assessment of investments as structured entities – A structured entity is an entity that has been designed so that voting or similar rights are not the dominant factor in deciding who controls the entity. Additional disclosures are required by IFRS 12 for interests in structured entities, whether they are consolidated or not. The Directors have assessed whether the entities in which the Group invests should be classified as structured entities and have concluded that none of the entities should be classified as structured entities as voting rights are the dominant factor in deciding who controls these entities.
(iii) Assessment of consolidation requirements – The Group holds significant stakes in the majority of its investee companies and must exercise judgement in the level of control of the underlying investee company that is obtained in order to assess whether the company should be classified as a subsidiary.
The Group must also exercise judgement in whether a subsidiary provides investment-related services or activities and therefore should be consolidated or held at fair value through profit or loss. Further details are shown in significant accounting policy ‘A Classification’.
During the year, the Company set up one new subsidiary entity for the new investment commitment in Attero. A further 14 entities included within the Wireless Infrastructure Group became subsidiaries during the year. The Directors have assessed whether these entities provide investment-related services and have concluded that they should not be consolidated and that they should be held at fair value through profit or loss.
The adoption of certain accounting policies by the Group also requires the use of certain critical accounting estimates in determining the information to be disclosed in the financial statements.
Key estimation uncertaintiesValuation of the investment portfolioThe key area where estimates are significant to the consolidated financial statements and have a significant risk of causing a material adjustment to the carrying amounts of assets and liabilities within the next financial year is in the valuation of the investment portfolio.
The majority of assets in the investment portfolio are valued on a discounted cash flow basis which requires assumptions to be made regarding future cash flows and the discount rate to be applied to these cash flows. The methodology for deriving the fair value of the investment portfolio, including the key estimates, is set out on page 109. Refer to Note 7 for further details of the valuation techniques, significant inputs to those techniques and sensitivity of the fair value of these investments to the assumptions that have been made.
Standards and interpretations issued but not yet effectiveAs at 31 March 2018, the following new or amended standards and interpretations, which have not been applied in these financial statements, had been issued by the International Accounting Standards Board (IASB) but are yet to become effective.
IFRS 9 Financial Instruments (effective for accounting periods commencing on or after 1 January 2018).
IFRS 15 Revenue from Contracts with Customers (effective for accounting periods commencing on or after 1 January 2018).
IFRS 16 Leases (effective for accounting periods commencing on or after 1 January 2019).
Amendments resulting from Annual Improvements to IFRS 2014-2016 Cycle (effective for accounting periods commencing on or after 1 January 2018).
The Directors have assessed the impact on the adoption of the standards and interpretations listed above and have concluded that they will not have a material impact on the financial statements of the Consolidated Group in future periods. The Group’s principal revenue streams are dividends and interest from investments, transaction fees, interest on cash balances and other income comprising fees from asset management services. The Group does not expect IFRS 15 to have a material impact on the accounting for these revenue streams. The adoption of IFRS 16 does not have an impact on the Group as it does not hold any operating leases. IFRS 9 will not have a significant impact on the measurement of the Group’s financial assets and liabilities as the Group’s principal financial assets are investments held at fair value through profit or loss which are not impacted by the adoption of IFRS 9. IFRS 9 also changes the classification of financial assets and implements new rules around hedge accounting. The Group does not have any financial assets whose classification will be impacted by
3i Infrastructure plc Annual report and accounts 2018 89
Governance and
accounts
Significant accounting policies continued
adoption of IFRS 9 nor does it apply hedge accounting to any of its derivatives.
The Directors are still undertaking an assessment of the impact of other new standards issued and not endorsed by the EU. It is not anticipated that they would have a material impact on the Group.
A Classification(i) Subsidiaries – Subsidiaries are entities controlled by
the Company. Control exists when the Company is exposed, or has rights, to variable returns from its involvement with the subsidiary entity and has the ability to affect those returns through its power over the subsidiary entity. In accordance with the exception under IFRS 10 Consolidated Financial Statements, the Company only consolidates subsidiaries in the financial statements if they are deemed to perform investment-related services and do not meet the definition of an investment entity. Investments in subsidiaries that do not meet this definition are accounted for as Investments at fair value through profit or loss with changes in fair value recognised in the statement of comprehensive income in the year. The Directors have assessed all entities within the Group structure and concluded that 3i Infrastructure Seed Assets GP Limited is the only subsidiary of the Company that provides investment-related services or activities. This subsidiary has been consolidated with the Company to form ‘the Group’.
(ii) Associates – Associates are those entities in which the Group has significant influence, but not control, over the financial and operating policies. Investments that are held as part of the Group’s investment portfolio are carried in the balance sheet at fair value even though the Group may have significant influence over those entities.
(iii) Joint ventures – Interests in joint ventures that are held as part of the Group’s investment portfolio are carried in the balance sheet at fair value. This treatment is permitted by IFRS 11 and IAS 28, which allows interests held by venture capital organisations where those investments are designated, upon initial recognition, as at fair value through profit or loss and accounted for in accordance with IAS 39, with changes in fair value recognised in the statement of comprehensive income in the year.
B Exchange differencesTransactions entered into by the Group in a currency other than its functional currency are recorded at the rates ruling when the transactions occur. Foreign currency monetary assets and liabilities are translated to the functional currency at the exchange rate ruling at the balance sheet date. Foreign exchange differences arising on translation to the functional currency are recognised in the statement of comprehensive income. Foreign exchange differences relating to investments held at fair value through profit or loss are shown within the line Net gains on investments at fair value through profit or loss. Foreign exchange differences relating to other assets and liabilities are shown within the line Exchange movements.
Non-monetary assets and liabilities that are measured in terms of historical cost in a foreign currency are translated using the exchange rate at the date of the transactions. Non-monetary assets and liabilities denominated in foreign currencies that are stated at fair value are translated to the functional currency using exchange rates ruling at the date the fair value was determined with the associated foreign exchange difference being recognised within the unrealised gain or loss on revaluation of the asset or liability.
C Investment portfolioRecognition and measurement – Investments are recognised and de-recognised on a date where the purchase or sale of an investment is under a contract whose terms require the delivery or settlement of the investment. The Group manages its investments with a view to profiting from the receipt of investment income and obtaining capital appreciation from changes in the fair value of investments. Therefore, all quoted investments and unquoted investments are measured as at fair value through profit or loss upon initial recognition and subsequently carried in the balance sheet at fair value. All investments are initially recognised at the fair value of the consideration given and are subsequently measured at fair value, applying the Group’s valuation policy. Acquisition related costs are accounted for as expenses when incurred.
Net gains or losses on the revaluation of investments are the movement in the fair value of investments between the start and end of the accounting period, or investment disposal date, or the investment acquisition date and the end of the accounting period, converted into sterling using the exchange rates in force at the end of the period; and are recognised in the statement of comprehensive income.
IncomeInvestment income is that portion of income that is directly related to the return from individual investments. It is recognised to the extent that it is probable that there will be an economic benefit and the income can be reliably measured.
3i Infrastructure plc Annual report and accounts 2018
Governance and accounts
90
The following specific recognition criteria must be met before the income is recognised:
• dividends from equity investments are recognised in the statement of comprehensive income when the Company’s rights to receive payment have been established;
• interest income from loans that are measured at fair value through profit or loss is recognised as it accrues by reference to the principal outstanding and the effective interest rate applicable, which is the rate that exactly discounts the estimated future cash flows through the expected life of the financial asset to the asset’s carrying value or principal amount. The remaining changes in the fair value movement of the loans are recognised separately in the line Net gains on investments at fair value through profit or loss in the consolidated statement of comprehensive income;
• distributions from investments in Limited Partnerships are recognised in the statement of comprehensive income when the Company’s rights as a Limited Partner to receive payment have been established; and
• fees receivable represent amounts earned from investee companies on completion of underlying investment transactions and are recognised on an accruals basis once entitlement to the revenue has been established.
D Fees(i) Fees – Fees payable represent fees incurred in the
process of acquiring an investment and are measured on the accruals basis.
(ii) Advisory fee – An annual advisory fee is payable to 3i plc based on the Gross Investment Value of the Group. The fee is payable quarterly in advance and is accrued in the period it is incurred. Further explanations are provided in Note 18.
(iii) Performance fee – 3i plc is entitled to a performance fee based on the Adjusted Total Return per ordinary share generated in the period in excess of a performance hurdle (subject to a high watermark requirement being exceeded). The fee is payable annually in arrears and is accrued in the period it is incurred. Further explanations are provided in Note 18.
(iv) Finance costs – Finance costs associated with loans and borrowings are recognised on an accruals basis using the effective interest method.
E Treasury assets and liabilitiesShort-term treasury assets and short and long-term treasury liabilities are used to manage cash flows and the overall costs of borrowing. Financial assets and liabilities are recognised in the balance sheet when the relevant Group entity becomes a party to the contractual provisions of the instrument.
(i) Cash and cash equivalents – Cash and cash equivalents in the balance sheet and cash flow statement comprise cash at bank, short-term deposits with an original maturity of three months or less and AAA rated money market funds. Interest receivable on cash and cash equivalents is recognised on an accruals basis.
(ii) Bank loans, loan notes and borrowings – Loans and borrowings are initially recognised at the fair value of the consideration received, net of issue costs associated with the borrowings. Where issue costs are incurred in relation to arranging debt finance facilities these are capitalised and disclosed within Trade and other receivables and amortised over the life of the loan. After initial recognition, loans and borrowings are subsequently measured at amortised cost using the effective interest method, which is the rate that exactly discounts the estimated future cash flows through the expected life of the liabilities. Amortised cost is calculated by taking into account any issue costs and any discount or premium on settlement.
(iii) Other financial assets – Other financial assets in the balance sheet comprise principally of restricted cash held on deposit in third-party bank accounts. In the prior year, these were held on behalf of the Mersey Gateway Bridge and A9 primary PPP projects. The Company retains the right to replace any such cash deposits for a letter of credit of the equivalent amount.
(iv) Derivative financial instruments – Derivative financial instruments are used to manage the risk associated with foreign currency fluctuations in the valuation of the investment portfolio and changes in interest rates on borrowings held by Oystercatcher Luxco 2 S.à r.l., an unconsolidated subsidiary. This is achieved by the use of forward foreign currency contracts and interest rate swaps. Such instruments are used for the sole purpose of efficient portfolio management. All derivative financial instruments are held at fair value through profit or loss.
Derivative financial instruments are recognised initially at fair value on the contract date and subsequently re-measured to the fair value at each reporting date. All changes in the fair value of derivative financial instruments are taken to the statement of comprehensive income. The maturity profile of derivative contracts is measured relative to the financial contract settlement date of each contract and the derivative contracts are disclosed in the financial statements as either current or non-current accordingly.
3i Infrastructure plc Annual report and accounts 2018 91
Governance and
accounts
F Other assetsAssets, other than those specifically accounted for under a separate policy, are stated at their consideration receivable less impairment losses. Such assets are short term in nature and the carrying value of these assets is considered to be approximate to their fair value. All assets are reviewed at each balance sheet date to determine whether there is any indication of impairment. If any such indication exists, the asset’s recoverable amount is estimated based on expected discounted future cash flows. Any change in levels of impairment is recognised directly in the statement of comprehensive income. An impairment loss is reversed at subsequent financial reporting dates to the extent that the asset’s carrying amount does not exceed its carrying value, had no impairment been recognised.
G Other liabilitiesLiabilities, other than those specifically accounted for under a separate policy, are stated based on the amounts which are considered to be payable in respect of goods or services received up to the financial reporting date. Such liabilities are short term in nature, the carrying value of these liabilities is considered to be approximate to their fair value.
H Equity and reserves(i) Share capital – Share capital issued by the Company
is recognised at the fair value of proceeds received and is credited to the stated capital account. Direct issue costs net of tax are deducted from the fair value of the proceeds received.
(ii) Equity and reserves – The stated capital account of the Company represents the cumulative proceeds recognised from share issues or new equity issued on the conversion of warrants made by the Company net of issue costs and reduced by any amount that has been transferred to retained reserves, in accordance with Jersey Company Law, in previous years. Share capital is treated as an equity instrument, on the basis that no contractual obligation exists for the Company to deliver cash or other financial assets to the holder of the instrument. The retained reserve incorporates the cumulative retained profits of the Company (after the payment of dividends) plus any amount that has been transferred from the stated capital account of the Company.
(iii) Dividends payable – Dividends on ordinary shares are recognised as a deduction from retained reserves in the period in which the Company’s obligation to make the dividend payment arises.
I TaxTax represents the sum of the tax currently payable, withholding taxes suffered and deferred tax. Tax is charged or credited in the statement of comprehensive income except to the extent that it relates to an amount recognised in the statement of changes in equity when it is recognised directly in this statement.
The tax currently payable is based on the taxable profit for the period. This may differ from the profit included in the consolidated statement of comprehensive income because it excludes items of income or expense that are taxable or deductible in other years and it further excludes items that are never taxable or deductible. The Group’s liability for current tax is calculated using tax rates and laws for each relevant tax jurisdiction in which the Company and its consolidated subsidiary operate that have been enacted or substantively enacted by the financial reporting date.
Deferred tax is the tax expected to be payable or recoverable on differences between the carrying amounts of assets and liabilities in the financial statements and the corresponding tax bases used in the computation of taxable profit and is accounted for using the balance sheet liability method.
Significant accounting policies continued
3i Infrastructure plc Annual report and accounts 2018
Governance and accounts
92
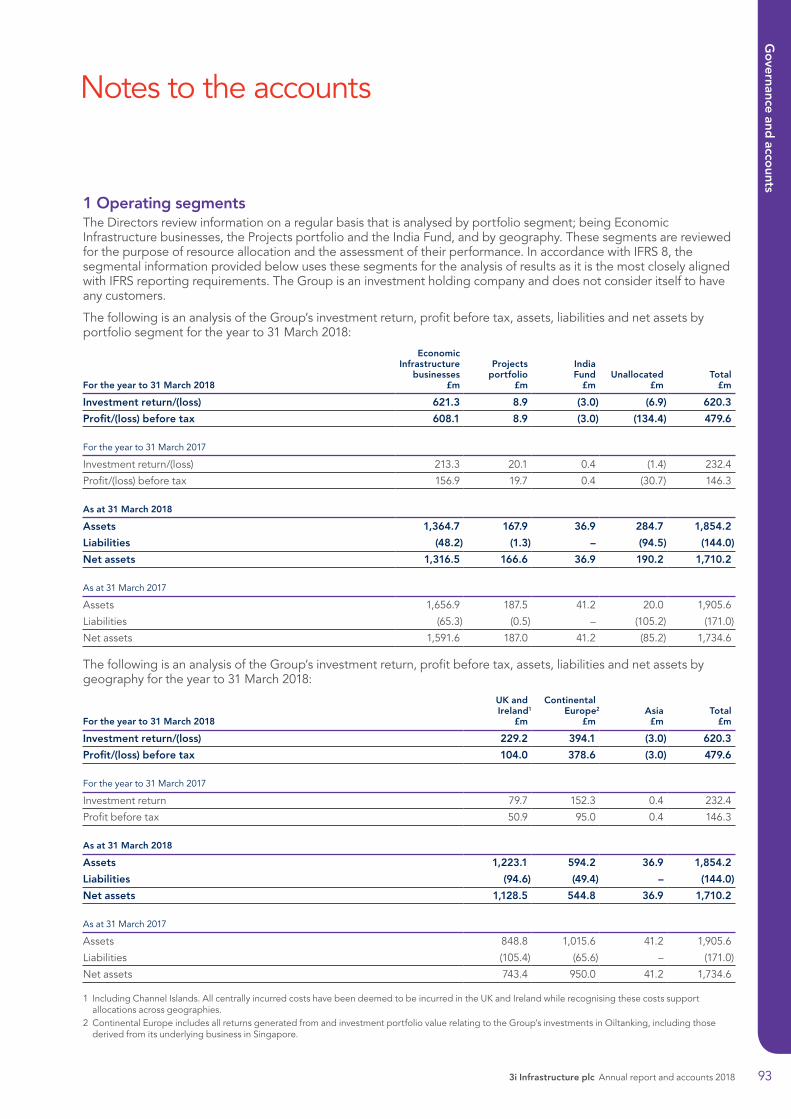
1 Operating segmentsThe Directors review information on a regular basis that is analysed by portfolio segment; being Economic Infrastructure businesses, the Projects portfolio and the India Fund, and by geography. These segments are reviewed for the purpose of resource allocation and the assessment of their performance. In accordance with IFRS 8, the segmental information provided below uses these segments for the analysis of results as it is the most closely aligned with IFRS reporting requirements. The Group is an investment holding company and does not consider itself to have any customers.
The following is an analysis of the Group’s investment return, profit before tax, assets, liabilities and net assets by portfolio segment for the year to 31 March 2018:
For the year to 31 March 2018
EconomicInfrastructure
businesses£m
Projectsportfolio
£m
IndiaFund
£mUnallocated
£mTotal
£m
Investment return/(loss) 621.3 8.9 (3.0) (6.9) 620.3
Profit/(loss) before tax 608.1 8.9 (3.0) (134.4) 479.6
For the year to 31 March 2017
Investment return/(loss) 213.3 20.1 0.4 (1.4) 232.4
Profit/(loss) before tax 156.9 19.7 0.4 (30.7) 146.3
As at 31 March 2018
Assets 1,364.7 167.9 36.9 284.7 1,854.2
Liabilities (48.2) (1.3) – (94.5) (144.0)
Net assets 1,316.5 166.6 36.9 190.2 1,710.2
As at 31 March 2017
Assets 1,656.9 187.5 41.2 20.0 1,905.6
Liabilities (65.3) (0.5) – (105.2) (171.0)
Net assets 1,591.6 187.0 41.2 (85.2) 1,734.6
The following is an analysis of the Group’s investment return, profit before tax, assets, liabilities and net assets by geography for the year to 31 March 2018:
For the year to 31 March 2018
UK andIreland1
£m
ContinentalEurope2
£mAsia£m
Total£m
Investment return/(loss) 229.2 394.1 (3.0) 620.3
Profit/(loss) before tax 104.0 378.6 (3.0) 479.6
For the year to 31 March 2017
Investment return 79.7 152.3 0.4 232.4
Profit before tax 50.9 95.0 0.4 146.3
As at 31 March 2018
Assets 1,223.1 594.2 36.9 1,854.2
Liabilities (94.6) (49.4) – (144.0)
Net assets 1,128.5 544.8 36.9 1,710.2
As at 31 March 2017
Assets 848.8 1,015.6 41.2 1,905.6
Liabilities (105.4) (65.6) – (171.0)
Net assets 743.4 950.0 41.2 1,734.6
1 Including Channel Islands. All centrally incurred costs have been deemed to be incurred in the UK and Ireland while recognising these costs support allocations across geographies.
2 Continental Europe includes all returns generated from and investment portfolio value relating to the Group’s investments in Oiltanking, including those derived from its underlying business in Singapore.
Notes to the accounts
3i Infrastructure plc Annual report and accounts 2018 93
Governance and
accounts
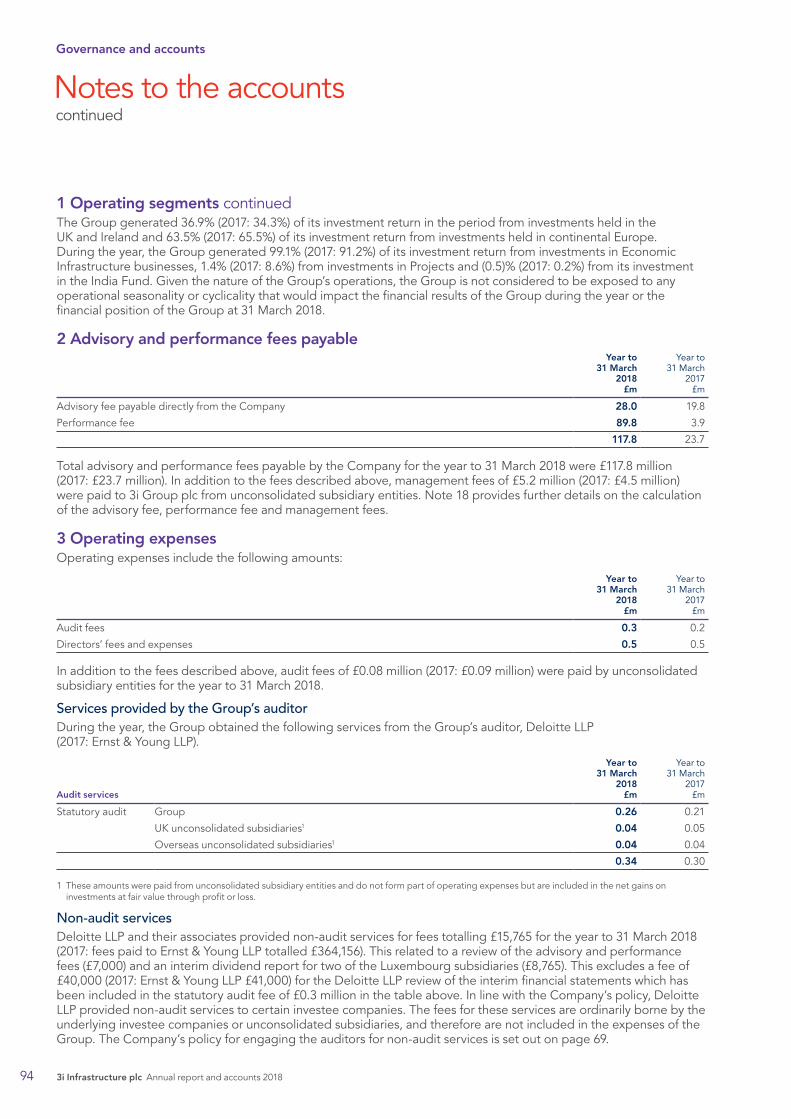
Notes to the accounts continued
1 Operating segments continuedThe Group generated 36.9% (2017: 34.3%) of its investment return in the period from investments held in the UK and Ireland and 63.5% (2017: 65.5%) of its investment return from investments held in continental Europe. During the year, the Group generated 99.1% (2017: 91.2%) of its investment return from investments in Economic Infrastructure businesses, 1.4% (2017: 8.6%) from investments in Projects and (0.5)% (2017: 0.2%) from its investment in the India Fund. Given the nature of the Group’s operations, the Group is not considered to be exposed to any operational seasonality or cyclicality that would impact the financial results of the Group during the year or the financial position of the Group at 31 March 2018.
2 Advisory and performance fees payableYear to
31 March2018
£m
Year to31 March
2017 £m
Advisory fee payable directly from the Company 28.0 19.8
Performance fee 89.8 3.9
117.8 23.7
Total advisory and performance fees payable by the Company for the year to 31 March 2018 were £117.8 million (2017: £23.7 million). In addition to the fees described above, management fees of £5.2 million (2017: £4.5 million) were paid to 3i Group plc from unconsolidated subsidiary entities. Note 18 provides further details on the calculation of the advisory fee, performance fee and management fees.
3 Operating expensesOperating expenses include the following amounts:
Year to31 March
2018£m
Year to31 March
2017£m
Audit fees 0.3 0.2
Directors’ fees and expenses 0.5 0.5
In addition to the fees described above, audit fees of £0.08 million (2017: £0.09 million) were paid by unconsolidated subsidiary entities for the year to 31 March 2018.
Services provided by the Group’s auditorDuring the year, the Group obtained the following services from the Group’s auditor, Deloitte LLP (2017: Ernst & Young LLP).
Audit services
Year to31 March
2018 £m
Year to31 March
2017£m
Statutory audit Group 0.26 0.21
UK unconsolidated subsidiaries1 0.04 0.05
Overseas unconsolidated subsidiaries1 0.04 0.04
0.34 0.30
1 These amounts were paid from unconsolidated subsidiary entities and do not form part of operating expenses but are included in the net gains on investments at fair value through profit or loss.
Non-audit servicesDeloitte LLP and their associates provided non-audit services for fees totalling £15,765 for the year to 31 March 2018 (2017: fees paid to Ernst & Young LLP totalled £364,156). This related to a review of the advisory and performance fees (£7,000) and an interim dividend report for two of the Luxembourg subsidiaries (£8,765). This excludes a fee of £40,000 (2017: Ernst & Young LLP £41,000) for the Deloitte LLP review of the interim financial statements which has been included in the statutory audit fee of £0.3 million in the table above. In line with the Company’s policy, Deloitte LLP provided non-audit services to certain investee companies. The fees for these services are ordinarily borne by the underlying investee companies or unconsolidated subsidiaries, and therefore are not included in the expenses of the Group. The Company’s policy for engaging the auditors for non-audit services is set out on page 69.
3i Infrastructure plc Annual report and accounts 2018
Governance and accounts
94
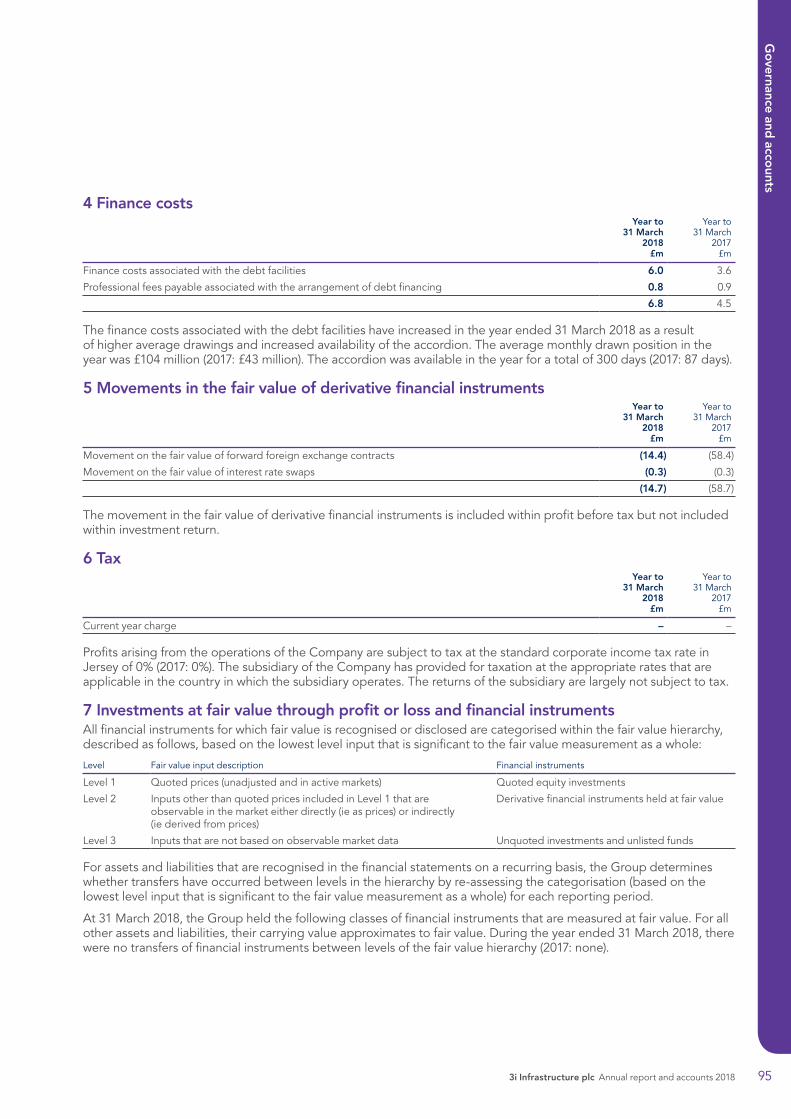
4 Finance costsYear to
31 March2018
£m
Year to31 March
2017£m
Finance costs associated with the debt facilities 6.0 3.6
Professional fees payable associated with the arrangement of debt financing 0.8 0.9
6.8 4.5
The finance costs associated with the debt facilities have increased in the year ended 31 March 2018 as a result of higher average drawings and increased availability of the accordion. The average monthly drawn position in the year was £104 million (2017: £43 million). The accordion was available in the year for a total of 300 days (2017: 87 days).
5 Movements in the fair value of derivative financial instrumentsYear to
31 March2018
£m
Year to31 March
2017£m
Movement on the fair value of forward foreign exchange contracts (14.4) (58.4)
Movement on the fair value of interest rate swaps (0.3) (0.3)
(14.7) (58.7)
The movement in the fair value of derivative financial instruments is included within profit before tax but not included within investment return.
6 TaxYear to
31 March2018
£m
Year to31 March
2017£m
Current year charge – –
Profits arising from the operations of the Company are subject to tax at the standard corporate income tax rate in Jersey of 0% (2017: 0%). The subsidiary of the Company has provided for taxation at the appropriate rates that are applicable in the country in which the subsidiary operates. The returns of the subsidiary are largely not subject to tax.
7 Investments at fair value through profit or loss and financial instrumentsAll financial instruments for which fair value is recognised or disclosed are categorised within the fair value hierarchy, described as follows, based on the lowest level input that is significant to the fair value measurement as a whole:
Level Fair value input description Financial instruments
Level 1 Quoted prices (unadjusted and in active markets) Quoted equity investments
Level 2 Inputs other than quoted prices included in Level 1 that are observable in the market either directly (ie as prices) or indirectly (ie derived from prices)
Derivative financial instruments held at fair value
Level 3 Inputs that are not based on observable market data Unquoted investments and unlisted funds
For assets and liabilities that are recognised in the financial statements on a recurring basis, the Group determines whether transfers have occurred between levels in the hierarchy by re-assessing the categorisation (based on the lowest level input that is significant to the fair value measurement as a whole) for each reporting period.
At 31 March 2018, the Group held the following classes of financial instruments that are measured at fair value. For all other assets and liabilities, their carrying value approximates to fair value. During the year ended 31 March 2018, there were no transfers of financial instruments between levels of the fair value hierarchy (2017: none).
3i Infrastructure plc Annual report and accounts 2018 95
Governance and
accounts
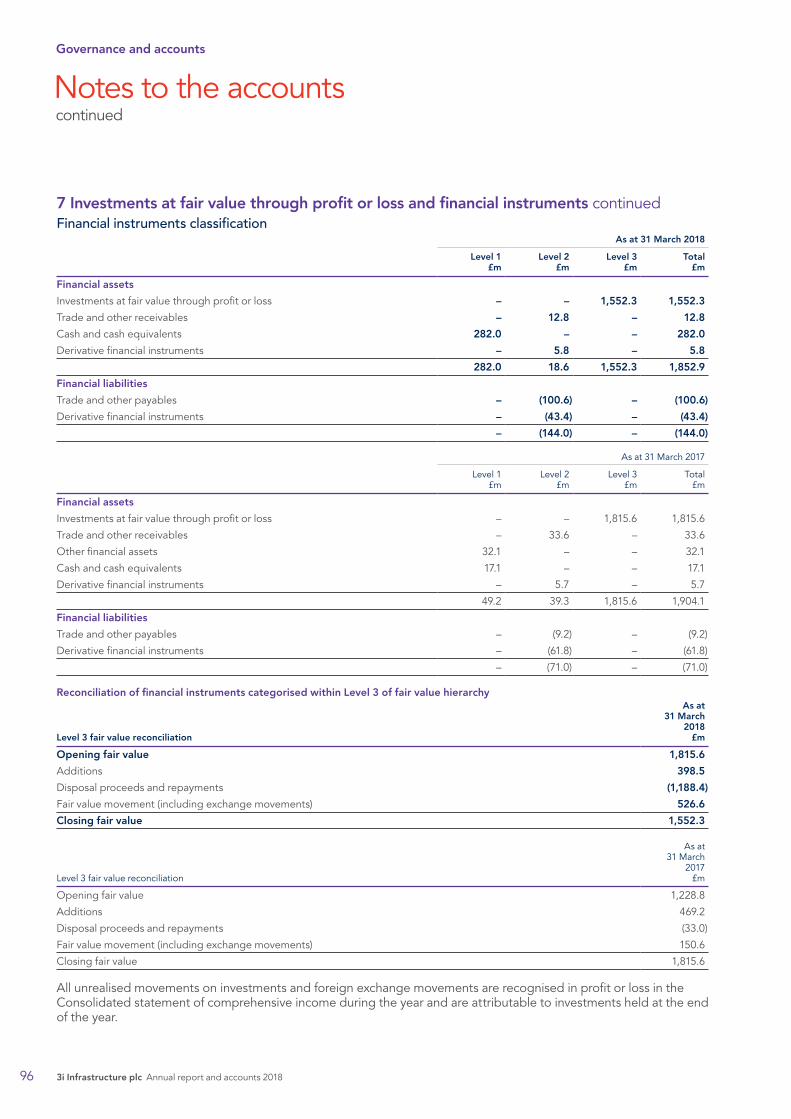
Notes to the accounts continued
7 Investments at fair value through profit or loss and financial instruments continuedFinancial instruments classification
As at 31 March 2018
Level 1£m
Level 2£m
Level 3£m
Total£m
Financial assets
Investments at fair value through profit or loss – – 1,552.3 1,552.3
Trade and other receivables – 12.8 – 12.8
Cash and cash equivalents 282.0 – – 282.0
Derivative financial instruments – 5.8 – 5.8
282.0 18.6 1,552.3 1,852.9
Financial liabilities
Trade and other payables – (100.6) – (100.6)
Derivative financial instruments – (43.4) – (43.4)
– (144.0) – (144.0)
As at 31 March 2017
Level 1£m
Level 2£m
Level 3£m
Total£m
Financial assets
Investments at fair value through profit or loss – – 1,815.6 1,815.6
Trade and other receivables – 33.6 – 33.6
Other financial assets 32.1 – – 32.1
Cash and cash equivalents 17.1 – – 17.1
Derivative financial instruments – 5.7 – 5.7
49.2 39.3 1,815.6 1,904.1
Financial liabilities
Trade and other payables – (9.2) – (9.2)
Derivative financial instruments – (61.8) – (61.8)
– (71.0) – (71.0)
Reconciliation of financial instruments categorised within Level 3 of fair value hierarchy
Level 3 fair value reconciliation
As at31 March
2018£m
Opening fair value 1,815.6
Additions 398.5
Disposal proceeds and repayments (1,188.4)
Fair value movement (including exchange movements) 526.6
Closing fair value 1,552.3
Level 3 fair value reconciliation
As at31 March
2017£m
Opening fair value 1,228.8
Additions 469.2
Disposal proceeds and repayments (33.0)
Fair value movement (including exchange movements) 150.6
Closing fair value 1,815.6
All unrealised movements on investments and foreign exchange movements are recognised in profit or loss in the Consolidated statement of comprehensive income during the year and are attributable to investments held at the end of the year.
3i Infrastructure plc Annual report and accounts 2018
Governance and accounts
96
7 Investments at fair value through profit or loss and financial instruments continuedThe holding period of the investments in the portfolio is expected to be greater than one year. Therefore investments are classified as non-current unless there is an agreement to dispose of the investment within one year and all relevant regulatory approvals have been received. It is not possible to identify with certainty whether any investments may be sold within one year.
Investment income of £94.2 million (2017: £80.5 million) comprises dividend income of £11.3 million (2017: £11.7 million), interest of £57.5 million (2017: £40.2 million) and distributions of £25.4 million (2017: £28.6 million) from unconsolidated subsidiaries.
Unquoted investmentsThe Group invests in private companies which are not quoted on an active market. These are measured in accordance with the International Private Equity Valuation guidelines with reference to the most appropriate information available at the time of measurement. Further information regarding the valuation of unquoted investments can be found in the Portfolio valuation methodology section.
The Group’s policy is to fair value both the equity and shareholder debt investments in infrastructure assets together where they will be managed and valued as a single investment, were invested at the same time and cannot be realised separately. The Directors consider that equity and debt share the same characteristics and risks and they are therefore treated as a single unit of account for valuation purposes and a single class for disclosure purposes. As at 31 March 2018, the fair value of unquoted investments was £1,527.3 million (2017: £1,788.3 million). Individual portfolio asset valuations are shown within the Portfolio summary.
The majority of the assets held within Level 3 are valued on a discounted cash flow basis, hence, the valuations are sensitive to the discount rate assumed in the valuation of each asset. Other significant unobservable inputs include the long-term inflation rate assumption, the interest rates assumption used to project the future cash flows and the forecast cash flows themselves, the sensitivities of which are captured in the Market risk section in Note 9.
A discussion of discount rates applied can be found in the Movements in portfolio valuation methodology section. Increasing the discount rate used in the valuation of each asset by 1% would reduce the value of the portfolio by £130.1 million (2017: £167.4 million). Decreasing the discount rate used in the valuation of each asset by 1% would increase the value of the portfolio by £151.9 million (2017: £200.1 million).
The majority of assets held within Level 3 have revenues that are linked, partially linked or in some way correlated to inflation. The long-term inflation rate assumptions for the country of domicile of the investments in the portfolio range from 5.0% (India) (2017: 5.0%) to 2.0% (Netherlands) (2017: 2.0%) including the UK at 2.5% (UK RPI) (2017: 2.5%). Changing the inflation rate assumption may result in consequential changes to other assumptions used in the valuation of each asset. The impact of increasing the inflation rate assumption by 1% for the next two years would increase the value of the portfolio by £39.1 million (2017: £41.3 million). Decreasing the inflation rate assumption used in the valuation of each asset by 1% for the next two years would decrease the value of the portfolio by £38.6 million (2017: £40.9 million).
The valuations are sensitive to changes in interest rates, which may result from: (i) unhedged existing borrowings within portfolio companies; (ii) interest rates on uncommitted future borrowings assumed within the asset valuations; and (iii) cash deposits held by portfolio companies. These comprise a wide range of interest rates from short-term deposit rates to longer-term borrowing rates across a broad range of debt products. Increasing the cost of borrowing assumption for unhedged borrowings and any future uncommitted borrowing and the cash deposit rates used in the valuation of each asset by 1% would reduce the value of the portfolio by £56.3 million (2017: £111.6 million). Decreasing the interest rate assumption used in the valuation of each asset by 1% would increase the value of the portfolio by £54.3 million (2017: £114.0 million). This calculation does not take account of any offsetting variances which may be expected to prevail if interest rates changed, including the impact of inflation discussed above.
Unlisted fundsThe Company invests in one externally managed fund, The Dalmore Capital Fund, which is not quoted in an active market. The Company considered the valuation techniques and inputs used in valuing this fund to ensure they are reasonable and appropriate and therefore the net asset value (‘NAV’) of this fund may be used as an input into measuring its fair value. In measuring this fair value, the NAV of the fund is adjusted, as necessary, to reflect restrictions on redemptions, future commitments, illiquid nature of the investments and other specific factors of the fund and fund manager. The Company classifies the fair value of this investment as Level 3. As at 31 March 2018, the fair value of unlisted funds was £18.6 million (2017: £17.6 million). The fund NAV reflects a 31 March 2018 valuation date (2017: 31 March 2017 valuation date). A 10% adjustment in the NAV of the fund would result in a £1.9 million (2017: £1.8 million) change in the valuation.
3i Infrastructure plc Annual report and accounts 2018 97
Governance and
accounts
Notes to the accounts continued
7 Investments at fair value through profit or loss and financial instruments continuedIntermediate holding companiesThe Company invests in a number of intermediate holding companies that are used to hold the unquoted investments, valued as referred to above. All other assets and liabilities of the intermediate holding companies are held either at fair value or a reasonable approximation to fair value. The fair value of these intermediate holding companies therefore approximates to their NAV and the Company classifies the fair value as Level 3. As at 31 March 2018, the fair value of the other assets and liabilities within these intermediate holding companies was £6.4 million (2017: £9.7 million).
Over-the-counter derivativesThe Company uses over-the-counter foreign currency derivatives and interest rate swaps to hedge foreign currency movements and interest rates respectively. The derivatives are held at fair value which represents the price that would be received to sell or transfer the instruments at the balance sheet date. The valuation technique incorporates various inputs including foreign exchange spot and forward rates, interest rate curves, and uses present value calculations. For these financial instruments, significant inputs into models are market observable and are included within Level 2.
Valuation process for Level 3 valuationsValuations are the responsibility of the Board of Directors of the Company. The valuation of unquoted investments, debt and unlisted funds held by the Group is performed on a half-yearly basis by the valuation team of the Investment Adviser and reviewed by the Investment Committee of the Investment Adviser. The valuations are also subject to quality assurance procedures performed within the valuation team. The valuation team verifies the major inputs applied in the latest valuation by agreeing the information in the valuation computation to relevant documents and market information. On a half-yearly basis, the Investment Committee presents the valuations to the Board. This includes a discussion of the major assumptions used in the valuations, with an emphasis on the more significant investments and investments with significant fair value changes. The Investment Committee considers the appropriateness of the valuation methods and inputs, and may request that alternative valuation methods are applied to support the valuation arising from the method chosen. Any changes in valuation methods are discussed and agreed with the Audit and Risk Committee before being approved by the Board.
8 Trade and other receivablesYear to
31 March2018
£m
Year to31 March
2017£m
Prepayments and accrued income 12.8 33.6
Capitalised finance costs 1.3 1.5
14.1 35.1
The carrying value of the trade and other receivables balance equates to fair value and all balances are expected to be settled within one year (2017: same). £10.6 million (2017: £31.2 million) of prepayments and accrued income was due from unconsolidated subsidiaries. No balances are considered to be past due or impaired (2017: same).
9 Financial risk managementA full review of the Group’s objectives, policies and processes for managing and monitoring risk is set out in the Risk report on page 45. This Note provides further detail on financial risk management, cross-referring to the Risk report where applicable and providing further quantitative data on specific financial risks.
Each investment made by the Group is subject to a full risk assessment through a consistent investment approval process. The Board’s Investment Committee and the Investment Adviser’s investment process are part of the overall risk management framework of the Group.
The funding objective of the Group is that each category of investment ought to be broadly matched with liabilities and shareholders’ funds according to the risk and maturity characteristics of the assets, and that funding needs are to be met ahead of planned investment.
3i Infrastructure plc Annual report and accounts 2018
Governance and accounts
98

9 Financial risk management continuedCapital structureThe Group has a continuing commitment to capital efficiency. The capital structure of the Group consists of cash held on deposit, borrowing facilities and shareholders’ equity. The Company’s Articles require its outstanding borrowings, including any financial guarantees to support subsequent obligations, to be limited to 50% of the gross assets of the Group. The type and maturity of the Group’s borrowings are analysed in Note 11 and the Group’s equity is analysed into its various components in the Consolidated statement of changes in equity. Capital is managed so as to maximise the return to shareholders, while maintaining a strong capital base that ensures that the Group can operate effectively in the marketplace and sustain future development of the business. The Board is responsible for regularly monitoring capital requirements to ensure that the Company is maintaining sufficient capital to meet its future investment needs.
The Company is regulated under the provisions of the Collective Investment Funds (Jersey) Law 1988 as a closed-ended collective investment fund and is not required as a result of such regulation to maintain a minimum level of capital.
Capital is allocated for investment in utilities, communications, transportation, natural resources and social infrastructure across the UK, continental Europe and Asia, as described on page 4. As set out in the Group’s investment policy, the maximum exposure to any one investment is 25% of gross assets (including cash holdings) at the time of investment.
Credit riskThe Group is subject to credit risk on the debt component of its unquoted investments, cash, deposits, derivative contracts and receivables. The maximum exposure to credit risk as a result of counterparty default equates to the current carrying value of these financial assets. Throughout the year and the prior year, the Group’s cash and deposits were held with a variety of counterparties, principally in AAA rated money market funds, as well as in short-term bank deposits with a minimum of a BBB+ credit rating. The counterparties selected for the derivative financial instruments were all banks with a minimum of a BBB+ credit rating with at least one major rating agency. The credit quality of unquoted investments, which are held at fair value and include debt and equity elements, is based on the financial performance of the individual portfolio companies. The credit risk relating to these assets is based on their enterprise value and is reflected through fair value movements. The performance of underlying investments is monitored by the Board to assess future recoverability.
For those assets and income entitlements that are not past due, it is believed that the risk of default is small and capital repayments and interest payments will be made in accordance with the agreed terms and conditions of the investment. If the portfolio company has failed and there is no expectation to recover any residual value from the investment, the Group’s policy is to record an impairment for the full amount of the loan. When the net present value of the future cash flows predicted to arise from the asset, discounted using the effective interest rate method, implies non-recovery of all or part of the Group’s investment a fair value movement is recorded equal to the valuation shortfall.
No assets held by the Group were considered to be impaired. The Company had no loans or receivables or debt investments considered past due (2017: nil).
The Company actively manages counterparty risk. Counterparty limits are set and closely monitored by the Board and a regular review of counterparties is undertaken by the Investment Adviser and the Board. As at 31 March 2018, the Group did not consider itself to have a significant exposure to any one counterparty and held deposits and derivative contracts with a number of different counterparties to reduce counterparty risk.
Due to the size and nature of the investment portfolio there is concentration risk due to the size of the investments. This risk is managed by diversifying the portfolio by sector and geography. See page 4 for an analysis of the portfolio by sector and geography. The risk exposure at this year end has reduced compared to the prior year end following the new investments during the year and the sale of two of the largest investments in the portfolio.
3i Infrastructure plc Annual report and accounts 2018 99
Governance and
accounts
Notes to the accounts continued
9 Financial risk management continuedLiquidity riskFurther information on how liquidity risk is managed is provided in the Risk report. The table below analyses the maturity of the Group’s contractual liabilities.
2018
Payableon demand
£m
Due within1 year
£m
Duebetween
1 and 2 years£m
Duebetween
2 and 5 years£m
Total£m
Liabilities
Loans and borrowings1 – (2.7) (2.5) (0.3) (5.5)
Trade and other payables (94.7) – (5.9) – (100.6)
Derivative contracts – (13.7) (21.8) (7.9) (43.4)
Financial commitments2 (213.2) (33.9) (16.6) – (263.7)
Total undiscounted financial liabilities (307.9) (50.3) (46.8) (8.2) (413.2)
1 Loans and borrowings relate to undrawn commitment fees and interest payable on the Revolving Credit Facility referred to in Note 11.2 Financial commitments are described in Note 16 and are not recognised in the Consolidated balance sheet.
2017
Payableon demand
£m
Due within1 year
£m
Duebetween
1 and 2 years£m
Duebetween
2 and 5 years£m
Total£m
Liabilities
Loans and borrowings1 – (5.4) (3.9) (104.1) (113.4)
Trade and other payables (5.4) – – (3.8) (9.2)
Derivative contracts – (18.4) (20.1) (23.3) (61.8)
Financial commitments2 (40.2) (13.1) (43.7) (5.6) (102.6)
Total undiscounted financial liabilities (45.6) (36.9) (67.7) (136.8) (287.0)
1 Loans and borrowings relate to cash drawn from, and undrawn commitment fees and interest payable on, the Revolving Credit Facility referred to in Note 11.2 Financial commitments are described in Note 16 and are not recognised in the Consolidated balance sheet.
All derivatives are settled net and therefore the liability shown is the net cash flow expected to be paid on settlement. The financial commitments relate to the Group’s commitments to the 3i India Infrastructure Fund, Valorem, and the A9, RIVM, La Santé, Condorcet, Hart van Zuid and A27/A1 projects and no discount has been applied. During the year, the Group invested subordinated debt in the Mersey Gateway Bridge project and, as a result, a prior year financial commitment of £13.1 million was extinguished.
In order to manage the contractual liquidity risk the Group is not dependent on the cash flows from financial assets as it has free cash and debt facilities in place.
Market riskThe valuation of the Group’s investment portfolio is largely dependent on the underlying trading performance of the companies within the portfolio, but the valuation of the portfolio and the carrying value of other items in the financial statements can also be affected by interest rate, currency and market price fluctuations. The Group’s sensitivities to these fluctuations are set out below.
(i) Interest rate riskFurther information on how interest rate risk is managed is provided in the Risk report section.
An increase of 100 basis points in interest rates over 12 months (2017: 100 basis points) would lead to an approximate increase in net assets and to the net profit of the Group of £2.8 million (2017: decrease of £0.8 million). This exposure relates principally to changes in interest receivable on cash on deposit held at the year end. Due to changes in the economic environment the sensitivity shown here has been reduced from the 250 basis points used in the prior year. The average cash balance of the Group, which is more representative of the cash balance during the year, was £44.4 million (2017: £121.7 million) and the weighted average interest earned was (0.3)% (2017: 0.3%). The risk exposure at this year end has decreased compared to the prior year end following the repayment of cash drawn on the Revolving Credit Facility.
3i Infrastructure plc Annual report and accounts 2018
Governance and accounts
100
9 Financial risk management continuedIn addition, the Group has indirect exposure to interest rates through changes to the financial performance of portfolio companies caused by interest rate fluctuations as disclosed in Note 7. This risk is considered a component of market risk described in section (iii). The Group does not hold any fixed rate debt investments or borrowings and is therefore not exposed to fair value interest rate risk.
(ii) Currency riskFurther information on how currency risk is managed is provided in the Risk report. The currency denominations of the Group’s net assets are shown in the table below. The sensitivity analysis demonstrates the exposure of the Group’s net assets to movements in foreign currency exchange rates. The hedging strategy is discussed on page 23.
As at 31 March 2018
Sterling1
£mEuro
£mDKK
£mUS dollar
£mTotal
£m
Net assets 859.5 666.5 147.3 36.9 1,710.2
Sensitivity analysis
Assuming a 10% appreciation in sterling against the euro, DKK and US dollar exchange rates:
Impact of exchange movements on net profit and net assets 71.0 (60.6) (13.4) (3.4) (6.4)
1 Sterling impact relates to the impact of fair value movement in derivatives held by the Company to hedge foreign currency fluctuations in the valuation of the investment portfolio. The notional amount of the derivatives is disclosed in Note 10.
As at 31 March 2017
Sterling1
£mEuro
£mDKK
£mUS dollar
£mTotal
£m
Net assets 737.4 838.3 117.7 41.2 1,734.6
Sensitivity analysis
Assuming a 10% appreciation in sterling against the euro, DKK and US dollar exchange rates:
Impact of exchange movements on net profit and net assets 100.5 (76.2) (10.7) (3.7) 9.9
1 Sterling impact relates to the impact of fair value movement in derivatives held by the Company to hedge foreign currency fluctuations in the valuation of the investment portfolio. The notional amount of the derivatives is disclosed in Note 10.
The impact of an equivalent depreciation in sterling against the euro, DKK and US dollar exchange rates has the inverse impact on net profit and net assets from that shown above. There is an indirect exposure to the rupee through the investment in the 3i India Infrastructure Fund which is denominated in US dollars but it is only the direct exposure that is considered here. The risk exposure at the year end is considered to be representative of this year as a whole.
(iii) Market riskFurther information about the management of external market risk and its impact on price or valuation, which arises principally from unquoted investments, is provided in the Risk report. A 10% increase in the fair value of those investments would have the following direct impact on net profit and net assets. The impact of a change in all cash flows has an equivalent impact on the fair value, as set out below.
As at31 March
2018Investments at fair value
£m
As at31 March
2017Investments at fair value
£m
Increase in net profit and net assets 155.2 181.6
3i Infrastructure plc Annual report and accounts 2018 101
Governance and
accounts
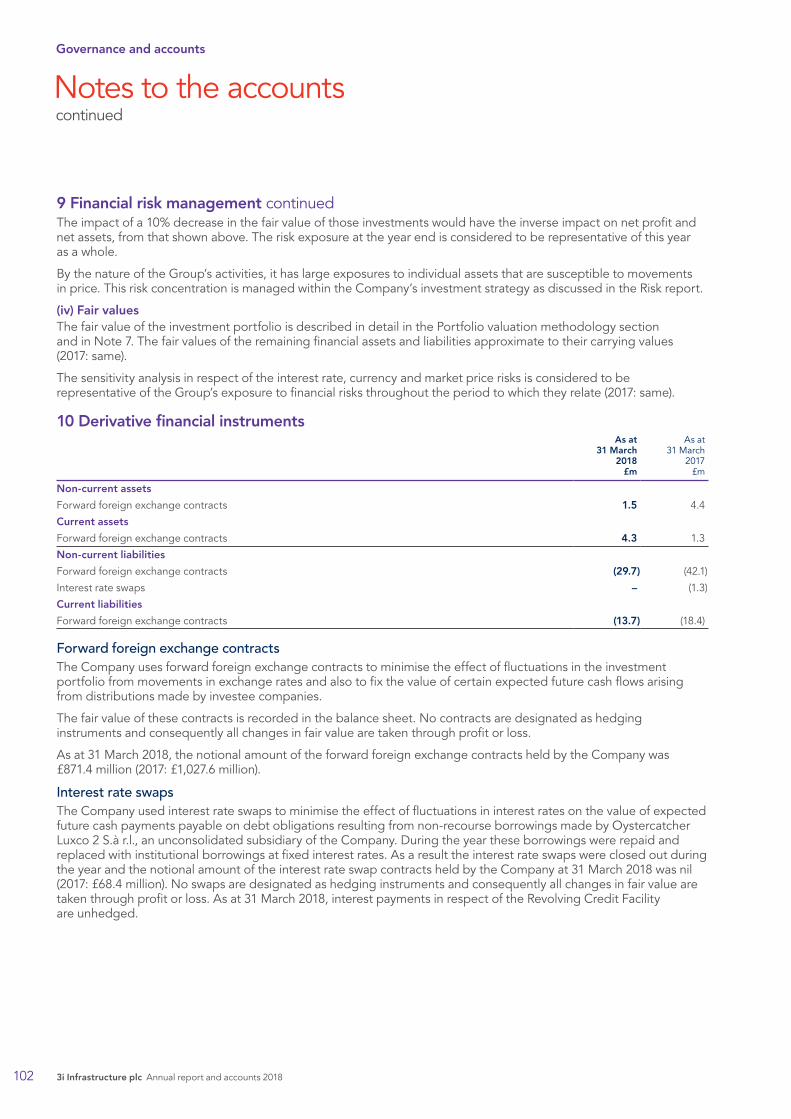
Notes to the accounts continued
9 Financial risk management continuedThe impact of a 10% decrease in the fair value of those investments would have the inverse impact on net profit and net assets, from that shown above. The risk exposure at the year end is considered to be representative of this year as a whole.
By the nature of the Group’s activities, it has large exposures to individual assets that are susceptible to movements in price. This risk concentration is managed within the Company’s investment strategy as discussed in the Risk report.
(iv) Fair valuesThe fair value of the investment portfolio is described in detail in the Portfolio valuation methodology section and in Note 7. The fair values of the remaining financial assets and liabilities approximate to their carrying values (2017: same).
The sensitivity analysis in respect of the interest rate, currency and market price risks is considered to be representative of the Group’s exposure to financial risks throughout the period to which they relate (2017: same).
10 Derivative financial instrumentsAs at
31 March 2018
£m
As at31 March
2017£m
Non-current assets
Forward foreign exchange contracts 1.5 4.4
Current assets
Forward foreign exchange contracts 4.3 1.3
Non-current liabilities
Forward foreign exchange contracts (29.7) (42.1)
Interest rate swaps – (1.3)
Current liabilities
Forward foreign exchange contracts (13.7) (18.4)
Forward foreign exchange contractsThe Company uses forward foreign exchange contracts to minimise the effect of fluctuations in the investment portfolio from movements in exchange rates and also to fix the value of certain expected future cash flows arising from distributions made by investee companies.
The fair value of these contracts is recorded in the balance sheet. No contracts are designated as hedging instruments and consequently all changes in fair value are taken through profit or loss.
As at 31 March 2018, the notional amount of the forward foreign exchange contracts held by the Company was £871.4 million (2017: £1,027.6 million).
Interest rate swapsThe Company used interest rate swaps to minimise the effect of fluctuations in interest rates on the value of expected future cash payments payable on debt obligations resulting from non-recourse borrowings made by Oystercatcher Luxco 2 S.à r.l., an unconsolidated subsidiary of the Company. During the year these borrowings were repaid and replaced with institutional borrowings at fixed interest rates. As a result the interest rate swaps were closed out during the year and the notional amount of the interest rate swap contracts held by the Company at 31 March 2018 was nil (2017: £68.4 million). No swaps are designated as hedging instruments and consequently all changes in fair value are taken through profit or loss. As at 31 March 2018, interest payments in respect of the Revolving Credit Facility are unhedged.
3i Infrastructure plc Annual report and accounts 2018
Governance and accounts
102
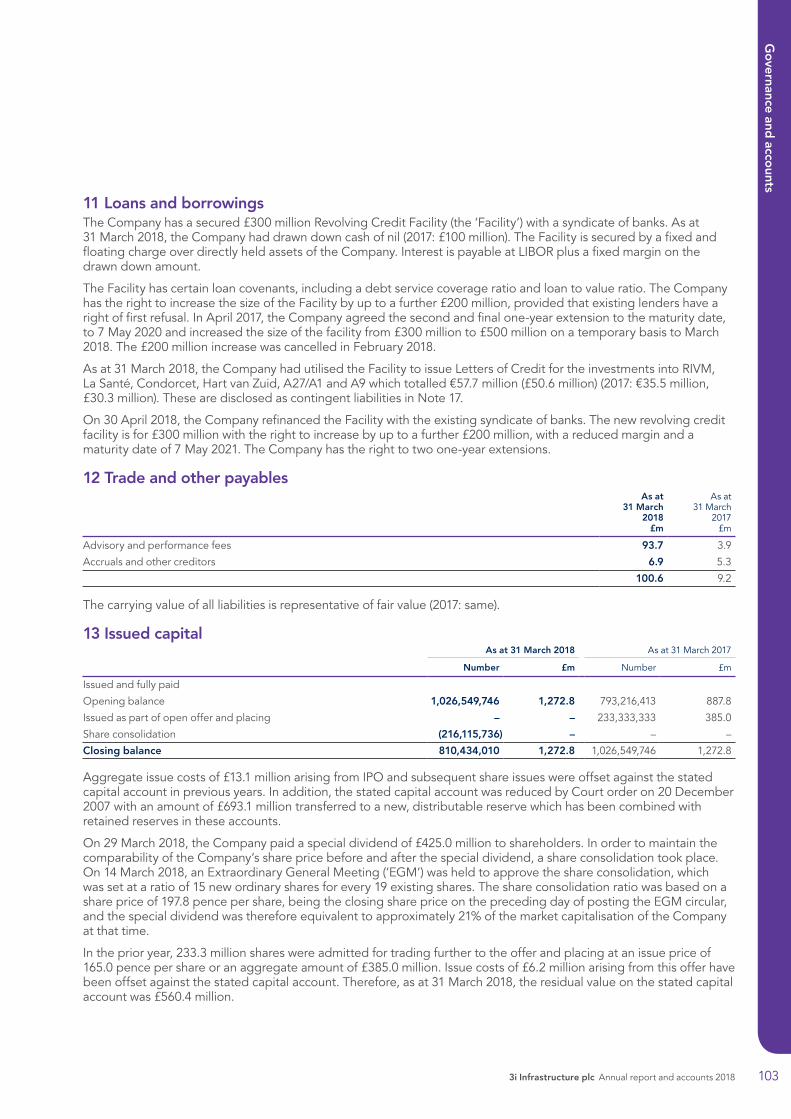
11 Loans and borrowingsThe Company has a secured £300 million Revolving Credit Facility (the ‘Facility’) with a syndicate of banks. As at 31 March 2018, the Company had drawn down cash of nil (2017: £100 million). The Facility is secured by a fixed and floating charge over directly held assets of the Company. Interest is payable at LIBOR plus a fixed margin on the drawn down amount.
The Facility has certain loan covenants, including a debt service coverage ratio and loan to value ratio. The Company has the right to increase the size of the Facility by up to a further £200 million, provided that existing lenders have a right of first refusal. In April 2017, the Company agreed the second and final one-year extension to the maturity date, to 7 May 2020 and increased the size of the facility from £300 million to £500 million on a temporary basis to March 2018. The £200 million increase was cancelled in February 2018.
As at 31 March 2018, the Company had utilised the Facility to issue Letters of Credit for the investments into RIVM, La Santé, Condorcet, Hart van Zuid, A27/A1 and A9 which totalled €57.7 million (£50.6 million) (2017: €35.5 million, £30.3 million). These are disclosed as contingent liabilities in Note 17.
On 30 April 2018, the Company refinanced the Facility with the existing syndicate of banks. The new revolving credit facility is for £300 million with the right to increase by up to a further £200 million, with a reduced margin and a maturity date of 7 May 2021. The Company has the right to two one-year extensions.
12 Trade and other payablesAs at
31 March 2018
£m
As at31 March
2017£m
Advisory and performance fees 93.7 3.9
Accruals and other creditors 6.9 5.3
100.6 9.2
The carrying value of all liabilities is representative of fair value (2017: same).
13 Issued capitalAs at 31 March 2018 As at 31 March 2017
Number £m Number £m
Issued and fully paid
Opening balance 1,026,549,746 1,272.8 793,216,413 887.8
Issued as part of open offer and placing – – 233,333,333 385.0
Share consolidation (216,115,736) – – –
Closing balance 810,434,010 1,272.8 1,026,549,746 1,272.8
Aggregate issue costs of £13.1 million arising from IPO and subsequent share issues were offset against the stated capital account in previous years. In addition, the stated capital account was reduced by Court order on 20 December 2007 with an amount of £693.1 million transferred to a new, distributable reserve which has been combined with retained reserves in these accounts.
On 29 March 2018, the Company paid a special dividend of £425.0 million to shareholders. In order to maintain the comparability of the Company’s share price before and after the special dividend, a share consolidation took place. On 14 March 2018, an Extraordinary General Meeting (‘EGM’) was held to approve the share consolidation, which was set at a ratio of 15 new ordinary shares for every 19 existing shares. The share consolidation ratio was based on a share price of 197.8 pence per share, being the closing share price on the preceding day of posting the EGM circular, and the special dividend was therefore equivalent to approximately 21% of the market capitalisation of the Company at that time.
In the prior year, 233.3 million shares were admitted for trading further to the offer and placing at an issue price of 165.0 pence per share or an aggregate amount of £385.0 million. Issue costs of £6.2 million arising from this offer have been offset against the stated capital account. Therefore, as at 31 March 2018, the residual value on the stated capital account was £560.4 million.
3i Infrastructure plc Annual report and accounts 2018 103
Governance and
accounts

Notes to the accounts continued
14 Per share informationThe earnings and net assets per share attributable to the equity holders of the Company are based on the following data:
Year to31 March
2018
Year to31 March
2017
Earnings per share (pence)
Basic and diluted 47.2 14.9
Earnings (£m)
Profit after tax for the year 479.6 146.3
Number of shares (million)
Weighted average number of shares in issue 1,016.5 981.2
Number of shares at the end of the year 810.4 1,026.5
As at31 March
2018
As at31 March
2017
Net assets per share (pence)
Basic and diluted 211.0 169.0
Net assets (£m)
Net assets 1,710.2 1,734.6
15 DividendsYear to 31 March 2018 Year to 31 March 2017
Declared and paid during the yearPence per
share £mPence per
share £m
Special dividend paid on ordinary shares 41.400 425.0 – –
Interim dividend paid on ordinary shares 3.925 40.3 3.775 38.8
Prior year final dividend paid on ordinary shares 3.775 38.7 3.625 28.7
49.100 504.0 7.400 67.5
On 29 March 2018, the Company implemented a return of capital by way of a special dividend of 41.4 pence per share which equated to a total amount returned of £425.0 million. The special dividend was paid to those shareholders that were on the register on 14 March 2018.
The Company proposes paying a final dividend of 3.925 pence per share (2017: 3.775 pence) which will be payable to those shareholders that are on the register on 15 June 2018. On the basis of the shares in issue at year end, this would equate to a total final dividend of £31.8 million (2017: £38.7 million).
The final dividend is subject to approval by shareholders at the AGM in July 2018 and has therefore not been accrued in these financial statements.
16 CommitmentsAs at
31 March2018
As at31 March
2017
Unquoted investments 263.7 102.6
As at 31 March 2018, the Group was committed to investing a further US$37.5 million (£26.7 million) (2017: US$37.5 million, £30.0 million) of loan commitment in the 3i India Infrastructure Fund and subordinated debt of £61.1 million (2017: £62.4 million) in Valorem and PPP projects including A9, RIVM, La Santé, Hart van Zuid, Condorcet and A27/A1. In addition, the Group committed to invest €200.7 million (£175.9 million) for the acquisition of Attero. During the year, the Group invested in the Mersey Gateway Bridge project and, as a result, a commitment of £13.1 million was extinguished.
3i Infrastructure plc Annual report and accounts 2018
Governance and accounts
104
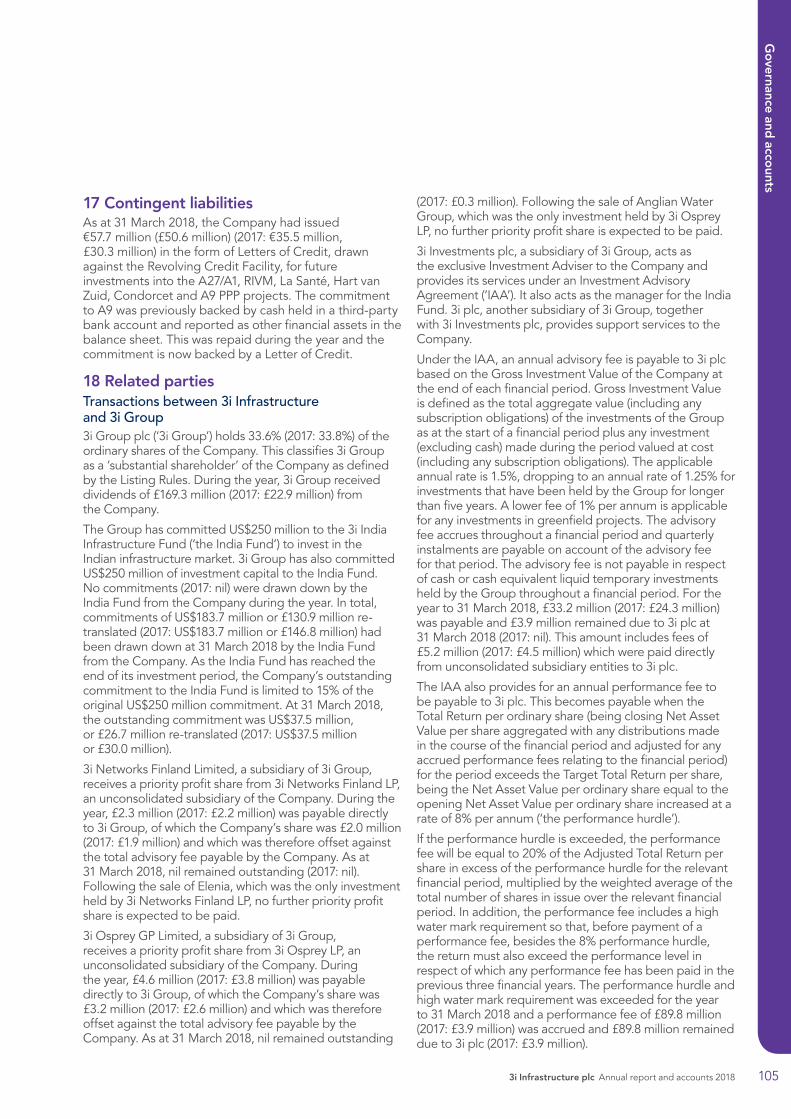
17 Contingent liabilitiesAs at 31 March 2018, the Company had issued €57.7 million (£50.6 million) (2017: €35.5 million, £30.3 million) in the form of Letters of Credit, drawn against the Revolving Credit Facility, for future investments into the A27/A1, RIVM, La Santé, Hart van Zuid, Condorcet and A9 PPP projects. The commitment to A9 was previously backed by cash held in a third-party bank account and reported as other financial assets in the balance sheet. This was repaid during the year and the commitment is now backed by a Letter of Credit.
18 Related partiesTransactions between 3i Infrastructure and 3i Group3i Group plc (‘3i Group’) holds 33.6% (2017: 33.8%) of the ordinary shares of the Company. This classifies 3i Group as a ‘substantial shareholder’ of the Company as defined by the Listing Rules. During the year, 3i Group received dividends of £169.3 million (2017: £22.9 million) from the Company.
The Group has committed US$250 million to the 3i India Infrastructure Fund (‘the India Fund’) to invest in the Indian infrastructure market. 3i Group has also committed US$250 million of investment capital to the India Fund. No commitments (2017: nil) were drawn down by the India Fund from the Company during the year. In total, commitments of US$183.7 million or £130.9 million re-translated (2017: US$183.7 million or £146.8 million) had been drawn down at 31 March 2018 by the India Fund from the Company. As the India Fund has reached the end of its investment period, the Company’s outstanding commitment to the India Fund is limited to 15% of the original US$250 million commitment. At 31 March 2018, the outstanding commitment was US$37.5 million, or £26.7 million re-translated (2017: US$37.5 million or £30.0 million).
3i Networks Finland Limited, a subsidiary of 3i Group, receives a priority profit share from 3i Networks Finland LP, an unconsolidated subsidiary of the Company. During the year, £2.3 million (2017: £2.2 million) was payable directly to 3i Group, of which the Company’s share was £2.0 million (2017: £1.9 million) and which was therefore offset against the total advisory fee payable by the Company. As at 31 March 2018, nil remained outstanding (2017: nil). Following the sale of Elenia, which was the only investment held by 3i Networks Finland LP, no further priority profit share is expected to be paid.
3i Osprey GP Limited, a subsidiary of 3i Group, receives a priority profit share from 3i Osprey LP, an unconsolidated subsidiary of the Company. During the year, £4.6 million (2017: £3.8 million) was payable directly to 3i Group, of which the Company’s share was £3.2 million (2017: £2.6 million) and which was therefore offset against the total advisory fee payable by the Company. As at 31 March 2018, nil remained outstanding
(2017: £0.3 million). Following the sale of Anglian Water Group, which was the only investment held by 3i Osprey LP, no further priority profit share is expected to be paid.
3i Investments plc, a subsidiary of 3i Group, acts as the exclusive Investment Adviser to the Company and provides its services under an Investment Advisory Agreement (‘IAA’). It also acts as the manager for the India Fund. 3i plc, another subsidiary of 3i Group, together with 3i Investments plc, provides support services to the Company.
Under the IAA, an annual advisory fee is payable to 3i plc based on the Gross Investment Value of the Company at the end of each financial period. Gross Investment Value is defined as the total aggregate value (including any subscription obligations) of the investments of the Group as at the start of a financial period plus any investment (excluding cash) made during the period valued at cost (including any subscription obligations). The applicable annual rate is 1.5%, dropping to an annual rate of 1.25% for investments that have been held by the Group for longer than five years. A lower fee of 1% per annum is applicable for any investments in greenfield projects. The advisory fee accrues throughout a financial period and quarterly instalments are payable on account of the advisory fee for that period. The advisory fee is not payable in respect of cash or cash equivalent liquid temporary investments held by the Group throughout a financial period. For the year to 31 March 2018, £33.2 million (2017: £24.3 million) was payable and £3.9 million remained due to 3i plc at 31 March 2018 (2017: nil). This amount includes fees of £5.2 million (2017: £4.5 million) which were paid directly from unconsolidated subsidiary entities to 3i plc.
The IAA also provides for an annual performance fee to be payable to 3i plc. This becomes payable when the Total Return per ordinary share (being closing Net Asset Value per share aggregated with any distributions made in the course of the financial period and adjusted for any accrued performance fees relating to the financial period) for the period exceeds the Target Total Return per share, being the Net Asset Value per ordinary share equal to the opening Net Asset Value per ordinary share increased at a rate of 8% per annum (‘the performance hurdle’).
If the performance hurdle is exceeded, the performance fee will be equal to 20% of the Adjusted Total Return per share in excess of the performance hurdle for the relevant financial period, multiplied by the weighted average of the total number of shares in issue over the relevant financial period. In addition, the performance fee includes a high water mark requirement so that, before payment of a performance fee, besides the 8% performance hurdle, the return must also exceed the performance level in respect of which any performance fee has been paid in the previous three financial years. The performance hurdle and high water mark requirement was exceeded for the year to 31 March 2018 and a performance fee of £89.8 million (2017: £3.9 million) was accrued and £89.8 million remained due to 3i plc (2017: £3.9 million).
3i Infrastructure plc Annual report and accounts 2018 105
Governance and
accounts
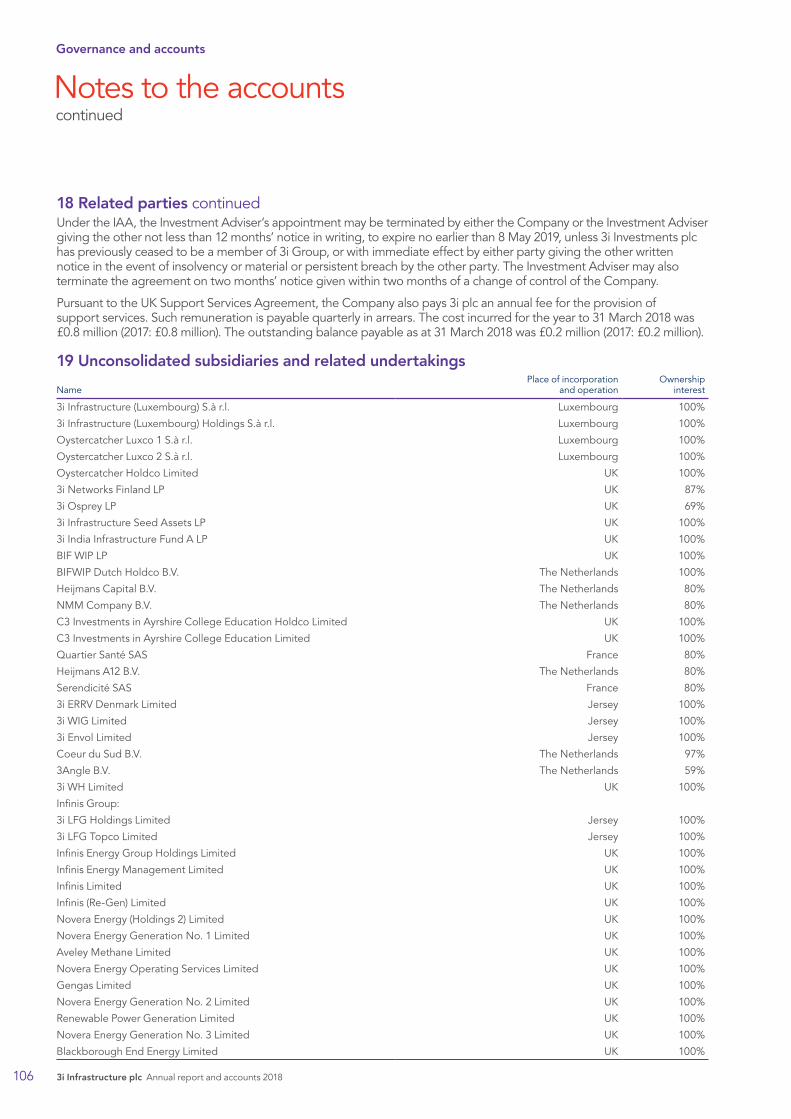
Notes to the accounts continued
18 Related parties continuedUnder the IAA, the Investment Adviser’s appointment may be terminated by either the Company or the Investment Adviser giving the other not less than 12 months’ notice in writing, to expire no earlier than 8 May 2019, unless 3i Investments plc has previously ceased to be a member of 3i Group, or with immediate effect by either party giving the other written notice in the event of insolvency or material or persistent breach by the other party. The Investment Adviser may also terminate the agreement on two months’ notice given within two months of a change of control of the Company.
Pursuant to the UK Support Services Agreement, the Company also pays 3i plc an annual fee for the provision of support services. Such remuneration is payable quarterly in arrears. The cost incurred for the year to 31 March 2018 was £0.8 million (2017: £0.8 million). The outstanding balance payable as at 31 March 2018 was £0.2 million (2017: £0.2 million).
19 Unconsolidated subsidiaries and related undertakings
NamePlace of incorporation
and operationOwnership
interest
3i Infrastructure (Luxembourg) S.à r.l. Luxembourg 100%
3i Infrastructure (Luxembourg) Holdings S.à r.l. Luxembourg 100%
Oystercatcher Luxco 1 S.à r.l. Luxembourg 100%
Oystercatcher Luxco 2 S.à r.l. Luxembourg 100%
Oystercatcher Holdco Limited UK 100%
3i Networks Finland LP UK 87%
3i Osprey LP UK 69%
3i Infrastructure Seed Assets LP UK 100%
3i India Infrastructure Fund A LP UK 100%
BIF WIP LP UK 100%
BIFWIP Dutch Holdco B.V. The Netherlands 100%
Heijmans Capital B.V. The Netherlands 80%
NMM Company B.V. The Netherlands 80%
C3 Investments in Ayrshire College Education Holdco Limited UK 100%
C3 Investments in Ayrshire College Education Limited UK 100%
Quartier Santé SAS France 80%
Heijmans A12 B.V. The Netherlands 80%
Serendicité SAS France 80%
3i ERRV Denmark Limited Jersey 100%
3i WIG Limited Jersey 100%
3i Envol Limited Jersey 100%
Coeur du Sud B.V. The Netherlands 97%
3Angle B.V. The Netherlands 59%
3i WH Limited UK 100%
Infinis Group:
3i LFG Holdings Limited Jersey 100%
3i LFG Topco Limited Jersey 100%
Infinis Energy Group Holdings Limited UK 100%
Infinis Energy Management Limited UK 100%
Infinis Limited UK 100%
Infinis (Re-Gen) Limited UK 100%
Novera Energy (Holdings 2) Limited UK 100%
Novera Energy Generation No. 1 Limited UK 100%
Aveley Methane Limited UK 100%
Novera Energy Operating Services Limited UK 100%
Gengas Limited UK 100%
Novera Energy Generation No. 2 Limited UK 100%
Renewable Power Generation Limited UK 100%
Novera Energy Generation No. 3 Limited UK 100%
Blackborough End Energy Limited UK 100%
3i Infrastructure plc Annual report and accounts 2018
Governance and accounts
106
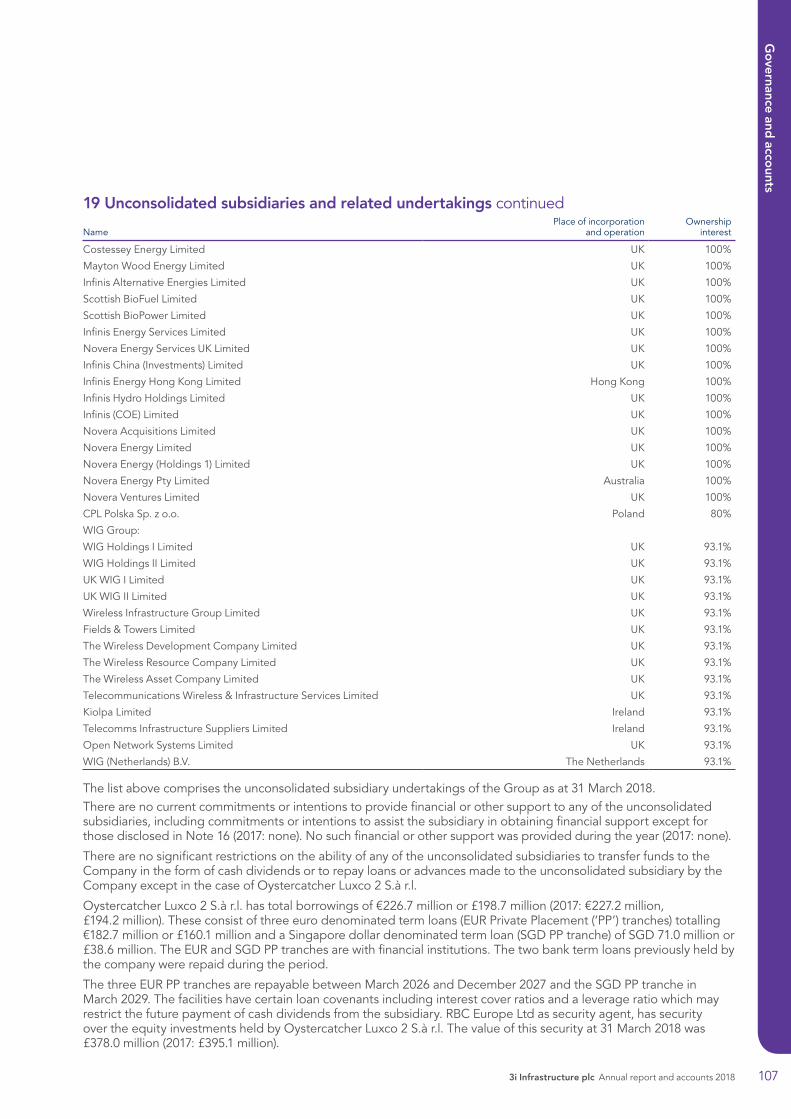
NamePlace of incorporation
and operationOwnership
interest
Costessey Energy Limited UK 100%
Mayton Wood Energy Limited UK 100%
Infinis Alternative Energies Limited UK 100%
Scottish BioFuel Limited UK 100%
Scottish BioPower Limited UK 100%
Infinis Energy Services Limited UK 100%
Novera Energy Services UK Limited UK 100%
Infinis China (Investments) Limited UK 100%
Infinis Energy Hong Kong Limited Hong Kong 100%
Infinis Hydro Holdings Limited UK 100%
Infinis (COE) Limited UK 100%
Novera Acquisitions Limited UK 100%
Novera Energy Limited UK 100%
Novera Energy (Holdings 1) Limited UK 100%
Novera Energy Pty Limited Australia 100%
Novera Ventures Limited UK 100%
CPL Polska Sp. z o.o. Poland 80%
WIG Group:
WIG Holdings I Limited UK 93.1%
WIG Holdings II Limited UK 93.1%
UK WIG I Limited UK 93.1%
UK WIG II Limited UK 93.1%
Wireless Infrastructure Group Limited UK 93.1%
Fields & Towers Limited UK 93.1%
The Wireless Development Company Limited UK 93.1%
The Wireless Resource Company Limited UK 93.1%
The Wireless Asset Company Limited UK 93.1%
Telecommunications Wireless & Infrastructure Services Limited UK 93.1%
Kiolpa Limited Ireland 93.1%
Telecomms Infrastructure Suppliers Limited Ireland 93.1%
Open Network Systems Limited UK 93.1%
WIG (Netherlands) B.V. The Netherlands 93.1%
The list above comprises the unconsolidated subsidiary undertakings of the Group as at 31 March 2018. There are no current commitments or intentions to provide financial or other support to any of the unconsolidated subsidiaries, including commitments or intentions to assist the subsidiary in obtaining financial support except for those disclosed in Note 16 (2017: none). No such financial or other support was provided during the year (2017: none).
There are no significant restrictions on the ability of any of the unconsolidated subsidiaries to transfer funds to the Company in the form of cash dividends or to repay loans or advances made to the unconsolidated subsidiary by the Company except in the case of Oystercatcher Luxco 2 S.à r.l.
Oystercatcher Luxco 2 S.à r.l. has total borrowings of €226.7 million or £198.7 million (2017: €227.2 million, £194.2 million). These consist of three euro denominated term loans (EUR Private Placement (‘PP’) tranches) totalling €182.7 million or £160.1 million and a Singapore dollar denominated term loan (SGD PP tranche) of SGD 71.0 million or £38.6 million. The EUR and SGD PP tranches are with financial institutions. The two bank term loans previously held by the company were repaid during the period.
The three EUR PP tranches are repayable between March 2026 and December 2027 and the SGD PP tranche in March 2029. The facilities have certain loan covenants including interest cover ratios and a leverage ratio which may restrict the future payment of cash dividends from the subsidiary. RBC Europe Ltd as security agent, has security over the equity investments held by Oystercatcher Luxco 2 S.à r.l. The value of this security at 31 March 2018 was £378.0 million (2017: £395.1 million).
19 Unconsolidated subsidiaries and related undertakings continued
3i Infrastructure plc Annual report and accounts 2018 107
Governance and
accounts
The Company aims to build a diversified portfolio of equity investments in entities owning infrastructure businesses and assets. The Company seeks investment opportunities globally, but with a focus on Europe, North America and Asia.
The Company’s equity investments will often comprise share capital and related shareholder loans (or other financial instruments that are not shares but that, in combination with shares, are similar in substance). The Company may also invest in junior or mezzanine debt in infrastructure businesses or assets.
Most of the Company’s investments are in unquoted companies. However, the Company may also invest in entities owning infrastructure businesses and assets whose shares or other instruments are listed on any stock exchange, irrespective of whether they cease to be listed after completion of the investment, if the Directors judge that such an investment is consistent with the Company’s investment objectives. The Company will, in any case, invest no more than 15% of its total gross assets in other investment companies or investment trusts which are listed on the Official List.
The Company may also consider investing in other fund structures (in the event that it considers, on receipt of advice from the Investment Adviser, that that is the most appropriate and effective means of investing), which may be advised or managed either by the Investment Adviser or a third party. If the Company invests in another fund advised or managed by 3i Group, the relevant proportion of any advisory or management fees payable by the investee fund to 3i plc will be deducted from the annual advisory fee payable under the Investment Advisory Agreement and the relevant proportion of any performance fee will be deducted from the annual performance fee, if payable, under the Investment Advisory Agreement. For the avoidance of doubt, there will be no similar set-off arrangement where any such fund is advised or managed by a third party.
For most investments, the Company seeks to obtain representation on the board of directors of the investee company (or equivalent governing body) and in cases where it acquires a majority equity interest in a business, that interest may also be a controlling interest.
No investment made by the Company will represent more than 25% of the Company’s gross assets, including cash holdings, at the time of making the investment. It is expected that most individual investments will exceed £50 million. In some cases, the total amount required for an individual transaction may exceed the maximum amount that the Company is permitted to commit to a single investment. In such circumstances, the Company may consider entering into co-investment arrangements with 3i Group (or other investors who may also be significant shareholders), pursuant to which 3i Group and its subsidiaries (or such other investors) may co-invest on the same financial and economic terms as the Company. The suitability of any such co-investment arrangements will be assessed on a transaction-by-transaction basis and would be subject to Board approval. Depending on the size of the relevant investment and the identity of the relevant co-investor, such a co-investment arrangement may be subject to the related party transaction provisions contained in the Listing Rules and may therefore require shareholder consent.
The Company’s Articles require its outstanding borrowings, including any financial guarantees to support subsequent obligations, to be limited to 50% of the gross assets of the Group (valuing investments on the basis included in the Group’s accounts).
In accordance with Listing Rules requirements, the Company will only make a material change to its investment policy with the approval of shareholders.
Investment policy
3i Infrastructure plc Annual report and accounts 2018
Governance and accounts
108
A description of the methodology used to value the investment portfolio of 3i Infrastructure and its consolidated subsidiary (‘the Group’) is set out below in order to provide more detailed information than is included within the accounting policies and the Investment Adviser’s review for the valuation of the portfolio. The methodology complies in all material aspects with the ‘International Private Equity and Venture Capital valuation guidelines’ which are endorsed by the British Private Equity and Venture Capital Association and Invest Europe.
Basis of valuationInvestments are reported at the Directors’ estimate of fair value at the reporting date in compliance with IFRS 13 Fair Value Measurement. Fair value is defined as ‘the price that would be received to sell an asset or paid to transfer a liability in an orderly transaction between market participants at the measurement date’.
GeneralIn estimating fair value, the Directors seek to use a methodology that is appropriate in light of the nature, facts and circumstances of the investment and its materiality in the context of the overall portfolio. The methodology that is the most appropriate may consequently include adjustments based on informed and experience-based judgements, and will also consider the nature of the industry and market practice. Methodologies are applied consistently from period to period except where a change would result in a better estimation of fair value. Given the uncertainties inherent in estimating fair value, a degree of caution is applied in exercising judgements and making necessary estimates.
Investments may include portfolio assets and other net assets/liabilities balances. The methodology for valuing portfolio assets is set out below. Any net assets/liabilities within intermediate holding companies are valued in line with the Group accounting policy and held at fair value or approximate to fair value.
Quoted investmentsQuoted equity investments are valued at the closing bid price at the reporting date. In accordance with International Financial Reporting Standards, no discount is applied for liquidity of the stock or any dealing restrictions. Quoted debt investments will be valued using quoted prices provided by third-party broker information where reliable or will be held at cost less fair value adjustments.
Unquoted investmentsUnquoted investments are valued using one of the following methodologies:
• Discounted Cash Flow (‘DCF’)• Proportionate share of net assets• Sales basis• Cost less any fair value adjustments required
DCFDCF is the primary basis for valuation. In using the DCF basis, fair value is estimated by deriving the present value of the investment using reasonable assumptions and estimation of expected future cash flows, including contracted and uncontracted revenues, expenses, capital expenditure, financing and taxation, and the terminal value and date, and the appropriate risk-adjusted discount rate that quantifies the risk inherent to the investment. The terminal value attributes a residual value to the investee company at the end of the projected discrete cash flow period. The discount rate will be estimated for each investment derived from the market risk-free rate, a risk-adjusted premium and information specific to the investment or market sector.
Proportionate share of net assetsWhere the Group has made investments into other infrastructure funds, the value of the investment will be derived from the Group’s share of net assets of the fund based on the most recent reliable financial information available from the fund. Where the underlying investments within a fund are valued on a DCF basis, the discount rate applied may be adjusted by the Company to reflect its assessment of the most appropriate discount rate for the nature of assets held in the fund. In measuring the fair value, the net asset value of the fund is adjusted, as necessary, to reflect restrictions on redemptions, future commitments, illiquid nature of the investments and other specific factors of the fund.
Sales basisThe expected sale proceeds will be used to assign a fair value to an asset in cases where offers have been received as part of an investment sales process. This may either support the value derived from another methodology or may be used as the primary valuation basis. A marketability discount is applied to the expected sale proceeds to derive the valuation where appropriate.
Cost less fair value adjustmentAny investment in a company that has failed or, in the view of the Board, is expected to fail within the next 12 months, has the equity shares valued at nil and the fixed income shares and loan instruments valued at the lower of cost and net recoverable amount.
Portfolio valuation methodology
3i Infrastructure plc Annual report and accounts 2018 109
Governance and
accounts
Financial calendarEx-dividend date for final dividend 14 June 2018
Record date for final dividend 15 June 2018
Annual General Meeting 5 July 2018
Final dividend expected to be paid 9 July 2018
Half-yearly results November 2018
RegistrarsFor shareholder services, including notifying changes of address, the registrar details are as follows:
Link Market Services (Jersey) Limited 12 Castle Street St. Helier Jersey JE2 3RT Channel Islands
e-mail: [email protected] Telephone: +44 (0)1534 847 000 Shareholder helpline: 0871 664 0300
Calls cost 12p per minute plus your phone company’s access charge. If you are outside the United Kingdom, please call +44 371 664 0300. Calls outside the United Kingdom will be charged at the applicable international rate. Link Group are open between 9.00am–5.30pm, Monday to Friday, excluding public holidays in England and Wales.
WebsiteFor full up-to-date investor relations information including the latest share price, recent reports, results presentations and financial news, please visit our investor relations website www.3i-infrastructure.com
If you would prefer to receive shareholder communications electronically, including your annual reports and notices of meetings, please go to www.3i-infrastructure.com/investors/shareholder-centre for details of how to register.
Frequently used registrars’ forms may be found on our website at www.3i-infrastructure.com/shareholder-centre
Warning to shareholders – boiler room scamsShare fraud includes scams where investors are called out of the blue and offered shares that often turn out to be worthless or non-existent, or are offered an inflated price for shares they own. These calls come from fraudsters operating in ‘boiler rooms’ that are mostly based abroad.
While high profits are promised, those who buy or sell shares in this way usually lose their money.
Most share fraud victims are experienced investors who lose an average of £20,000, with around £200 million lost in the UK each year.
Protect yourselfIf you are offered unsolicited investment advice, discounted shares, a premium price for shares you own, or free company or research reports, you should take these steps before handing over any money:
1. Get the name of the person and organisation contacting you.
2. Check the Financial Services Register at www.fca.org.uk/register to ensure that they are authorised.
3. Use the details on the Financial Services Register to contact the firm.
4. Call the Financial Conduct Authority Consumer Helpline on 0800 111 6768 if there are no contact details on the Register or you are told they are out of date.
5. Search the Financial Conduct Authority’s list of unauthorised firms and individuals to avoid doing business with.
6. Remember: if it sounds too good to be true, it probably is. If you use an unauthorised firm to buy or sell shares or other investments, you will not have access to the Financial Ombudsman Service or Financial Services Compensation Scheme (FSCS) if things go wrong.
Report a scamIf you are approached about a share scam you should tell the Financial Conduct Authority using the share fraud reporting form at www.fca.org.uk, where you can find out about the latest investment scams. You can also call the Consumer Helpline on 0800 111 6768.
Information for shareholders
3i Infrastructure plc
Registered office: 12 Castle Street St. Helier Jersey JE2 3RT Channel Islands
Tel: +44 (0)1534 847 410
Registered in Jersey No. 95682
3i Infrastructure plc is regulated by the Jersey Financial Services Commission.
3i Infrastructure plc Annual report and accounts 2018
Governance and accounts
110

This report is printed on Cocoon Silk 60%, an environmentally-friendly stock made with PCF (Process Chlorine Free) pure cellulose. This paper is FSC® certified and contains 60% recycled material.
Printed by Pureprint Group using environmental print technology and vegetable-based inks throughout. 99% of the dry waste and 95% of the cleaning solvents associated with this production were recycled.
Designed and produced by Radley Yeldar www.ry.com

3i Infrastructure plcRegistered office12 Castle Street St. Helier Jersey JE2 3RT Channel Islands Tel: +44 (0)1534 847 410www.3i-infrastructure.com
Annual report onlineTo receive shareholder communications electronically in future, including annual reports and notices of meetings, please go to:
www.3i-infrastructure.com for details of how to register.