analysis of the ovine neu1 gene in a unique model of gm1
TRANSCRIPT

University of PortlandPilot ScholarsBiology Undergraduate Publications, Presentationsand Projects Biology
Spring 2015
Analysis of the Ovine NEU1 Gene in a UniqueModel of GM1 GangliosidosisAlex Quakenbush
Follow this and additional works at: http://pilotscholars.up.edu/bio_studpubs
Part of the Biology Commons
This Thesis is brought to you for free and open access by the Biology at Pilot Scholars. It has been accepted for inclusion in Biology UndergraduatePublications, Presentations and Projects by an authorized administrator of Pilot Scholars. For more information, please contact [email protected].
Citation: Pilot Scholars Version (Modified MLA Style)Quakenbush, Alex, "Analysis of the Ovine NEU1 Gene in a Unique Model of GM1 Gangliosidosis" (2015). Biology UndergraduatePublications, Presentations and Projects. 2.http://pilotscholars.up.edu/bio_studpubs/2
Analysis of the Ovine NEU1 Gene in a Unique Model of GM1 Gangliosidosis
Senior Thesis, Spring 2015
Alex Quackenbush University of Portland, Department of Biology
Mentor: Dr. Ahern-Rindell

2
Table of Contents
ABSTRACT .............................................................................................................................................................. 4
INTRODUCTION .................................................................................................................................................... 6
LYSOSOMES ................................................................................................................................................................................. 6
LYSOSOMAL STORAGE DISORDERS ......................................................................................................................................... 7
GM-‐1 GANGLIOSIDOSIS ............................................................................................................................................................ 8
ANIMAL MODELS OF GM1 .................................................................................................................................................... 10
UNIQUE OVINE MODEL ......................................................................................................................................................... 10
LYSOSOMAL MULTIENZYME COMPLEX ............................................................................................................................... 11
ALPHA-‐NEURAMINIDASE ....................................................................................................................................................... 12
OBJECTIVES OF THIS STUDY .................................................................................................................................................. 14
METHODOLOGY ....................................................................................................................................................................... 16
MATERIALS AND METHODS .......................................................................................................................... 18
GENOMIC DNA ISOLATION AND PURIFICATION ............................................................................................................... 18
ANALYSIS OF ISOLATED GENOMIC DNA ............................................................................................................................ 19
PRIMER DESIGN FOR POLYMERASE CHAIN REACTION .................................................................................................... 19
POLYMERASE CHAIN REACTION AMPLIFICATION ............................................................................................................ 19
AGAROSE GEL ELECTROPHORESIS ...................................................................................................................................... 19
EXTRACTION AND PURIFICATION OF FRAGMENTS FROM THE LOW MELT GEL ......................................................... 20
DNA SEQUENCING AND ANALYSIS ...................................................................................................................................... 21
RESULTS ............................................................................................................................................................... 21
GENOMIC DNA CONCENTRATION AND PURITY ................................................................................................................ 21
AGAROSE GEL ELECTROPHORESIS VISUALIZATION OF PCR PRODUCTS ..................................................................... 21
DNA SEQUENCE AND CHROMATOGRAM ANALYSIS ......................................................................................................... 22

3
DISCUSSION ......................................................................................................................................................... 23
CONCLUSION ....................................................................................................................................................... 26
REFERENCES ....................................................................................................................................................... 27
ACKNOWLEDGEMENTS ................................................................................................................................... 30
APPENDIX: TABLES AND FIGURES ............................................................................................................... 31

4
Abstract
Lysosomal Storage Disorders are a class of inherited metabolic conditions that result
from alterations in the function of lysosomal enzymes. One example is GM1 Gangliosidosis
(GM1), a disorder in which the activity of β-galactosidase is deficient resulting in
neurodegeneration and early death. The enzyme, β-gal, is a member of the Lysosomal
Multienzyme Complex (LMC), which transports proteins to the lysosome and enables various
functions. LMC members include β-gal, α-neuraminidase and the Protective Protein Cathepsin A
(PPCA). In a unique ovine model of GM1, there is a primary deficiency in the activity of β-
galactosidase and a secondary deficiency in α-neuraminidase activity. The cause of the
secondary deficiency in α-neuraminidase activity, which is not seen in any other animal model
of GM1, is currently unknown. The α-neuraminidase protein is coded for by the NEU1 gene and
is, a glycohydrolitic enzyme that is active in the lysosome. The secondary deficiency of α-
neuraminidase seen in our inbred sheep may be due to a polymorphism in NEU1, which if taken
in conjunction with the recently identified putative disease-causing mutation in the gene that
codes for β-galactosidase (GLB1), may disrupt the ability of α-neuraminidase to properly bind to
the other components in the LMC. This would prevent α-neuraminidase from properly
trafficking to the lysosome and becoming activated. This project compares the exon sequence
from inbred sheep affected with this unique form of GM1 to the sequence from sheep from the
inbred flock that are not affected, looking for potential differences between the two sequences.
The sequence comparison between affected and normal sheep may reveal differences that
contribute to this secondary α-neuraminidase activity deficiency seen in our sheep model. Whole
genomic DNA was isolated from normal and affected sheep. PCR was performed to amplify
individual exons with specifically designed primers. Products were visualized through gel

5
electrophoresis and sent to Eurofins Genomics for sequencing of the amplicons. Analysis of
sequence was done using the Sequencher program and BLAST from NCBI. Results indicate no
confident or impactful NEU1 sequence differences between the normal and affected sheep or
between these sequences and the reference sequence from GenBank. The lack of differences in
the coding sequence for NEU1 may indicate the secondary deficiency of α-neuraminidase results
instead from a polymorphic change in the gene coding for PPCA and that this is what prohibits
proper formation of the LMC. Alternatively, the missense mutation identified in the GLB1 gene
may alter the ß-galactosidase protein sufficiently that it impairs the overall structure of the LMC
resulting in the secondary deficiency of α-neuraminidase.

6
Introduction Disease and illness are indelible parts of the human experience. Maladies range from
severe to mild, specific to systemic, and brief to prolonged. No matter the qualitative
characteristics, they are something we wish to alleviate and avoid if possible. Medical treatments
and prevention techniques can often help achieve these results. However, there exist diseases for
which there are no curative treatments, only palliative care. These diseases are the subjects of
intense study for scientists interested in research with an altruistic application. One such disease
is a lysosomal storage disorder called GM1 gangliosidosis (GM1). An ovine model of GM1 will
be the focus of this work.
Lysosomes The lysosome is a membrane-enclosed cellular component, an organelle, which functions
in trafficking and digestion pathways. This vital organelle was discovered in 1955 by the
biochemist de Duve (de Duve 2005). His group identified five different enzymes from a
particular cell fraction present in a membrane-bound pocket. The enzymes were hydrolases that
acted on different substrates. De Duve and his colleagues inferred that these proteins must be
digestive (de Duve 2005). As such, the pocket they resided in was designated the ‘lysosome’
from the Greek term for digestive body.
Over 50 years later much more is known about the lysosome’s specific functions and
mechanistic processes. It is understood that the lysosome is the primary means by which a cell
breaks down organic material, achieved via acid hydrolases and integral membrane proteins
(Saftig and Klumperman 2009). Fifty hydrolases and about 25 integral membrane proteins (in
mammals) have been identified, although there could be more that are yet to be discovered
(Saftig and Klumperman 2009). Hydrolases function to degrade macromolecules into their
constitutive parts to be reused by the cell or expelled through exocytosis (Vellodi 2005). These
7
enzymes are pH dependent with optimal function matched to that of the acidic lysosome and
generally localize to its lumen (Futerman and van Meer 2004). Hydrolases, like other proteins,
are synthesized in the rough endoplasmic reticulum (Vellodi 2005). However, as mentioned
above, the hydrolases are active in the lysosome, which necessitates a way by which they are
trafficked to this location.
Means of reaching the lysosomal are broadly divided into two categories: mannose-6-
phosphate receptor (M6PR)-dependent and -independent. The majority of lysosomal hydrolases
are transported through the former mechanism (Saftig and Klumperman 2009). At the Golgi
apparatus, the hydrolase receives a mannose-6-phosphate (M6P) tag that serves to target the
enzyme to the lysosome (Saftig and Klumperman 2009). Alternative mechanisms occur without
the use of M6P. These pathways are not nearly as well understood as the canonical M6P
pathway. Once in the lysosome, the enzymes are activated through various mechanisms,
including the change in pH mentioned previously, which allow them to carry out their hydrolytic
function. These functions are imperative for the continued viability of the cell, as is evidenced by
the case when normal functions are impaired.
Lysosomal Storage Disorders The impediment of necessary, homeostatic processes within cells often results in negative
consequences for the cell. If lack of full functionality occurs in many cells and cell types, these
negative consequences will affect the whole organism in addition to just a localized area. Such is
the case when there are aberrations in the normal functions of the lysosome, since the lysosome
is ubiquitous across cell types. When illness results from a deficiency or deficiencies of a
lysosomal protein(s), the disease is classified as a lysosomal storage disorder (Coutinho et al
2015). There are approximately fifty identified lysosomal storage disorders (LSDs) to date, with
the first clinical descriptions reported over one hundred years ago (Coutinho et al 2015).

8
The phenotypic presentations differ across LSDs, but the basic molecular cause is
common amongst them. All are marked by an increased storage and accumulation of
macromolecules normally degraded in the lysosome. In the vast majority of LSDs, the
accumulation results from a deficiency in one or more hydrolases although there are a few which
occur due to defects in an integral membrane protein (Ballabio and Gieselmann 2009). As stated
previously, lysosomal storage disorders are characterized by the storage of macromolecules
within the lysosome. It follows that this substrate is not being broken down by its hydrolase. The
reasons for deficiencies in enzymatic activity are particular to each lysosomal storage disorder,
although each has a unique genetic basis (Coutinho et al 2015). There could be normal levels of
protein in the cell, but for some reason that protein doesn’t make it to the lysosome. Or perhaps
there is some amount of functional protein in the cell that successfully makes it to the lysosome,
but not enough to break down all of the substrate. It could also be that there is a problem with the
protein itself that impairs its function.
GM-‐1 gangliosidosis One such example of a lysosomal storage disorder is GM-1 gangliosidosis (GM1). GM1
results from a deficiency of lysosomal β-galactosidase (β-gal), which is coded for by the GLB1
gene (Brunetti-Pierri and Scaglia 2008). In a healthy individual, β-gal cleaves terminal β-
galactosyl residues from gangliosides, glycoproteins, and glycosaminoglycans (Brunetti-Pierri
and Scaglia 2008). When this activity does not occur at a sufficient level, GM1-ganglioside and
β-gal containing oligosaccharides accumulate (Muthupalani et al 2014). The storage of GM1
ganglioside causes a myriad of cellular, tissue, and organismal problems. The organ system most
severely affected is the central nervous system. Patients with GM1 exhibit pronounced
neurodegeneration, which leads to premature death (Brunetti-Pierri and Scaglia 2008).

9
In the United States, it is estimated that the incidence of GM1 is about 1:100,000-200,000
live births. Yet, a higher rate is reported for various populations. These include the Roma
population, those from the Malta islands, and a particular region of Brazil (Brunetti-Pierri and
Scaglia 2008). Three categories of GM1 have been described based on onset of the disorder:
infantile, juvenile, and adult. The infantile form appears between birth and six months and results
in death by age two. The juvenile form has its onset between seven months and three years, with
patients manifesting with a slower disease progression than the infantile form. The adult form
occurs before age thirty (Brunetti-Pierri and Scaglia 2008). The three forms also correspond to
different levels of residual β-gal activity. Patients with infantile GM1 have levels varying
between 0.07-1.3% activity compared to a normal control. The juvenile and adult forms are
characterized by 0.3-4.8% and up to 9% activity, respectively (Brunetti-Pierri and Scaglia 2008).
In humans, GLB1 is located on chromosome 3 and contains 16 exons (Yamamoto et al
1990). It is alternatively spliced to eventually produce either the lysosomal hydrolase β-gal or the
elastin binding protein (Morreau et al 1989). There are over 100 reported mutations in the GLB1
gene that are thought to cause GM1. These are mostly missense or nonsense mutations in exons
2, 6, and 15, although there is a minority that includes splicing mutations, insertions, and
deletions (Brunetti-Pierri and Scaglia 2008).
Currently, there are no curative treatments for GM1 available. Standard treatments tend
to focus on palliative care instead. However, many researchers are experimenting with
techniques such as enzyme replacement therapy, chaperone treatment, bone marrow
transplantations, and substrate reduction (Brunetti-Pierri and Scaglia 2008). Developing such
treatments requires the use of animal models.
10
Animal Models of GM1 Animal models allow for the study of diseases that are difficult to examine in humans for
practical, ethical, or other reasons. One may identify a disease in animals that is closely related to
the human form of the disease. Alternatively, one can artificially create an animal model for a
human disease using recombinant techniques. The insights gained from animal studies can help
to better understand and maybe even treat the analogous human condition (Simmons 2008).
In addition to natural occurrence in humans, GM1 has been found in many animals of
which some have been used as model organisms. Among the animals that scientists have studied
are dogs (Wang et al 2000), sheep (Ahern-Rindell et al 1988, Prieur et al 1991), and bears
(Muthupalani et al 2014). These works have described the respective animal models of GM1
with a focus on the molecular and genetic characteristics of disease. The sheep model studied
byAhern-Rindell et al is the basis for this work.
Unique Ovine Model This work will focus on a unique model of ovine GM1 gangliosidosis with a particular
emphasis on the genetic characterization of the disease. The ovine model for GM1 was first
uncovered when several sheep presented with neurological symptoms at ages between four and
six weeks (Ahern-Rindell et al 1988). Study of the tissues taken from, and cell lines initiated
from affected sheep indicated that the sheep were afflicted with a lysosomal storage disorder.
The affected sheep were shown to have an accumulation of GM1 ganglioside in the cerebrum.
Further, the affected sheep had deficiencies of lysosomal β-galactosidase and α-neuraminidase
(α-neur). The residual activity of lysosomal β-gal in the fibroblasts, brain cerebrum, and kidney
cortex of affected sheep was less than 5% of the positive control. The activity of α-neur was
about 20% in the fibroblasts taken from affected sheep (Ahern-Rindell et al 1988).

11
Considered together, these results indicated a case of GM1-gangliosidosis. Yet, it is
unique in that typical GM1 does not have a deficiency of α-neur. While another sheep model of
GM1 has been found, it does not possess the same dual deficiencies in enzymatic activities
(Skelly et al 1995). It is a case of classic GM1 with a singular deficiency in the activity of β-gal.
Ultimately, the unique disorder was classified as GM1 with a dual deficiency in β-gal and α-
neur. It is hypothesized that the primary deficiency in β-galactosidase activity is due to a
mutation in the GLB1 gene. A missense mutation was discovered in exon six that causes an
amino acid change from a cysteine to phenylalanine (C229F) (Dieter et al 2014). It is thought
that this is a disease causing mutation due to the potential loss of a disulfide bridge within the
protein. The cause underlying the dual deficiency is yet to be elucidated; however, it is
hypothesized that it involves the interactions of β-gal and α-neur within the Lysosomal
Multiezyme Complex, of which they are constituents.
Lysosomal Multienzyme Complex The deficient enzymes, β-gal and α-neur, are members of the Lysosomal Multienzyme
Complex (LMC), which also includes the Protective Protein Cathepsin A (PPCA) (Pshezhetsky
and Ashmarina 2001). The LMC functions to stabilize proteins during transport to and within the
lysosome, as well as activate α-neur once there. The function of β-gal has been previously
described and α-neur will be subsequently discussed. PPCA, the third component of the LMC, is
a serine carboxypeptidase that acquires its protease activity in the lysosome (Kolli and Garman
2014). However, it has been shown that even in the case where PPCA lacks its enzymatic
activity it can still act as a chaperone within the context of the LMC (Galjart et al 1991). It is
when PPCA is not present or is unable to bind as it typically does to α-neur and β-gal to form the
12
LMC that the localization and activity of α-neur will be severely decreased (van Der Spoel et al
1998). This underscores the necessity and value of PPCA within the LMC.
Various studies have sought to shed light on the characteristics of the LMC. The
biological importance of the LMC has been well understood for some time, but the specifics
pertaining to the mechanism and structure have been slow regarding elucidation. Part of the
trouble is that the LMC itself is unstable, disassociating at neutral pH levels and low protein
concentrations (Pshezhetsky and Ashmarina 2001). Further, isolation of an intact complex with
the three major components has been a challenge for researchers. Two main forms have been
isolated: a 680-kDa sub-complex that retains the activity of PPCA and β-gal but not α-neur, and
a 1.3-MDa form that has α-neur activity but low levels of PPCA and β-gal activity (Bonten and
d'Azzo 2000; van der Spoel et al 2000). This makes it difficult to understand the details of the
structural interactions between the constitutive proteins within the intact LMC. In the mean time,
we can seek to understand the individual enzymes and make inferences about their interactions.
Alpha-‐neuraminidase The enzyme α-neur is a member of a family of neuraminidases that have hydrolytic
properties. These proteins are also known as sialidases after their role in removing the terminal
sialic acid from different substrates. Four sialidases have been identified in humans, with α-neur
being the only one that is localized to the lysosome (Bonardi et al 2014). As stated above, α-neur
is assisted in its transportation to the lysosome by PPCA. Additionally, α-neur relies on PPCA
for activation once it reaches the lysosome. In the absence of PPCA, there is almost no activity
of α-neur, resulting in the condition Galactosialidosis (Bonten et al 2014). Deficiencies in the
lysosomal neuraminidase itself result in the genetic disease Sialidosis (Bonten et al 1996).

13
Although the ovine model presents with both deficiencies in β-gal and α-neur, a deficiency in
PPCA is not observed, thus this is not a case of Sialidosis or Galactosialidosis.
Lysosomal neuraminidase (i.e. α-neur) is coded for by the gene NEU1 (Seryantyepe et al
2003). In humans this gene is located on chromosome 6 within the locus of the major
histocompatibility complex, although in sheep it is located on exon 20 (National Center for
Biotechnology Information 2012; Seyrantepe et al 2003). NEU1 is composed of five introns and
six exons, with no alternative splice sites. The 1,245 base pair mRNA is used to transcribe the α-
neur precursor, which is 415 amino acids in length (Seyrantepe et al 2003). As of March of
2014, there are 50 documented mutations in the NEU1 gene that cause Sialidosis. These are
mostly missense mutations located throughout the gene, although a greater proportion of
mutations appear in exon four compared to the other exons (Bonardi et al 2014; Seyrantepe et al
2003). There does not appear to be anything distinctive about the region of the protein encoded
by this exon relative to those coded for by other exons. However, in humans, exon four does
have a significantly higher number of single nucleotide variants (Bonardi et al 2014). This
suggests that exon four is less highly conserved than other exons within the gene.
It is difficult to determine a correlation, if any, between the position of a specific
mutation in the gene and the resulting change in the protein in relation to its overall effect on α-
neur’s ability to bind as a component of the lysosomal multienzyme complex. The amino acids
corresponding to the catalytic regions of the protein are known and residues present on the
surface can be hypothesized based on the hydrophilicity of a given amino acid. Yet, it is not clear
exactly what areas are necessary for binding to PPCA or β-gal, especially as there is no crystal
structure of α-neur available. One would expect that a change in a region important for
intermolecular interactions could make it impossible for α-neur to fully and successfully

14
associate as a constituent of the LMC. In such an instance, there would be decreased activity of
α-neur as its ability to traffic to the lysosome and become activated would be impacted.
Objectives of this study As stated previously, a missense mutation in the GLB1 gene, hypothesized to be
responsible for the primary deficiency in β-gal, has previously been identified in our unique
sheep model of GM1 (Dieter et al 2014). This mutation alone may not account for the secondary
deficiency in α-neur. Rather, it is hypothesized that this may be due to a polymorphism in the
gene that codes for PPCA, the CTSA gene, which if taken in conjunction with the mutation in
GLB1, may disrupt the ability of α-neur to properly bind to the other components in the LMC
(Cacotti et al 2013).
The cysteine to phenylalanine mutation mentioned above in the GLB1 gene may result in
the loss of a disulfide bridge within the β-gal protein. This could substantially alter the
conformation of the β-gal protein, perhaps impacting its ability to interact with α-neur and PPCA
(Bailey 2013). It is unknown whether this change is sufficient to account for the deficiency in the
activity of α-neur in addition to the β-gal activity deficiency. However, the crystal structure
indicates that the residue location (229) is likely involved in enzymatic activation and not
necessarily in direct intermolecular interactions (Ohto 2012).
Examination of the crystal structure of PPCA indicates there are four disulfide bonds that
play a role in its mature form (Hiraiwa et al 1999). One of these is proposed to be key in
intermolecular interactions within the LMC (Hiraiwa et al 1999). A small change in the character
of this bond or the side chains around this bond due to a polymorphism in CTSA could result in a
decreased ability of PPCA to bind α-neur while maintaining an enzymatically functional protein.
Further, previous work done by Bonten et al identified three potential regions involved in PPCA

15
binding to α-neur, located around the N- and C-terminuses of PPCA (Bonten et al 2009).
Alterations to these areas could also negatively affect the binding ability of the chaperone PPCA
to α-neur. Any of the changes described in PPCA would prevent the majority of α-neur from
achieving proper localization, and thus result in a deficiency in the activity of α-neur in the
lysosome. If this were the case, the minimal lysosomal neuraminidase enzyme activity in the
sheep model could be explained by its ability to self-dimerize. Homodimerization of α-neur has
been observed when PPCA is not present; thus, it may also occur when PPCA is present but
binding is impaired (Bonten et al 2009).
As there has already been a putative disease causing mutation identified in the GLB1
gene, it is unlikely there would be a second mutation in our sheep model in the NEU1 gene. It is
more likely that there is a polymorphism in the CTSA gene that would cause the change noted
above. Yet, there is a small probability that NEU1 itself has a mutation that renders α-neur
unable to traffic to the lysosome or have catalytic activity. It is also possible that there is a
polymorphism in NEU1 within the inbred flock of sheep that, with the mutation in GLB1,
prevents proper binding of α-neur to the LMC. In order to rule out these possibilities and provide
support for the overall hypothesis, the gene NEU1 must be sequenced for normal and affected
sheep. These sequences can be compared to each other, as well as an outbred reference sequence
to determine the presence of any mutations or polymorphisms in the affected or inbred flock,
respectively. This analysis aims to test the hypothesis that there are no sequence differences in
the exons of NEU1 between normal and GM1 affected sheep or between these groups and the
reference. The following discussion of methodology addresses how this hypothesis will be
examined.

16
Methodology The exons of NEU1 will be amplified via polymerase chain reaction (PCR), sequenced by
an external source, and analyzed using sequencing software. These sequences will be compared
to each other as well as to a reference sequence from the National Center for Biotechnology
Information to discern a possible polymorphism in NEU1 present in the sheep.
Genomic DNA isolation is used to purify genomic DNA, in this case, from tissues. This
technique breaks down the undesired parts of tissue such as proteins and RNAs with proteinases
and RNAses, respectively. The mixture is added to a spin column along with a specific binding
buffer to adhere the DNA to the column. Two successive wash steps to remove the contaminants,
but retain the DNA follow this addition. After washing is complete, an elution buffer allows the
DNA to separate from the column and precipitate into solution.
The eluted DNA is measured to determine concentration and purity of the sample in order
to make necessary calculations for PCR. Before the PCR can be carried out, primers must be
designed to amplify the regions of DNA of interest, here, the individual exons of NEU1. Primers
are designed using the known ovine genomic DNA and mRNA sequences for NEU1, which can
be retrieved from the National Center for Biotechnology Information (NCBI 2012a and NCBI
2012b). Specific primers are necessary for successful PCR. In this reaction, the DNA is
denatured by heat, cooled to allow for primer annealing, and heated again to promote extension.
This cycle is repeated several times to yield many copies of the amplicon. Included in the
reaction mixture are free dNTPs and a bacterial DNA polymerase, which enable the specific
synthesis of new copies of the amplicon (Saiki 1988).
The products of PCR are visualized through agarose gel electrophoresis to determine the
size of the amplified band. In this procedure, electric current is run through a gel to separate the
DNA products by size. When a current is run through the gel, the negatively charged DNA will
17
travel through the gel matrix towards the positive cathode. Large DNA fragments move slower
than small fragments and thus do not travel as far given a set amount of time. This property
allows for separation of DNA fragments based on their sizes. Thus, unknown samples are run
alongside and compared to a standard for size determination. The results may show bands at one
size or multiple bands at different sizes. In the first case, no further steps are necessary prior to
sequencing. However, in the second case, a low melt gel may be necessary. Here, the process is
similar to a regular agarose gel, but the fragment at the desired size can be excised. The excised
piece is subjected to purification to remove the agarose and buffer contaminants, but retain the
DNA.
After the visualization steps, the PCR products are sequenced by an outside company
(Eurofins Genomics). This company returns the sequence data in the form of chromatograms and
base sequences. Chromatograms are created using several single-stranded DNA fragments that
differ in length by only one nucleotide. Strands are initiated with the primers and terminated by
the addition of a dideoxy nucleotide (ddNTP). This process utilizes fluorescently tagged
ddNTPs, which are then read via their wavelength. Each wavelength corresponds to a peak in the
chromatogram and base in the sequence (Cooper 2002).
The electronically received files are imported along with the previously noted reference
sequences from NCBI into the software program Sequencher for analysis (Gene Codes Co 2014).
Assembly of the sequences to each other allows for comparison to determine if there are any
differences. Further, the software indicates the confidence of each base. This helps to decide if
any observed differences are true differences or products of the sequencing reaction.

18
Materials and Methods
Genomic DNA Isolation and Purification Genomic DNA was isolated from ovine liver tissue using the Invitrogen PureLink
Genomic DNA Mini Kit (Carlsbad, CA) according to manufacturer’s instructions. Tissue
samples from both normal and GM1-affected sheep from the inbred flock were cut and measured
to 0.025 g. To each tissue specimen, 180 µL of Genomic Digestion Buffer and 20 µL of
Proteinase K were added. The tissue and liquids were manually minced together using a spatula.
The mixture was then incubated at 55 °C for two hours, or until liquid was free from large
chunks of tissue. Post-incubation the lysates were centrifuged (Eppendorf 5430R, Sigma Aldrich,
St. Louis, MO) at the maximum speed for three minutes at room temperature. The supernatant
was removed from each sample and 20 µL of RNase A was added. Following a brief vortexing
(VWR Scientific Products, Mini Vortexer, Padnor, PA), samples were incubated at room
temperature for two minutes. Then, 200 µL of Binding Buffer and 200 µL of 100% ethanol were
added. Samples were then vortexed briefly.
The resulting mixture was then purified using the same kit as above. Each sample
mixture was added to a spin column and collection tube then centrifuged at 10,000 g for one
minute. The flow through was discarded and 500 µL of Wash Buffer 1 was added to the spin
column. After a second centrifugation at 10,000 g for one minute, the flow through was again
discarded and 500 µL of Wash Buffer 2 was added to the column. Then, each sample was
centrifuged at the maximum speed for three minutes. In the last addition, between 25 and 50 µL
of Genomic Elution Buffer was added and samples incubated at room temperature for one
minute. The samples were subjected to a final centrifugation at maximum speed for one minute.
The flow through was retained for analysis of DNA concentration/ purity and PCR amplification.
19
Analysis of Isolated Genomic DNA The isolated genomic DNA was analyzed for concentration and purity using the
Thermoscientific Nanodrop 2000 C Spectrophotometer (Wilmington, DE). A baseline for the
spectrophotometer was set using 1 µL of purified water as a control. After this, 1 µL of each
sample was measured to obtain OD260 and OD280 readings. From these readings the concentration
and purity of each sample were calculated. The samples were then stored at -20 °C for future use.
Primer Design for Polymerase Chain Reaction Primers were designed using the known ovine genomic DNA sequence
(NW_004080183.1) and mRNA sequence (GAAI01004092.1) for NEU1 (NCBI 2012a and
NCBI 2012b). Exons 1, 2, 3, and 4 were amplified individually and exons 5 and 6 were
amplified together (Tables 1-5). The properties of the primers including melting temperature,
G/C content, and self-specificity were calculated using the oligo analysis tool provided by
Eurofins Genomics (Eufofins MWG Operon LLC 2015).
Polymerase Chain Reaction Amplification PCR amplification of the exons of NEU1 was performed using the Q5 High-Fidelity Taq
Polymerase Kit from New England Biolabs (Ipswich, MA). The volumes and concentration for
the reactions were taken from the manufacturer’s instructions based on a 50 µL total reaction
volume. Specific reaction conditions varied for each exon being amplified, as specified by the
primer characteristics (Table 6). The reaction was carried out using a thermal cycler (Perkin
Elmer GeneAmp PCR System 2400, Waltham, MA).
Agarose Gel Electrophoresis PCR products were separated using the method of agarose gel electrophoresis. Agarose
gels were prepared for each exon according to the expected fragment size using Biotechnology
Grade Agarose from Amresco (Solon, OH) and 40 mL 1X Trisborate-EDTA (TBE) buffer
20
(Table 7). One gel for exons 5 and 6 was prepared in a similar manner but with the low melt
agarose from CulGenex (Santa Maria, CA) instead (Table 7). Ethidium bromide was added to
each mixture as the intercalating agent to allow for visualization under UV light. Along with the
samples from the PCR reaction, a standard ladder was included on each gel. Either a Low
Molecular Weight or 2-log ladder was used (NEB, Ipswich, MA) as specified in table 7. The gels
ran for about 40 minutes at 100 V, or until the dye front reached nearly the end of the gel. DNA
fragments were visualized using UV light.
Extraction and Purification of Fragments from the Low Melt Gel Under UV light the desired fragments for exons 5 and 6 were cut from the low melt gel
and purified to be used as a template in an additional PCR reaction. Purification was carried out
using the Invitrogen PureLink Purification Kit (Carlsbad, CA) according to the included
instructions. The razor-excised fragments were placed in tubes and incubated for three minutes at
70 °C. Once sufficiently melted, the solution was vortexed and 360 µL of binding buffer was
added. Each mixture was put into a wash tube and centrifuged at 17,900 g for one minute. The
flow through was then discarded and 650 µL of wash buffer was added to the tube. This was
centrifuged at 17,900 g for one minute. After the flow through was discarded, the sample was
centrifuged again at 16,000 g for three minutes. Flow through was discarded and 25 µL of
elution buffer was added and the sample incubated at room temperature for one minute. Finally,
the sample was centrifuged at 16,000 g for three minutes. Each remaining solution was measured
for DNA concentration and purity. These were stored at -20 °C for future use as templates in
PCR for exons 5 and 6.

21
DNA Sequencing and Analysis PCR products were prepared for sequencing according to the instructions provided by
Eurofins MWG Operon. Sequence and chromatogram files were downloaded and imported into
the Sequencher sequencing program referenced previously (version 5.3). Additionally, the NEU1
mRNA and full gene sequences were imported into the program. Sequences were assembled
automatically using the standard algorithm parameters. Assembled sequences were compared for
base and amino acid differences. Any sequences that could not be assembled using the
Sequencher program were analyzed through the NCBI BLAST program.
Results
Genomic DNA Concentration and Purity The isolated genomic DNA from normal and GM1 affected sheep was analyzed for
concentration and purity. Genomic DNA used for the sequencing of exon 4 from the normal
sheep had a purity value (OD260 : OD280) of 1.71 and average concentration of 12.5 ng/µL. The
DNA isolated from GM1-affeted sheep had a purity value of 2.05 and average concentration of
10.015 ng/µL. Genomic DNA used for the sequencing of exons 1, 2, 3, 5 and 6 from the normal
sheep had a purity value of 1.81 and average concentration of 895.8 ng/µL. The purity value and
average concentration for the genomic DNA isolated from GM1-affected sheep was 1.74 and
879.9 ng/µL, respectively.
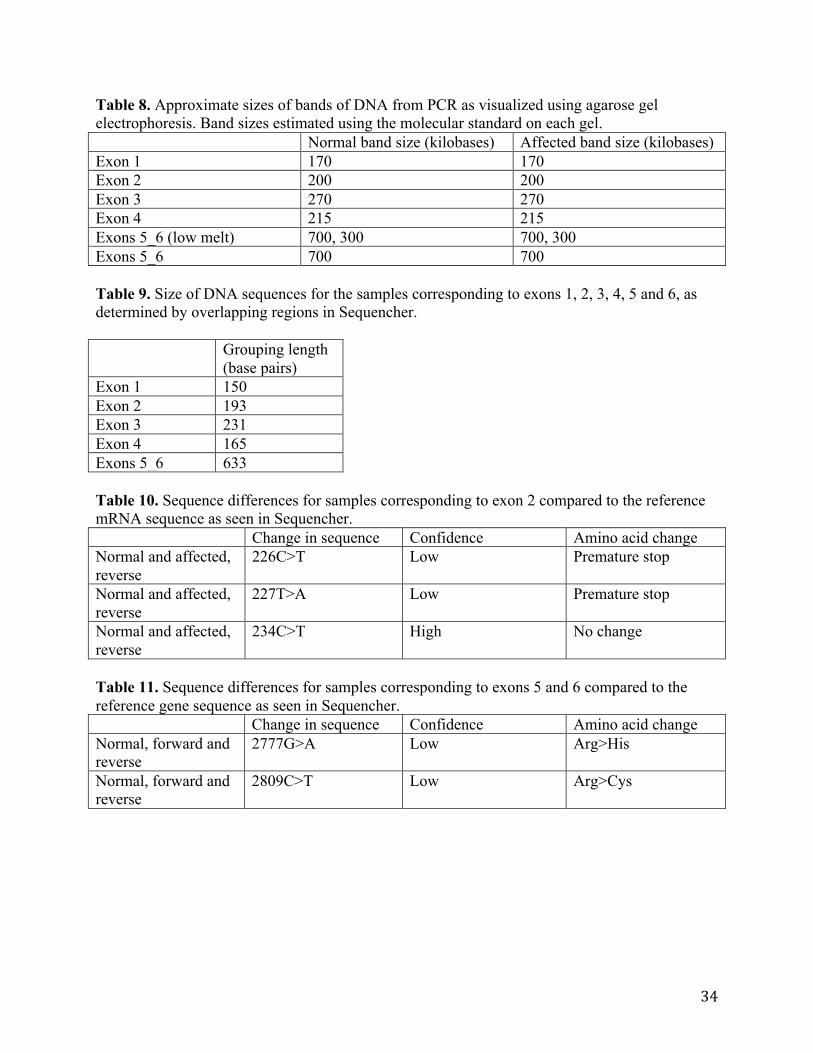
Agarose Gel Electrophoresis Visualization of PCR Products PCR products were visualized using agarose gel electrophoresis. Each gel indicated the
presence of DNA fragments for the samples representing normal and GM1 affected sheep
(Figure 1). Approximate size determination of each fragment was made based upon the standard

22
evaluated alongside the samples (Table 8). For each gel, the fragments representing normal and
affected sheep appeared to migrate the same distance.
DNA Sequence and Chromatogram Analysis Sequence data and chromatograms received from Eurofins MGW Operon were analyzed
using the Sequencher software program. For each exon sequence data produced using the
forward and reverse primer was received for a total of four DNA sequences per exon (normal
forward, normal reverse, affected forward, and affected reverse).
Sample sequence data from exon 1 that were able to assemble with each other in the
program were the affected reverse, affected forward, and NEU1 mRNA reference. These created
an overlapping segment of 150 base pairs. No differences were observed within this grouping;
however, both the chromatograms for the affected forward and reverse samples indicated low
confidence and high ambiguity in the base calls. The chromatogram data for the normal forward
and reverse samples also indicated low confidence. Neither of these samples could be assembled
in Sequencher. Imported into the BLAST program, they were matched with 93% identity with a
portion of NEU1 from the 373rd base pair to the 499th base pair in the mRNA sequence.
All four of the sample sequences for exons 2, 3, 5 and 6 were able to assemble with each
other (Table 9). These groupings were compared to a reference sequence and any differences
were identified. Differences were characterized by a particular confidence that is determined by
an algorithm used by the sequencing company. Two differences observed in the grouping for
exon 2 were of low confidence and unlikely to be accurate. An additional difference that changed
a C to T at position 234 relative to the reference sequence was of high confidence but did not
create any change in the amino acid sequence (Table 10). The chromatograms corresponding to
these sequences show different peaks at various heights at the noted positions (Figure 2). No
differences were observed in the grouping of sample sequence data and the reference sequence

23
for exon 3. The assembly for exons 5 and 6 were compared to the NEU1 full gene sequence that
included intron information. Two differences of low confidence were observed that would result
in an amino acid change in the sequence obtained for the normal sheep (Table 11). The
chromatograms corresponding to these sequences show two peaks of similar height at both of the
noted positions with little background noise (Figure 3).
The normal and affected samples for exon four that were sequenced using the reverse
primer were successfully assembled with the NEU1 mRNA reference sequence. The overlapping
fragments were 165 base pairs in length. No sequence differences were observed. The normal
and affected samples amplified with the forward primer were highly ambiguous and the
chromatograms indicated a large amount of noise in the reading. Compared to one another using
the BLAST program the sequences were 95% identical. Compared to the NEU1 mRNA
reference sequence the affected forward was 99% identical with a size of 133 base pairs (Figure
4). The normal forward was 95% identical with the NEU1 mRNA reference sequence with a size
of 132 base pairs (Figure 4).
Discussion This study was aimed at investigating the null hypothesis that no sequence differences in
NEU1 are present in the inbred sheep population on which the unique model of GM1
gangliosidosis in sheep is built. Assessment of this hypothesis relied upon sequence
determination of the exons of NEU1 from tissues taken from normal and GM1 affected sheep.
The DNA sequences received from the sequencing company (Eurofins) were compared to each
other and reference sequences to elucidate any differences. Before this endpoint, progress was
analyzed at various checkpoints in the process.
24
The initial step of DNA isolation was deemed successful, as the concentration and purity
were high enough to proceed with PCR. After the PCR, the products were visualized using gel
electrophoresis. The gels for exons one through four all showed distinct bands for the samples
from normal and affected sheep (Figure 1 A-D). The bands for each exon migrated at the same
distance for both sample types, which provides evidence that there are no gross deletions or
insertions in any of the exons. Further, the distances migrated by the fragments approximately
matched the expected fragment sizes based on the primers (Tables 7 and 8). This suggested that
the amplicons were indeed the desired exons. Thus, all of the PCR products for exons one
through four were appropriate to outsource for sequencing.
The low melt agarose gel for exons five and six displayed distinct bands at several
distances, indicating that the PCR resulted in amplification of different fragments (Figure 1E).
This may be due to primers annealing at multiple places rather than the specific locations around
the region of interest. The next gel was run with the PCR products from a second reaction with
the fragment of desired size isolated from the low melt gel as the template. It resulted in a
smeared streak for both samples, but it appeared that the desired fragment was present (Figure
1F). This indicated that the products from the second round of PCR for exons five and six were
appropriate to send for sequencing.
The sequence data supported the idea that there are no differences in the NEU1 exons
from normal or affected sheep that result in any substantial change in the amino acid sequence
for α-neur in either normal or GM1 affected sheep. The sizes of the sequenced exons closely
matched the expected sizes. Discrepancies between the expected and actual sizes are likely due
to the inherent challenges in sequencing and sequence alignment. When a sample is sequenced
using the forward primer, the 5’ end of the resulting sequence is of poor quality or shortened due

25
to primer binding. The same is true for the 3’ end of the sequence obtained using the reverse
primer. The similarity in size provides evidence that the desired exon was indeed sequenced.
Comparison of the exon sequences with the NEU1 mRNA or full gene reference
sequence indicated if there were any differences between the two experimental groups or
between the experimental groups and the reference. No differences were identified by
Sequencher in exons one, three, or four. This lack of difference supports the idea that NEU1 is
not altered in our ovine model.
Two differences found in the sequences for exon two occurred between the experimental
groups and the NEU1 mRNA reference sequence. These changes were of low confidence and
unlikely to be real. If real, they would result in a premature stop codon and nonfunctional
protein. As there is α-neur activity in both normal and GM1 affected sheep in our model, these
are deemed false differences. The third difference found in the exon two sequences is of high
confidence, but causes no change in the amino acid sequence of α-neur. This synonymous
change and the likely untrue other differences gives further evidence that there are no sequence
differences that could have an affect on the protein structure.
The last two exons of NEU1, exons 5 and 6, were amplified and sequenced together.
Thus, the sequence data contained intron information, which necessitated the use of the full gene
sequence for comparison to the experimentally derived sequences. Two differences in the
sequences from normal sheep appeared within the region corresponding to exon 6 and were
judged to be of low confidence. However, the chromatogram data showed two peaks at similar
heights with little noise at each position. This pattern indicates heterozygosity at those base
positions. The first difference results in a change from an arginine to a histidine. Both are polar
amino acids, so the change is unlikely to affect the structural interactions within α-neur or
26
between α-neur and other constituents of the LMC. The same is true for the second change from
arginine to cysteine, also both polar amino acids. Since the characteristics of the amino acids are
similar, the base changes likely do not affect the protein. Further, as these changes occur in the
normal sheep, which have normal levels of α-neur activity, they are not considered significant.
This data gives additional evidence to support the null model.
If the null model were accepted, changes in NEU1 would be ruled out as the cause of the
secondary activity deficiency of α-neur in GM1 affected sheep. This conclusion supports the
overarching hypothesis that the secondary deficiency results from disruption of α-neur’s ability
to properly bind the other components of the LMC. This disruption is unlikely to be due to
alterations in the structure of α-neur because of the evidence presented here, but rather a change
in the structure of the protective protein.
Conclusion The full analysis of each exon of NEU1 from normal and GM1 affected sheep revealed
no confident sequence differences that alter the protein structure. This was achieved through the
processes of genomic DNA isolation from liver tissue, polymerase chain reaction to amplify
individual exons, and sequencing of those exons. Examination of those sequences found no
differences that could change the structure or function of α-neur. As such, the deficiency of α-
neur is likely not due to a polymorphism or mutation present in NEU1. Moving forward, the
protective protein must be characterized to determine if alterations in its structure are present in
the GM1 affected sheep. This characterization would need to include sequence analysis of CTSA,
its coding gene. If there changes were found, they would provide support for the hypothesis
mentioned above.
27
References
Ahern-Rindell AJ, Prieur DJ, Murnane RD, Raghavan SS, Daniel PF, McCluer RH, Walkley SU, Parish SM. 1988. Inherited lysosomal storage disease associated with deficiencies of beta-galactosidase and alpha-neuraminidase in sheep. Am J Med Genet 31(1):39-56.
Ahern-Rindell AJ, Isikbay M, McInturff B, Supinski M. 2012. Evaluation of GLB1 in a Novel Ovine Model of GM1-Gangliosidosis. Molecular Genetics and Metabolism 105(2):S15.
Bailey, D. 2013. Characterization of a full-length GLB1 cDNA synthesized via mRNA from normal and GM1-affected sheep fibroblasts to investigate possible disease-causing mutations [thesis]. University of Portland.
Ballabio A and Gieselmann V. 2009. Lysosomal disorders: From storage to cellular damage. Biochim Biophys Acta 1793(4):684-96.
Bonardi D, Ravasio V, Borsani G, d'Azzo A, Bresciani R, Monti E, Giacopuzzi E. 2014. In silico identification of new putative pathogenic variants in the Neu1 sialidase gene affecting enzyme. PLoS ONE 9(8):e104229.
Bonten EJ, Campos Y, Zaitsev V, Nourse A, Waddell B, Lewis W, Taylor G. 2009. Heterodimerization of the sialidase NEU1 with the chaperone protective protein/cathepsin A prevents its premature oligomerization. J Biol Chem 284(41):28430-2844.
Bonten EJ and d'Azzo A. 2000. Lysosomal neuraminidase. catalytic activation in insect cells is controlled by the protective protein/cathepsin A. J Biol Chem 275(48):37657-63.
Bonten E, van der Spoel A, Fornerod M, Grosveld G, d'Azzo A. 1996. Characterization of human lysosomal neuraminidase defines the molecular basis of the metabolic storage disorder sialidosis. Genes and Development 10:3156-69.
Bonten EJ, d'Azzo A, Annunziata I. 2014. Lysosomal multienzyme complex: Pros and cons of working together. Cell and Molecular Life Sciences 71:2032.
Brunetti-Pierri N and Scaglia F. 2008. GM1 gangliosidosis: Review of clinical, molecular, and therapeutic aspects. Molecular Genetics and Metabolism 94:391-6.
Caciotti A, Catarzi S, Tonin R, Lugli L, Rodriguez Perez C, Michelakakis H, Mavridou I, Donati MA, Guerrini R, dAzzo A, et al. 2013. Galactosialidosis: Review and analysis of CTSA gene mutations. Orphanet Journal of Rare Diseases 8(114):1-9
Cooper S. 2002 DNA sequencing. <http://bioweb.uwlax.edu/genweb/molecular/theory/dna_sequencing/dna_sequencing.htm>.

28
Coutinho MF, Matos L, Alves S. 2015. From bedside to cell biology: A century of history on lysosomal dysfunction. Gene 555:50-8.
de Duve C. 2005. The lysosome turns fifty. Nat Cell Biol 7(9):847-9.
Dieter BR, Bailey DO, Isikbay M, Ahern-Rindell AJ. 2014. Characterization of GLB1 cDNA from normal and GM1- gangliosidosis affected ovine fibroblasts to confirm a possible disease-causing mutation. Molecular Genetics and Metabolism 111(3):S60.
Eurofins MWG Operon LLC. 2015. Oligo Analysis Tool [computer software]. Huntsville, AL.
Futerman AH and van Meer G. 2004. The cell biology of lysosomal storage disorders. Nat Rev Mol Cell Biol 5(7):554-65.
Galjart NJ, Morreau H, Willemsen R, Gillemans N, Bonten EJ. 1991. Human lysosomal protective protein has cathepsin A-like activity distinct from its protective function. J Biol Chem 266(22):14754-62.
Gene Codes Corporation. 2014. Sequencher [computer software]. Ann Arbor, MI. Hiraiwa M. 1999. Cathepsin A/protective protein: An unusual lysosomal multifunctional protein.
Cell Mol Life Sci 56:894-907.
Kolli N and Garman SC. 2014. Proteolytic activation of human cathepsin A. The J Biol Chem 289:11592-600.
Morreau H, Galjart NJ, Gillemans N, Willemsen R, van der Horst, G T, d'Azzo A. 1989. Alternative splicing of beta-galactosidase mRNA generates the classic lysosomal enzyme and a beta-galactosidase-related protein. The J Biol Chem 264(34):20655-63.
Muthupalani S, Torres PA, Wang BC, Zeng JB, Eaton S, Erdelyi I, Ducore R, Maganti R, Keating J, Perry BJ, et al. 2014. GM1-gangliosidosis in american black bears: Clinical, pathological, biochemical and molecular genetic characterization. Molecular Genetics and Metabolism 111:513-21.
National Center for Biotechnology Information. 2012a. Ovis aries breed texel chromosome 20 genomic scaffold, Oar_v3.1 OAR20, whole genome shotgun sequence.
National Center for Biotechnology Information. 2012b. TSA: ovis aries NEU1_seq04592 mRNA
sequence. Ohto U, Usui K, Ochi T, Yuki K, Satow Y, Shimizu T. 2012. Crystal structure of human -
galactosidase. The J Biol Chem 287(3):1801-1812.
Pshezhetsky AV and Ashmarina M. 2001. Lysosomal multienzyme complex: Biochemistry, genetics, and molecular pathophysiology. Progress in Nucleic Acid Research and Molecular Biology 69:81-114.

29
Saftig P and Klumperman J. 2009. Lysosome biogenesis and lysosomal membrane proteins: Trafficking meets function. Nat Rev Mol Cell Biol 10(9):623-35.
Saiki RK, Gelfand DH, Stoffel S, Scharf S, Higuchi R, Horn GT, Mullis KB, Erlich, HA. Primer-directed enzymatic amplification of DNA with a thermostable DNA polymerase. Science 239(4839):487-491.
Seyrantepe V, Poupetova H, Froissart R, Zabot M, Maire I, Pshezhetsky AV. 2003. Molecular pathology of NEU1 gene in sialidosis. Hum Mutat 22(5):343-52.
Simmons D. 2008. The use of animal models in studying genetic disease: Transgenesis and induced mutation. Nature Education 1(1).
Skelly B, M Jeffrey, R Franklin, B Winchester. 1995. A new form of ovine GM1 Gangliosidosis. Acta Neuropatholigica 89:374-379.
van der Spoel A, Bonten E, d'Azzo A. 2000. Processing of lysosomal beta-galactosidase. the C-terminal precursor fragment is an essential domain of the mature enzyme. J Biol Chem 275(14):10035-40.
van Der Spoel A, Bonten E, D'Azzo A. 1998. Transport of human lysosomal neuraminidase to mature lysosomes requires protective protein/cathepsin A. EMBO (European Molecular Biology Organization) Journal 17(6):1588-97.
Vellodi A. 2005. Lysosomal storage disorders. Br J Haematol 128(4):413-31.
Yamamoto Y, Hake CA, Martin BM, Kretz KA, Ahern-Rindell AJ, Naylor SL, Mudd M, O'Brien JS. 1990. Isolation, characterization, and mapping of a human acid beta-galactosidase cDNA. DNA and Cell Biology 9(2):119-27.

30
Acknowledgements I would like to acknowledge and thank Dr. Ahern-Rindell for her guidance throughout the course
of this work. This document has been two years in the making and it would not have been
possible with Dr. Ahern-Rindell's steadfast support. Thank you for all of your help, in particular
through the process of writing this thesis. I also thank the University of Portland Department of
Biology for financially supporting this work. Finally, a big thanks to my fellow genetics research
students for answering questions and their companionship throughout our time together.
31
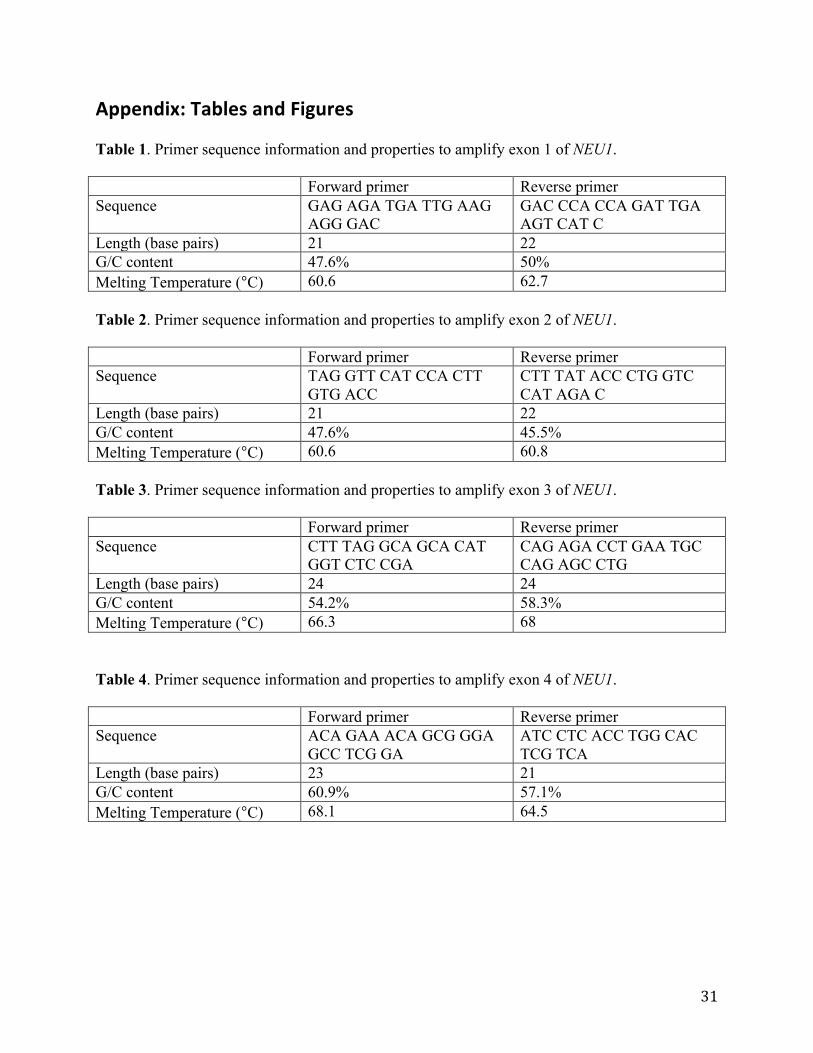
Appendix: Tables and Figures Table 1. Primer sequence information and properties to amplify exon 1 of NEU1. Forward primer Reverse primer Sequence GAG AGA TGA TTG AAG
AGG GAC GAC CCA CCA GAT TGA AGT CAT C
Length (base pairs) 21 22 G/C content 47.6% 50% Melting Temperature (°C) 60.6 62.7 Table 2. Primer sequence information and properties to amplify exon 2 of NEU1. Forward primer Reverse primer Sequence TAG GTT CAT CCA CTT
GTG ACC CTT TAT ACC CTG GTC CAT AGA C
Length (base pairs) 21 22 G/C content 47.6% 45.5% Melting Temperature (°C) 60.6 60.8 Table 3. Primer sequence information and properties to amplify exon 3 of NEU1. Forward primer Reverse primer Sequence CTT TAG GCA GCA CAT
GGT CTC CGA CAG AGA CCT GAA TGC CAG AGC CTG
Length (base pairs) 24 24 G/C content 54.2% 58.3% Melting Temperature (°C) 66.3 68 Table 4. Primer sequence information and properties to amplify exon 4 of NEU1. Forward primer Reverse primer Sequence ACA GAA ACA GCG GGA
GCC TCG GA ATC CTC ACC TGG CAC TCG TCA
Length (base pairs) 23 21 G/C content 60.9% 57.1% Melting Temperature (°C) 68.1 64.5
32
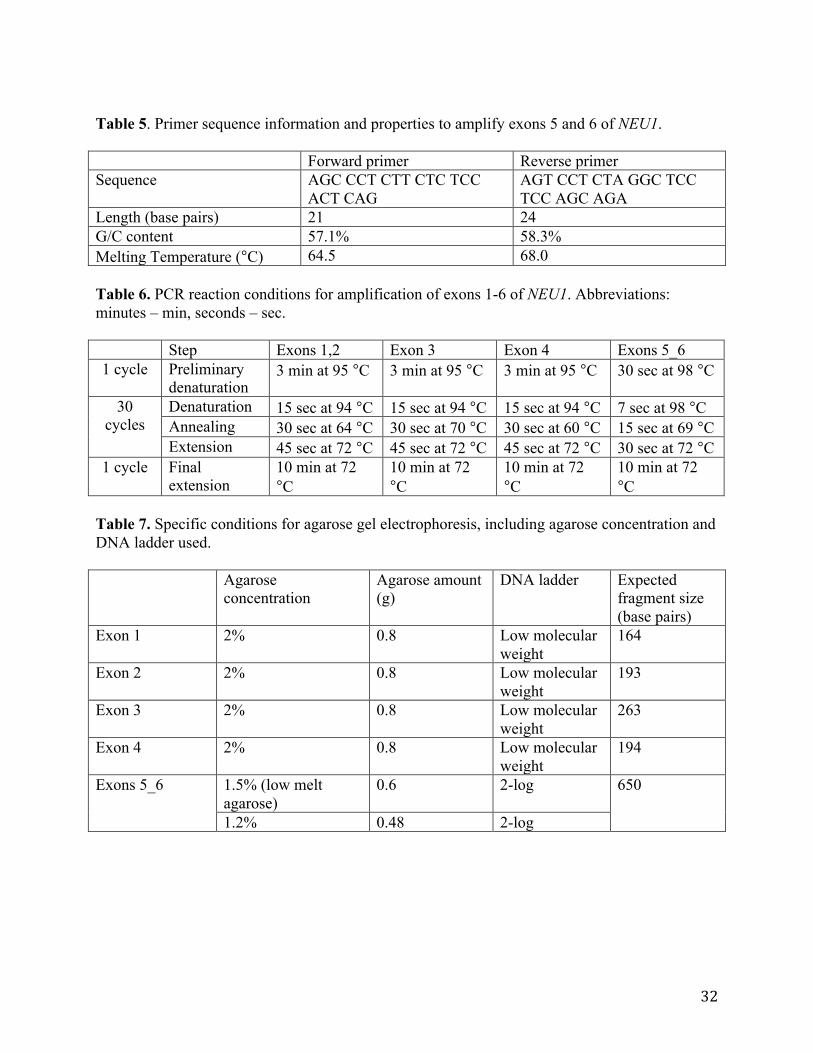
Table 5. Primer sequence information and properties to amplify exons 5 and 6 of NEU1. Forward primer Reverse primer Sequence AGC CCT CTT CTC TCC
ACT CAG AGT CCT CTA GGC TCC TCC AGC AGA
Length (base pairs) 21 24 G/C content 57.1% 58.3% Melting Temperature (°C) 64.5 68.0
Table 6. PCR reaction conditions for amplification of exons 1-6 of NEU1. Abbreviations: minutes – min, seconds – sec.
Step Exons 1,2 Exon 3 Exon 4 Exons 5_6 1 cycle Preliminary
denaturation 3 min at 95 °C 3 min at 95 °C 3 min at 95 °C 30 sec at 98 °C
30 cycles
Denaturation 15 sec at 94 °C 15 sec at 94 °C 15 sec at 94 °C 7 sec at 98 °C Annealing 30 sec at 64 °C 30 sec at 70 °C 30 sec at 60 °C 15 sec at 69 °C Extension 45 sec at 72 °C 45 sec at 72 °C 45 sec at 72 °C 30 sec at 72 °C
1 cycle Final extension
10 min at 72 °C
10 min at 72 °C
10 min at 72 °C
10 min at 72 °C
Table 7. Specific conditions for agarose gel electrophoresis, including agarose concentration and DNA ladder used. Agarose
concentration Agarose amount (g)
DNA ladder Expected fragment size (base pairs)
Exon 1 2% 0.8 Low molecular weight
164
Exon 2 2% 0.8 Low molecular weight
193
Exon 3 2% 0.8 Low molecular weight
263
Exon 4 2% 0.8 Low molecular weight
194
Exons 5_6 1.5% (low melt agarose)
0.6 2-log 650
1.2% 0.48 2-log

33
Figure 1. Gel electrophoresis results for PCR DNA products for exons 1-6 of NEU1. (a) gel from exon 1, (b) gel from exon 2, (c) gel from exon 3 (d) gel from exon 4 (e) low-melt gel from exons 5 and 6, (f) gel with products from second PCR for exons 5 and 6
C
Affected
Norm
al
E
Norm
al
Affected
Norm
al
Affected
F D Norm
al
Affected
Affected
Norm
al
A
Norm
al
Affected
B
34
Table 8. Approximate sizes of bands of DNA from PCR as visualized using agarose gel electrophoresis. Band sizes estimated using the molecular standard on each gel. Normal band size (kilobases) Affected band size (kilobases) Exon 1 170 170 Exon 2 200 200 Exon 3 270 270 Exon 4 215 215 Exons 5_6 (low melt) 700, 300 700, 300 Exons 5_6 700 700 Table 9. Size of DNA sequences for the samples corresponding to exons 1, 2, 3, 4, 5 and 6, as determined by overlapping regions in Sequencher. Grouping length
(base pairs) Exon 1 150 Exon 2 193 Exon 3 231 Exon 4 165 Exons 5_6 633 Table 10. Sequence differences for samples corresponding to exon 2 compared to the reference mRNA sequence as seen in Sequencher. Change in sequence Confidence Amino acid change Normal and affected, reverse
226C>T Low Premature stop
Normal and affected, reverse
227T>A Low Premature stop
Normal and affected, reverse
234C>T High No change
Table 11. Sequence differences for samples corresponding to exons 5 and 6 compared to the reference gene sequence as seen in Sequencher. Change in sequence Confidence Amino acid change Normal, forward and reverse
2777G>A Low Arg>His
Normal, forward and reverse
2809C>T Low Arg>Cys

35
Figure 2. Chromatograms corresponding to the exon 2 sequences obtained using the reverse primers with the PCR product from normal and GM1 affected sheep. Positions 226, 227, and 234 relative to the NEU1 mRNA reference sequence are indicated. Figure 3. Left: Chromatograms corresponding to the exon 6 sequences obtained using the forward and reverse primers with the PCR product from normal sheep. Position 2777 relative to the NEU1 full gene reference sequence is indicated. Right: Chromatograms corresponding to the exon 6 sequences obtained using the forward and reverse primers with the PCR product from normal sheep. Position 2809 in relative to the NEU1 full gene sequence is indicated.

36
Figure 4. Top: BLAST comparison of the exon 4 affected forward sequence with NEU1 mRNA reference sequence. Bottom: BLAST comparison of the exon 4 normal forward sequence with NEU1 mRNA reference sequence. Query is the sample sequence data and subject is the reference sequence in both figures. A solid vertical line connecting the two sequences indicates alignment at that position. A vertical space between the sequences is used when one of them contains an undetermined base call at that position. A solid horizontal line indicates a gap that was added to a sequence by the program to produce the best alignment. The percentage of identities and gaps are indicated at the top of each figure.