abstract study of stability parameters of nanofluids
TRANSCRIPT

ABSTRACT
STUDY OF STABILITY PARAMETERS OF NANOFLUIDS
Chaitanya Kakani, MS
Department of Mechanical Engineering
Northern Illinois University, 2016
Kyu Taek Cho, Director
Improvement in heat transfer rate is one of the important demands in thermal energy systems.
Conventionally, the area or geometry of heat-exchanging surfaces has been modified to enhance
heat transfer rate but adversely causing the size of system to be increased. In order to overcome
this drawback and control the transport of thermal energy actively, new thermal-energy-
transferring fluid called nanofluid has been developed. Nanofluids are the emulsion solution
containing nano-sized particles such as metal oxides and carbon materials in base fluids.
But one of the challenging issues of nanofluids is instability leading to sedimentation of
nanoparticles in the solution, and thus the nanofluids lose their thermal properties. The
sedimentation is the result of interactions among nanoparticles, and as attractive forces increase,
the particle sedimentation is accelerated.
In this study, extensive tests were conducted to understand key controlling parameters of the
instability. Especially, effects of the size and the surface charge potential of particles in the fluid
on the instability were investigated, and performance of surfactants and their sensitivity to the pH
conditions were studied for three different types of surfactants. It was found that the performance

of surfactant to enhance stability of nanofluids was affected significantly by chemical structure
(i.e. functional group) in the surfactant and their interactions with charges in the solution and on
particle surfaces. Various combinations of surfactants of different chemical structures were made
and their performance was analyzed to suggest a way to enhance stability in performance of
surfactants.

NORTHERN ILLINOIS UNIVERSITY DE KALB, ILLINOIS
DECEMBER 2016
STUDY OF STABILITY PARAMETERS OF NANOFLUIDS
BY
CHAITANYA KAKANI
©2016 Chaitanya Kakani
A THESIS SUBMITTED TO THE GRADUATE SCHOOL
IN PARTIAL FULFILLMENT OF THE REQUIREMENTS
FOR THE DEGREE
MASTER OF SCIENCE
DEPARTMENT OF MECHANICAL ENGINEERING
Thesis Director: Dr. Kyu Taek Cho

ACKNOWLEDGEMENTS
I would like to express deep gratitude to my advisor Dr. Kyu Taek Cho for his constant
encouragement and support throughout this work. It is his expertise in the field and continuous
support while guiding that made this work possible. This master’s degree, the dream of my life
would not have been possible for me without his financial support throughout my course work. It
is an honor to work with him.
I would like to thank my committee members, Dr. Pradip Majumdar and Dr. John Shelton for
their valuable suggestions which were helpful. This made me to work more on concepts and helped
me to become conceptually stronger.
I would also like to express my deepest gratitude to my family for continuous encouragement.
I am also thankful to Micah Wedekind and my friends for helping me in achieving my goal.

TABLE OF CONTENTS
Page
LIST OF FIGURES ....................................................................................................................... vii
LIST OF TABLES ....................................................................................................................... viiii
Chapter
1.INTRODUCTION ....................................................................................................................... 1
1.1 Background ..............................................................................................................................1
1.2 Literature Review ......................................................................................................................2
1.2.1 Sonication..........................................................................................................................2
1.2.2 Surfactant ..........................................................................................................................3
1.2.3 pH .....................................................................................................................................7
1.2.4 Nanoparticle Shape.............................................................................................................9
1.3 Motivation.............................................................................................................................. 10
2. THEORY .................................................................................................................................. 11
2.1 Colloidal Suspension................................................................................................................ 11
2.2 DVLO Theory........................................................................................................................... 12
2.3 Stokes Law.............................................................................................................................. 13

iv
Chapter Page
2.4 Surface Charge........................................................................................................................ 14
2.4.1. Ionization of Surface Group ............................................................................................. 14
2.4.2. Absorption of Charged Species........................................................................................ 15
2.5 Mechanisms ........................................................................................................................... 16
2.5.1 Steric Repulsion ............................................................................................................... 16
2.5.2 Electrostatic Stabilization.................................................................................................. 16
2.6 Zeta Potential ......................................................................................................................... 17
2.7 The Factor Affecting Zeta Potential .......................................................................................... 19
2.8 Preparation of Nanofluid ......................................................................................................... 21
2.8.1 Single Step Method .......................................................................................................... 21
2.8.2 Two Step Method ............................................................................................................. 21
2.9 Sonication............................................................................................................................... 21
3.UNCERTAINTY ANALYSIS .................................................................................................. 23
3.1 Uncertainty in Balance ............................................................................................................ 23
3.2 Uncertainty in pH Meter .......................................................................................................... 23
3.3 Uncertainty in Zeta Potential ................................................................................................... 24
3.4 Uncertainty in Size .................................................................................................................. 25
4. RESULTS AND DISCUSSION ............................................................................................... 27
4.1 Experimental Conditions.......................................................................................................... 27
4.2 Effect of Sonication Time ......................................................................................................... 28
4.3 Effect of Surfactant ................................................................................................................. 30
4.4 Effect of Surfactant Concentration ........................................................................................... 32

v
Chapter Page
4.5 Effect of pH............................................................................................................................. 36
4.6 Effect of pH + Surfactant.......................................................................................................... 39
4.7 Effect of Functional Group ....................................................................................................... 44
5.CONCLUSION .......................................................................................................................... 53
REFERENCES ............................................................................................................................. 55

LIST OF FIGURES
Page
Figure 1: Comparison of ZnO Nanoparticle Size with Respect to Sonication Time ...................... 2
Figure 2: Al2O3 Particle Size with Respect to Sonication Time ..................................................... 3
Figure 3:Effect Of SDBS Weight Fraction On Zeta Potential And Size Of Al2O3 -W Nanofluid.5
Figure 4:Effect Of SDBS Weight Fraction On Zeta Potential And Size Of Cuo-W Nanofluid.... 5
Figure 5: Zeta Potential and Particle Size Variation with Respect to Various Nanofluids ............ 6
Figure 6:Particle Size Distributions Of Nano Suspensions ............................................................ 8
Figure 7:Effects Of pH On The Zeta Potential And Particle Size Of Nanofluids With SDBS. ..... 8
Figure 8: Attraction Energy for Various Shapes of Nanoparticles ................................................. 9
Figure 9:Repulsive Energy for Various Shapes of Nanoparticles ................................................ 10
Figure 10:Schematic Representation of the Process ..................................................................... 11
Figure 11: DLVO Theory ............................................................................................................. 13
Figure 12:Origin of Surface Charge by Ionization of Acidic Group ............................................ 14
Figure 13:Origin of Surface Charge by Ionization of Basic Group .............................................. 14
Figure 14:Origin Of Surface Charge by Cationic Surfactant........................................................ 15
Figure 15:Origin of Surface Charge by Anionic Surfactant ......................................................... 15
Figure 16:Steric Repulsion ........................................................................................................... 16
Figure 17:Charge Stabilization ..................................................................................................... 17

vii
Page
Figure 18:Zeta Potential................................................................................................................ 17
Figure 19:Schematic Diagram of Zetasizer .................................................................................. 19
Figure 20: Variation of Zeta Potential .......................................................................................... 20
Figure 21: Variation of Zeta Potential with Respect to pH ......................................................... 20
Figure 22:Schematic Representation of Sonication Process ........................................................ 22
Figure 23:Effect of Sonication Time ............................................................................................ 29
Figure 24:Effect of Sonication on Am-Tri Surfactant .................................................................. 32
Figure 25:Effect of Surfactant Concentration ............................................................................... 33
Figure 26:Effect of Am-Tri Concentration ................................................................................... 35
Figure 27:Effect of pH-Zeta Potential .......................................................................................... 37
Figure 28:Effect of pH-Size .......................................................................................................... 38
Figure 29:Effect of pH + Surfactant-Zeta Potential...................................................................... 42
Figure 30:Effect of pH + Surfactant-Size ..................................................................................... 43
Figure 31: pH Variation for SHMP/Am-Tri Combinations.......................................................... 45
Figure 32:Effect of SHMP/Am-Tri Combinations ....................................................................... 45
Figure 33:Effect of pH on SHMP/Am-Tri Combinations-Zeta Potential.................................... 50
Figure 34:Effect of pH on SHMP/Am-Tri Combinations-Size ................................................... 51
Figure 35:Effect of pH on SHMP/Am-Tri Combinations-Settle Down Time............................. 52

LIST OF TABLES
Page
Table 1: Experimental Conditions ................................................................................................ 28
Table 2: Effect of Sonication Time ............................................................................................... 28
Table 3: Effect of Surfactant ......................................................................................................... 30
Table 4 : Effect of Sonication on Am-Tri Surfactant.................................................................... 31
Table 5: Effect of Surfactant Concentration ................................................................................. 33
Table 6: Effect of Am-Tri Concentration ..................................................................................... 34
Table 7:Effect of pH ..................................................................................................................... 36
Table 8:Effect of pH + SHMP ...................................................................................................... 39
Table 9:Effect of pH+ Am-Di ....................................................................................................... 40
Table 10:Effect of pH + Am-Tri ................................................................................................... 41
Table 11:Surfactant Ratio ............................................................................................................. 44
Table 12: Effect of Functional Group ........................................................................................... 44
Table13:SHMP/Am-Tri- 80/20..................................................................................................... 46
Table 14:SHMP/Am-Tri- 60/40.................................................................................................... 47
Table 15:SHMP/Am-Tri- 40/60.................................................................................................... 48
Table 16:SHMP/Am-Tri- 20/80.................................................................................................... 49

1.INTRODUCTION
1.1 Background
The need for improvement of heat transfer has become a major area of interest in many
industries. The traditional way to increase heat transfer is to increase the area of the thermal system.
The main drawback of this method is the drastic increase in the size of the thermal system.
Therefore, the need for better heat transfer fluid with improved performance has become a main
area of focus and the innovative concept of “nanofluid” as a heat transfer fluid has come into light.
Nanofluids are the fluids with nano-sized particles of metal oxides or nonmetals in base fluids like
water and ethylene glycol. The main advantage of nanofluid is its thermal conductivity, which is
higher than basic fluid [1].
Maxwell was the first person to demonstrate the process of dispersing micro-sized particles
into the base fluid [2]. Later, the researchers Choi and Eastman introduced the concept of
nanofluids. It was found that there was an improvement in heat transfer by 20% for CuO and Al2O3
in water nanofluids. Before using them in actual heat transfer application, careful study of
thermophysical properties of the nanofluids is important [2].
The main challenging factor for using the nanofluids for heat transfer application is their poor
stability. One of the ways to increase the stability of nanofluids is to decrease the Vander Waal’s
attraction and increase the electrostatic repulsion forces between the particles in suspension. The
key parameters affecting the stability of nanofluids are particle size and zeta potential (surface

2
charge) of nanoparticles which can be controlled by mechanical agitation (sonication), ionic
concentration (pH), and surface stabilizer (surfactant).
1.2 Literature Review
1.2.1 Sonication
Kole and Dey in their research showed how sonication time is affected without any use of
surfactant in the preparation of highly stable ZnO-ethylene glycol nanofluid. They conducted an
experiment to find out the effect of sonication time on the size of the ZnO nanoparticles. Based on
dynamic light scattering (DLS) data shown in Figure 1, they conclude that 60 hrs sonication time
is optimum to obtain a stable nanofluid [3].
Figure 1: Comparison of ZnO Nanoparticle Size with Respect to Sonication Time [3]

3
I.M. Mahbubul et al. studied the effect of sonication time on stability of Al2O3 –water nanofluid
with 0.5% volume fraction at various durations from 0 to 180 minutes. The size of nanopartic les
was measured using zetasizer and found that the particle size decreases as the sonication time
increases as shown in Figure 2. They also observed the TEM images of nanofluids at various
sonication times and concluded that the particles are dispersed well at 90 minutes of sonication.
But, for sonication time greater than 90 minutes the particles start to aggregate. They also checked
the stability of nanofluid using photo capturing method and found that the nanofluid with 0 min of
sonication is least stable [4].
Figure 2: Al2O3 Particle Size with Respect to Sonication Time [4]
1.2.2 Surfactant
Yu and Xie in their paper stated that the use of surfactant in nanofluid is one of the ways to
increase the stability of the nanofluid. The main reason behind this is that addition of surfactant
markedly modifies the surface properties of the nanoparticles. The surfactant consists of a

4
hydrophobic tail portion, usually a long-chain hydrocarbon, and a hydrophilic polar head group.
Due to this, the contact between the particles and base fluid was improved. Based on the
composition of the head the surfactants are classified into anionic, cationic and nonionic [5].
Most surfactants tend to decompose upon modest heating and are liable to lose effectiveness
at temperatures as low as 70 degrees [6].
I.M. Shahrul et al. in their research prepared the Al2O3–W and SiO2–W without using the
surfactant with 90 minutes of sonication, the stability was investigated using photo capturing
method and found that the nanofluids were stable for 3 weeks. They also prepared ZnO–W
nanofluid using the various surfactant and upon observation, the nanofluid with sodium dodecyl
sulfonate (SDS) surfactant was stable for longer time. They prepared Fe304-W using
polyvinylpyrrolidone (PVP) surfactant and found that the attempt to make stable Fe304-W
nanofluid was unsuccessful even using the surfactant. They also experimentally found 35%, 26%
and 12% increase in heat transfer coefficient for ZnO-W with PVP, Al2O3-W, SiO2-W nanofluids
[7] .
M. A. Khairul et al. [8] in their work prepared Al2O3 –W and CuO-W nanofluids with various
concentrations of anionic surfactant sodium dodecyl benzene sulfonate (SDBS). They checked that
the particle size and zeta potential of the nanofluids were as shown in Figure 3 and 4. They
concluded that SDBS surfactant concentration of 0.1 wt% for Al2O3 nanofluid and 0.15 wt% for
CuO nanofluid are best to attain stable nanofluids. They also found how the concentration of
surfactant will affect the viscosity and thermal conductivity of nanofluid [8].

5
Figure 3:Effect Of SDBS Weight Fraction On Zeta Potential And Size Of Al2O3 -W Nanofluid
[8]
Figure 4:Effect Of SDBS Weight Fraction On Zeta Potential And Size Of Cuo-W Nanofluid [8]

6
Lisi Jia et al. performed experiments on graphene-water nanofluid with sodium dodecyl
sulfonate (SDS) and carboxyl methyl cellulose (CMC) as surfactants and without surfactant. From
Figure 5 results of zeta potential and size show that nanofluids with SDS and CMC surfactants
were stable for a longer time compared to nanofluid without surfactant due to limiting aggregation
of graphene nanoparticles to some extent. Finally, they also concluded that the selection of
surfactant is very important for the preparation of nanofluid [9].
Figure 5: Zeta Potential and Particle Size Variation with Respect to Various Nanofluids [9]
A.N.M Khalil et al. investigated the influence of SDS surfactant in Al2O3 nanolubricant on tool
wear during turning process of AISI 1050 mild steel bar. Tool wear is tested using dry
nanolubricant with and without surfactant at a constant cutting speed of 1273 rpm, a feed rate of
0.2 mm/rev, and depth of cut of 0.1 mm and found that nanolubricant with SDS has less tool wear
[10].

7
1.2.3 pH
Xie et al. stated that the treatment of multiwall carbon nanotubes with concentrated nitric acid
introduced functional group containing oxygen onto the surface of CNTs modifying the surface
properties from hydrophobic to hydrophilic making them easily disperse into polar liquids like
water and ethylene glycol [11].
K. Goudarzi et al. [12] discussed how variation of pH of two different nanofluids CuO and
Al2O3 effect the thermal efficiency. They prepared nanofluids with different pH based on
ASHRAE standard in collector testing and added surfactant sodium dodecyl benzene sulfonate
after sonication. Experimentally they found out that at pH=3 CuO has increased an efficiency of
52% and at pH=10.5 Al2O3 has increased an efficiency of 64.5% compared to nanofluid at pH=9.2.
They also concluded the pH of nanofluid far away from the isoelectric point of nanoparticles (IEP)
[12].
Xian-Ju Wang et al. in their research prepared Al2O3 – W and CuO – W nanofluid by varying
the pH and SDBS surfactant concentration and found that nanofluids attain most stable suspension
at optimum pH and surfactant concentration due to increases in surface charge by frequent attacks
of determining ions on surface hydroxyl and phenyl sulfonic group using different pH and sodium
dodecylbenzene sulfonate as surfactant concentrations [1]. See Figures 6 and 7.

8
Figure 6:Particle Size Distributions Of Nano Suspensions [1].
Figure 7:Effects Of pH On The Zeta Potential And Particle Size Of Nanofluids With SDBS [1].

9
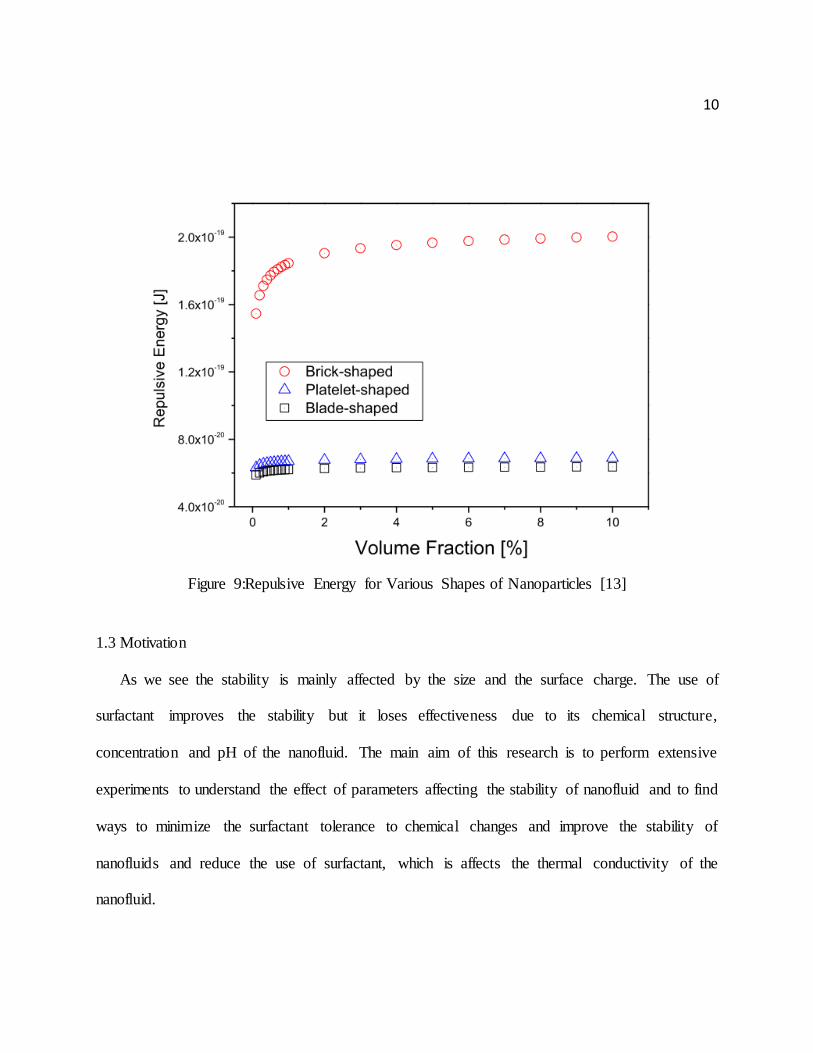
1.2.4 Nanoparticle Shape
H.J. Kim et al. investigated the effect of nanoparticle shape on stability by preparing water-
based bohemite alumina nanofluids with nanoparticles of brick, platelet and blade shapes. They
measured the particle size and calculated the attraction energy and repulsive energy for the various
volume fraction of nanoparticles (Figures 8 and 9) and concluded that the attraction energy
depends on volume fraction, whereas repulsive energy depends on particle shape [13].
Figure 8: Attraction Energy for Various Shapes of Nanoparticles [13]
10
Figure 9:Repulsive Energy for Various Shapes of Nanoparticles [13]
1.3 Motivation
As we see the stability is mainly affected by the size and the surface charge. The use of
surfactant improves the stability but it loses effectiveness due to its chemical structure,
concentration and pH of the nanofluid. The main aim of this research is to perform extensive
experiments to understand the effect of parameters affecting the stability of nanofluid and to find
ways to minimize the surfactant tolerance to chemical changes and improve the stability of
nanofluids and reduce the use of surfactant, which is affects the thermal conductivity of the
nanofluid.

2. THEORY
In order to control the stability of nanofluid, which is a recurring problem for their use in
thermal systems, it is important to have some knowledge about colloidal suspensions and how
aggregation takes place.
2.1 Colloidal Suspension
The mixture of any two types of primary matter is known as a colloidal suspension. Nanofluids
are a type of colloidal suspension with nano-sized particles dispersed in a base fluid. As every
particle has a certain amount of charge on the surface, they start adhering due to the attraction
forces, eventually forming an aggregate is known as ‘floc’. This process is known as flocculat ion.
As time passes, the floc coagulates and sedimentation takes place. Figure 10 shows a schematic
representation of the process.
Figure 10:Schematic Representation of the Process [14]

12
2.2 DVLO Theory
The stability of any suspension mainly depends on the total potential of the particle which is
sum of Vander Waal’s attraction and repulsive forces which exist between particle as they
approach each other [5]. The DVLO theory mainly focuses on the total potential energy VT
between the particles, which is the main reason for the stability of the particles in colloida l
suspension [15].
VT = VA + VR + VS [15] (1)
where Vs is potential energy due to solvent, VA is Vander Waal’s attraction forces and VR is
electrostatic repulsion forces.
VA = −A ( 12⁄ π D2 ) [15] (2)
where D is the distance between particles.
VR = 2 π ε a ζ2 e−κD [15] (3)
where ζ is Zeta potential.
In order to have stable suspension, the repulsion forces should be greater than Vander Waal’s
attraction forces. If the Vander Waal’s attraction forces are greater than the repulsive forces the
particles start to collide leading to unstable suspension [5]. From Figure 11, in order to have fewer
attraction forces and greater repulsive forces, the distance between particles should be greater.

13
Figure 11: DLVO Theory [16]
2.3 Stokes Law
Every particle in colloidal suspension starts to sediment due to gravity as time passes due to
increases in the particle size as result of Vander Waal’s attraction forces. The settle down velocity
can be calculated with the help of Stokes law as given in equation 4.
V =2 R2
9 μ(ρp − ρL). g [2] (4)
where R is radius of particles (size), V is settle down velocity, is viscosity of liquid medium, p
is density of particles, L is density of base fluid. In order to reduce the settle down velocity, the
particle size should be small, increase the viscosity of fluid and reduce the difference between the
densities of nanoparticle and base fluid.

14 2.4 Surface Charge
As we know that to obtain a stable suspension the repulsive forces should be dominant over
attraction force. A number of forces depend on the quantity and type of charge present on the
surface of the particle. So, it is important to understand the formation of charge on the surface of
the particles.
2.4.1. Ionization of Surface Group
For instance, when an acidic nanoparticle is dispersed in the liquid medium, the H+ ion leaves
the surface and gives rise to the negative charge on the surface (Figure 12). On the other hand,
when basic nanoparticle is dispersed, the OH- ion leaves the surface and gives rise to the positive
charge on the surface (Figure 13)
Figure 12:Origin of Surface Charge by Ionization of Acidic Group [15]
Figure 13:Origin of Surface Charge by Ionization of Basic Group [15]

15 2.4.2. Absorption of Charged Species
If a cationic surfactant disperses into a nanofluid, the hydrocarbon chain bonds with the surface
and gives rise to the positive charge on the surface (Figure 14). However, in the case of anionic
surfactant, the hydrocarbon chain bonds with the surface and gives rise to the negative charge on
the surface (Figure 15).
Figure 14:Origin Of Surface Charge by Cationic Surfactant [15]
Figure 15:Origin of Surface Charge by Anionic Surfactant [15]

16
2.5 Mechanisms
Based on the type of repulsion the mechanisms which affect stability of the suspension or
nanofluid are classified into two types.
2.5.1 Steric Repulsion
In steric repulsion, the surface of the nanoparticles is modified by the addition of a simple
polymer. However, the main disadvantage of steric repulsion is that it is expensive and affects
thermal properties of the fluid (Figure 16).
Figure 16:Steric Repulsion [17]
2.5.2 Electrostatic Stabilization
In electrostatic stabilization, the charge present on the surface of the nanoparticle is altered to
equalize the amount of charge on all surfaces by adding a small amount of acid or base (Figure
17). This can be done in one of the following mechanisms “(1) preferential adsorption of ions, (2)
dissociation of surface charged species, (3) isomorphic substitution of ions, (4) accumulation or
depletion of electrons at the surface, and (5) physical adsorption of charged species onto the
surface” [5]. When compared to the previous method, it is inexpensive.

17
Figure 17:Charge Stabilization [17]
2.6 Zeta Potential
When any two phases of matter are placed in contact it gives rise to a potential difference. The
molecules of liquid medium surround the particle surface in two parts: one stern layer where ions
are strongly bounded and the second layer diffuse layer where the ions are loosely bounded. In this
region there exists boundary inside which the ions form stable entity. The potential at this boundary
is known as zeta potential. For any stable suspension, its value is >± 30 mV [15] (see Figure 18).
Figure 18:Zeta Potential [18]

18
The device used for measuring zeta potential and size is a zetasizer. The device measures the
electrophoretic mobility of a sample and in turn calculates the zeta potential using the equation
given below [15].
UE =
2 ε Ζ f(κa)
3 η
(5)
where UE is electrophoretic mobility, Z is zeta potential, is dielectric constant, is viscosity, and
f(a) is Henry’s function=1. In this equation, all terms are constant properties of the liquid except
the variable, which is zeta potential.
The working principle used by the zetasizer is ‘laser Doppler velocimetry.’ Figure 19 shows
the schematic diagram of the working principle of the device. The device consists of seven
components as shown. Initially, the laser beam is split into two beams, a reference beam and an
incident beam. The incident beam passes through the center of the sample cell. When the electric
potential is applied between the two electrodes, the particles start moving to oppositely charged
electrodes, deflecting the incident beam. The deflection is recorded with the help of a detector and
sent to a computer via a digital signal processor to calculate electrophoretic mobility and give zeta
potential as output.

19
Figure 19:Schematic Diagram of Zetasizer [15]
2.7 The Factor Affecting Zeta Potential
The main factor affecting the zeta potential of the colloidal suspension is the pH of the solution.
“Imagine a particle in suspension with a negative zeta potential. If more alkali is added to this
suspension, then the particles tend to acquire more negative charge. If acid is added to this
suspension, then a point will be reached where the charge will be neutralized. Further addition of
acid will cause a buildup of positive charge” [15] (Figure 20). Figure 21 gives information about
how zeta potential varies with respect to pH of typical suspension.

20
Figure 20: Variation of Zeta Potential [15]
Figure 21: Variation of Zeta Potential with Respect to pH [19]
Isoelectric point (IEP) is the point at which the pH of the sample is least stable which means
there is no charge present on the particle surface. Just by maintaining the pH, the sample can attain
stability. In the above Figure 21, the IEP of the sample is at pH-5.5. The sample is least stable
between pH-4 and pH-7 and highly stable below pH-4 and above pH-8.

21 2.8 Preparation of Nanofluid
When using of nanofluids for heat transfer application and various other application, preparing
them plays a major role. The preparation of nanofluid can be done in two ways: the single step or
the two-step process.
2.8.1 Single Step Method
This method is first invented by researchers Choi and Eastman in 2001. In this method, the
nanoparticles are vaporized in vacuum chamber containing base fluid. The vapors condense into
base fluid causing stable suspension with a particle size of less than 10nm. The main limitation of
this method is that the base fluids should have sufficiently low pressure to avoid vaporization of
the fluid and subsequent gas condensation and agglomeration of the particles [20].
2.8.2 Two Step Method
This method is easy compared to the single step method. In this method, the nanoparticles are
produced by inert gas condensation method, and then they are dispersed into a liquid medium with
the help of vigorous vibration produced by a sonicator or homogenizer. The issue using this method
is that the nanoparticles are agglomerated easily leading to fast sedimentations.
2.9 Sonication
As we know, the particles in the suspension or nanofluid stick together due to Vander Waal’s
attraction forces. The bonds formed are weak bonds, which can be broken down with the help of
vibration. The device which produces vibration is known as a sonicator, and the process is known

22 as sonication. There are two types of sonicator: the probe type and the bath type. The sonicator I
used was Branson -1800. The Figure 22 explains how the preparation of nanofluid is done with
the help of sonicator
Figure 22:Schematic Representation of Sonication Process [21]

3.UNCERTAINTY ANALYSIS
3.1 Uncertainty in Balance
The SCIENTECH SA 210 balance is used to measure the weight of DI water, CuO
nanoparticles and surfactant [22]. The systematic uncertainties of balance are:
Readability 0.0001g
Linearity ±0.0002g
Total systematic uncertainty of balance (Bb):
Bb = √((0.00012) + (0.00022))=2.236 x 10⁻⁴ (5)
The random uncertainty is
No of samples (Nb)=5
Standard deviation (Sb)= 0.0005316
Confidence level= 95%
tb= t4,95% = 2.776 from the Student t-distribution table
Pb = tb (Sb
√Nb)=6.6 x 10⁻⁴ (6)
3.2 Uncertainty in pH Meter
The Oakton pH meter is used to measure the pH of the pH controls and nanofluid in order to
study the effect of pH on stability. The calibration is done using the pH buffers 4, 7, and 10 [22].

24
The systematic uncertainty is:
Accuracy 0.01
BpH = √((0.012)=0.01 (7)
The random uncertainty is:
No of samples (NpH)=5
Standard deviation (SpH): 0.029495762
Confidence level= 95%
tph= t4,95% = 2.776 from the Student t-distribution table
PpH = tpH (SpH
√NpH)=0.037 (8)
3.3 Uncertainty in Zeta Potential
The systematic uncertainty in the zeta potential of the sample is 10% of the measured value,
which can be calculated using the formula given below [22].
Z is measured value of zeta potential
Bz = Z(
10
100)
(9)
Total systematic uncertainty for zeta potential (BZ) can be calculated as shown in Eqs. 10 and 11.
Case-1: without pH
Bz = √[(Bb
2) + (Bz2)]
(10)
Case-2: with pH
Bz = √[(Bb
2) + (Bz2) + (BpH
2 )] (11)

25
The random uncertainty is:
No of samples (NZ)=6
Standard deviation (SZ) varies for every sample
Confidence level= 95%
tZ= t4,95% = 2.571 from the Student t-distribution table
Pz = tz (
Sz
√Nz
) (12)
Total random uncertainty for zeta potential (BZ) can be calculated as shown in Eqs. 13 and 14.
Case-1: without pH
Pz = √[(Pb
2) + (Pz2)]
(13)
Case-2: with pH
Pz = √[(Pb
2) + (Pz2) + (PpH
2)] (14)
Total uncertainty for Zeta potential irrespective of any case can be calculated using Eq. 15.
Wz = √[(Bz
2) + (Pz2)]
(15)
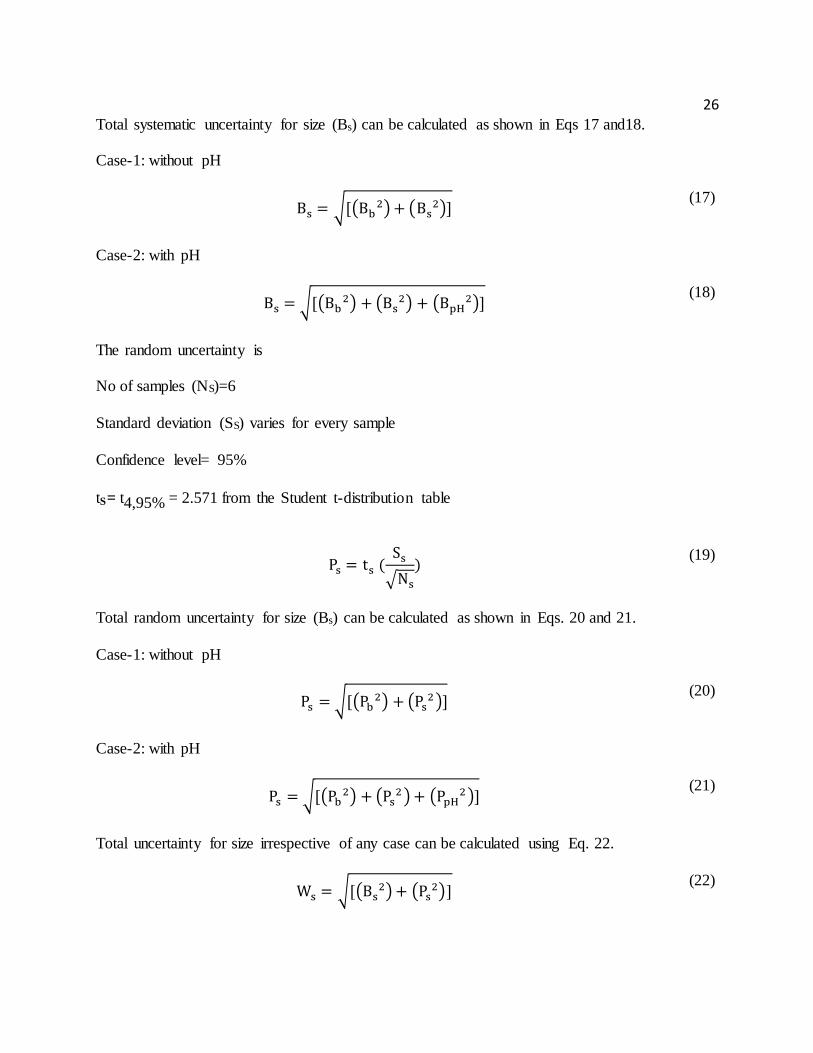
3.4 Uncertainty in Size
The systematic uncertainty in the Size of the sample is 2% of the measured value, which can
be calculated using the formula given below [22].
S is measured value of size
Bs = S(
2
100)
(16)
26
Total systematic uncertainty for size (Bs) can be calculated as shown in Eqs 17 and18.
Case-1: without pH
Bs = √[(Bb
2) + (Bs2)]
(17)
Case-2: with pH
Bs = √[(Bb
2) + (Bs2) + (BpH
2)] (18)
The random uncertainty is
No of samples (NS)=6
Standard deviation (SS) varies for every sample
Confidence level= 95%
tS= t4,95% = 2.571 from the Student t-distribution table
Ps = ts (
Ss
√Ns
) (19)
Total random uncertainty for size (Bs) can be calculated as shown in Eqs. 20 and 21.
Case-1: without pH
Ps = √[(Pb
2) + (Ps2 )]
(20)
Case-2: with pH
Ps = √[(Pb
2) + (Ps2 ) + (PpH
2 )] (21)
Total uncertainty for size irrespective of any case can be calculated using Eq. 22.
Ws = √[(Bs
2) + (Ps2)]
(22)

4. RESULTS AND DISCUSSION
4.1 Experimental Conditions (Table 1)
In order to study the effect of various parameters, the nanoparticle concentration is fixed as
0.5%, which is used in most of the thermal systems like heat exchangers. Initially, various samples
were prepared using 20ml vials. The position of the vial in sonicator is fixed on the trial and error
method. At first, the vial is placed in a beaker and placed in sonicator, but it was observed that the
particles didn’t disperse well. Second, when the vials are placed with a help of a cardboard holder
it better compared to the previous method but there were some particles left at the bottom of the
vials. Finally, the vials are placed in such a position that the bottom of the vial touches the bottom
wall of the sonicator compartment.
28
Table 1: Experimental Conditions
Base Fluid DI Water
Nanoparticles Copper Oxide(II)- CuO
Nanoparticle Concentration 0.5% wt%
Sonication Time 1hr, 5hr, 10hr, 15hr
Surfactants Sodium hexametaphosphate (SMHP) - 6 phosphate ion (po3-)
Ammonium citrate dibasic (Am-Di) - 2 OH- ion
Ammonium citrate tribasic (Am-Tri) - 3 OH- ion
Surfactant Concentration 0.01%, 0.02%, 0.03%, 0.04% ,0.05%, 0.1%, 0.2%, 0.3% (wt%)
pH 1 to 13
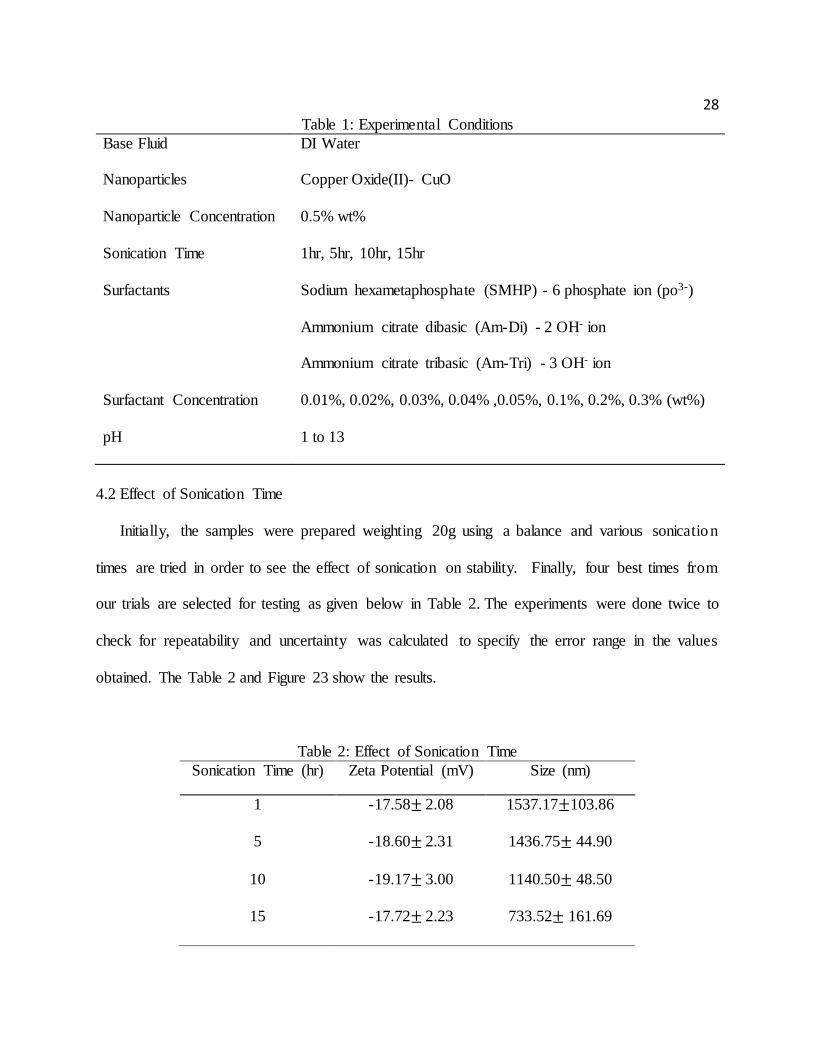
4.2 Effect of Sonication Time
Initially, the samples were prepared weighting 20g using a balance and various sonication
times are tried in order to see the effect of sonication on stability. Finally, four best times from
our trials are selected for testing as given below in Table 2. The experiments were done twice to
check for repeatability and uncertainty was calculated to specify the error range in the values
obtained. The Table 2 and Figure 23 show the results.
Table 2: Effect of Sonication Time
Sonication Time (hr) Zeta Potential (mV) Size (nm)
1 -17.58± 2.08 1537.17±103.86
5 -18.60± 2.31 1436.75± 44.90
10 -19.17± 3.00 1140.50± 48.50
15 -17.72± 2.23 733.52± 161.69

29
Figure 23:Effect of Sonication Time
From the experimental values, it can be observed that zeta potential didn’t change much w.r.t
sonication time. However, particle size decreased gradually as the sonication time increased. From
this, we can conclude that the sonication can break down the week bond between the particles
which are formed due weak attraction forces between the nanoparticles. However, it does not
improve or increase the charge present on the particle surface.
-2000
-1500
-1000
-500
0
500
1000
1500
2000
-100
-80
-60
-40
-20
0
20
40
60
80
100
0 5 10 15 20
Siz
e (n
m)
Zet
a P
ote
ntia
l (m
V)
Sonication Time (hr)
Zeta Potential (mV) Size (nm)
Linear (Zeta Potential (mV)) Linear (Size (nm))

30
4.3 Effect of Surfactant
As shown in Table 2, even after 15hrs of sonication, the zeta potential and size in pure copper
oxide + DI case is approximately 733nm and the zeta potential is too low. Therefore, from previous
research one of the best ways to reduce the size and improve surface charge on the particle surface
is by the addition of the surfactant. Actually, when a surfactant is added to the base fluid along
with the nanoparticle it dissolves into positive and negative ions. Based on the charge present on
the nanoparticle the surfactant ions are absorbed onto nanoparticle surface leading to increase in
the steric hindrance, which improves repulsion between the particles reducing the attraction forces.
The selection of surfactant is crucial based on the type of nanoparticle it can be cationic, anionic
and nonionic. Three different anionic surfactants were selected with PO3- and OH- functiona l
groups. Initially, the concentration of surfactants was fixed as 0.1 wt% from literature and
sonication time of 1 and 5hrs are used to find the best surfactant. See Table 3.
Table 3: Effect of Surfactant
Sonication Time (hr )
Pure CuO + SMHP Pure CuO + Am-Di Pure CuO + Am-
Tri
Zeta pot.
(- mv )
Size
( nm )
Zeta pot.
(- mv )
Size
( nm )
Zeta
pot.
(- mv )
Size
( nm )
1 89.23 305.30 60.73 244.63 87.50 246.23
5 88.07 233.67 102.1 274.53 108.90 228.56

31
Out of the three surfactants used, ammonium citrate tribasic (3 OH- ions) showed the best
results for size and zeta potential and was stable for a longer time compared to the non-surfactant
case. This is due to the presence of 3 OH- ions. Therefore, in order to check how the effect of the
surfactant on the stability w.r.t change in sonication the same four sonication times are used. Table
4 gives results of the effect of sonication time for Am-Tri surfactant only. (Figure 24).
Table 4 : Effect of Sonication on Am-Tri Surfactant
Sonication Time (hr) Zeta Potential(mV) Size(nm)
1 -87.08±8.73 265.98±5.62
5 -101.33±15.15 241.23±14.14
10 -83.18±20.35 228.02±21.40
15 -48.97±6.65 225.75±21.62

32
Figure 24:Effect of Sonication on Am-Tri Surfactant
The use of surfactant increased the charge present on the surface of the particles and decreased
the particle size by 5 times compared to non-surfactant nanofluid. Therefore, the repulsive forces
increased leading to improvement of total potential energy which is the main parameter affecting
the stability of the nanoparticle in the base fluid. The size decreased and zeta potential dropped as
sonication time increased. This may be due to crossing threshold value for sonication.
4.4 Effect of Surfactant Concentration
The results indicated that the ammonium citrate tribasic (3 OH- ions) is best. In order to check
how the amount of charge on the surface of nanoparticle varies w.r.t variation in the concentration,
only the surfactant was increased to 0.2 and 0.3 wt%. A single sonication time of 15hr was used
to check the effect. (Table 5 and Figure 25).
-300
-200
-100
0
100
200
300
400
-120
-100
-80
-60
-40
-20
0
20
40
60
80
100
0 5 10 15 20
Siz
e (n
m)
Zet
a P
ote
ntia
l (m
V)
Sonication Time (hr)
Zeta Potential(mV) Size(nm)
Linear (Zeta Potential(mV)) Linear (Size(nm))

33
Table 5: Effect of Surfactant Concentration
Sonication ( hr )
Pure CuO
Solution Pure CuO
+Am-Tri ( 0.1 % )
Pure CuO
+Am-Tri ( 0.2 % )
Pure CuO
+Am-Tri ( 0.3 % )
Zeta
pot.
( -mv )
Size
( nm )
Zeta
pot.
( -mv )
Size
( nm )
Zeta
pot.
( -mv )
Size
( nm )
Zeta
pot.
( -mv )
Size
( nm )
15 16.80 842.00 45.93 205.60 58.80 213.26 51.40 200.00
Figure 25:Effect of Surfactant Concentration
45.9358.8 51.4
205.6 213.26 200
-300
-200
-100
0
100
200
300
-100
-80
-60
-40
-20
0
20
40
60
80
100
0.10% 0.20% 0.30%
Siz
e (n
m)
Zet
a P
ote
ntia
l (-
mv)
Am-Tri Surfactant Concentration
Zeta pot. Size

34
The data shows that the surfactant concentration above 0.1% does not affect the zeta potential
and size significantly. Therefore, as the use of surfactant has some adverse effect on the thermal
properties, which affect the efficiency of the system, it is better to reduce the surfactant
concentration. Further experiments were done with reduced concentration of Am-Tri surfactant.
As data depicts Table 6, the sonication time doesn’t affect the zeta potential and size significantly.
(Figure 26). Therefore, 1hr of sonication is selected for further testing.
Table 6: Effect of Am-Tri Concentration
Am-Tri-Concentration Zeta Potential(mV) Size(nm)
0.01% -2.53 264.70
0.02% -3.63 263.77
0.03% -1.83 247.85
0.04% -1.30 249.93
0.05% -3.69 190.70

35
Figure 26:Effect of Am-Tri Concentration
The zeta potential is almost constant as the concentration of surfactant increases but the particle
size is decreasing as the surfactant concentration increases. Even though the sonication time is
constant the size decreased and zeta potential is almost constant as the surfactant concentration
increased. But, from the literature as we know that the charge on nanoparticle will increase with
addition of surfactant and as concentration increases the charge should also increase but our case
it is almost constant. This behavior may be due to uneven charge distribution and steric hindrance.
-300.00
-200.00
-100.00
0.00
100.00
200.00
300.00
400.00
-100.00
-80.00
-60.00
-40.00
-20.00
0.00
20.00
40.00
60.00
80.00
100.00
0.00% 0.01% 0.02% 0.03% 0.04% 0.05% 0.06%
Zet
a P
ote
ntia
l (m
v)
Am-Tri- Concentration
Zeta Potential(mV) Size(nm)
Linear (Zeta Potential(mV)) Linear (Size(nm))
36
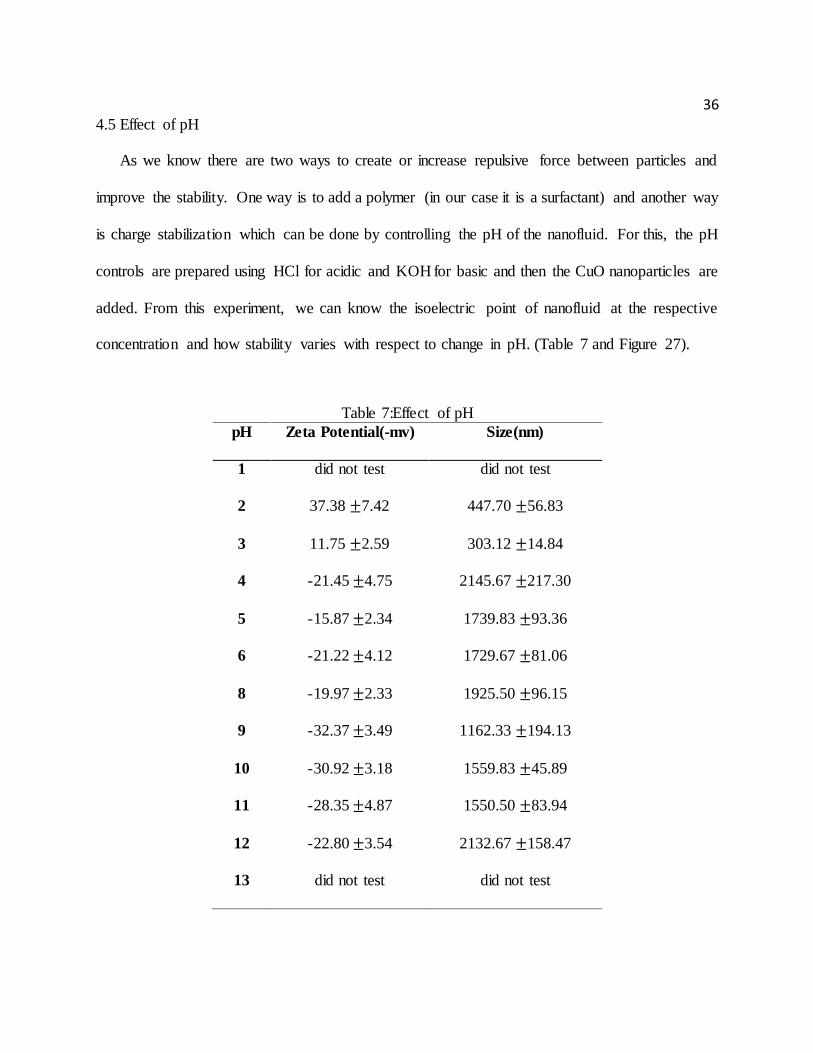
4.5 Effect of pH
As we know there are two ways to create or increase repulsive force between particles and
improve the stability. One way is to add a polymer (in our case it is a surfactant) and another way
is charge stabilization which can be done by controlling the pH of the nanofluid. For this, the pH
controls are prepared using HCl for acidic and KOH for basic and then the CuO nanoparticles are
added. From this experiment, we can know the isoelectric point of nanofluid at the respective
concentration and how stability varies with respect to change in pH. (Table 7 and Figure 27).
Table 7:Effect of pH
pH Zeta Potential(-mv) Size(nm)
1 did not test did not test
2 37.38 ±7.42 447.70 ±56.83
3 11.75 ±2.59 303.12 ±14.84
4 -21.45 ±4.75 2145.67 ±217.30
5 -15.87 ±2.34 1739.83 ±93.36
6 -21.22 ±4.12 1729.67 ±81.06
8 -19.97 ±2.33 1925.50 ±96.15
9 -32.37 ±3.49 1162.33 ±194.13
10 -30.92 ±3.18 1559.83 ±45.89
11 -28.35 ±4.87 1550.50 ±83.94
12 -22.80 ±3.54 2132.67 ±158.47
13 did not test did not test

37
Figure 27:Effect of pH-Zeta Potential
-60.00
-40.00
-20.00
0.00
20.00
40.00
60.00
0 2 4 6 8 10 12
Zet
a P
ote
ntia
l (m
V)
pH
Zeta Potential(-mv)
IEP: pH 4.5

38
The experiments performed to check for repeatability and nanofluids at pH 1 and 13 were not
measured for zeta potential and size as the particles have settle down in between the sonication
process due to the chemical reaction between the nanoparticle as HCL and KOH is used to prepare
the pH controls to maintain the pH of nanofluids. In the Figure 27, we can see how the zeta
potential is varying with respect to change in pH of nanofluid the IEP is at pH 4.5 it is the point
where the charge present on the nanoparticle is almost zero which leads to settle down of particles .
The nanofluid is most stable at pH 3 and4, whereas for a typical nanofluid just away from the IEP
the nanofluid is least stable. In our case, the nanofluids at pH 3 and4 are stable compared to that
of nanofluids at higher pH. One possible reason could be the effect of the size which is the major
factor for faster settle down which can be seen in Figure 28.
Figure 28:Effect of pH-Size
0
500
1000
1500
2000
2500
0 2 4 6 8 10 12
Siz
e(nm
)
pH
Size(nm) Linear (Size(nm))

39
4.6 Effect of pH + Surfactant
From the literature, we know that addition of surfactant and stabilization of charge (pH control)
can alter the charge on the surface of the nanoparticle to increase the repulsive forces. Until now
we have seen the effect of individual parameters. So, in order to observe how the combination of
both surfactant and pH increases the surface charge, the three surfactants with the different
functional group are mixed with pH controls which are prepared with HCL for acidic and KOH
for basic mediums. (Tables 8-10 and Figures 29 and 30).
Table 8:Effect of pH + SHMP
pH Zeta Potential(-mv) Size(nm)
1 did not test did not test
2 -14.75 ±7.83 267.22 ±21.51
3 -2.05 ±4.92 261.28 ±12.54
4 -6.99 ±3.12 264.03 ±5.63
5 -25.54 ±5.24 273.12 ±16.01
6 -16.76 ±4.73 290.45 ±44.72
8 -24.57 ±3.98 277.15 ±18.33
9 -1.95 ±1.31 261.93 ±12.68
10 -15.79 ± 4.36 300.97 ±46.25
11 -2.77 ±3.23 257.13 ±18.05
12 -47.16 ±7.08 275.03 ±13.78
13 did not test did not test

40
Table 9:Effect of pH+ Am-Di
pH Zeta Potential(mv) Size(nm)
1 Did not test Did not test
2 -22.57 404.88
3 -29.13 303.47
4 -35.90 380.77
5 -37.19 312.18
6 -19.63 315.45
8 -39.95 302.52
9 -29.42 302.43
10 -45.27 380.72
11 -44.35 356.50
12 -27.32 333.45
13 did not test did not test

41
Table 10:Effect of pH + Am-Tri
pH Zeta Potential(mv) Size(nm)
1 Did not test Did not test
2 -55.93 366.70
3 -35.60 326.43
4 -37.60 324.65
5 -23.54 321.55
6 -12.17 253.50
8 -13.24 322.93
9 -30.08 268.40
10 -28.98 280.52
11 -17.93 314.28
12 -41.67 392.70
13 did not test did not test

42
Figure 29:Effect of pH + Surfactant-Zeta Potential
-80
-70
-60
-50
-40
-30
-20
-10
0
0 2 4 6 8 10 12 14
Zet
a P
ote
ntia
l (m
V)
pH
CuO+ SHMP CuO+Am-Tri CuO+Am-Di

43
Figure 30:Effect of pH + Surfactant-Size
The experimental finding shows that the combination of surfactant and pH is not good as the
zeta potential and particle size values are varying for the same sonication time of 1hr. The results
indicate that the combination of SHMP (functional group PO3-) + pH is best compared to Am-Di
and Am- Tri with OH- as the functional group is different, whereas when used individually the
surfactant Am-Tri (3 OH-) is the best surfactant to prepare stable nanofluid. The prime reason for
this behavior may be due to the presence of different functional group which will react with HCL
and KOH.
200
250
300
350
400
450
0 2 4 6 8 10 12 14
Zet
a P
ote
ntia
l (m
V)
pH
CuO+ SHMP CuO+Am-Tri CuO+Am-Di

44
4.7 Effect of Functional Group
The above results indicate that the performance of surfactant to improve stability is
significantly affected by the chemical structure (functional group) of surfactant and their
interaction with charge present on the nanoparticles in the solution. So, various combinations of
SHMP (PO3- ion) and Am-Tri (OH-) surfactants as shown in Table 11 and 12 are prepared and
experiments were performed.
Table 11:Surfactant Ratio
S. No SHMP Am-Tri
1 20% 80%
2 40% 60%
3 60% 40%
4 80% 20%
Table 12: Effect of Functional Group
SHMP/Am-Tri Zeta Potential(mV) Size(nm) pH
20/80 -3.45±1.29 272.85±8.72 7.95
40/60 -4.93±1.43 266.53±8.51 7.88
60/40 -2.58±0.83 262.05±8.50 8.03
80/20 -1.80±1.00 257.60±5.81 8.00
The mixing of the two surfactants didn’t alter the pH w.r.t to the change in the concentration
ratio of surfactant. (Figures 31 and 32).

45
Figure 31: pH Variation for SHMP/Am-Tri Combinations
Figure 32:Effect of SHMP/Am-Tri Combinations
0.00
3.00
6.00
9.00
12.00
0 1 2 3 4 5
pH
SHMP/Am-Tri
pH Linear (pH)
-300.00
-200.00
-100.00
0.00
100.00
200.00
300.00
400.00
-100.00
-80.00
-60.00
-40.00
-20.00
0.00
20.00
40.00
60.00
80.00
100.00
0 1 2 3 4 5
Zet
a P
ote
ntia
l (m
V)
SHMP/Am-Tri
Zeta Potential(mV) Size (nm)
Linear (Zeta Potential(mV)) Linear (Size (nm))
46
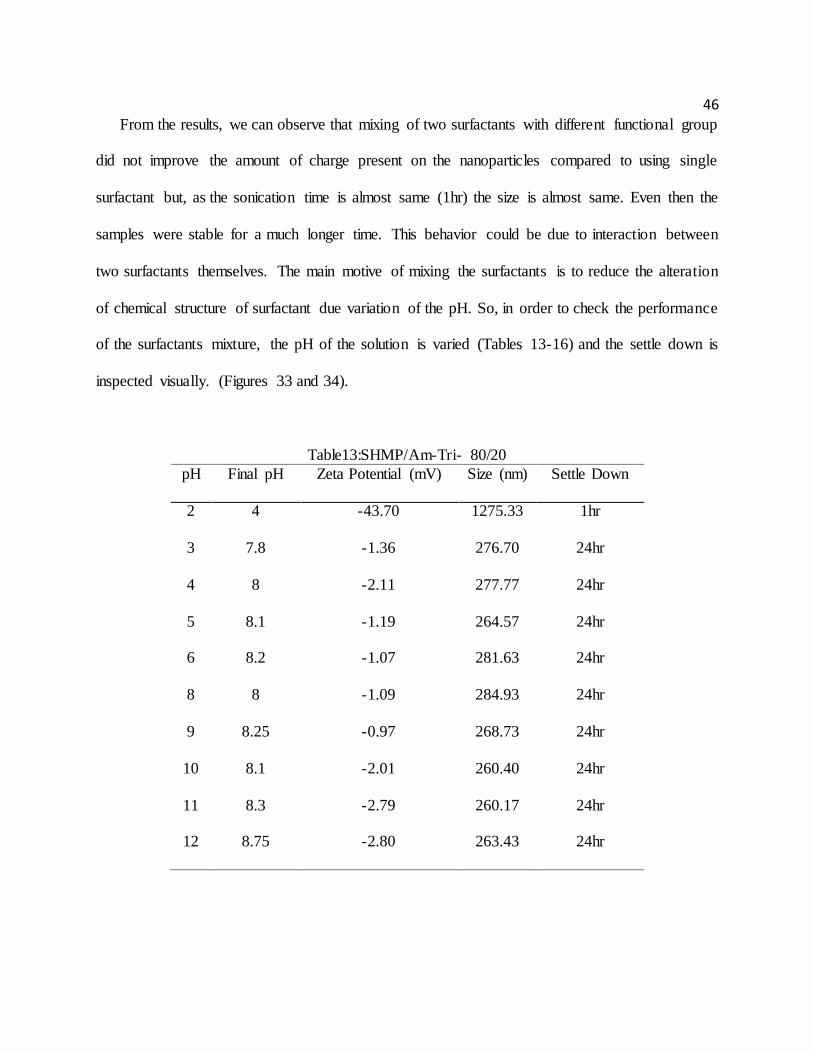
From the results, we can observe that mixing of two surfactants with different functional group
did not improve the amount of charge present on the nanoparticles compared to using single
surfactant but, as the sonication time is almost same (1hr) the size is almost same. Even then the
samples were stable for a much longer time. This behavior could be due to interaction between
two surfactants themselves. The main motive of mixing the surfactants is to reduce the alteration
of chemical structure of surfactant due variation of the pH. So, in order to check the performance
of the surfactants mixture, the pH of the solution is varied (Tables 13-16) and the settle down is
inspected visually. (Figures 33 and 34).
Table13:SHMP/Am-Tri- 80/20
pH Final pH Zeta Potential (mV) Size (nm) Settle Down
2 4 -43.70 1275.33 1hr
3 7.8 -1.36 276.70 24hr
4 8 -2.11 277.77 24hr
5 8.1 -1.19 264.57 24hr
6 8.2 -1.07 281.63 24hr
8 8 -1.09 284.93 24hr
9 8.25 -0.97 268.73 24hr
10 8.1 -2.01 260.40 24hr
11 8.3 -2.79 260.17 24hr
12 8.75 -2.80 263.43 24hr

47
Table 14: SHMP/Am-Tri- 60/40
pH Final pH Zeta Potential (mV) Size (nm) Settle Down
2 2.8 -8.57 277.60 15hr
3 6.78 -3.01 252.47 20hr
4 8 -2.46 254.60 20hr
5 8.05 -5.55 261.10 20hr
6 8.1 -2.47 253.67 20hr
8 8.07 -5.23 255.73 20hr
9 8.11 -2.39 254.53 20hr
10 8.2 -2.70 258.37 20hr
11 8.32 -2.84 272.17 20hr
12 8.73 -8.40 260.63 20hr

48
Table 15: SHMP/Am-Tri- 40/60
pH Final pH Zeta Potential (mV) Size (nm) Settle Down
2 3 -33.60 397.33 10hr
3 6.8 -8.27 268.83 24hr
4 8.1 -2.79 256.90 24hr
5 8.1 -2.18 257.00 24hr
6 7.85 -3.76 276.13 24hr
8 8.1 -1.33 242.87 24hr
9 8 -4.66 257.70 24hr
10 7.9 -1.78 260.83 24hr
11 8.25 -5.27 249.37 24hr
12 8.75 -2.52 258.40 24hr

49
Table 16: SHMP/Am-Tri- 20/80
pH Final pH Zeta Potential (mV) Size (nm) Settle Down
2 3.3 -8.07 299.13 24hr
3 7 -0.66 222.10 24hr
4 7.9 -4.30 265.80 24hr
5 8 -6.78 285.20 24hr
6 8 -3.18 275.80 24hr
8 8 -15.80 259.77 24hr
9 8.1 -12.13 256.27 24hr
10 8 -11.63 281.03 24hr
11 8.2 -1.50 255.40 24hr
12 8.7 -3.32 262.03 24hr

50
Figure 33:Effect of pH on SHMP/Am-Tri Combinations-Zeta Potential
-80
-60
-40
-20
0
0 2 4 6 8 10 12 14
Zet
a P
ote
ntia
l (m
V)
pH
SHMP/Am-tri-(80/20) SHMP/Am-tri-(60/40)
SHMP/Am-tri-(40/60) SHMP/Am-tri-(20/80)

51
Figure 34:Effect of pH on SHMP/Am-Tri Combinations-Size
The zeta potential and size for various combinations w.r.t change pH was almost same. For the
combination SHMP/Am-Tri-(80/20), the size at pH 2 is 1275 nm which is the main reason for
settle down even the zeta potential is -43 mV. Further research has to be done in order to see the
200
500
800
1100
1400
0 2 4 6 8 10 12 14
Siz
e (n
m)
pH
SHMP/Am-tri-(80/20) SHMP/Am-tri-(60/40)
SHMP/Am-tri-(40/60) SHMP/Am-tri-(20/80)

52
variation of zeta potential and size at low pH by increasing functional groups. The tolerance to pH
variation has decreased as the number of functional groups increased.
The settle down for various combination was visually inspected (Figure 35). The results give
indicate that the combination of SHMP/Am-Tri-(20/80) is least sensitive to variation in pH as all
the sample for different pH approximately stable for 24hrs. However, the remaining combinations
were not effective for pH above 3 and stable for a longer time as indicated in Figure 35.
Figure 35:Effect of pH on SHMP/Am-Tri Combinations-Settle Down Time
0
5
10
15
20
25
30
0 2 4 6 8 10 12 14
Set
tle D
ow
n Tim
e (h
r)
pH
SHMP/Am-tri-(80/20) SHMP/Am-tri-(60/40)
SHMP/Am-tri-(40/60) SHMP/Am-tri-(20/80)

5.CONCLUSION
Extensive experiments have been performed to study the parameters affecting the stability. The
stability of nanofluids mainly depends on the surface charge or energy (i.e. zeta potential), particle
size, surfactant additives (i.e. stabilizers), and pH (i.e. proton concentration) of nanofluids. In this
study, it was observed that the mechanical breakdown of particles by sonication alone could not
improve the stability of the nanofluids: even after 15hr of sonication, the average particle size was
still large (i.e. 733 nm) and zeta potential was much lower (i.e. -17mV) than standard valve ( 30
mV) for the stable condition.
Three different surfactants consisting of different functional groups were used to investigate
the effect of surfactants and their functional groups. Ammonium citrate tribasic having 3 OH- as
functional groups was the best in reducing the average particle size and enhancing the zeta
potential. The effect of surfactant concentration was leveled out around 0.1 wt %, and the stability
factors (size and zeta potential) were not changed significantly any further for the greater
concentrations.
Stability of the nanofluids was tested further in the various pH conditions to investigate the
effect of interactions among the particles and base solvent on the stability. The experimental results
showed that the isoelectric point (IEP), where net surface charge becomes zero (i.e. no repulsive
forces among particles) and the stable condition can be achieved by moving away from the

54
isoelectric point (IEP), was found at pH 4.5, but samples were stable at pH 3 and 4 which is very
close to the IEP. The discrepant behavior was considered due to effect of particle size.
The sensitivity of surfactant function to pH conditions was tested, and there were specific
ranges of pH for each surfactant to work properly, indicating that the used surfactants will lose
their function causing particles to settle down as the pH of solution changes. The combined use
of surfactants improved tolerance of surfactant to pH conditions, and for the wider range of pH,
the stable nanofluids were obtained.

REFERENCES
[1] Xian-ju Wang , s. Z. Dong and y. Shuo, "Investigation of pH and SDBS on enhancement of
thermal conductivity in nanofluids," Chemical Physics Letters, vol. 470, pp. 107-111, 2009.
[2] A. Ghadimi , R. Saidur and H.S.C. Metselaar, "A review of nanofluid stability properties and characterization in stationary conditions," International Journal of Heat and Mass Transfer, vol. 54, pp. 4051-4068, 2011.
[3] M. Kole and T. Dey, "Investigations on the pool boiling heat transfer and critical heat flux
of ZnO-ethylene glycol nanofluids," Applied Thermal Engineering, vol. 37, pp. 112-119, 2012.
[4] I. M. Mahbubul. et. al., "Effect of Ultrasonication Duration on Colloidal Structure and Viscosity of Alumina–Water Nanofluid," Industrial & Engineering Chemistry Research, vol.
53, p. 6677–6684, 2014.
[5] W. Yu and H. Xie, "A Review on Nanofluids: Preparation, Stability Mechanisms, and Applications," Journal of Nanomaterials, 2012.
[6] D. Wen and Y. Ding, "Effective Thermal Conductivity of Aqueous Suspensions of Carbon Nanotubes (Carbon Nanotube Nanofluids)," Journal of Thermophysics and Heat Transfer,
vol. 18, pp. 481-485, 2004.
[7] I. Shahrul, I. Mahbubul, R. Saidur and M. Sabri, "Experimental investigation on Al2O3–W, SiO2–W and ZnO–W nanofluids and their application in a shell and tube heat exchanger, "
International Journal of Heat and Mass Transfer, vol. 97, pp. 547-558, 2016.
[8] M. Khairu, K. Shah, E. Doroodchi, R. Azizian and B. Moghtaderi, "Effects of surfactant on
stability and thermo-physical properties of metal oxide nanofluids," International Journal of Heat and Mass Transfer, vol. 98, pp. 778-787, 2016.
[9] L. Jia, Y. Chen, S. Lei, S. Mo, Z. Liu and X. Shao, "Effect of magnetic field and surfactant
on dispersion of Graphene/water nanofluid during solidification," in Energy Procedia, 2014.

56
[10] A. Khalil, M. Ali and A. Azmi, "Effect of Al2O3 nanolubricant with SDBS on tool wear during turning process of AISI 1050 with minimal quantity lubricant," in Procedia Manufacturing, 2015.
[11] H. Xie, H. Lee, W. Youn and M. Choi, "A review of nanofluid stability properties and
characterization in stationary conditions," International Journal of Heat and Mass Transfer, vol. 54, p. 4051–4068, 2011.
[12] K. Goudarzi, F. Nejati, E. Shojaeizadeh and S. Asadi Yousef-abad, "Experimental study on the effect of pH variation of nanofluids on the thermal efficiency of a solar collector with
helical tube," Experimental Thermal and Fluid Science, vol. 60, pp. 20-27, 2015.
[13] H. j. Kim, S.-H. Lee, J.-H. Lee and S. P. Jang, "Effect of particle shape on suspension stability and thermal conductivities of water-based bohemite alumina nanofluids," Energy,
vol. 90, pp. 1290-1297, 2015.
[14] T. Gregor and B. Michal , "Laboratory of Colloid and Surface Chemistry (LCSC) Univers ity
of Geneva," Creative Commons Attribution 4.0 International License. , 2 October 2014. [Online]. Available: http://www.colloid.ch/index.php?name=dlvo. [Accessed 6 July 2016].
[15] Malvern Instruments, " Zeta Potential An Introduction in 30 minutes".
[16] M. Chaplin, "Water Structure and Science," Creative Commons Attribution -Noncommercial-No Derivative Works 2.0 UK: England & Wales License, 5 july 2016.
[Online]. Available: http://www1.lsbu.ac.uk/water/physical_anomalies.html. [Accessed 7 july 2016].
[17] "Wikiwand," Wikipedia,
[Online]. Available: http://www.wikiwand.com/en/Polyelectrolyte_adsorption.
[18] Wikipedia, "Wikipedia," Wikimedia Foundation, Inc, 7 June 2016. [Online]. Availab le : https://en.wikipedia.org/wiki/Zeta_potential. [Accessed 6 july 2016].
[19] K. A. Abd, "Emulsion Stability," 3 August 2013. [Online]. Available: http://www.slideshare.net/akarim717/emulsion-stability.
[20] S. U. S. Choi and J. A. Eastman, "Enhanced heat transfer using nanofluids". USA Patent US
6221275 B1, 24 Apr 2001.
[21] Shimadzu Scientific Instruments, "High-sensitivity Measurement of Nano Particle Size Distribution.,"

57
[Online]. Available: http://www.ssi.shimadzu.com/products/product.cfm?product=sa ld-7500nano. [Accessed 5 june 2016].
[22] A. J. Wheeler and A. R. Ganji, Introduction to Engineering Experimentation, vol. 3, Prentice Hall.