experimental measurement of nanofluids …ijame.ump.edu.my/images/volume_7/5_hussein et al.pdf ·...
TRANSCRIPT
International Journal of Automotive and Mechanical Engineering (IJAME)
ISSN: 2229-8649 (Print); ISSN: 2180-1606 (Online); Volume 7, pp. 850-863, January-June 2013
©Universiti Malaysia Pahang
DOI: http://dx.doi.org/10.15282/ijame.7.2012.5.0070
850
EXPERIMENTAL MEASUREMENT OF NANOFLUIDS THERMAL
PROPERTIES
Adnan M. Hussein1,4
, R.A. Bakar1,2
, K. Kadirgama1,2
and K.V. Sharma3
1Faculty of Mechanical Engineering, 26600 Pekan, Pahang,
Universiti Malaysia Pahang
Phone: +60179809114
E-mail: [email protected] 2Automotive Engineering Centre, Universiti Malaysia Pahang,
26600 Pekan, Pahang, Malaysia 3Centre for Energy, JNTU College of Engineering,
Kukatpally, Hyderabad, India 4Al-Haweeja Institute, Foundation of Technical Education, Iraq
ABSTRACT
Solid particles dispersed in a liquid with sizes no larger than 100nm, known as
nanofluids, are used to enhance Thermophysical properties compared to the base fluid.
Preparations of alumina (Al2O3), titania (TiO2) and silica (SiO2) in water have been
experimentally conducted in volume concentrations ranging between 1 and 2.5%.
Thermal conductivity is measured by the hot wire method and viscosity with viscometer
equipment. The results of thermal conductivity and viscosity showed an enhancement
(0.5–20% and 0.5–60% respectively) compared with the base fluid. The data measured
agreed with experimental data of other researchers with deviation of less than 5%. The
study showed that alumina has the highest thermal conductivity, followed silica and
titania, on the other hand silica has the highest viscosity followed alumina and titania.
Keywords: Nanofluid; thermal conductivity; viscosity.
INTRODUCTION
The increasing need in many applications for fluids with more efficient heat transfer has
been led to enhance heat transfer to meet the cooling challenge necessary, such as in the
electronics, photonics, transportation and energy supply industries (Das et al., 2008).
The experimental study of copper suspended in water to enhance the heat transfer and
reduce pumping power in a heat exchanger was carried out by Choi and Eastman
(1995). The thermal conductivity of nanofluids has been calculated theoretically, and
the results showed a high thermal conductivity compared with the base fluid. Metals
have higher thermal conductivities than fluids at room temperature, as shown in Table 1
(Touloukian and DeWitt, 1970). The thermal conductivity of metallic liquids is much
greater than that of non-metallic liquids. Therefore the thermal conductivities of fluids
that contain suspended solid metallic particles could be expected to be significantly
higher than those of conventional heat transfer fluids. Sen Gupta et al. (2011) carried out
an experimental study to measure the thermal conductivity in graphene nanofluids using
the transient hot wire method. They also studied carbon nanotube (CNT) and graphene
oxide nanofluids. The magnitude of enhancement was between CNT and metallic/metal
oxide nanofluids. The multicurrent hot-wire technique was used by Peñas et al. (2008)
to measure the thermal conductivity of SiO2 and CuO in water and ethylene glycol
Hussein et al. /International Journal of Automotive and Mechanical Engineering 7(2013) 850-863
851
nanofluids with concentrations of up to 5% in mass fraction. They found good
agreement, within 2%, with the published thermal conductivities of the pure fluids. The
optimisation of the thermal conductivity of nanofluids has been proposed by Xie et al.
(2011), various nanoparticles involving Al2O3 of different sizes, SiC with different
shapes, MgO , ZnO , SiO2 , Fe3O4 , TiO2, diamond and carbon nanotubes. The base
fluids used have been deionised water (DW), ethylene glycol (EG), glycerol, silicone
oil, and a binary mixture of DW and EG. Results showed that the thermal conductivity
enhancements of nanofluids could be influenced by multi-faceted factors, including the
volume fraction of the nanoparticles, the tested temperature, thermal conductivity of the
base fluid, size of the nanoparticles, the pre-treatment process, and the additives of the
fluids. The viscosity and specific heat of silicon dioxide (SiO2) nanoparticles with
various diameters (20, 50 and 100 nm) suspended in a 60:40 (by weight) ethylene glycol
and water mixture were investigated experimentally by Namburu et al. (2007). The
results showed a new correlation of the experimental data, which related viscosity with
particle volume percent and nanofluid temperature. Also the specific heats of the SiO2
nanofluids for various particle volume concentrations were reviewed. Murshed et al.
(2006) examined the effect of temperature and volume fraction on viscosity for a TiO2-
water nanofluid. Results were recorded and analysed within a temperature range of 25
to 70oC and volume fractions of 0.1, 0.4, 0.7 and 1%. The viscosity measured using a
rheometer has been studied by Bobbo et al. (2012). It was obtained as a function of the
nanoparticle’s mass fraction and shear rate. Water was used as the base fluid with two
different materials: single wall carbon nanohorn (SWCNH) and titanium dioxide (TiO2).
The results proposed an empirical correlation to the equations of viscosity. In this study
three types of nanoparticle (Al2O3, TiO2 and SiO2) are suspended in water prepared in a
laboratory. The thermal conductivity and viscosity of these nanofluids are measured
experimentally. The results for the thermal conductivity and viscosity are compared
with standard values and other available studies.
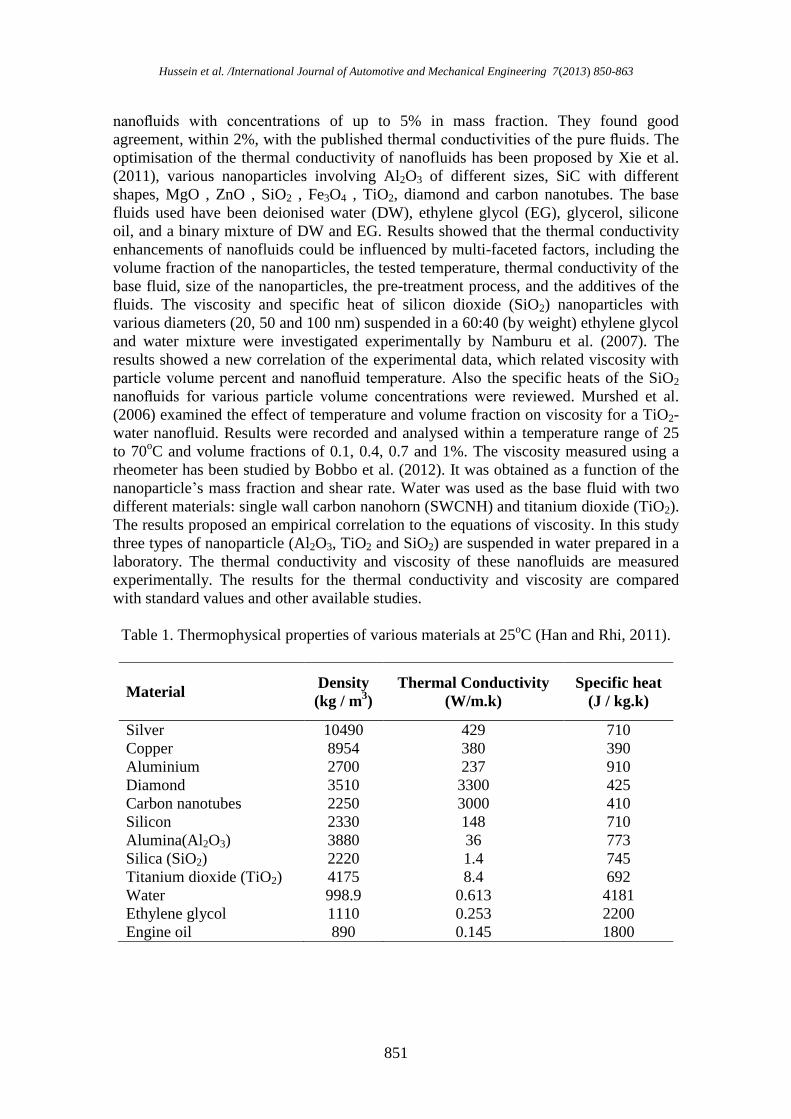
Table 1. Thermophysical properties of various materials at 25oC (Han and Rhi, 2011).
Material Density
(kg / m3)
Thermal Conductivity
(W/m.k)
Specific heat
(J / kg.k)
Silver
Copper
Aluminium
10490
8954
2700
429
380
237
710
390
910
Diamond
Carbon nanotubes
Silicon
3510
2250
2330
3300
3000
148
425
410
710
Alumina(Al2O3)
Silica (SiO2)
Titanium dioxide (TiO2)
3880
2220
4175
36
1.4
8.4
773
745
692
Water
Ethylene glycol
Engine oil
998.9
1110
890
0.613
0.253
0.145
4181
2200
1800
Experimental measurement of nanofluids thermal properties
852
PREPARATION OF NANOFLUIDS
Nanofluids have been prepared in the thermal laboratory of the Mechanical Engineering
Faculty of the University Malaysia Pahang. Nanopowders were purchased from US
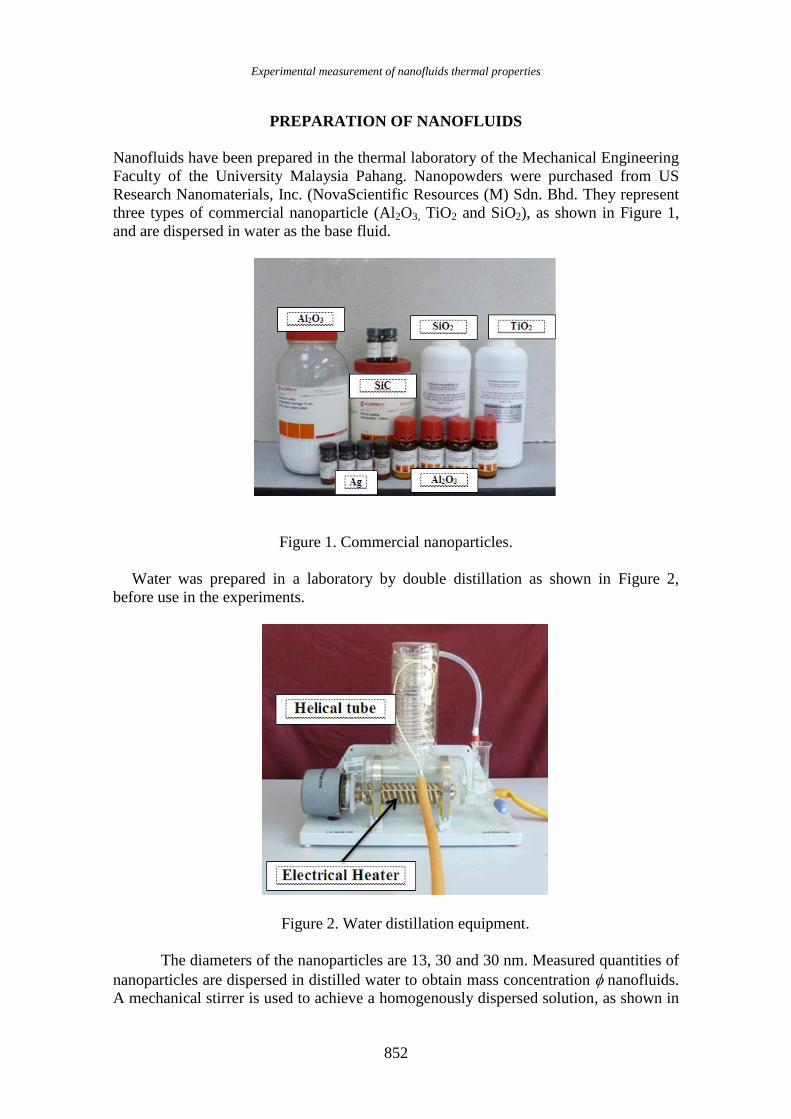
Research Nanomaterials, Inc. (NovaScientific Resources (M) Sdn. Bhd. They represent
three types of commercial nanoparticle (Al2O3, TiO2 and SiO2), as shown in Figure 1,
and are dispersed in water as the base fluid.
Figure 1. Commercial nanoparticles.
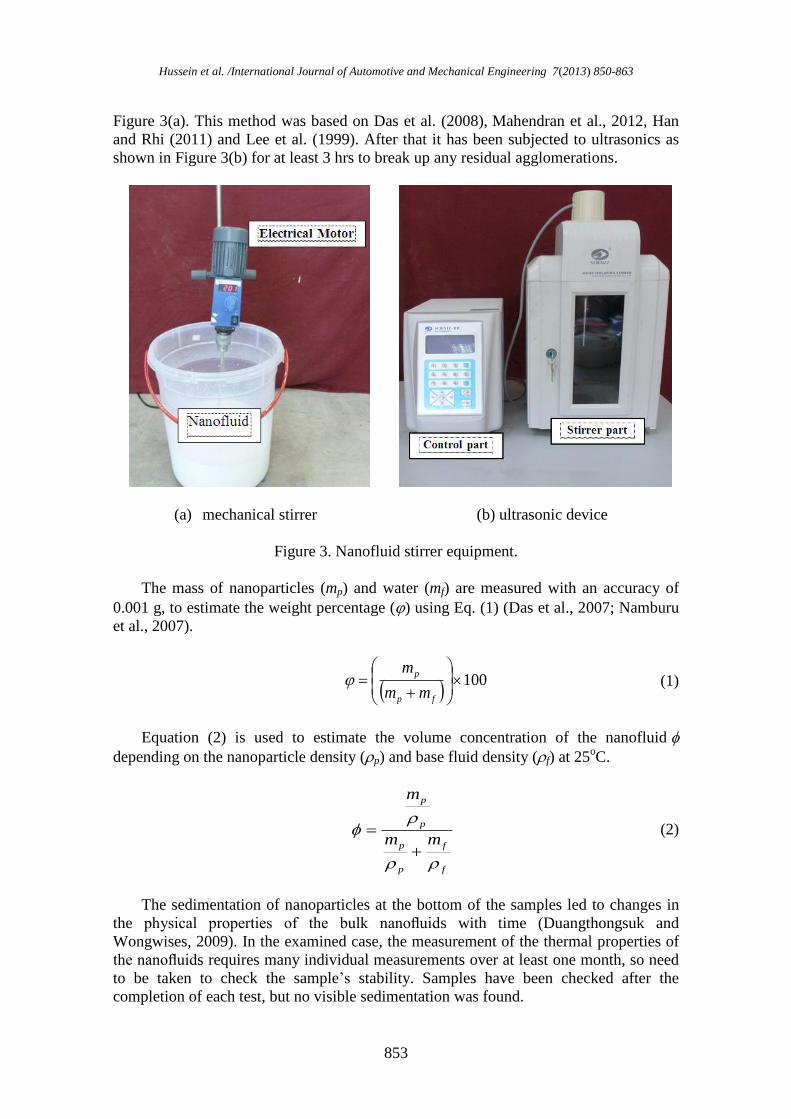
Water was prepared in a laboratory by double distillation as shown in Figure 2,
before use in the experiments.
Figure 2. Water distillation equipment.
The diameters of the nanoparticles are 13, 30 and 30 nm. Measured quantities of
nanoparticles are dispersed in distilled water to obtain mass concentration nanofluids.
A mechanical stirrer is used to achieve a homogenously dispersed solution, as shown in
Hussein et al. /International Journal of Automotive and Mechanical Engineering 7(2013) 850-863
853
Figure 3(a). This method was based on Das et al. (2008), Mahendran et al., 2012, Han
and Rhi (2011) and Lee et al. (1999). After that it has been subjected to ultrasonics as
shown in Figure 3(b) for at least 3 hrs to break up any residual agglomerations.
(a) mechanical stirrer
(b) ultrasonic device
Figure 3. Nanofluid stirrer equipment.
The mass of nanoparticles (mp) and water (mf) are measured with an accuracy of
0.001 g, to estimate the weight percentage () using Eq. (1) (Das et al., 2007; Namburu
et al., 2007).
100
fp
p
mm
m (1)
Equation (2) is used to estimate the volume concentration of the nanofluid
depending on the nanoparticle density (p) and base fluid density (f) at 25oC.
f
f
p
p
p
p
mm
m
(2)
The sedimentation of nanoparticles at the bottom of the samples led to changes in
the physical properties of the bulk nanofluids with time (Duangthongsuk and
Wongwises, 2009). In the examined case, the measurement of the thermal properties of
the nanofluids requires many individual measurements over at least one month, so need
to be taken to check the sample’s stability. Samples have been checked after the
completion of each test, but no visible sedimentation was found.
Experimental measurement of nanofluids thermal properties
854
THERMOPHYSICAL PROPERTIES
There are many studies that use the regression equations of density (nf) and the specific
heat capacity (Cnf) (Choi and Eastman, 1995; Das et al., 2008; Fedele et al., 2012; Putra
et al., 2003; Trisaksri and Wongwises, 2007; Wang et al., 1999; Wen and Ding, 2004;
Williams et al., 2008; Zeinali Heris et al., 2007; Zhou and Ni, 2008):
fp
1001
100nf
(3)
nf
fp
nf
CC
C
100
1100
(4)
The base fluid (water) properties are estimated depending on the base
temperature as regression equations (Sharma et al., 2012):
2
2
41365119000
411000
ff
f
fTT
T (5a)
54 86
32
547924159
0013200950302088836294217
ff TT
ffff
e.e.
T.T.T..C
(5b)
32 86088036601527492001930561120 ff TT
ff e.e.T..k
(5c) 32 975
0993504292554252634001690 fff TTT
f eee
.... (5d)
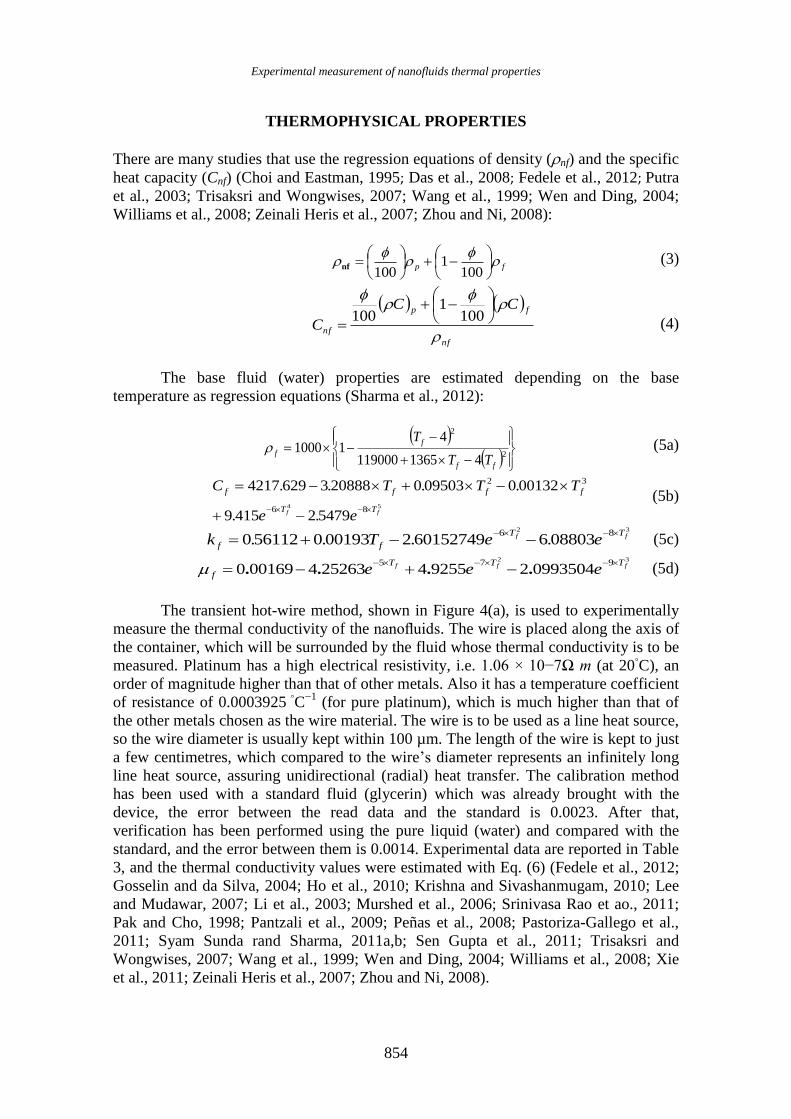
The transient hot-wire method, shown in Figure 4(a), is used to experimentally
measure the thermal conductivity of the nanofluids. The wire is placed along the axis of
the container, which will be surrounded by the fluid whose thermal conductivity is to be
measured. Platinum has a high electrical resistivity, i.e. 1.06 × 10⁻⁷Ω m (at 20C), an
order of magnitude higher than that of other metals. Also it has a temperature coefficient
of resistance of 0.0003925 C
−1 (for pure platinum), which is much higher than that of
the other metals chosen as the wire material. The wire is to be used as a line heat source,
so the wire diameter is usually kept within 100 µm. The length of the wire is kept to just
a few centimetres, which compared to the wire’s diameter represents an infinitely long
line heat source, assuring unidirectional (radial) heat transfer. The calibration method
has been used with a standard fluid (glycerin) which was already brought with the
device, the error between the read data and the standard is 0.0023. After that,
verification has been performed using the pure liquid (water) and compared with the
standard, and the error between them is 0.0014. Experimental data are reported in Table
3, and the thermal conductivity values were estimated with Eq. (6) (Fedele et al., 2012;
Gosselin and da Silva, 2004; Ho et al., 2010; Krishna and Sivashanmugam, 2010; Lee
and Mudawar, 2007; Li et al., 2003; Murshed et al., 2006; Srinivasa Rao et ao., 2011;
Pak and Cho, 1998; Pantzali et al., 2009; Peñas et al., 2008; Pastoriza-Gallego et al.,
2011; Syam Sunda rand Sharma, 2011a,b; Sen Gupta et al., 2011; Trisaksri and
Wongwises, 2007; Wang et al., 1999; Wen and Ding, 2004; Williams et al., 2008; Xie
et al., 2011; Zeinali Heris et al., 2007; Zhou and Ni, 2008).
Hussein et al. /International Journal of Automotive and Mechanical Engineering 7(2013) 850-863
855
wnf k)(k 31 (6)
The standard deviation corresponding to the series of individual data measured for
each nanofluid and each temperature was in all cases less than 0.15%. To evaluate the
thermal properties of the nanofluids, the viscosity is an important indication. A
commercial Brookfield DV-I prime viscometer is used to measure the viscosity at
different temperatures and rotor RPMs, which is shown in Figure 4(b). The base fluid
(water) has been used to measure the viscosity for calibration, after which nanofluids
are used to measure the viscosity. The viscosity of the nanofluid (nf) is determined
from the well-known Einstein equation for estimating viscosity, which is validated for
spherical particles and volume concentrations less than 5.0 vol. % and was defined by
(Bahiraei et al., 2012; Duangthongsuk and Wongwises, 2009; Fedele et al., 2012;
Gosselin and da Silva, 2004; Han and Rhi, 2011; Namburu et al., 2007).
wnf ).( 521 (7)
(a) Thermal conductivity device
(b) Viscometer device
Figure 4. Measurements devices.
RESULTS AND DISCUSSION
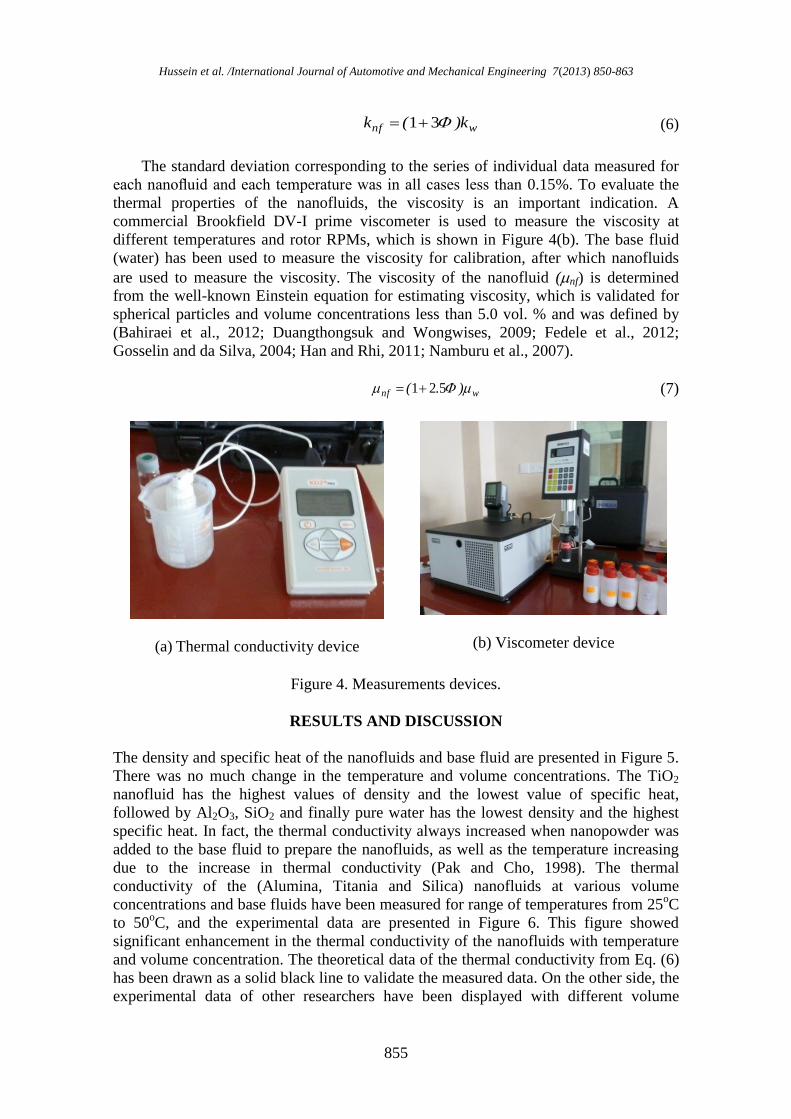
The density and specific heat of the nanofluids and base fluid are presented in Figure 5.
There was no much change in the temperature and volume concentrations. The TiO2
nanofluid has the highest values of density and the lowest value of specific heat,
followed by Al2O3, SiO2 and finally pure water has the lowest density and the highest
specific heat. In fact, the thermal conductivity always increased when nanopowder was
added to the base fluid to prepare the nanofluids, as well as the temperature increasing
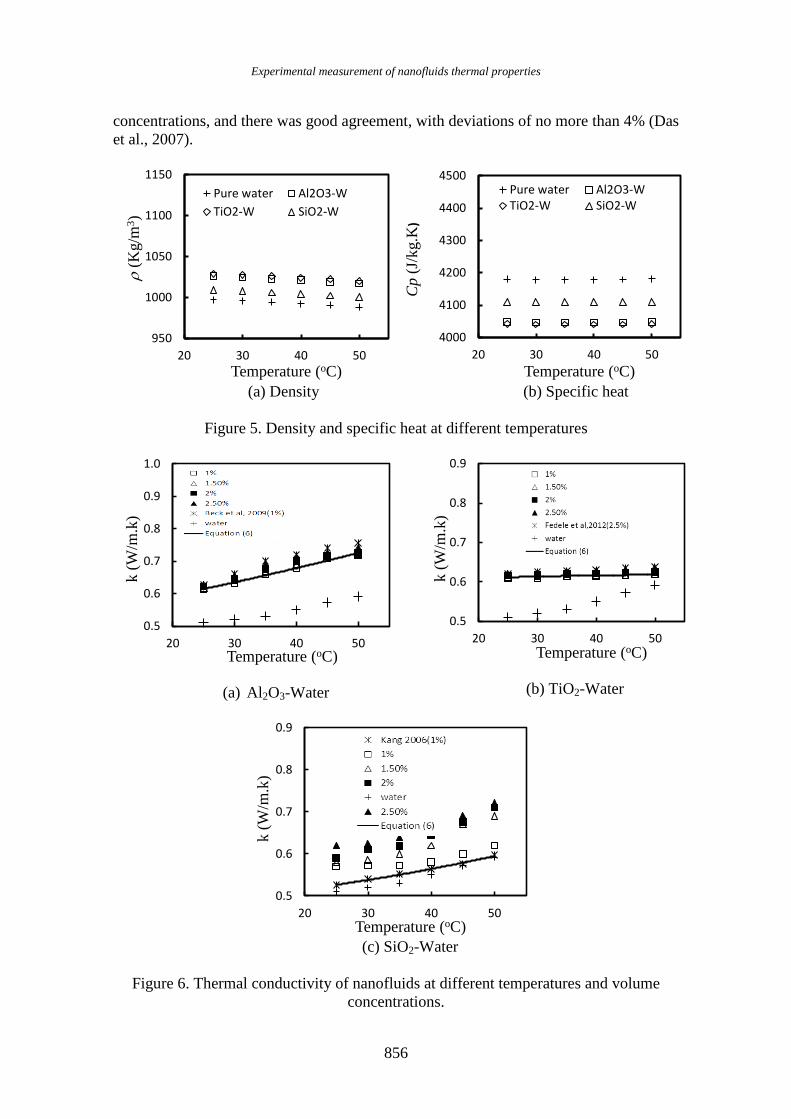
due to the increase in thermal conductivity (Pak and Cho, 1998). The thermal
conductivity of the (Alumina, Titania and Silica) nanofluids at various volume
concentrations and base fluids have been measured for range of temperatures from 25oC
to 50oC, and the experimental data are presented in Figure 6. This figure showed
significant enhancement in the thermal conductivity of the nanofluids with temperature
and volume concentration. The theoretical data of the thermal conductivity from Eq. (6)
has been drawn as a solid black line to validate the measured data. On the other side, the
experimental data of other researchers have been displayed with different volume
Experimental measurement of nanofluids thermal properties
856
concentrations, and there was good agreement, with deviations of no more than 4% (Das
et al., 2007).
(a) Density
(b) Specific heat
Figure 5. Density and specific heat at different temperatures
(a) Al2O3-Water
(b) TiO2-Water
(c) SiO2-Water
Figure 6. Thermal conductivity of nanofluids at different temperatures and volume
concentrations.
950
1000
1050
1100
1150
20 30 40 50
(
Kg/m
3)
Temperature (oC)
Pure water Al2O3-W
TiO2-W SiO2-W
4000
4100
4200
4300
4400
4500
20 30 40 50
Cp (
J/kg.K
)
Temperature (oC)
Pure water Al2O3-WTiO2-W SiO2-W
0.5
0.6
0.7
0.8
0.9
1.0
20 30 40 50
k (
W/m
.k)
Temperature (oC)
0.5
0.6
0.7
0.8
0.9
20 30 40 50
k (
W/m
.k)
Temperature (oC)
0.5
0.6
0.7
0.8
0.9
20 30 40 50
k (
W/m
.k)
Temperature (oC)
Hussein et al. /International Journal of Automotive and Mechanical Engineering 7(2013) 850-863
857
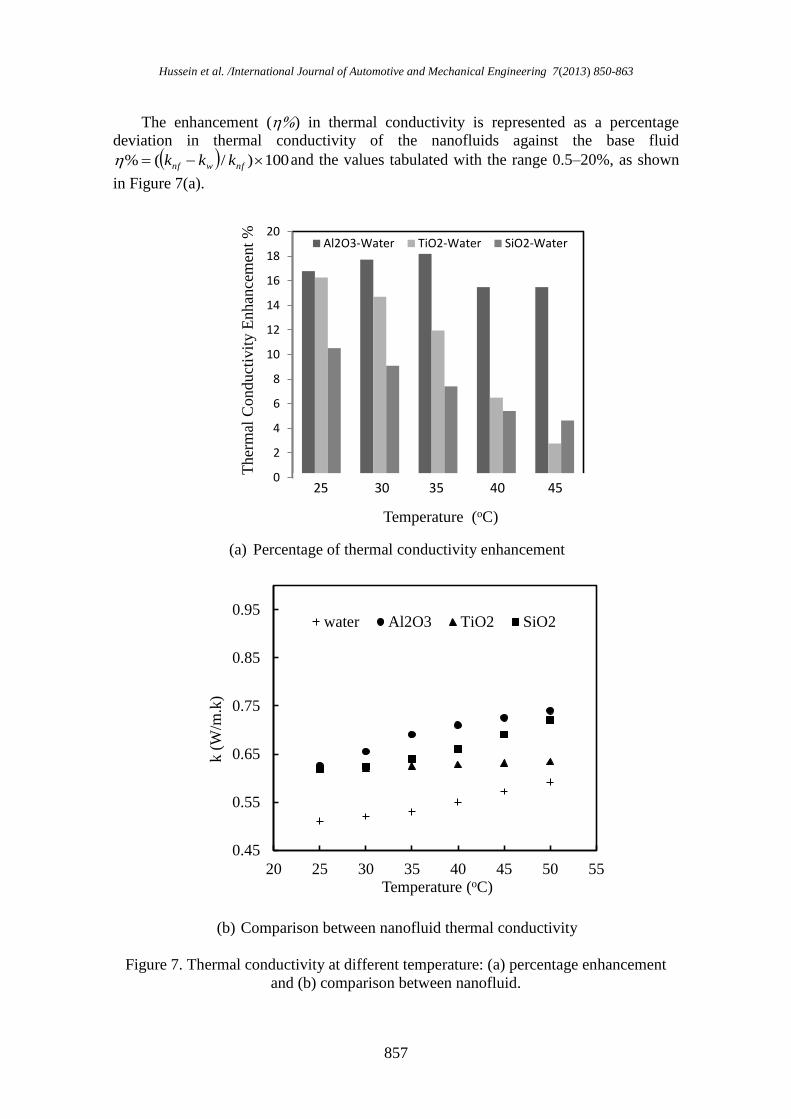
The enhancement () in thermal conductivity is represented as a percentage
deviation in thermal conductivity of the nanofluids against the base fluid
100)/(% nfwnf kkk and the values tabulated with the range 0.5–20%, as shown
in Figure 7(a).
(a) Percentage of thermal conductivity enhancement
(b) Comparison between nanofluid thermal conductivity
Figure 7. Thermal conductivity at different temperature: (a) percentage enhancement
and (b) comparison between nanofluid.
0
2
4
6
8
10
12
14
16
18
20
1 2 3 4 5
Ther
mal
Conduct
ivit
y E
nhan
cem
ent
%
Temperature (oC)
Al2O3-Water TiO2-Water SiO2-Water
0.45
0.55
0.65
0.75
0.85
0.95
20 25 30 35 40 45 50 55
k (
W/m
.k)
Temperature (oC)
water Al2O3 TiO2 SiO2
25 30 35 40 45
Experimental measurement of nanofluids thermal properties
858
Figure 7(b) presents the comparison between nanofluids thermal conductivity at
2.5% volume concentration which showed that the Al2O3 nanofluid has the highest
values of thermal conductivity, followed by SiO2, TiO2 and finally pure water has the
lowest thermal conductivity. Although TiO2 nanoparticles have a higher thermal
conductivity than SiO2 but the last one appeared higher values of thermal conductivity
at 2.5% volume concentration when added to water as a nanofluid due to the
enhancement of thermal conductivity with volume concentration for TiO2 nanofluid is
slightly than SiO2 nanofluid. Similarly nanofluids increase as water with the increase in
temperature.
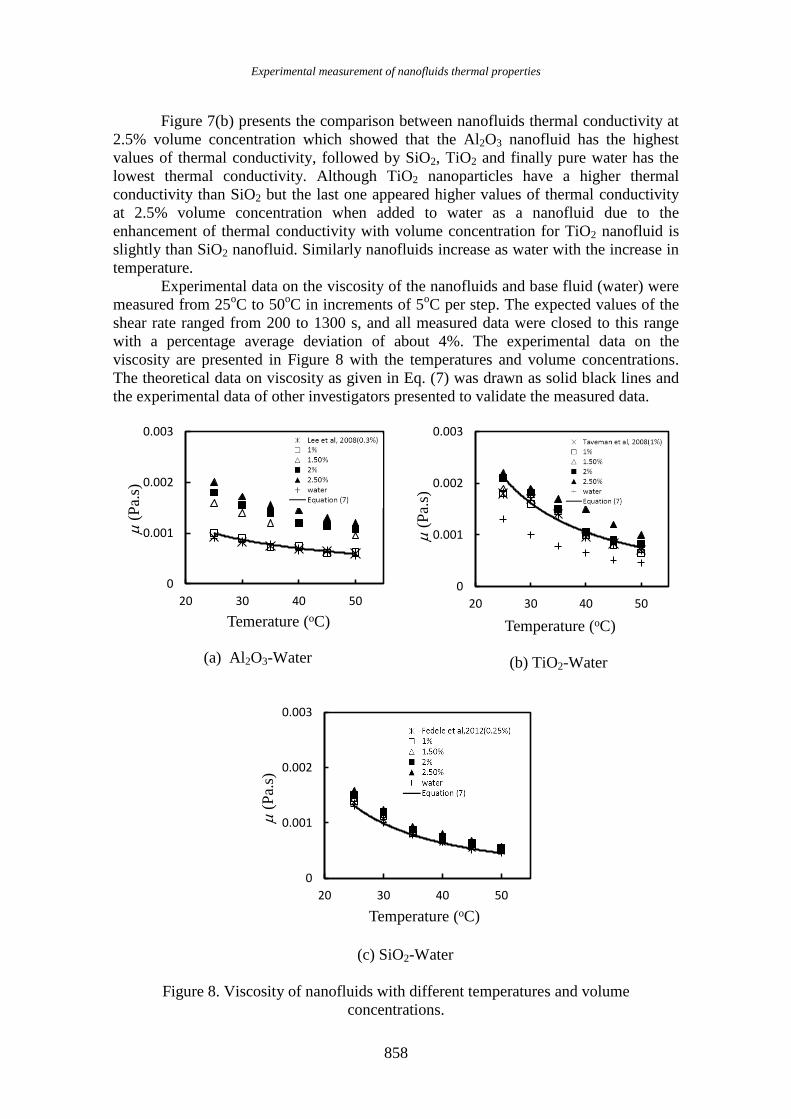
Experimental data on the viscosity of the nanofluids and base fluid (water) were
measured from 25oC to 50
oC in increments of 5
oC per step. The expected values of the
shear rate ranged from 200 to 1300 s, and all measured data were closed to this range
with a percentage average deviation of about 4%. The experimental data on the
viscosity are presented in Figure 8 with the temperatures and volume concentrations.
The theoretical data on viscosity as given in Eq. (7) was drawn as solid black lines and
the experimental data of other investigators presented to validate the measured data.
(a) Al2O3-Water
(b) TiO2-Water
(c) SiO2-Water
Figure 8. Viscosity of nanofluids with different temperatures and volume
concentrations.
0
0.001
0.002
0.003
20 30 40 50
(
Pa.
s)
Temerature (oC)
0
0.001
0.002
0.003
20 30 40 50
(
Pa.
s)
Temperature (oC)
0
0.001
0.002
0.003
20 30 40 50
(
Pa.
s)
Temperature (oC)
Hussein et al. /International Journal of Automotive and Mechanical Engineering 7(2013) 850-863
859
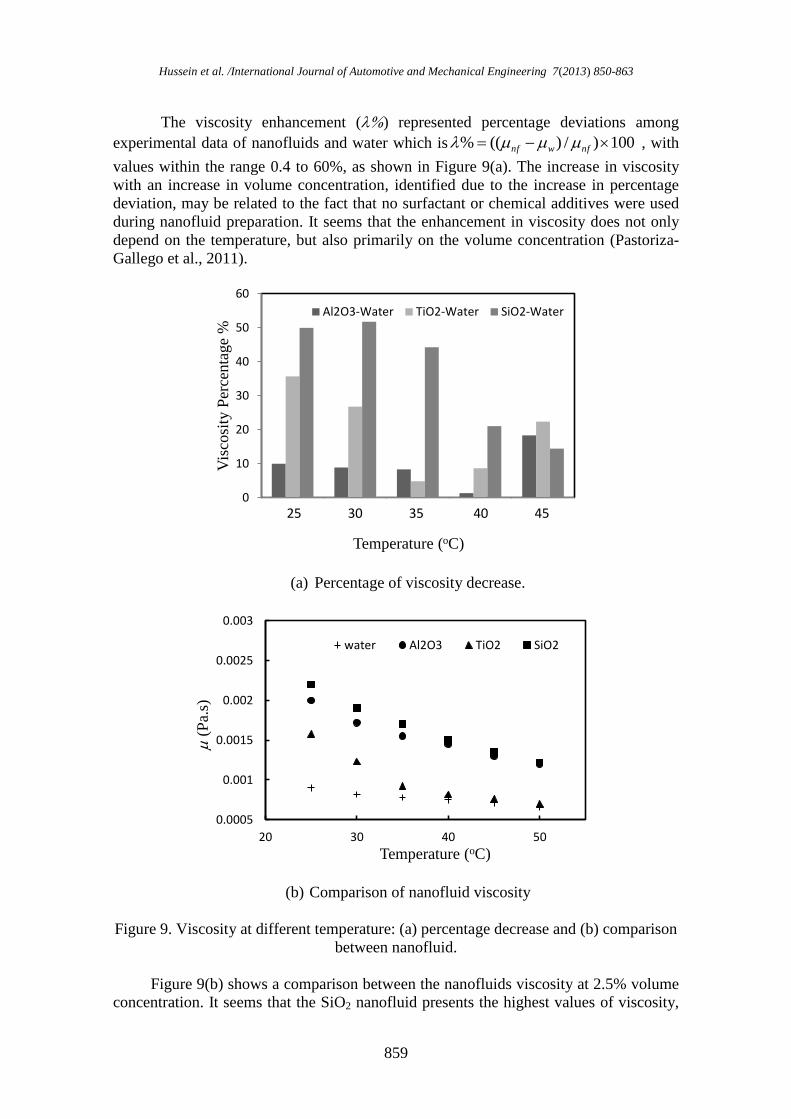
The viscosity enhancement () represented percentage deviations among
experimental data of nanofluids and water which is 100)/)((% nfwnf , with
values within the range 0.4 to 60%, as shown in Figure 9(a). The increase in viscosity
with an increase in volume concentration, identified due to the increase in percentage
deviation, may be related to the fact that no surfactant or chemical additives were used
during nanofluid preparation. It seems that the enhancement in viscosity does not only
depend on the temperature, but also primarily on the volume concentration (Pastoriza-
Gallego et al., 2011).
(a) Percentage of viscosity decrease.
(b) Comparison of nanofluid viscosity
Figure 9. Viscosity at different temperature: (a) percentage decrease and (b) comparison
between nanofluid.
Figure 9(b) shows a comparison between the nanofluids viscosity at 2.5% volume
concentration. It seems that the SiO2 nanofluid presents the highest values of viscosity,
0
10
20
30
40
50
60
1 2 3 4 5
Vis
cosi
ty P
erce
nta
ge
%
Temperature (oC)
Al2O3-Water TiO2-Water SiO2-Water
0.0005
0.001
0.0015
0.002
0.0025
0.003
20 30 40 50
(
Pa.
s)
Temperature (oC)
water Al2O3 TiO2 SiO2
25 30 35 40 45
Experimental measurement of nanofluids thermal properties
860
followed by Al2O3, TiO2 and finally pure water has the lowest viscosity. Also, the
nanofluids showed similar behaviour to water with a decrease in temperature. Compared
to other investigation of both thermal conductivity and viscosity, the results indicated
that there were differences between the measured data and correlations, the reasons for
which may be various parameters such as particle preparation, particle size,
measurement technique and even different the particle’s sources (Xie et al, 2011,
Zeinali Heris et al, 2007, Zhou and Ni, 2008).
CONCLUSIONS
In the present study, the Thermophysical properties of three types of nanoparticle
suspended in distilled water have been measured experimentally in a thermal laboratory.
The nanofluids were prepared in volume concentrations of 1, 1.5, 2.0 and 2.5 vol. %.
The density and specific heat capacity were calculated with Eqs. (3)–(4), which showed
that the Titania nanofluid has a higher density and lower specific heat than the other
nanofluids, and that water has a lower density and higher specific heat. The thermal
conductivity and viscosity was measured experimentally between 25oC and 55
oC, in
increments of 5oC per step. The results of the thermal conductivity showed an increase
in volume concentration and temperature due to an increase in the thermal conductivity
of the nanofluids, with deviations of 0.5–20% compared with the base fluid. The study
showed that the Al2O3 nanofluid has the highest value of thermal conductivity, followed
by SiO2, TiO2 and finally pure water has the lowest thermal conductivity. The viscosity
data measured showed that the viscosity of nanofluids significantly decreases with
increasing temperature, and increases with increasing particle volume concentration,
with a deviation of 0.5–60% compared with the base fluid. The measured data on
viscosity concluded that the SiO2 nanofluid has the highest value of viscosity, followed
by Al2O3, TiO2 and finally pure water has the lowest viscosity. Regarding both the
thermal conductivity and viscosity data, the results indicated that the measured data are
quite different from those obtained by other investigators, which may a result of various
parameters such as the particle preparation, particle size, measurement technique or
even the different particle sources. Finally, the proposed correlations for predicting the
thermal conductivity and viscosity of nanofluids showed good agreement with the
experimental results of Beck et al. (2009), Fedele et al. (2012) and Taveman et al.
(2008).
ACKNOWLEDGMENTS
The financial support to the authors by the University Malaysia Pahang is gratefully
acknowledged.
NOMENCLATURE
A - area [m2]
C - specific heat capacity [W/ kg.oC ]
D - diameter [m]
E - energy [W]
f - friction factor
htc - convection heat transfer coefficient
- density [kg/m3]
- shear stress [N/m2]
- mass concentration
- volume concentration
Hussein et al. /International Journal of Automotive and Mechanical Engineering 7(2013) 850-863
861
[W/m2.oC]
k - thermal conductivity [W/m.oC]
Nu - Nusselt Number [htc .D/Keff]
P - Pressure [N/m2]
Pr - Prandtl Number [C./Keff]
Re - Reynolds Number [eff Deff u / Keff]
u - velocity [m/s]
-viscosity [N.s /m2]
Subscripts
f - liquid phases
p - solid particle
eff - effective
nf - nanofluid
REFERENCES
Ali, M. and Zeitoun, O. 2009. Nanofluids forced convection heat transfer inside circular
tubes. International Journal of Nanoparticles, 2: 164-172.
Bahiraei, M., Hosseinalipour, S. M., Zabihi, K. and Taheran, E. 2012. Using neural
network for determination of viscosity in water-TiO2 nanofluid. Advances in
Mechanical Engineering, 2012: 1687-8132
Beck, M. P., Yuan, Y., Warrier, P. and Teja, A. S. 2009. The effect of particle size on
the thermal conductivity of alumina nanofluids. Journal of Nanoparticle Research,
11: 1129-1136.
Bobbo, S., Fedele, L., Benetti, A., Colla, L., Fabrizio, M., Pagura, C. and Barison, S.
2012. Viscosity of water based SWCNH and TiO2 nanofluids. Experimental
Thermal and Fluid Science, 36: 65-71.
Choi, S. U. and Eastman, J. 1995. Enhancing thermal conductivity of fluids with
nanoparticles. Developments and Applications of Non-Newtonian Flows, FED
231/MD 66, ASME: 99-105.
Das, S.K., Choi, S.U., Yu, W. and Pradeep, T. 2007. Nanofluids: science and
technology, Wiley-Interscience Hoboken, NJ.
Das, S.K. 2008. Monitoring dopants by Raman scattering in an electrochemically top-
gated graphene transistor. Nature nanotechnology, 3.4: 210-215.
Duangthongsuk, W. and Wongwises, S. 2009. Heat transfer enhancement and pressure
drop characteristics of TiO2–water nanofluid in a double-tube counter flow heat
exchanger. International Journal of Heat and Mass Transfer, 52: 2059-2067.
Fedele, L., Colla, L. and Bobbo, S. 2012. Viscosity and thermal conductivity
measurements of water-based nanofluids containing titanium oxide nanoparticles.
International Journal of Refrigeration, 35: 1359-1366.
Gosselin, L. and da Silva, A. K. 2004. Combined “heat transfer and power dissipation”
optimization of nanofluid flows. Applied Physics Letters, 85: 4160-4162.
Han, W.S. and Rhi, S.H. 2011. Thermal characteristics of grooved heat pipe with hybrid
nanofluids. Thermal Science, 15, 195-206.
Ho, C., Liu, W., Chang, Y. and Lin, C. 2010. Natural convection heat transfer of
alumina-water nanofluid in vertical square enclosures: an experimental study.
International Journal of Thermal Sciences, 49: 1345-1353.
Krishna, S. R. and Sivashanmugam, P. 2010. CFD analysis of heat transfer
characteristics of nanofluids in a circular tube fitted with helical inserts in laminar
flow. The IUP Journal of Chemical Engineering, 2: 19-34.
Lee, J. and Mudawar, I. 2007. Assessment of the effectiveness of nanofluids for single-
phase and two-phase heat transfer in micro-channels. International Journal of Heat
and Mass Transfer, 50: 452-463.
Experimental measurement of nanofluids thermal properties
862
Lee, S., Choi, S. U., Li, S. and Eastman, J. 1999. Measuring thermal conductivity of
fluids containing oxide nanoparticles. Journal of Heat transfer, 121: 280-289.
Li, Q., Xuan, Y. and Wang, J. 2003. Investigation on convective heat transfer and flow
features of nanofluids. Journal of Heat Transfer, 125: 151-155.
Mahendran, M., Lee, G.C., Sharma, K.V. and Shahrani, A. 2012. Performance of
evacuated tube solar collector using water-based titanium oxide (TiO2)
nanofluid. Journal of Mechanical Engineering and Sciences, 3: 301-310.
Murshed, S., Leong, K. and Yang, C. 2006. Thermal conductivity of nanoparticle
suspensions (nanofluids). In: 2006 IEEE Conference on Emerging Technologies-
Nanoelectronics, pp. 155-158.
Namburu, P., Kulkarni, D., Dandekar, A. and Das, D. 2007. Experimental investigation
of viscosity and specific heat of silicon dioxide nanofluids. IET Micro and Nano
Letters, 2: 67-71.
Pak, B. C. and Cho, Y. I. 1998. Hydrodynamic and heat transfer study of dispersed
fluids with submicron metallic oxide particles. Experimental Heat Transfer: An
International Journal, 11: 151-170.
Pantzali, M., Kanaris, A., Antoniadis, K., Mouza, A. and Paras, S. 2009. Effect of
nanofluids on the performance of a miniature plate heat exchanger with modulated
surface. International Journal of Heat and Fluid Flow, 30: 691-699.
Pastoriza-Gallego, M. J., Lugo, L., Legido, J. L. and Piñeiro, M. M. 2011. Thermal
conductivity and viscosity measurements of ethylene glycol-based Al2O3
nanofluids. Nanoscale Research Letters, 6: 1-11.
Peñas, J. R. V., Zarate, J. M. and Khayet, M. 2008. Measurements of the thermal
conductivity of nanofluids by the multicurrent hot-wire method. Journal of
Applied Physics, 104: 044314-8.
Sen Gupta, S., Manoj Siva, V., Krishnan, S., Sreeprasad, T., Singh, P. K., Pradeep, T.
and Das, S. K. 2011. Thermal conductivity enhancement of nanofluids containing
graphene nanosheets. Journal of Applied Physics, 110: 084302-084306.
Sharma K.V., Sarma P.K., Azmi W.H., Mamat R., Kadirgama K. 2010. Correlations to
Predict Friction and Forced Convection Heat Transfer Coefficients of Water
Based Nanofluids for Turbulent Flow in a Tube, IJMNTFTP, 3: 1-25.
Srinivasa Rao, G., Sharma, KV., Chary, S.P., Bakar, R.A., Rahman, M.M., Kadirgama,
K. and Noor, M.M. 2011. Experimental study on heat transfer coefficient and
friction factor of Al2O3 nanofluid in a packed bed column. Journal of
Mechanical Engineering and Sciences, 1: 1-15.
Syam Sundar, L. and Sharma, K.V. 2011a. A numerical study heat transfer and friction
factor of Al2O3 nanofluid. Journal of Mechanical Engineering and Sciences, 1:
99-112.
Syam Sundar, L. and Sharma, K.V. 2011b. Laminar convective heat transfer and
friction factor of Al2O3 nanofluid in circular tube fitted with twisted tape
inserts. International Journal of Automotive and Mechanical Engineering, 3:
265-278.
Taveman I., Turgut A., Chirtoc M., Schuchmann H.P., Tavman S. 2008. Experimental
investigation of viscosity and thermal conductivity of suspensions containing
nanosized ceramic particles. Archives of Materials Science and Engineering, 34:
99-104.
Touloukian, Y.S., Cho Y.H. 1970. Thermal expansion Metallic elements and
alloys." Thermophysical properties of matter-The TPRC Data Series, New York.
Hussein et al. /International Journal of Automotive and Mechanical Engineering 7(2013) 850-863
863
Trisaksri, V. and Wongwises, S. 2007. Critical review of heat transfer characteristics of
nanofluids. Renewable and Sustainable Energy Reviews, 11: 512-523.
Wang, X., Xu, X. and S. Choi, S. U. 1999. Thermal conductivity of nanoparticle-fluid
mixture. Journal of Thermophysics and Heat Transfer, 13: 474-480.
Wen, D. and Ding, Y. 2004. Effective thermal conductivity of aqueous suspensions of
carbon nanotubes (carbon nanotube nanofluids). Journal of Thermophysics and
Heat Transfer, 18: 481-485.
Williams, W., Buongiorno, J. and Hu, L.W. 2008. Experimental investigation of
turbulent convective heat transfer and pressure loss of alumina/water and
zirconia/water nanoparticle colloids (nanofluids) in horizontal tubes. Journal of
Heat Transfer, 130: 040301.1-044503.4.
Xie, H., Yu, W., Li, Y. and Chen, L. 2011. Discussion on the thermal conductivity
enhancement of nanofluids. Nanoscale Research Letters, 6: 1-24.
Zeinali Heris, S., Esfahany, M. and Etemad, S. G. 2007. Experimental investigation of
convective heat transfer of Al2O3/water nanofluid in circular tube. International
Journal of Heat and Fluid Flow, 28: 203-210.
Zhou, S.Q. and Ni, R. 2008. Enhanced thermal conductivity of TiO2—water based
nanofluids. Applied Physics Letters, 92: 093123-3.