a taxonomic investigation into the red alga plocamium
TRANSCRIPT

1
A Taxonomic Investigation into the Red Alga
Plocamium within New Zealand
BY
MADELINE WYNN COOPER
A thesis submitted to Victoria University of Wellington in partial fulfillment for the
requirements for the degree of Master of Science in Marine Biology
Victoria University of Wellington
2017

2
Abstract
The red alga Plocamium is a cosmopolitan genus, known for its distinct branching pattern and
rich chemical composition. Recent studies indicate morphological-based species delimitation
approaches have failed to accurately discern diversity, distributions, and evolutionary relationship
between species worldwide. Currently there are seven recognized species within New Zealand based
on traditional morphological approaches and no molecular based work focused on discerning true
diversity of New Zealand species in this genus. This thesis is the first to use molecular-assisted alpha
taxonomy to investigate Plocamium within New Zealand. Phylogenetic analyses (Maximum
Likelihood and Bayesian Inference) based on COI, rbcL, LSU and combined LSU/COI markers, three
molecular species delimitation methods (Automatic Barcode Gap Discovery, General Mixed Yule
Coalescent, and Bayesian implementation of the Poisson Tree Processes), and morphometric analyses
of various characters (width of main axis (WMA), width of lowest basal ramuli (WLBR), length of
lowest basal ramuli (LLBR), number of alternating series of ramuli (NASR), average number of
ramuli per alternating series (ANRAS), curvature of basal ramuli (CBR) and serrations present or
absent from basal ramuli (SERBR) were used to address this topic. The species delimitation methods
revealed at least eleven (A-K) putative genetic species (with some incongruences) within the New
Zealand specimens included in the study. Morphometric analyses indicated morphology reflects
genetic diversity when multiple measures of multiple characters are used, however this is not the case
when considering single characters. Phylogenetic analyses revealed possible monophyly of New
Zealand candidate species C-K, and possible relationships to Australian, Chilean, and Taiwanese
species. However these backbone relationships were poorly supported. The results of this study
indicate that Plocamium diversity within New Zealand has been underestimated and provide the first
steps in discovering the true species diversity of Plocamium within New Zealand.
3
Acknowledgments
I would like to express my heartfelt thanks to my supervisor Joe Zuccarello, for the
opportunities you have afforded me. Your continual support, patience, teaching, and encouragement
have always kept me going. I am grateful that I have been able to learn from you not only whilst
completing my undergraduate degree, but during my postgraduate learning as well.
The Joe Z lab group, Maren, Sergio, and Christian, I want to thank you all for all your
patience, help and contributions to this thesis. You all helped with collections, brainstorming how to
get PCRs working, helped me with file formats and computer coding, for that and more, I am grateful.
I am also grateful for the encouragement and support you have all provided me.
I would also like to thank Leon Perrie and the Museum of New Zealand Te Papa Tongarewa,
for my scholarship. It was a huge help for my study and life at Victoria University of Wellington. The
NIWA phycology group, Roberta, Wendy, Kate and Judy, thank you for your thoughtful contributions
and all your help and encouragement along the way, I am so fortunate I was able to learn from you all.
To my friends and O’hana who have helped me and supported me throughout, you know who
you are and thank you. Eddie and Juanita, you have been my rocks since day one. Thank you for all
you both have done. Dan you can come too.
4
Table of Contents
Abstract .................................................................................................................................... 2
Acknowledgements ................................................................................................................. 3
1. General Introduction .......................................................................................................... 6 1.1 Biodiversity.................................................................................................................................. 6
1.1.1 Biodiversity Importance ........................................................................................................ 6
1.1.2 New Zealand Biodiversity ..................................................................................................... 6
1.1.3 Biodiversity of Marine Algae ................................................................................................ 7
1.2 Systematics .................................................................................................................................. 7
1.2.1 Morphological Species Concept and Morphometrics ........................................................... 8
1.2.2 Phylogenetics and Molecular Systematics ............................................................................ 9
1.2.3 Integrative and Molecular-Assisted Alpha Taxonomy........................................................ 11
1.3 Rhodophyta ............................................................................................................................... 12
1.3.1 Red Algae: A Brief Introduction to the Biology and Life History ...................................... 12
1.3.2 Red Algal Systematics: An Overview ................................................................................. 13
1.3.3 Importance of Red Algae .................................................................................................... 14
1.4 An Introduction to Plocamium ................................................................................................ 15
1.4.1 Biology and Life History of Plocamium ............................................................................. 15
1.4.2 History of Systematics of Plocamium ................................................................................. 16
1.4.3 Natural Products and Plocamium ........................................................................................ 16
1.4.4 Plocamium in New Zealand ................................................................................................ 18
2. A Taxonomic Investigation of the Red Alga Plocamium within New Zealand ............ 22 2.1 Abstract ..................................................................................................................................... 22
2.2 Introduction .............................................................................................................................. 23
2.3 Materials and Methods ............................................................................................................ 26
2.3.1 Study Area and Sample Collection ..................................................................................... 26
2.3.2 DNA Extraction, Amplification, and Sequencing ............................................................... 30
2.3.3 Multiple Sequence Alignments and Phylogenetic Analyses ............................................... 31
2.3.4 Species Delimitation ........................................................................................................... 32
2.3.5 Morphometric Analyses ...................................................................................................... 34
2.4 Results ........................................................................................................................................ 35
2.4.1 Phylogenetic Analyses and Species Delimitations .............................................................. 35
2.4.2 Morphometric Analyses ...................................................................................................... 39
2.4.3 Species Name Assignments ................................................................................................ 41
2.5 Discussion .................................................................................................................................. 46
2.5.1 Species Delimitation and Morphology ................................................................................ 46
2.5.2 Application of Species Names and What More Is Needed ................................................. 48
2.5.3 New Zealand Plocamium and Its Relationship With Species in Other Parts of the World . 50
2.5.4 Conclusion ........................................................................................................................... 51
3. General Discussion ............................................................................................................. 53 3.1 DNA Barcoding and MAAT .................................................................................................... 53
3.2 Resolving Taxonomic Relationships ....................................................................................... 54
3.3 Conclusion ................................................................................................................................. 57
References ............................................................................................................................... 56
Supplementary Information ................................................................................................. 64

5
Please note that the second chapter of this thesis was written as a
paper. Therefore there may be repetition found.

6
1. General Introduction:
1.1 Biodiversity
1.1.1 Biodiversity Importance
Ecosystem functioning depends upon both abiotic and biotic factors and/or processes.
Abiotic factors such as temporal and spatial environmental variation, contribute to
differences in productivity, species diversity and distribution (Loreau et al. 2001, Whittaker
et al. 2001). Biotic factors such as species diversity, function and interactions influence the
stability of ecosystems (Tilman et al. 1994, Tilman 1996, Tilman et al. 2014, Gamfeldt et al.
2015, Lefcheck et al. 2015, Perkins et al. 2015). Recent studies indicate higher biodiversity
levels are needed to sustain multi-functionality (Tilman et al. 2014, Lefcheck et al. 2015,
Perkins et al. 2015). Currently the world is experiencing its sixth major extinction event
(Chapin III et al. 2000) with a rapid decline of biodiversity globally (Worm et al. 2006,
Schippers et al. 2015). Although it is known they are being ‘lost’, it is agreed that we are far
from knowing what and how many species inhabit the Earth (De Clerck et al. 2013).
Understanding what species are present and their taxonomy is the first step in addressing the
current ‘biodiversity crisis’ (Schlick-Steiner et al. 2010).
1.1.2 New Zealand Biodiversity
New Zealand’s long isolation and latitudinal range contributes to its unique terrestrial
and marine biota. New Zealand has the fourth largest exclusive economic zone (EEZ) that
spans across 30° of latitude, including the subtropical Kermadec Islands, temperate North and
South Islands, and the Subantarctic Islands (Hewitt et al. 2004, Zuccarello 2014). In the
Consensus of Marine Life (2000-2010), it was established that New Zealand not only has
notable terrestrial biodiversity but also high levels of species diversity within the (EEZ)
marine environment (Costello et al. 2010). New Zealand has 6,500 known endemic marine
7
species (Costello et al. 2010), however many species are yet to be described, with minimum
estimates of around 25% (Costello et al. 2010).
New Zealand has not been exempt from this world-wide decline in biodiversity
(Rawlence et al. 2015). Considered one of the most ‘conservation conscience’ countries in
the world (Hewitt et al. 2004), these unknown and/or undescribed species can prevent the
implementation of fully effective marine reserves, inhibit biosecurity measures and impede
understanding of New Zealand’s biological and evolutionary history (Hewitt et al. 2004). A
better understanding of these undescribed species and therefore of true species diversity is
needed to make knowledgeable decisions concerning New Zealand’s marine environment.
1.1.3 Biodiversity of Marine Algae
Marine algae are important ecologically and economically, and include both micro-
and macro-species (Norton et al. 1996, Seckbach and Chapman 2010, Narasimharao et al.
2012). Marine macroalgae include macroscopic and multicellular members of the green
(Chlorophyta), brown (Phaeophyceae), and red (Rhodophyta) algae, which were first divided
based on color by Lamouroux (1813) (Saunders and Hommersand 2004, Pedersen et al.
2013). New Zealand, with 996 recognized species (Nelson et al. 2013) is considered a ‘hot
spot’ of macroalgal diversity and endemism (Norton et al. 1996). Macroalgal diversity in
New Zealand is underestimated (Nelson et al. 2013). Understanding what species are present
is a first, but crucial step, before truly effective conservation strategies can be implemented,
further understanding of New Zealand’s evolutionary history can be had, and ecological
and/or economic benefits of these organisms fully understood.
1.2 Systematics
Systematics is the study of biological diversity, constituting three mains elements:
taxonomy, evolutionary relationships, and classification (McKelvey 1982). Alpha taxonomy
8
(delimiting organisms at the species level) is fundamental to biology (Schlick-Steiner et al.
2010). Studies of biodiversity rely heavily on correct taxonomy (Phillips 2001, Schlick-
Steiner et al. 2010). Although many would consider systematics and taxonomy uninteresting,
it is important to have correct species delimitations in order to implement effective
biodiversity conservation strategies, understand evolutionary relationships between
organisms, and understand biogeographic distributions of organisms (Dikow et al. 2009,
Schlick-Steiner et al. 2010, Hind et al. 2014). The era of modern systematics is credited to
Carl von Linné (1707 – 1778) (Manktelow 2010). Linnaeus (latinized name) was the father of
the current system of taxonomy, the recognized binary nomenclature, which places organisms
into various categories based on a hierarchical classification system; beginning with the most
inclusive category, kingdom, trickling down into the most basic specific unit of biology, the
species (Leliaert et al. 2014). Species represent the fundamental unit of biological
organization (Yeates et al. 2011), however the definition and criteria used to delineate species
is of great debate (Yeates et al. 2011, Leliaert et al. 2014).
1.2.1 Morphological Species Concept and Morphometrics
The identification of organisms based on their morphological characteristics has been
a major facet in biology since the origins of scientific taxonomy (McKelvey 1982, Zinetti et
al. 2013). Since Linnaeus, many researchers have named organisms that display similar
morphologies and/or other visible traits together into the same species category, a
classification concept known as morphological species concept (De Queiroz 2007).
In the beginning of the twentieth century, the field of taxonomy and systematics
experienced a “quantitative revolution” (Bookstein et al. 1985, Adams et al. 2004). This
meant the migration from non-statistic based species delimitation, towards using statistical
methodology to group species based on quantitative analyses of characters and shape. The

9
emerging statistical theories, such as the analysis of variance (Fisher 1935), correlation
coefficient (Pearson 1895), and principal components analysis (Pearson 1901, Hotelling
1933), allowed for morphological characteristics to be analyzed statistically in species
identification. Results from these stringent tests allow more weight to be given to species
classification (Adams et al. 2004). These advances in statistics and the conceptualization of
the need for quantitative science resulted in the modern field of morphometrics; the study and
analysis of “shape variation and its covariation with other variables” (Adams et al. 2004).
Morphometrics is principally used as a way to quantitatively analyze shape. It is often used
for species comparison and identification, including for taxonomic purposes (Neige 2006).
The morphological species concept delineates species based on variation in
morphology (Leliaert et al. 2014). Although morphological variation can be used to
accurately resolve species, in many cases attempting to describe and define species based
solely on their morphological character(s) has its drawbacks. Convergent morphological
evolution, phenotypic plasticity, the need for reproductive tissues that are not always present,
polymorphisms, few morphological characters, and morphological stasis all contribute to
problems associated with using solely morphology for algal taxonomy (Saunders 2005,
Cianciola et al. 2010, De Clerck et al. 2013, Zinetti et al. 2013).
1.2.2 Phylogenetics and Molecular Systematics
Phylogenetic systematics is an approach to systematics that differs from the
morphological species concept. The phylogenetic approach to systematics seeks to evaluate
and order diversity based on evolutionary relationships between organisms (Moritz et al.
1990, Hillis et al. 1996, Wiley and Lieberman 2011). Morphological, anatomical, chemical
and/or molecular data can all be used to produce phylogenies.
Character selection is a common issue when making species identifications based on

10
morphology alone. Characters selected for assessment should be accessible and
uncomplicated to study. These characters also must display variation that aptly reflects the
specific relationship(s). They need to be independent of environmental influence and
inherited from a shared common ancestor (homologous) (Lehmkuhl 2003). Although
morphological and anatomical characters were dominant in red algal taxonomy in the past, as
noted in the previous section species delimitation and identification based solely on
morphological characters is not without its pitfalls.
Prior to the use of molecular markers, chemotaxonomy was also used to assess
relationships between organisms based on their chemical compositions (carbohydrate,
enzymes, secondary metabolites). However, various factors may confound the validity of
species identifications based on chemotaxonomy (Cole and Sheath 1990, Mannheimer 1999).
Different environmental factors and pressures (i.e. mineral deficiencies, grazing pressure,
biofouling) have been attributed to observed variation of levels of chemical compounds in
genetically identical individuals (Mannheimer 1999, Wright et al. 2000, Wright et al. 2004,
Pelletreau and Targett 2008).
Molecular data has allowed an increase in relative speed and accessibility of a large
number of taxonomically informative characters for phylogenetic comparison. Molecular
data is the data of choice in most phylogenetic studies. It consists of DNA sequences that are
homologous and variable (Moritz et al. 1990, Hillis et al. 1996). Issues such as subjectivity
and phenotypic plasticity which arise from morphological data, are not a concern with
sequence data. Random neutral molecular mutations (Kimura 1968) combined with effects of
selection, lead to evolution of molecular characters. If the sequence data presented are
composed of homologous genes, accurately aligned, and reliable (free from methodological
artifacts), use of molecular data should increase reliability of the resulting phylogenies
(Moritz et al. 1990, Hillis et al. 1996, Wiley and Lieberman 2011).

11
Since the advent of molecular techniques, DNA sequence data have become widely
used for species delimitations and inferring phylogenetic relationships. The phylogenetic
species concept delineates species based on monophyletic relationships (Leliaert et al. 2014).
DNA-based sequence delimitation is a particularly valuable tool for species identification in
algae, which often display simple morphologies and the need for reproductive tissue that is
not always available (Cianciola et al. 2010, Leliaert et al. 2014). One of the most popular
markers used in molecular analyses for red and brown alga is the mitochondria-encoded
cytochrome oxidase I gene (COI or cox1), (Hebert et al. 2003, Cianciola et al. 2010).
However, other genes such as the nuclear-encoded large subunit ribosomal RNA genes
(LSU), and the chloroplast-encoded RuBisCo (rbcL) are also popular and can be assessed
individually or conjointly to strengthen taxonomic interpretations (Maggs et al. 2007).
1.2.3 Integrative and Molecular-Assisted Alpha Taxonomy
“Their new idea that DNA barcoding can replace normal taxonomy for naming new
species and studying their relationships is worse than bad, it is destructive.” Will et al. (2005)
Opponents of singularly morphological or molecular-based taxonomy and systematics
adapted an integrative approach (Dayrat 2005, Will et al. 2005, Padial et al. 2010, Schlick-
Steiner et al. 2010, Yeates et al. 2011). This multi-dimensional taxonomy is driven by
numerous factors (Schlick-Steiner et al. 2010). One such driver is the failure of singularly
morphological methods to accurately represent diversity. Another is the increased robustness
of taxonomic considerations and increased knowledge of evolutionary history, when multiple
methods demonstrate congruence.
Molecular-assisted alpha taxonomy (MAAT) has become an effective method for
assessing biodiversity across a variety of organisms (Cianciola et al. 2010). MAAT takes
morphometric data and assesses if morphological characteristics cluster with the respective
molecular phylogenies. MAAT aims to answer two fundamental questions:

12
1. Will molecular data support proposed conspecifics, or will they represent different
entities?
2. Will molecular data support the morphological difference between interspecifics?
(Cianciola et al. 2010).
Until recently, this multi-disciplinary approach was not widely used in phycology.
However, the use of MAAT avoids some of the problems (mentioned in Section 1.2.1) of the
sole use of morphological species delimitation.
1.3 Rhodophyta
1.3.1 Red Algae: A Brief Introduction to the Biology and Life History
The phylum Rhodophyta is an ancient lineage that has evolved into a diverse range of
marine and freshwater algae with highly variable ultrastructures and morphologies (Yoon et
al. 2006, Maggs et al. 2007). Red algae consist of approximately 7,100 recognized species
(Guiry and Guiry 2016) that are inclusive of both uni- and multi-cellular taxa (Yoon et al.
2010, Guiry and Guiry 2016). Rhodophytes lack flagella and centrioles throughout their life
histories. Floridean starch found in their cytoplasm acts as a carbohydrate storage products
(van den Hoek et al. 1996). Their chlorophyll a and carotenoids are masked by an array of
phycobiliproteins (principally phycoerythrin and phycocyanin) that contribute to the varieties
of red or purplish hues most members exhibit (Yoon et al. 2006, Seckbach and Chapman
2010). Their plastids have unstacked thylakoids, and lack a chloroplast encircling
endoplasmic reticulum (Cole and Sheath 1990).
The majority of Rhodophyta have a complex triphasic life cycle: two diploid
sporophyte phases (tetrasporophyte and carposporophyte) and a haploid gametophyte phase
(Searles 1980, Yoon et al. 2010). This triphasic life history is thought to be a compensatory
evolutionary trait linked to lack of flagellated gametes within the red algae (Searles 1980).
13
The tetrasporophyte bares specialized structures (tetrasporangia), where meiotic division
occurs and results in haploid tetraspores (van den Hoek et al. 1996). These haploid
tetraspores are then released, becoming haploid male, female or bisexual gametophytes (van
den Hoek et al. 1996). The male gametophyte produces spermatangial branches that bare
spermatangia where spermatia are formed, released and passively transported to the female
gametophyte. Syngamy occurs when the non-motile spermatium attaches to the trichogyne
(extension of the egg, carpogonium), fuses and the spermatial nucleus fuses with the
carpogonial nucleus. The carpogonium is borne on a branch system of the female
gametophyte. The diploid zygote then matures into a carposporophyte, while still attached to
the female, which mitotically produces diploid carpospores. These carpospores when
released, becoming free-living tetrasporophytes (Saunders and Hommersand 2004).
1.3.2 Red Algal Systematics: An Overview
Linnaeus (1753) was the first to classify algae into the Cryptogamia, inclusive of
fungi, ferns and mosses, a group based on lack of seed-like reproduction. In the following
years, unlike Linnaeus who did not assign a taxonomic level to the algae, Gleditsch (1764)
placed algae in the Algacea (Algaceae) as a class of plants. Justifications for these early
classifications where singularly morphological (Moestrup 2001). It was Lamouroux (1813)
who was first to distinguish algae not only on morphological characters but based on
pigmentation, segregating certain red algae into the Floridées. However, Harvey (1836)
redefined these divisions: Chlorospermae (green algae), Diatomaceae (diatoms and desmids),
Melanospermae (brown algae), and Rhodospermae (red algae) (Moestrup 2001, Saunders and
Hommersand 2004).
Lamouroux (1813), C. Agardh (1817, 1824), Harvey (1836), Kützing (1843) and J.
Agardh (1842, 1876) made innovative classifications based on pigmentation, vegetative

14
anatomy, and macroscopic reproductive structures. Red algae were traditionally divided into
two classes the Bangiophyceae and the Floridiophyceae (the Bangiophyceae are out of the
scope of this thesis). The Floridiophyceae, inclusive of approximately 5,800 species, is the
most taxonomically diverse of the red algae (Yoon et al. 2010). However, the first
classification system of florideophycidean red algae reflective of taxa relationships came
from Bornet and Thuret’s (1867) detailed observations of syngamy patterns and Schmitz’s
(1883) characterization of carposporophyte development (Cole and Sheath 1990). With these
observations Schmitz (1892) divided red algae into four orders: Rhodymeniales,
Cryptonemiales, Nemaliales, and Gigartinales, based on gominoblast (diploid
carposoprophyte tissue) development and auxiliary cell presence, position or absence (Cole
and Sheath 1990, Lehmkuhl 2003).
Given that reproductive structures and morphologies were the main drivers of
taxonomic placement of red algae, implementation of molecular markers has allowed for
deeper understanding of their systematics (Cianciola et al. 2010, De Clerck et al. 2013). The
monophyly of Rhodophyta is strongly supported by multiple gene trees (Yoon et al. 2010).
Previously sorted into two classes Bangiophyceae (six orders: Bangiales, Compsopogonales,
Cyanidiales, Erythropeltidales, Porphyridiales, and Rhodochaetales) and Florideophyceae
(Gabrielson et al. 1985, Freshwater et al. 1994, Saunders and Hommersand 2004) based
solely on morphological observation (Yoon et al. 2010), molecular studies have shown
monophyly of the Florideophyceae (Oliveira and Bhattacharya 2000, Yoon et al. 2002, Yoon
et al. 2010).
1.3.3 Importance of Red Algae
Rhodophytes are distributed from the Antarctic to the Arctic, and inhabit from the
upper-littoral zone to the fringes of the photic zone (van den Hoek et al. 1996, Lopez-

15
Bautista 2010). In marine ecosystems, red algae provide a source of oxygen for the
environment, heterotrophic species with a food source, a settlement target for epiphytic
species, and shelter, nesting and egg release sites for numerous species (Gurgel and Lopez‐
Bautista 2007). Crustose and calcareous red algae provide structural integrity, settlement
stratum, protection from wave impact crucial for various (coral, algal, etc.) reef habitats
(Marsh 1970, Björklund et al. 1995, Gurgel and Lopez‐Bautista 2007). Not only are the
Rhodophyta ecologically important, they also play a role economically as well.
The Rhodophyta are considered to be of extreme economic value in some countries
and act as sources of polysaccharide-based biomaterials which are unable to be synthetically
produced due to their complexity (Seckbach and Chapman 2010, Francavilla et al. 2015).
The sulfated galactans, agar and carrageenan, within the walls of red algae are used to
produce various products such as agarose gels (Seckbach and Chapman 2010).
1.4 An Introduction to Plocamium
1.4.1 Biology and Life History of Plocamium
Plocamium Lamouroux (Lamouroux 1813) is a cosmopolitan genus consisting of 51
species (Guiry and Guiry 2016) that span from the Arctic to the Antarctic in intertidal and
subtidal waters (Wynne 2002b). Plocamium is characterized as having erect, bilaterally
compressed thalli with flat branched fronds that have margins bearing repeating alternating
series of two or more ramuli (Womersley 1971, Saunders and Lehmkuhl 2005). The lowest
ramulus in the series (basal ramuli) commonly remains unbranched, and its morphology
(margin, curvature and shape) is used as an identification character for some species
(Womersley 1971). The upper ramulus in the series, although it can remain dormant, most
frequently develops into a lateral branch. As in many Rhodophyta, their reproductive

16
structures can also be useful in species identification. Plocamium cystocarps lack an ostiole, a
pore for carpospore release, can be sessile or pedunculate, single or clustered, located in the
axils or along the abaxial or adaxial margins of the main thallus (Womersley 1971, South and
Adams 1979, Adams 1994, Saunders and Lehmkuhl 2005). Tetrasporangia position is highly
variable, located within the axils or along the abaxial or adaxial ramuli margins, and are
contained within specialized stichidia, which have the possibility of being seriate or biseriate
(Womersley 1971, Dixon and Irvine 1977, Saunders and Lehmkuhl 2005).
1.4.2 History of Systematics of Plocamium
Plocamium was originally assigned in the family Plocamieae (Kützing 1843).
However, based on observed development of the procarp/cystocarp (the female reproductive
branches that usually consist of carpognium, trichogyne, and sometimes auxillary cells),
Schmitz (1892) assigned Plocamium to the Rhodymeniaceae of the Rhodymeniales. Due to
the distinct differences in cystocarp development (presence of accessory auxiliary cells,
three-celled carpogonia branching, procarpial, and zonate tetrasporangia) it was placed in the
Sphaerococcaceae of the Sphaerococcales (Sjöstedt 1926). Plocamium was maintained
within the Sphaerococcaceae but moved it to the Nemastomales, an order inclusive of non-
accessorized auxiliary celled, non-procarpial algae (Kylin 1928). However, they were then
placed in the Gigartinales under the proposed family Plocamiaceae due to fundamental
differences in carpospores production (Kylin 1930). This nomenclature held until Saunders
and Kraft (1994) using SSU rRNA gene sequences proposed the order Plocamiales inclusive
of Plocamium and its adelphoparasite Plocamiocolax Setchell.
1.4.3 Natural Products and Plocamium
Natural products chemistry is the discovery, characterization and cataloging of
chemical substances found in nature (Maschek and Baker 2008). The term ‘natural product’

17
refers to a substance generated by a living organism, and can be used synonymously with
‘secondary metabolites’ (Maschek and Baker 2008). Classification of secondary metabolites
is dependent upon their biosynthetic origins. These secondary compounds are numerous and
serve various functions. Terpenes, alkaloids, and shikimates are amongst the natural products
produced by algae and can serve as anti-herbivore defenses and ultraviolet radiation barriers
(Maschek and Baker 2008). Macroalgae account for ~20% (nearly 3,000 natural products) of
all known chemistry within the marine environment (Maschek and Baker 2008).
Plocamium has had much interest from numerous fields due to its high content of
secondary compounds (Wynne 2002b, Paradas et al. 2015). Plocamium produces acyclic and
cyclic halogenated monoterpenes (San-Martín and Rovirosa 1986, Afolayan et al. 2009,
Timmers et al. 2012, Young et al. 2013, Paradas et al. 2015). Within P. cartilagineum there
have been over 50 unique secondary metabolites identified, ~95% of which are
polyhalogenated monoterpenes, and have pharmalogical properties (Kladi et al. 2004, Young
et al. 2013).
This rich chemistry may provide another possible way to identify cryptic species
(Young et al. 2013). A taxonomic investigation of Plocamium species in Japan, revealed
intracellular acidity could be a taxonomically informative physiological property (Yano et al.
2004). A study investigating the P. cartilagineum from the western Antarctic Peninsula
revealed COI and rbcL analyses differentiated the alga in to two phylogroups, however
chemical analyses divided each further into one of five chemogroups (Young et al. 2013).
The authors indicated there were no observable site-specific environmental factors to
influence this pattern, and suggested that the chemical diversity could be a signal of the
presence of cryptic species or that cryptic speciation is occurring. However other algal
species do show evidence of environmental dependence of internal chemistry (Naylor et al.

18
1983) and some believe that identification through chemistry may not allow for the resolution
of the taxonomy (San-Martín and Rovirosa 1986, Cole and Sheath 1990).
1.4.4 Plocamium in New Zealand
Currently there are seven reported species of Plocamium in New Zealand: Plocamium
angustum (J. Agardh), P. cartilagenium (L.) P.S. Dixon, P. cirrhosum (Turner) M.J. Wynne,
P. hamatum (J. Agardh), P. hookeri (Harvey), P. leptophyllum (Kützing), and P.
microcladioides (Womersley 1971, South and Adams 1979, Adams 1994, Wynne 2002a).
These species are distributed throughout New Zealand and range as far north as the
Kermedecs down to the Subantarctic islands (South and Adams 1979, Adams 1994, Nelson et
al. 2013).
These species descriptions are based on Hooker and Harvey (1895), Womersley
(1971), South and Adams (1979), Adams (1994) and Wynne (2002b).
Plocamium angustum
Physical Description: Thallus, with numerous erect, linear, slender axes developing from the
base, up to 25 cm high. Axes commonly 0.5 – 1 mm broad (in rare cases up to 1.5 mm), with
alternating pairs of ramuli. With 1 – 1.5 mm long, less than 0.5 mm wide, awl-shaped basal
ramuli. Abaxial margin of basal ramuli usually non-serrate, but occasionally has small spines
or serrations. Cystocarps 600-900 𝜇m in diameter, globular, flat to slightly varicose, sessile
on adaxial base of ramuli or on adjacent axis. In male plants, spermatangia cover the surface
of ramuli near the apices of the branch. Stichidia are basally branched and become tufts that
grow with age in the axils of the ramuli and extend along the adaxial margin. The area of the
stichidia that bears the sporangium is 60-100 𝜇m thick, unbranched, swollen, slender,
cylindrical, and slightly tapering with a slender stalk. The tetrasporangia are 50-70 𝜇m long
and 25-30 𝜇m wide.
New Zealand Distribution: Chathams, North Island, South Island, Stewart Island,
Subantarctic Islands
Type Locality: Australia
Type: Herb. Agardh LD, No. 28026

19
Plocamium cartilagineum
Physical Description: Thallus up to 20 cm, slender, and densely branched. Axes width ranges
between 1 – 1.5 mm. Ramuli alternating 3-4 per series is most common, however there are
instances of alternating pairs or as many as 10 ramuli per alternating series. All ramuli are
most commonly branched. The upper most ramuli and occasionally second ramuli develop
into long laterals. The lowest basal ramuli is most often 1 – 2 mm long, 0.25 mm or less
wide, non-serrate, sometimes curved but mostly linear to awl-shaped. In the female,
cystocarps are 0.5 – 0.75 mm in diameter, globular, smooth, sessile, located on the ramuli
margins or in or adjacent to the axils. Stichidia are simple and lanceolate with branching
upper ends, commonly lengths range from 0.25 – 0.4 mm but can be as short as 0.15 mm or
as long as 1mm, and widths average 0.1 mm. Tetrasporangia range from 40 – 50 𝜇m in length
and 27 – 32 𝜇m wide, are oval and arranged in two rows.
New Zealand Distribution: Chathams, North Island, South Island, Stewart Island,
Subantarctic Islands
Type Locality: Northern Europe
Type: L (910, 184 … 14)
Plocamium cirrhosum
Physical Description: Erect slender thallus reaching up to 30 cm high. Axes 1 – 2 mm wide
but can be found up to 2.5 mm, appearing ribbed in the mid and lower axes due to lightening
of color in the central area. Ramuli 1 – 2 mm long (can reach up to 3 mm) straight to slight
curled, with strong and even serrations on the curled abaxial margin. Lowest most basal
ramuli width is on average 0.5 mm at the base. Cystocarps are most commonly located along
the abaxial margin of the lowest basal ramuli but can also be within the axis and along the
adaxial edge ramuli. They are approximately 0.75 mm in diameter, sessile, globular, and
slightly raised when dry. Axils of upper ramuli bare spermatangia that are densely branched.
Stichidia in clusters in the axils, along the abaxial margin of the upper ramuli or along the
adaxial margin of the lowest basal ramuli, approximately 1.25 mm high and dense in mostly
uniform branches that are about 100 𝜇m in diameter. The apices of the stichidial branches
bare dense tetrasporangia, which on average can be 50 – 65 𝜇m long and 35 – 45 𝜇m in
width.
New Zealand Distribution: Chathams, North Island, South Island
Type Locality: Dusky Sound, Fiordland Region, New Zealand
Type: BM 44253
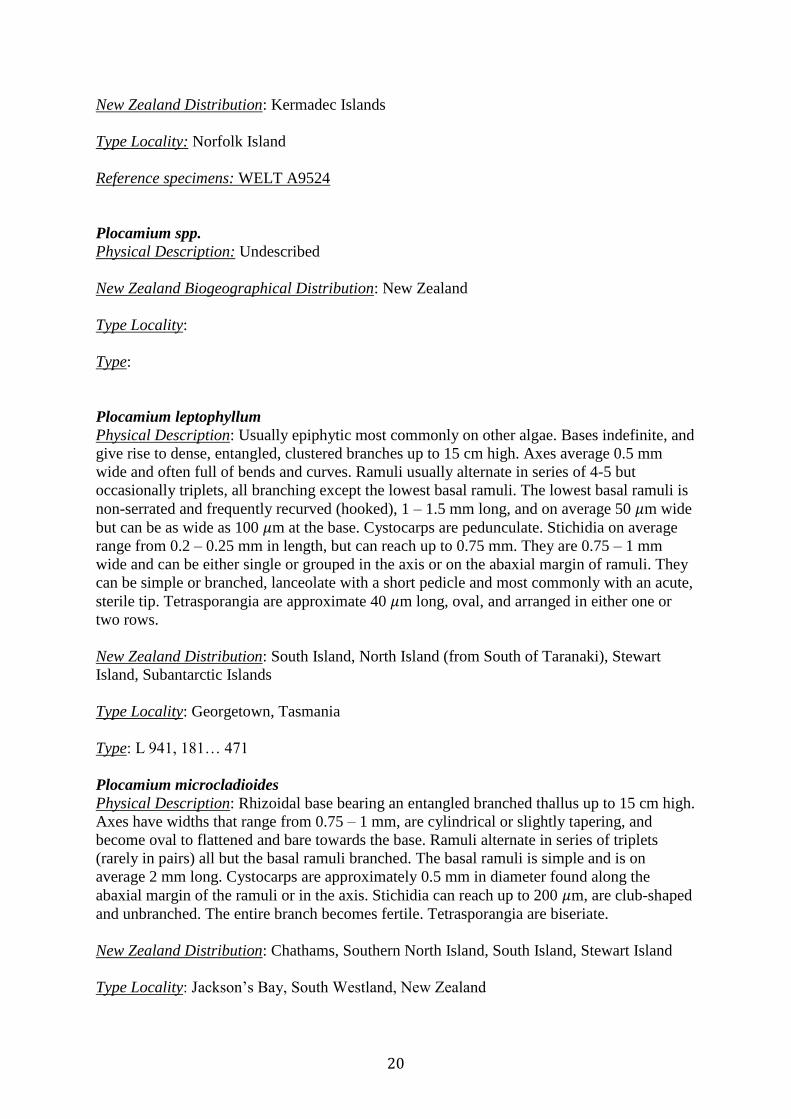
Plocamium hamatum
Physical Description: Thallus bright rose pink, softly textured, up to 15 cm high, highly
branched with axes up to 1.5 mm wide. Ramuli alternate in series of 3, with a non-serrate and
commonly strongly recurved lowest basal ramuli. Cystocarps are sessile and globular located
along the margins. Male plants are non-identified. Stichidia are pedunculate along the
margins and often curled.
20
New Zealand Distribution: Kermadec Islands
Type Locality: Norfolk Island
Reference specimens: WELT A9524
Plocamium spp.
Physical Description: Undescribed
New Zealand Biogeographical Distribution: New Zealand
Type Locality:
Type:
Plocamium leptophyllum
Physical Description: Usually epiphytic most commonly on other algae. Bases indefinite, and
give rise to dense, entangled, clustered branches up to 15 cm high. Axes average 0.5 mm
wide and often full of bends and curves. Ramuli usually alternate in series of 4-5 but
occasionally triplets, all branching except the lowest basal ramuli. The lowest basal ramuli is
non-serrated and frequently recurved (hooked), 1 – 1.5 mm long, and on average 50 𝜇m wide
but can be as wide as 100 𝜇m at the base. Cystocarps are pedunculate. Stichidia on average
range from 0.2 – 0.25 mm in length, but can reach up to 0.75 mm. They are 0.75 – 1 mm
wide and can be either single or grouped in the axis or on the abaxial margin of ramuli. They
can be simple or branched, lanceolate with a short pedicle and most commonly with an acute,
sterile tip. Tetrasporangia are approximate 40 𝜇m long, oval, and arranged in either one or
two rows.
New Zealand Distribution: South Island, North Island (from South of Taranaki), Stewart
Island, Subantarctic Islands
Type Locality: Georgetown, Tasmania
Type: L 941, 181… 471
Plocamium microcladioides
Physical Description: Rhizoidal base bearing an entangled branched thallus up to 15 cm high.
Axes have widths that range from 0.75 – 1 mm, are cylindrical or slightly tapering, and
become oval to flattened and bare towards the base. Ramuli alternate in series of triplets
(rarely in pairs) all but the basal ramuli branched. The basal ramuli is simple and is on
average 2 mm long. Cystocarps are approximately 0.5 mm in diameter found along the
abaxial margin of the ramuli or in the axis. Stichidia can reach up to 200 𝜇m, are club-shaped
and unbranched. The entire branch becomes fertile. Tetrasporangia are biseriate.
New Zealand Distribution: Chathams, Southern North Island, South Island, Stewart Island
Type Locality: Jackson’s Bay, South Westland, New Zealand

21
Type: WELT A3627
However, it is believed that this diversity is underestimated (Womersley 1971, South
and Adams 1979, Nelson et al. 2013), and species may be misidentified based on superficial
likeness to Northern hemisphere algae (Womersley 1971, Yano et al. 2004). Studies in other
parts of the world have uncovered cryptic diversity within Plocamium (Saunders and
Lehmkuhl 2005). Of particular interest is P. cartilagineum, which was thought to be
cosmopolitan but consists of four distinct groups (Saunders and Lehmkuhl 2005). With its
type locality being Northern Europe, it seems logical to question if this could be the same
species in New Zealand. Nelson (2013) notes in her description of Plocamium “it is clear that
further work is required to understand both diversity here and the correct names to apply to
species.”
Given that the taxonomy of Plocamium within New Zealand has been questioned yet
not thoroughly investigated, it would be beneficial to investigate this alga. This will allow for
a more complete picture of the genus within New Zealand and the relationship they have with
other regions of the world.

22
2. Research Chapter:
2.1 Abstract:
Traditional morphological-based studies of macroalgal diversity have had difficulty
accurately discerning species, and consequently their distributions, and evolutionary
relationships. Molecular methods in species delimitation have aided in their taxonomy.
Molecular-assisted alpha taxonomy is an integrative approach that can be useful in
circumstances where morphology is not adequate to accurately delimit species.
Morphological studies of the red alga Plocamium (Plocamiales, Rhodophyta) have failed to
accurately discern diversity of species. Given that there has never been a multi-
methodological study on Plocamium species within New Zealand, there is uncertainty about
the validity of its presently described species. This study is the first to use molecular-assisted
alpha taxonomy to investigate these uncertainties. New Zealand specimens were analyzed
using partial COI, rbcL, LSU rRNA, and combined sequences to determine putative species
and evolutionary relationships. Maximum likelihood and Bayesian phylogenies were
constructed, three species delimitation methods (ABGD, GMYC and bPTP) were conducted
using the COI data set, and morphological characters analyzed (width of main axis, width of
lowest basal ramuli, length of lowest basal ramuli, number of alternating series of ramuli,
average number of ramuli per alternating series, curvature of basal ramuli and serrations
present or absent from basal ramuli) and compared. Eleven candidate genetic species groups
were delimited. Morphometric analyses indicated morphology reflects species diversity when
multiple measurements of multiple characters are used. Phylogenetic analyses revealed
possible monophyly of candidate species C-K in New Zealand, and possibly close
relationships to species found in Australia, Chile, and Taiwan. However these relationships
were poorly supported. The results of this study indicate that Plocamium diversity within
23
New Zealand has been underestimated. This study provides the first steps in discovering the
true species diversity of Plocamium within New Zealand.
Key Words: Plocamium, molecular-assisted alpha taxonomy, New Zealand, species
delimitation, COI, LSU rRNA, rbcL, phylogenetics, Plocamiales, integrative taxonomy
2.2 Introduction:
Traditionally, macroalgal systematics has relied on morphological studies and
investigations to delimit species. Convergent morphological evolution, phenotypic plasticity,
the need for reproductive tissues that are not always present, polymorphisms, few
morphological characters, and morphological stasis all have the potential to contribute to
problems associated with solely using morphology for algal taxonomy (Saunders 2005,
Cianciola et al. 2010, De Clerck et al. 2013, Zinetti et al. 2013, Leliaert et al. 2014).
Molecular data has allowed an increase in relative speed and accessibility of a large number
of taxonomically informative characters for phylogenetic comparison.
Molecular-assisted alpha taxonomy (MAAT) has become an effective method for
assessing biodiversity across a variety of organisms (Cianciola et al. 2010). MAAT takes
morphological data and assesses if morphological characteristics are congruent with
molecular phylogenies and assists in defining species. Current trends are towards these
integrative approaches to establish increasingly robust taxonomic hypotheses (Cianciola et al.
2010, Padial et al. 2010, Robuchon et al. 2015, Machín‐Sánchez et al. 2016).
The cosmopolitan genus Plocamium Lamouroux is a member of the Plocamiales
(Saunders and Kraft 1994), along with its adelphoparasite Plocamiocolax Setchell (Saunders
and Kraft 1994, Guiry and Guiry 2016). Plocamium is characterized as having erect,
bilaterally compressed thalli with flat branched fronds that have margins bearing repeating
alternating series of two or more ramuli (Womersley 1971, Saunders and Lehmkuhl 2005).

24
Their reproductive structures include ostiole-less cystocarps that can be located in specialized
fertile branches or along the margins of ramuli, and stichidia of varying morphologies that
bare tetrasporangia (Dixon and Irvine 1977). Although within Plocamium there are 108
species (and infraspecific) names lodged within AlgaeBase, only 51 species are currently
accepted taxonomically (Guiry and Guiry 2016). Morphological and anatomical vegetative
characters, morphology of the reproductive structures, and biogeography are characters used
to aid in identifying Plocamium species (Wynne 2002b, Saunders and Lehmkuhl 2005,
Cremades et al. 2011). Traditionally, most Plocamium are differentiated into species based
on the color and consistency of the thallus, number of ramuli in an alternating series, the
length, width and morphology of the lowest basal ramuli within an alternating series,
morphology of the stichidia, and arrangement of cystocarps (Simons 1964, Womersley 1971,
South and Adams 1979, Gabrielson et al. 1985, Adams 1994, Wynne 2002b, Saunders and
Lehmkuhl 2005, Cremades et al. 2011). Studies have shown that Plocamium exhibits not
only interspecific but also significant intraspecific morphological variation, making species
identification and delimitations based solely on morphological characters difficult (Saunders
and Kraft 1994, Fredericq et al. 1996, Goff et al. 1996, Yano et al. 2004, Saunders and
Lehmkuhl 2005, Cremades et al. 2011).
Molecular data have become increasingly used in conjunction with morphological and
anatomical characters to overcome complications in species delimitations and identifications
within Plocamium. Numerous molecular markers, including the mitochondria-encoded
cytochrome oxidase I gene (COI or cox1) (Cremades et al. 2011, Young et al. 2013), the
nuclear-encoded large subunit ribosomal RNA genes (LSU)(Saunders and Lehmkuhl 2005),
and the plastid-encoded large subunit of RuBisCo (rbcL) (Fredericq et al. 1996, Yano et al.
2004), have been used to identify specimens, describe new species, and elucidate
interspecific relationships in Plocamium. DNA barcoding and molecular analyses have been

25
demonstrated to be helpful taxonomic tools within Plocamium, validating some species
identifications based on morphological characters (Yano et al. 2004) and revealing cryptic
species in others (Saunders and Lehmkuhl 2005, Cremades et al. 2011).
Plocamium is one of the most common and distinct red alga found throughout New
Zealand (South and Adams 1979). Although most abundant in the subtidal zone, Plocamium
can also dominate communities in the mid- to lower littoral intertidal zones. Currently there
are seven species reported in New Zealand, based on morphology: Plocamium angustum (J.
Agardh), P. cartilagenium (L.) P.S. Dixon, P. cirrhosum (Turner) M.J. Wynne, P. hamatum
(J. Agardh), P. hookeri (Harvey), P. leptophyllum (Kützing), and P. microcladioides (G.R.
South & N.M. Adams). A previous taxonomic study on Plocamium within New Zealand
based solely on morphological data, revealed a new species (P. microcladioides) (South and
Adams 1979) and indicated uncertainty about identification of others based on overlapping
morphological features, which is supported by other authors (South and Adams 1979, Adams
1994, Nelson 2013).
This study focuses on elucidating the taxonomy of Plocamium from New Zealand.
Given that there has never been a multi-methodological study on Plocamium species within
New Zealand, there is uncertainty about the validity of its presently described species. An
integrative approach, using molecular data and morphometric analyses is needed to further
understand the genus within New Zealand. To delineate species diversity and distribution of
Plocamium within New Zealand, a molecular-assisted investigation was conducted using
partial COI, rbcL, and LSU molecular markers and multivariate analyses of morphological
characters to determine if genetic variation reflects morphological variation.

26
2.3 Materials and Methods:
2.3.1 Study area and sample collection
Specimens were collected from various locations throughout New Zealand. NIWA
staff also provided various specimens for morphological and molecular analyses. A list of all
samples used within the study is provided (Table 1). Samples were collected from drift,
intertidal, and subtidal habitats. Preliminary species identifications were based on
examination of morphological characteristics (Adams 1994). For each specimen collected, a
voucher was made for morphometric analyses and a respective subsample from each voucher
was preserved in silica gel for molecular analyses.
2.3.2 DNA extraction, amplification and sequencing
DNA was extracted using a modified CTAB protocol (Zuccarello and Lokhorst 2005).
The extracted DNA was then stored at -20°C. Three DNA regions were amplified: the
mitochondrial-encoded cytochrome c oxidase subunit I (COI), nuclear-encoded large subunit
ribosomal RNA genes LSU), and the plastid-encoded large subunit of RuBisCo (rbcL).
PCR amplification was performed for each marker with a final volume of 30 µl using 1
µl of extracted DNA, 1x Reaction Buffer, 2.5 mM dNTP’s, 3.3 mM MgCl2, 0.03% BSA,
0.25 pmol of each primer, and 1 U Taq polymerase (Bioline Reagents Limited). The partial
COI gene was amplified using the primers GAZF1 and GAZR1 (Saunders 2005). The LSU
gene was amplified using three overlapping fragments (X, Y, Z) using primers: T01/T13,
T04/T08 and T05/T15 respectively (Harper and Saunders 2001). The rbcL gene was
amplified as two overlapping fragments. The primer pair F57/R753 was used for the first
fragment, and F577/R1153 was used for the second (Freshwater and Rueness 1994). PCR
was performed with an initial denaturation step of 94°C for 5 mins. This was followed by 1
min steps of 94°C / 45°C / 72°C each, cycled 36 times. A final extension at 72°C for 5 mins
was used. The PCR products were then electrophoresed in a 1% agarose gel and stained with
27
ethidium bromide. PCR products were cleaned using Exo SAP-IT (Affymetrix, USB product,
USA) following manufacturers protocols. Amplicons were sequenced commercially
(Macrogen Inc. Seoul, Korea). Forward and reserve sequences were edited using Geneious
v9.1 (Biomatters Ltd, USA).

28
Table 1. A list of all specimens used within the study. No.= Indentifcation number attributed to specimen. Current Name = Taxonomic name attributed to the specimen based
on morphology or collectors identification. Location = Collection location (CI – Chatham Island, NI - North Island, SI – South Island. Collector = Collector of the material
(Collectors: Madeline W. Cooper – MWC, Maren Pruess – MP, Wendy A. Nelson – WAN, Roberta D’Archino – RDA, Malcom Francis - MF), Date= Collection date. Group
= Species group assigned to based on the results of species delimitation methods. WELT = Te Papa voucher number.
No. Current Name Location Collector Date Group WELT
A1 Plocamium angustum Marfells Beach, Marlborough, SI MWC 21.03.15 A -
A2 Plocamium angustum Marfells Beach, Marlborough, SI MWC 21.03.15 A -
A3 Plocamium microcladioides Marfells Beach, Marlborough, SI MWC 21.03.15 K -
A4 Plocamium microcladioides Marfells Beach, Marlborough, SI MWC 21.03.15 K -
A5 Plocamium cirrhosum Marfells Beach, Marlborough, SI MWC 21.03.15 E -
A6 Plocamium cirrhosum Marfells Beach, Marlborough, SI MWC 21.03.15 E -
A10 Plocamium microcladioides Akitio, Manawatu, NI MWC 02.02.15 H -
A11 Plocamium microcladioides Akitio, Manawatu, NI MWC 02.02.15 K -
A12 Plocamium microcladioides Akitio, Manawatu, NI MWC 02.02.15 H -
A15 Plocamium microcladioides Mahia, Hawkes Bay, NI MWC 04.02.15 K -
A16 Plocamium microcladioides Waimarama, Hawkes Bay, NI MWC 04.02.15 K -
A17 Plocamium cirrhosum Waimarama, Hawkes Bay, NI MWC 04.02.15 E -
A18 Plocamium cirrhosum Waimarama, Hawkes Bay, NI MWC 04.02.15 E -
A23 Plocamium cirrhosum Whangara, Gisborne, NI MWC 05.02.15 E -
A24 Plocamium cirrhosum Whangara, Gisborne, NI MWC 05.02.15 E -
A26 Plocamium angustum Makorori, Gisborne, NI MWC 05.02.15 H -
A30 Plocamium spp. Three Kings Islands RDA 18.04.13 F ASN694
A31 Plocamium spp. South West Island, NZL RDA 13.04.13 E ASN516
A33 Plocamium spp. Princess Islands, Three Kings
Islands
RDA 10.04.13 F ASN344
A40 Plocamium spp. Three Kings Islands MF 18.04.13 F ASN660
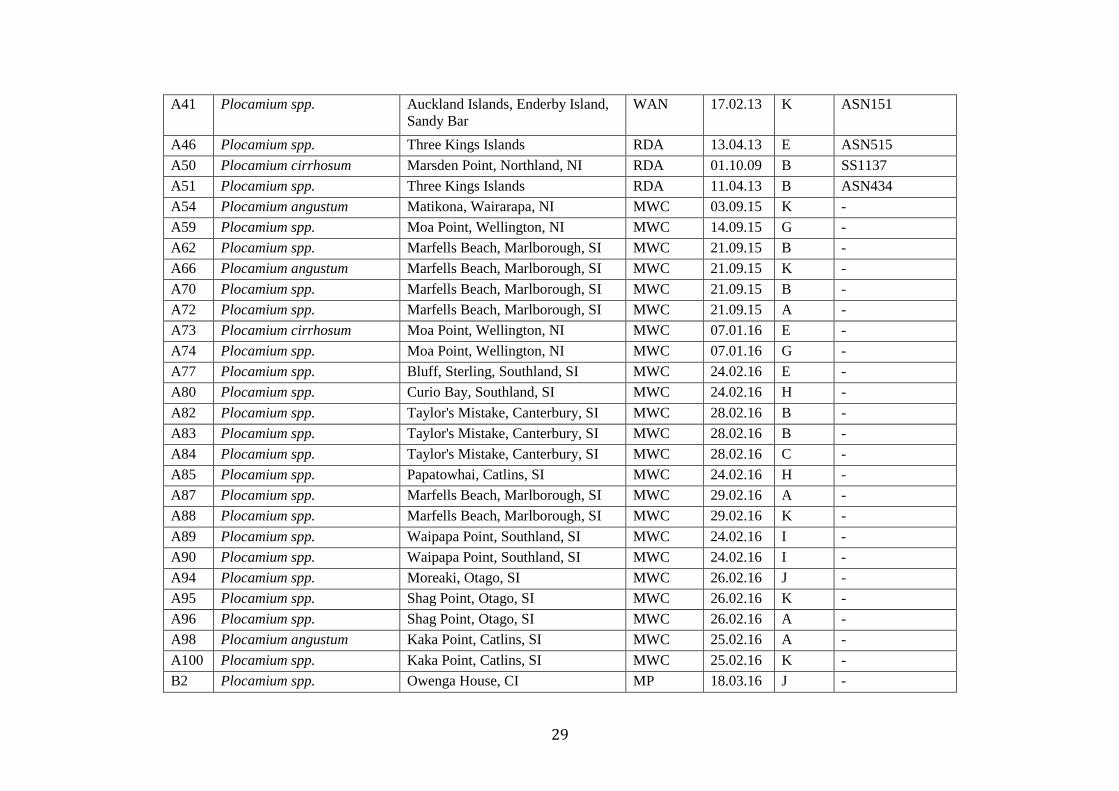
29
A41 Plocamium spp. Auckland Islands, Enderby Island,
Sandy Bar
WAN 17.02.13 K ASN151
A46 Plocamium spp. Three Kings Islands RDA 13.04.13 E ASN515
A50 Plocamium cirrhosum Marsden Point, Northland, NI RDA 01.10.09 B SS1137
A51 Plocamium spp. Three Kings Islands RDA 11.04.13 B ASN434
A54 Plocamium angustum Matikona, Wairarapa, NI MWC 03.09.15 K -
A59 Plocamium spp. Moa Point, Wellington, NI MWC 14.09.15 G -
A62 Plocamium spp. Marfells Beach, Marlborough, SI MWC 21.09.15 B -
A66 Plocamium angustum Marfells Beach, Marlborough, SI MWC 21.09.15 K -
A70 Plocamium spp. Marfells Beach, Marlborough, SI MWC 21.09.15 B -
A72 Plocamium spp. Marfells Beach, Marlborough, SI MWC 21.09.15 A -
A73 Plocamium cirrhosum Moa Point, Wellington, NI MWC 07.01.16 E -
A74 Plocamium spp. Moa Point, Wellington, NI MWC 07.01.16 G -
A77 Plocamium spp. Bluff, Sterling, Southland, SI MWC 24.02.16 E -
A80 Plocamium spp. Curio Bay, Southland, SI MWC 24.02.16 H -
A82 Plocamium spp. Taylor's Mistake, Canterbury, SI MWC 28.02.16 B -
A83 Plocamium spp. Taylor's Mistake, Canterbury, SI MWC 28.02.16 B -
A84 Plocamium spp. Taylor's Mistake, Canterbury, SI MWC 28.02.16 C -
A85 Plocamium spp. Papatowhai, Catlins, SI MWC 24.02.16 H -
A87 Plocamium spp. Marfells Beach, Marlborough, SI MWC 29.02.16 A -
A88 Plocamium spp. Marfells Beach, Marlborough, SI MWC 29.02.16 K -
A89 Plocamium spp. Waipapa Point, Southland, SI MWC 24.02.16 I -
A90 Plocamium spp. Waipapa Point, Southland, SI MWC 24.02.16 I -
A94 Plocamium spp. Moreaki, Otago, SI MWC 26.02.16 J -
A95 Plocamium spp. Shag Point, Otago, SI MWC 26.02.16 K -
A96 Plocamium spp. Shag Point, Otago, SI MWC 26.02.16 A -
A98 Plocamium angustum Kaka Point, Catlins, SI MWC 25.02.16 A -
A100 Plocamium spp. Kaka Point, Catlins, SI MWC 25.02.16 K -
B2 Plocamium spp. Owenga House, CI MP 18.03.16 J -

30
B3 Plocamium spp. Waitangi West, CI MP 19.03.16 J -
B4 Plocamium spp. Waitangi West, CI MP 19.03.16 I -
B5 Plocamium spp. Chatham Hotel, Waitangi, CI MP 17.03.16 E -
B7 Plocamium spp. Chatham Hotel, Waitangi, CI MP 17.03.16 E -
B8 Plocamium spp. Chatham Hotel, Waitangi, CI MP 17.03.16 A -
B9 Plocamium spp. Kaingaroa Seal Colony, CI MP 20.03.16 J -
B10 Plocamium spp. Kaingaroa Seal Colony, CI MP 20.03.16 J -
B11 Plocamium spp. Kaingaroa Seal Colony, CI MP 20.03.16 J -
R2 Plocamium spp. NZL RDA K ASQ12
R9 Plocamium spp. Marlborough Sound, Marlborough,
SI
RDA B ASO155
R12 Plocamium spp. Northland, NI RDA B ASO214
R13 Plocamium spp. NZL RDA B ASO256
R17 Plocamium spp. NZL RDA K FOO2T29
R18 Plocamium spp. NZL RDA A ASP146
R19 Plocamium spp. NZL RDA B ASQ002
R20 Plocamium spp. NZL RDA E ASP144
R23 Plocamium spp. NZL RDA K F044
R24 Plocamium spp. NZL RDA K ASP145
R25 Plocamium spp. NZL RDA E F050
JB21 Plocamium spp. NZL WAN D JB21
JB22 Plocamium spp. NZL WAN I JB22
JB23 Plocamium spp. NZL WAN I JB23
31
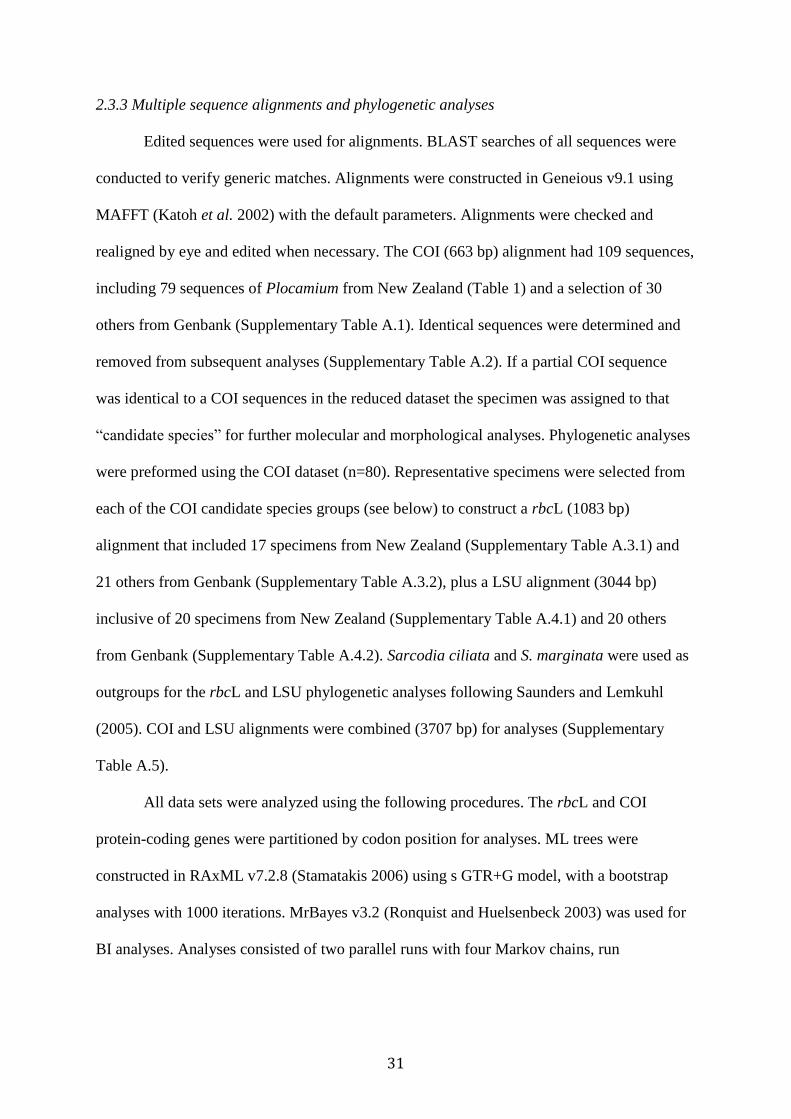
2.3.3 Multiple sequence alignments and phylogenetic analyses
Edited sequences were used for alignments. BLAST searches of all sequences were
conducted to verify generic matches. Alignments were constructed in Geneious v9.1 using
MAFFT (Katoh et al. 2002) with the default parameters. Alignments were checked and
realigned by eye and edited when necessary. The COI (663 bp) alignment had 109 sequences,
including 79 sequences of Plocamium from New Zealand (Table 1) and a selection of 30
others from Genbank (Supplementary Table A.1). Identical sequences were determined and
removed from subsequent analyses (Supplementary Table A.2). If a partial COI sequence
was identical to a COI sequences in the reduced dataset the specimen was assigned to that
“candidate species” for further molecular and morphological analyses. Phylogenetic analyses
were preformed using the COI dataset (n=80). Representative specimens were selected from
each of the COI candidate species groups (see below) to construct a rbcL (1083 bp)
alignment that included 17 specimens from New Zealand (Supplementary Table A.3.1) and
21 others from Genbank (Supplementary Table A.3.2), plus a LSU alignment (3044 bp)
inclusive of 20 specimens from New Zealand (Supplementary Table A.4.1) and 20 others
from Genbank (Supplementary Table A.4.2). Sarcodia ciliata and S. marginata were used as
outgroups for the rbcL and LSU phylogenetic analyses following Saunders and Lemkuhl
(2005). COI and LSU alignments were combined (3707 bp) for analyses (Supplementary
Table A.5).
All data sets were analyzed using the following procedures. The rbcL and COI
protein-coding genes were partitioned by codon position for analyses. ML trees were
constructed in RAxML v7.2.8 (Stamatakis 2006) using s GTR+G model, with a bootstrap
analyses with 1000 iterations. MrBayes v3.2 (Ronquist and Huelsenbeck 2003) was used for
BI analyses. Analyses consisted of two parallel runs with four Markov chains, run

32
simultaneously for 3,000,000 generations sampled every 1000 generations with a 10% burn-
in.
2.3.4 Species delimitation
Multiple species delimitation approaches were used to evaluate the number of genetic
species of Plocamium in the COI data set. The Automatic Barcode Gap Discovery (ABGD),
General Mixed Yule Coalescent (GMYC), and Bayesian implementation of the Poisson Tree
Processes (bPTP) methods were used.
The ABGD method was tested on the web interface available at
http://wwwabi.snv.jussieu.fr/public/abgd/abgdweb/html. This method assessed the breaks in
the distribution of genetic pair-wise distances, ranked these from smallest to largest, and then
found the first statistically significant peak in the slope of values instead of using a fixed
threshold (Puillandre et al. 2012). The test was run based on the predetermined model
criteria: Kimura-2-parameters, an intraspecific variability (P) between 0.001 (Pmin) and 0.1
(Pmax), a minimum gap width (X) of 0.1, and 50 screening steps.
GMYC required an ultrametric tree for analysis. The ultrametric tree was constructed
with BEAST v1.8.2. Data files were first prepared in BEAUTi v1.8.2 with the following
conditions: an uncorrelated lognormal relaxed clock, the site model GTR + I + G, set to a
coalescent constant population, with Bayesian Markov chain Monte Carlo (MCMC) run for
30 million generations, sampling trees and parameters every 1000 generations. The
estimated-effective sample size (ESS) was visualized in Tracer v1.6.0 (Rambaut et al. 2014).
25% of trees were then removed as burn-in, and a single summarized tree created with
TreeAnnotator v.1.8.2 and checked with FigTree v1.4.2. GMYC analyses were performed on
this summarized tree using the splits package (Ezard et al. 2009)(R-Forge, http://r-forge.r-
project.org/projects/splits/) in R (R Development Core Team, http://www.R-project.org)

33
under a single threshold model. The GMYC assigned branching events within species in two
ways: speciation (at the species level) and coalescent (at the population level).
bPTP required a phylogenetic tree for analysis. A Bayesian tree was created in Mr.
Bayes as specified above. This Bayesian tree was tested using the web interface available at
http://species.h-its.org. Although the phylogenetic tree used for analysis in bPTP was not
ultrametric as in GMYC, a comparison of the results is still acceptable (Zhang et al. 2013).
2.3.5 Morphometric Analyses
Morphometric measurements were conducted using scanned images of voucher
specimens in the program ImgaeJ (Rasband 1997). The morphometry of 33 specimens
belonging to each group of candidate species, previously delineated with the three genetic
delimitation methods and two type specimens (P. cirrhosum and P. microcladioides) were
analyzed (Supplementary Table A.6.). Group D and F were excluded from the morphometric
analyses, as voucher specimens were not available for the respective sequence data.
Diagnostic characters, used in previous studies (Yano et al. 2004) were selected: width of
main axis (WMA), width of lowest basal ramuli (WLBR), length of lowest basal ramuli
(LLBR), number of alternating series of ramuli (NASR), average number of ramuli per
alternating series (ANRAS), curvature of basal ramuli (CBR) and serrations present or absent
from basal ramuli (SERBR) (Fig. 1). All characters were averaged (mean) based upon 10
measurements per specimen one centimeter from the apical tip of each randomly selected
branch. Multivariate and univariate analyses were conducted to test for differences in
morphometric measurements between the previously determined genetic species.
34
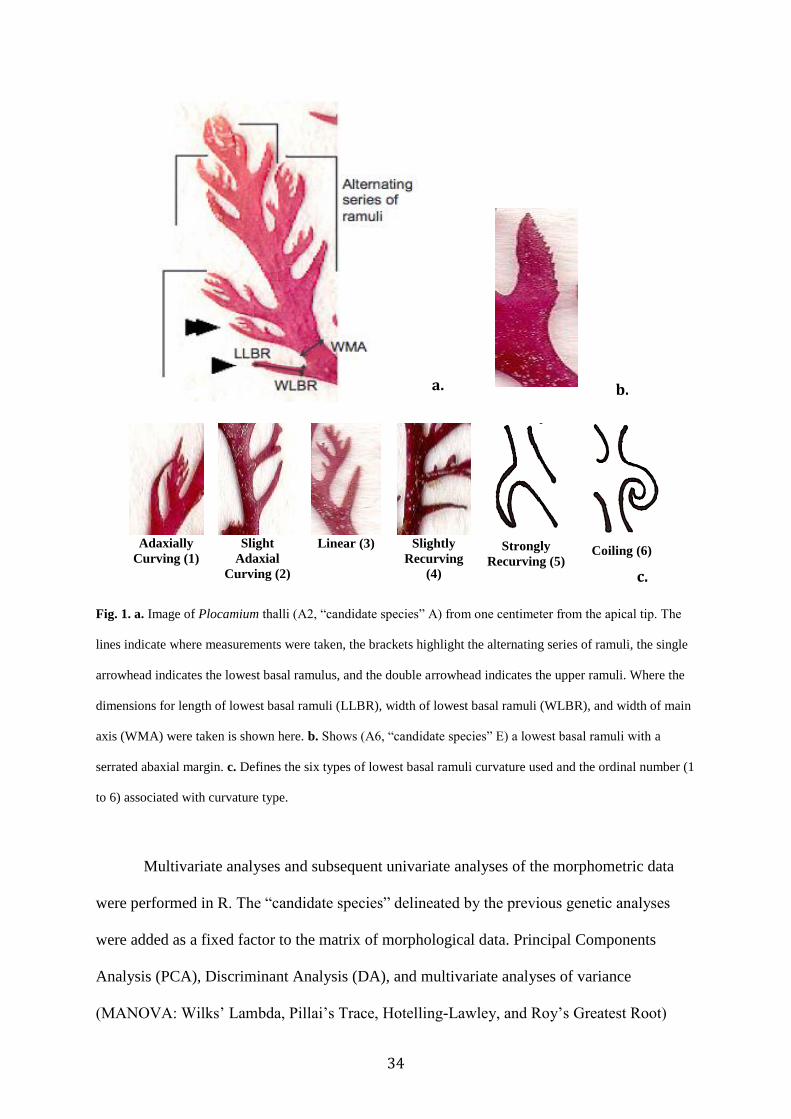
Adaxially
Curving (1)
Slight
Adaxial
Curving (2)
Linear (3)
Slightly
Recurving
(4)
Strongly
Recurving (5)
Coiling (6)
Fig. 1. a. Image of Plocamium thalli (A2, “candidate species” A) from one centimeter from the apical tip. The
lines indicate where measurements were taken, the brackets highlight the alternating series of ramuli, the single
arrowhead indicates the lowest basal ramulus, and the double arrowhead indicates the upper ramuli. Where the
dimensions for length of lowest basal ramuli (LLBR), width of lowest basal ramuli (WLBR), and width of main
axis (WMA) were taken is shown here. b. Shows (A6, “candidate species” E) a lowest basal ramuli with a
serrated abaxial margin. c. Defines the six types of lowest basal ramuli curvature used and the ordinal number (1
to 6) associated with curvature type.
Multivariate analyses and subsequent univariate analyses of the morphometric data
were performed in R. The “candidate species” delineated by the previous genetic analyses
were added as a fixed factor to the matrix of morphological data. Principal Components
Analysis (PCA), Discriminant Analysis (DA), and multivariate analyses of variance
(MANOVA: Wilks’ Lambda, Pillai’s Trace, Hotelling-Lawley, and Roy’s Greatest Root)
b. a.
c.

35
were conducted. Subsequent One-way ANOVA’s were conducted for each variable and
Tukey’s test performed to verify the differences between means. The data was log-
transformed to meet the assumption of normality and homogeneity of variances. A
significance level of 0.05 was used.
2.4 Results
2.4.1 Phylogenetic analyses and Species Delimitations
The COI alignment was 663 bp long and contained 50 specimens and 23
Genbank sequences. Phylogenetic trees obtained from ML and BI analyses of the COI dataset
were topologically congruent and only the Bayesian tree is shown (Fig. 2). This data set
indicated that many of the New Zealand, plus some Australian samples, formed a clade,
distinct from samples from other parts of the world, though this relationship was not
supported. However, at least two of these candidate species groups from New Zealand (A and
B) were not part of this clade. While many of the backbone relationships were not well
supported, many clades of New Zealand samples had moderate to strong support. These
supported clades often corresponded to genetic species delimitation groups (see below) (Fig.
2).
ABGD, GMYC, and bPTP were used for species delimitation based on the COI data
set. The three methods resulted in different numbers of candidate species; ABGD yielded 11
species (P=0.001), 12 with GMYC (LGMYC = 519.67 > L0 = 503.11, P = 0.01), and 16 species
from bPTP (Fig.2). To reconcile these differences, candidate species were distinguished
based on “majority rule” (i.e. if two or more of the methods agreed). All three species
delimitation methods supported candidate species A, B, C, D, F, G, and H (Fig. 2.). ABGD
and GMYC supported candidate species E and I (Fig. 2). GMYC and bPTP supported species
J and K (Fig. 2).
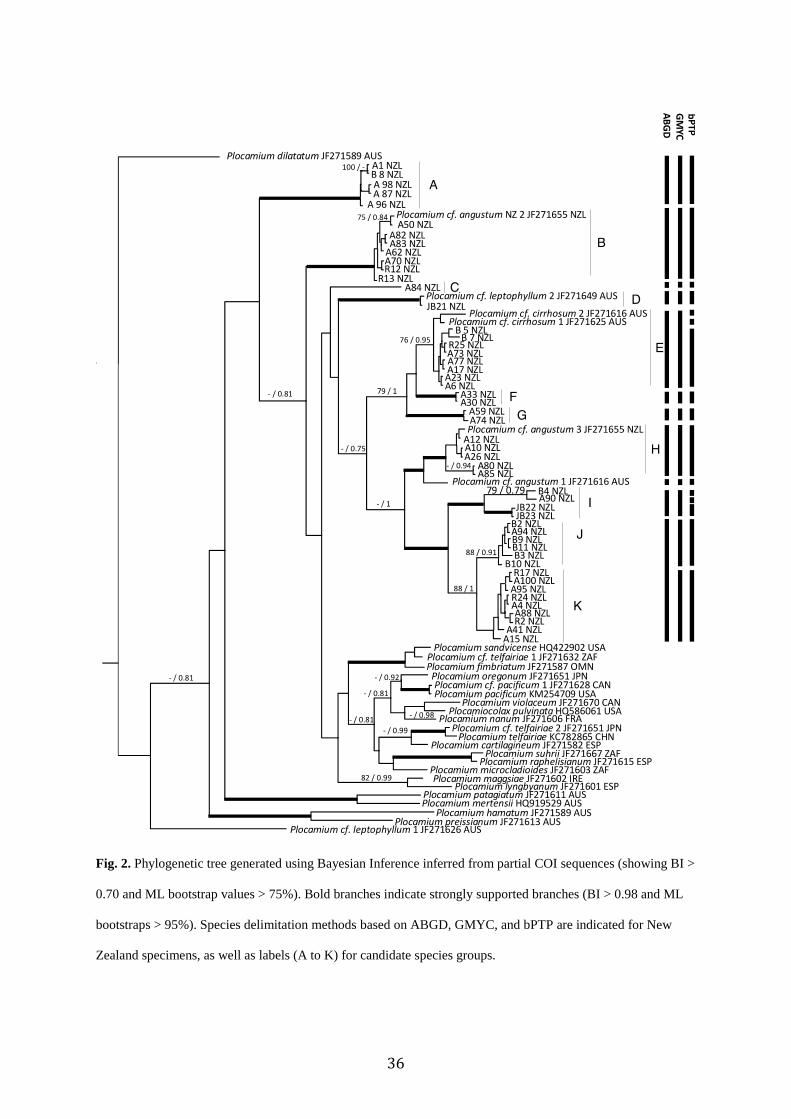
36
Fig. 2. Phylogenetic tree generated using Bayesian Inference inferred from partial COI sequences (showing BI >
0.70 and ML bootstrap values > 75%). Bold branches indicate strongly supported branches (BI > 0.98 and ML
bootstraps > 95%). Species delimitation methods based on ABGD, GMYC, and bPTP are indicated for New
Zealand specimens, as well as labels (A to K) for candidate species groups.
37
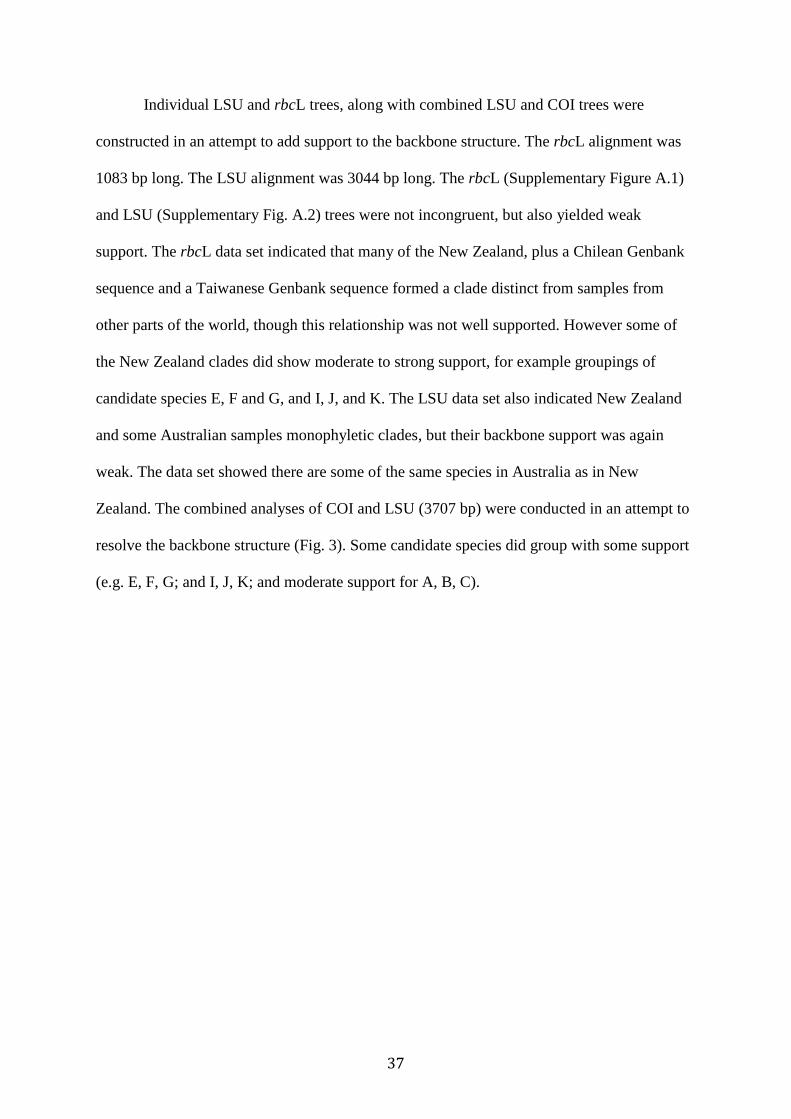
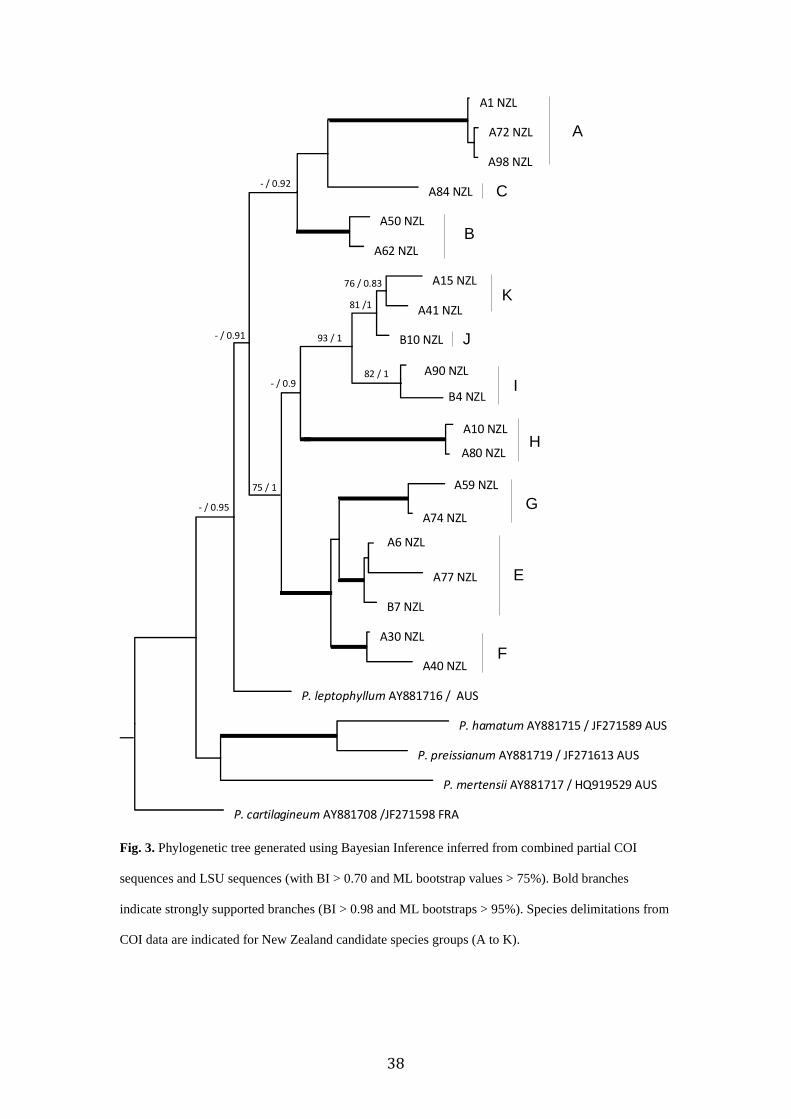
Individual LSU and rbcL trees, along with combined LSU and COI trees were
constructed in an attempt to add support to the backbone structure. The rbcL alignment was
1083 bp long. The LSU alignment was 3044 bp long. The rbcL (Supplementary Figure A.1)
and LSU (Supplementary Fig. A.2) trees were not incongruent, but also yielded weak
support. The rbcL data set indicated that many of the New Zealand, plus a Chilean Genbank
sequence and a Taiwanese Genbank sequence formed a clade distinct from samples from
other parts of the world, though this relationship was not well supported. However some of
the New Zealand clades did show moderate to strong support, for example groupings of
candidate species E, F and G, and I, J, and K. The LSU data set also indicated New Zealand
and some Australian samples monophyletic clades, but their backbone support was again
weak. The data set showed there are some of the same species in Australia as in New
Zealand. The combined analyses of COI and LSU (3707 bp) were conducted in an attempt to
resolve the backbone structure (Fig. 3). Some candidate species did group with some support
(e.g. E, F, G; and I, J, K; and moderate support for A, B, C).
38
Fig. 3. Phylogenetic tree generated using Bayesian Inference inferred from combined partial COI
sequences and LSU sequences (with BI > 0.70 and ML bootstrap values > 75%). Bold branches
indicate strongly supported branches (BI > 0.98 and ML bootstraps > 95%). Species delimitations from
COI data are indicated for New Zealand candidate species groups (A to K).
A77 NZL
B7 NZL
A90 NZL
P. leptophyllum AY881716 / AUS
P. mertensii AY881717 / HQ919529 AUS
P. preissianum AY881719 / JF271613 AUS
A30 NZL
A72 NZL
A84 NZL
A50 NZL
A15 NZL
B10 NZL
A10 NZL
A40 NZL
B4 NZL
A98 NZL
P. cartilagineum AY881708 /JF271598 FRA
P. hamatum AY881715 / JF271589 AUS
A62 NZL
A41 NZL
A1 NZL
A74 NZL
A80 NZL
A59 NZL
A6 NZL
81 /1
93 / 1
82 / 1
75 / 1
- / 0.92
- / 0.91
- / 0.9
- / 0.95
76 / 0.83
F
G
I
B
C
A
K
J
H
E
39
2.4.2 Morphometric Analyses
A morphological description of each of the seven reported species within New
Zealand can be found within the General Introduction (Section 1.4.1) (Womersley
1971, South and Adams 1979, Adams 1994, Nelson 2013). Multivariate analyses of
the morphometric data resulted in identification of mean differences between some
the candidate species delimited by the molecular methods. Groups D and F were
excluded from the morphometric analyses, as voucher specimens were not available
for these samples. A summary of the measurements taken across genetic species in
provided (Table 2).
When considering the chosen morphological characters, the first 2 principal
components represent 55.1% and 21.2% of the morphological variability,
approximately 76.3% of the total observed variability. The first component of the
PCA (PC1) strongly separated candidate species E and K (Fig. 4). WMA, WLBR,
LLBR and SERBR were the characters deemed most important (Fig. 4, Table TA.7).
The second component (PC2) separated groups based on ANRAS and CBR (Fig. 4,
Supplementary Table A.7).
The biplot of the PCA revealed certain candidate species did not occupy
overlapping regions. The type specimen of P. microcladioides grouped separately
from all other specimens, as did candidate species G. Although there was character
overlap between candidate species A and K, and A and E, distinction between these
species is still apparent. However, most candidate species clusters displayed partial or
complete overlap. The type specimen for P. cirrhosum and candidate species J
grouped with species E. The first quadrant contained species G, the left side of the
graph (the second and third quadrats) contained most of the species (B, C, H, I, K, and
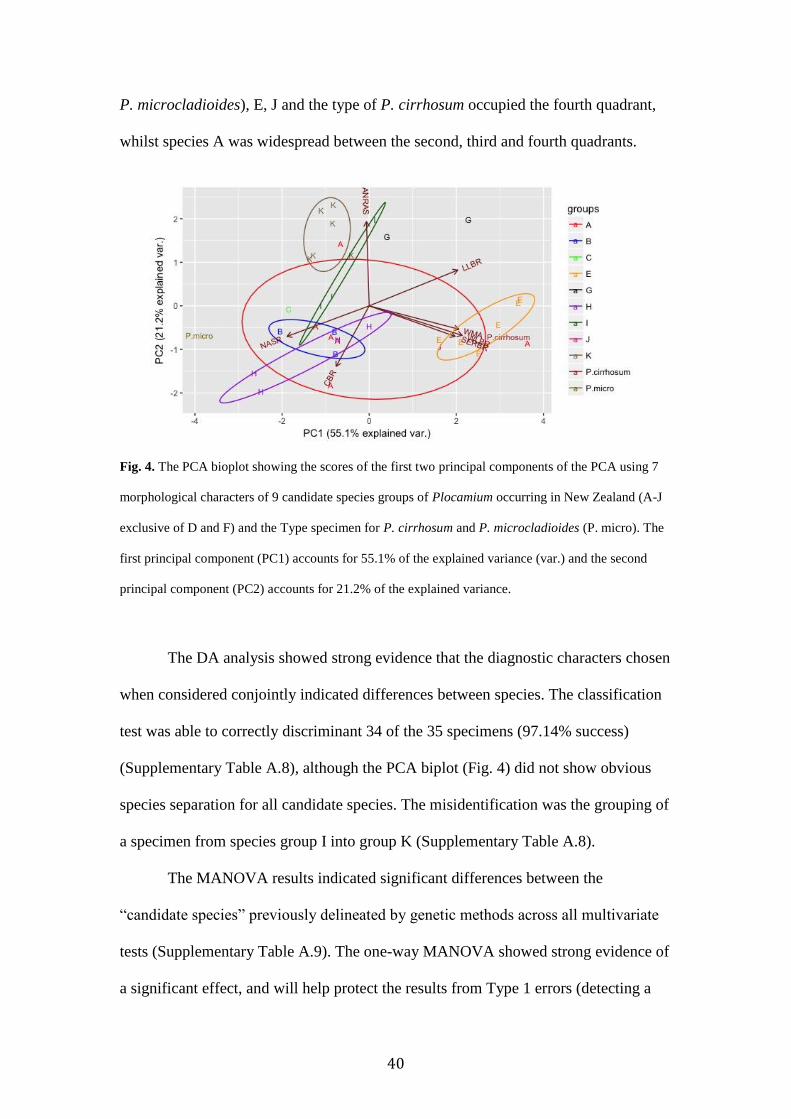
40
P. microcladioides), E, J and the type of P. cirrhosum occupied the fourth quadrant,
whilst species A was widespread between the second, third and fourth quadrants.
Fig. 4. The PCA bioplot showing the scores of the first two principal components of the PCA using 7
morphological characters of 9 candidate species groups of Plocamium occurring in New Zealand (A-J
exclusive of D and F) and the Type specimen for P. cirrhosum and P. microcladioides (P. micro). The
first principal component (PC1) accounts for 55.1% of the explained variance (var.) and the second
principal component (PC2) accounts for 21.2% of the explained variance.
The DA analysis showed strong evidence that the diagnostic characters chosen
when considered conjointly indicated differences between species. The classification
test was able to correctly discriminant 34 of the 35 specimens (97.14% success)
(Supplementary Table A.8), although the PCA biplot (Fig. 4) did not show obvious
species separation for all candidate species. The misidentification was the grouping of
a specimen from species group I into group K (Supplementary Table A.8).
The MANOVA results indicated significant differences between the
“candidate species” previously delineated by genetic methods across all multivariate
tests (Supplementary Table A.9). The one-way MANOVA showed strong evidence of
a significant effect, and will help protect the results from Type 1 errors (detecting a
41
significant effect when one is not truly present or a false positive), subsequent
univariate and post-hoc analyses were conducted for each of the response variables.
The One-way ANOVA revealed statistically significant differences between at least
two of the “candidate species” A, B, C, E, G, H, I, J, K, and the type of P. cirrhosum
and P. microcladioides when considering each of the selected diagnostic characters
individually (Supplementary Table A.10, Fig. 5).
Post-hoc analyses (Tukey’s Tests) revealed the significant morphometric
parameters that allowed us to separate group pairs morphologically, which were sister
lineages in the phylogenetic trees (Fig. 2). Tukey’s Tests revealed no mean
differences of any of the variables between the Type Specimen of P. cirrhosum and
“candidate species” E or J (Supplementary Table. A.11-A.17). Where previous
delimitation methods disagreed (GMYC separated species J and K, when ABGD
grouped them), morphological analyses revealed significant differences in WMA and
SERBR between J and K. DA analysis classification test misidentified species I as K,
the results of the post-hoc test revealed no significant differences between any of the
measured characters.
2.4.3 Species Name Assignments
Species delimitation keys were used in an attempt to assign candidate genetic
species groups (excluding D and F) to recognized Plocamium species (Adams 1994).
Species E: Comparison of morphometric analyses with the type specimen of
P. cirrhosum indicated no significant differences across any of the characters
analyses. When following the original descriptions and species keys, specimen of
candidate species E are identified as P. cirrhosum. All three species delimitation
42
methods separate this species from other lineages (Fig. 2). Based on this evidence
candidate species E will be assigned to P. cirrhosum.
Species G: Based on comparisons across species keys, and having taken into
account the results of the morphometric analyses, it would seem that candidate
species G should be considered P. cartilagineum. However, all three species
delimitation methods differentiate species G from other lineages, including Northern
European isolates of P. cartilagineum from Genbank, which indicates it is not P.
cartilagineum as the type is from Northern Europe.
Species A, B, C: Comparison across all morphological characters indicated no
significant differences for any of the test variables between species A, B and C.
Molecularly, all delimitation methods agreed on the partitioning of the three species,
and there is some, but weak, support indicating these three species form a clade.
Given the observed data, following species keys and species descriptions, this clade
should tentatively be recognized as P. angustum, consisting of three cryptic species.
Species H: When considering all the above morphological criteria, species H
also matched P. angustum.
Species I, J and K: Morphologically species groups K and I showed no
significant differences across any of the morphological characters. However, species J
differed significantly from the groups based on width of main axes and serrations.
Phylogenetic analyses of COI, rbcL, LSU, and combined data sets showed strong
support within the New Zealand clade for grouping genetic species I, J and K. The
four samples compromising species I, were distinguished with strong support in the
COI analysis. The six specimens comprising species group J and the nine of group K,
were distinguished with weak ML support but strong BI support. J and K were
differentiated with species delimitation methods bPTP and GMYC, but splitting
43
between these two groups was not supported by AGBD. Species keys and
descriptions also indicate species I, J, and K match P. angustum.

44
a. b. c. d.
e. f. g. Fig. 5. Box plots of the seven diagnostic characters obtained from measurements of the nine candidate species and two type specimens (P. cirrhosum (the blank space) and P.
microcladioides (P. micro)) logged values, when used, indicated. a. Character “Width of main axis” (WMA). b. Character “Width of lowest basal ramuli” (WLBR). c.
Character “Length of lowest basal ramuli” (LLBR). d. Character “Number of alternating series of ramuli” (NASR). e. Character “Average number of ramuli per alternating
series” (ANRAS). f. Character “Curvature of basal ramuli” (CBR). g. Character “Serration of basal ramuli” (SERBR). Boxes represent 75th percentiles, horizontal lines
signify 5th and 95th percentiles, bold bars denote mean values, and empty circles indicate outliers.

45
Table 2. Summary of the resulting morphometric characters of the New Zealand Plocamium included in this morphometric study.
Plocamium Species Ave. (Min. –
Max.) Width of
Main Axis (μm)
Ave. (Min. –
Max.) Width of
Lowest Basal
Ramuli (μm)
Ave. (Min. –
Max.) Length of
Lowest Basal
Ramuli (mm)
No. Alternating
Series of Ramuli
No. Ramuli Per
Alternating
Series
Curvature of
Basal Ramuli
(1-6)
Serration of
Basal Ramuli
A 620 (300 – 1400) 597 (110 – 1200) 1.5 (0.1 – 2) 5 - 11 2 3 (1 – 5) Only Rarely
B 375 (130 – 720) 195 (80 – 400) 1.2 (0.75 – 1.73) 4 – 9 2 3 (1 – 3) No
C 230 (170 – 290) 163 (80 – 280) 1 (0.6 – 1.8) 6 – 9 2 2 (1 – 2) No
E 1000 (420 –
1630)
750 (420 – 1420) 2.4 (0.7 – 3.7) 2 – 6 2 – 3 2 (1 – 3) Yes
G 600 (330 – 1100) 375 (60 – 850) 2.2 (0.6 – 4) 2 – 3 3 – 4 3 (1 – 4) No
H 340 (80 – 570) 220 (40 – 420) 1 (0.3 – 2.2) 3 – 12 2 3 (1 – 5) No
I 250 (110 – 400) 180 (60 – 340) 1.78 (0.8 – 2.9) 3 – 8 2 – 3 1 (1 – 5) No
J 810 (400 – 1300) 360 (200 – 500) 1.75 (0.9 – 2.6) 3 – 7 2 2 (1 – 4) Yes
K 305 (80 – 530) 170 (60 – 290) 1.9 (0.8 – 2.9) 3 - 12 2 – 3 1 (1 – 3) No
P. cirrhosum* 1080 (750 –
1500)
890 (500 – 1200) 2.3 (1.9 – 3.1) 2 – 4 2 2 Yes
P.
microcladioides*
180 (140 – 290) 100 (60 – 130) 0.6 (0.4 – 0.8) 8 - 13 2 – 3 3 (2 – 4) No
46
2.5 Discussion
This is the first study to use molecular-assisted alpha taxonomy to delineate
species diversity of Plocamium within New Zealand. Currently, there are seven
reported species within New Zealand (South and Adams 1979, Adams 1994, Nelson
2013). Molecular assessment of this diversity revealed previous species
circumscriptions based on morphology were underestimated. Morphometric analyses
indicated that these species could be identified morphologically to some extent when
multiple measurements of multiple characters were taken into account.
2.5.1 Species Delimitation and Morphometrics
The attempt to use three different species delimitations methods (each with
different algorithmic techniques) on the COI dataset indicated results that support the
occurrence of at least 11 genetic species of Plocamium within New Zealand. This
finding of increased species diversity compared to expected levels is not uncommon
and has been seen in other algal species (Zuccarello and West 2003, Payo et al. 2013,
Muangmai et al. 2014, Díaz-Martínez et al. 2016). Similar findings of unexpected
genetic diversity in seemingly morphologically identical species of Plocamium were
also found in northern Europe (Saunders and Lehmkuhl 2005, Cremades et al. 2011).
However, there were minor disagreements observed between genetic
delimitation methods, as found in putative species I and between species J and K.
These disagreements between species-delimitation methods are most likely due to the
different algorithmic techniques specific to each analysis. The ABGD method
differentiates species dependent on within and between species genetic divergence
(Puillandre et al. 2012). This would be considered a more conservative approach
when compared to GMYC and bPTP. The GMYC and bPTP methods infer putative
47
species based on species boundaries determined from phylogenetic trees. Species are
delimited from the GMYC model based on the significant changes in the pace of
branching events to determine transition points, meaning it is a time based model
(Zhang et al. 2013). Unlike the GMYC model the bPTP model is not based on time
but on the direct number of substitutions, functioning on the basic assumption that
substitution rates between species will be higher than within (Zhang et al. 2013). This
means that these models can overestimate based on singletons, low sample numbers,
and/or unbalanced sampling (Zhang et al. 2013, Muangmai et al. 2014), which may
be the case here.
Plocamium in New Zealand has been defined based on the morphological
species concept. While this concept holds true for some species, there are others that
display analogous morphological traits. Based on the results of this study, when using
morphometric techniques it appears that morphological diversity does, to some extent,
reflect genetic differentiation. While there were no clear diagnostic characters present
that could singularly identify species (i.e. the set of characters currently used for
morphological identifications is not sufficient to distinguish the species),
morphometric analyses revealed that morphological differences between putative
species do exist. The most useful characters for species identification were: WMA,
WLBR, LLBR, and SERBR; consistent with the findings of other studies (Yano et al.
2004, Cremades et al. 2011). Other algal genera, e.g. Halimeda (Verbruggen et al.
2005) and Padina (Díaz-Martínez et al. 2016), have shown that multiple
measurements across a set of multiple characters allows for differentiation of alga that
could previous only be separated genetically.
Previous taxonomic studies, based on morphology have underestimated
species diversity in this genus. Although there were inconsistencies across

48
delimitation methods and identification based on single character morphology could
not be achieved, the recognition of these candidate genetic species is the beginning to
uncover the true species diversity of Plocamium within New Zealand. If increased
sampling occurs and the species delimitations are sustained, further investigations into
morphological, reproductive, physiological, chemical and geographical differences
are justified.
2.5.2 Application of Species Names and What Else is Needed
Applying names to these lineages is difficult at present. First it should be
noted, that these species identifications are to be taken with caution, as reproductive
tissues were not present on most specimens, and have not been considered in this
study. Also names were not assigned to specimen in putative species groups D and F
as there were no morphological data for these specimens. Names applied to singleton
putative species and specimen that have only one morphological specimen (C, J)
should be viewed with caution as well. Only one (species E) of putative species could
be confidently associated with a name across all of the above criteria (Plocamium
cirrhosum). Given the current available species keys and descriptions, and using the
morphological and molecular results from this study, for the recognized New Zealand
Plocamium, the specimens were given tentative names where appropriate. P. hookeri,
P. hamatum, P. leptopyllum, and P. microcladiodes were not found through MAAT
analyses.
Given that the type specimen of P. cirrhosum is from Dusky Sounds
(Fiordland, Southland, New Zealand), morphologically congruent with the specimens
from candidate species E, the application of this name does seem appropriate to this
49
lineage. Sequence data (A77) from Southland (near the type locality) supports this as
well.
Based on morphological conclusions, species G was tentatively assigned
through species keys as P. cartilagineum. However, molecular data did not confirm
this, clearly separating it from northern European (type locality) isolates. Although
extensive work has been done on this species in other parts of the world (Yano et al.
2004, Saunders and Lehmkuhl 2005, Cremades et al. 2011), there is still confusion
about its taxonomic status. It is often divided into cryptic (genetic) species, or
identified as new species morphologically (Saunders and Lehmkuhl 2005, Cremades
et al. 2011). This species and the taxonomic uncertainties associated with it makes
molecular characterization key for clarification of the correct name.
Species A, B and C; species H; and species I, J, and K are all recognized as P.
angustum. The results of the Tukeys’ tests revealed some between group
disagreements amongst these three clades. Morphological differences were found
when multiple measures of multiple characters were analyzed, indicating possible
cryptic and pseudo-cryptic species. Species A differed in WMA when compared with
species I and K. Species H was distinguished from species K when ANASR and CBR
were considered. These morphological differences indicate that these seemingly
cryptic species might actually be species in a morphological sense as well. The COI
data in conjunction with the morphological evidence indicate that the wide application
of the name P. angustum might not be appropriate, plus various Genbank sequences
given the name are found in different New Zealand clades. Strict morphological
analyses and/ or sequence data from the type or material from the type locality
(Australia), is necessary for clarification of the correct application of the name. Then
it can be determine which New Zealand lineage fits the type.

50
The molecular and morphometric analyses have demonstrated that current
morphological characters, used to delineate Plocamium in New Zealand, are not
taxonomically informative at the species level. To create more robust species
identifications and delimitations a shift towards combined molecular and
morphological methods needs to occur. Chemical analysis of intracellular acidity
(Yano et al. 2004), investigation into the reproductive potential between species
(Zuccarello and West 2003), physiological differences (Muangmai et al. 2014), and
an attempt at a revision of morphology of the type specimens (or samples from the
type localities) (Aguirre and Braga 1998) and molecular characterization of types
(Hughey and Gabrielson 2012) are necessary to ensure proper names are being used.
2.5.3 New Zealand Plocamium and Its Relationship with Species in Other Parts of the
World
The taxonomy of Plocamium worldwide is problematic (Lehmkuhl 2003,
Yano et al. 2004, Cremades et al. 2011). Phylogenetic analyses obtained from the
markers suggest the possible monophyly of New Zealand species (C-K). The
diversification of these species seems to have occurred within New Zealand. High
diversity, speciation and endemism have been reported across many organisms within
New Zealand (Broom et al. 2004, Gordon et al. 2010, Muangmai et al. 2014, Nelson
et al. 2015). The possible cryptic speciation of Plocamium within some of the New
Zealand clades can possibly be attributed to New Zealand’s split from Australia and
Antarctica, and its high number of associated islands (Gordon et al. 2010). A mix of
warmer more saline tropical and sub-tropical waters brought down from Australia and
cooler less saline subantarctic waters brought up from the subantarctic islands and the
diverse geography and topography of New Zealand’s coast promotes these patterns as

51
well (Parsons 1985, Gordon et al. 2010). New Zealand's long isolation (~80 million
years), ocean currents and diverse coastal and seafloors habitats support these high
levels of diversity, speciation, and endemism.
The results of the molecular analyses also indicate that New Zealand species
may share relationships with Plocamium species in Australia, Chile, and Taiwan. This
trend in diversity is not uncommon (Parsons 1985, Guillemin et al. 2014). Southern
hemisphere (sub–tropical) links between algal species has been proposed in previous
studies (Fraser et al. 2009, Muangmai et al. 2014). It is hypothesized that links
between southern hemisphere algal species such as Gracillaria chilensis (Guillemin et
al. 2014), Carphophyllum mascholocarpum (Buchanan 2005), and Bostrychia
(Muangmai et al. 2014) could have risen from factors occurring during the Last
Glacial Maximum (LGM). Other hypotheses suggest Australian and New Zealand
species have Gondwanan origins (Costello et al. 2010).
While some of the Plocamium species in New Zealand were separated from
other species from other parts of the world, the relationship between species is
unclear. Analyses of single markers nor conjoint markers resolved these relationships.
Additional sampling of these species from a broader range of locations, assessing
other molecular markers and further analyses to estimate the divergence time for the
species, would help resolve these relationships.
2.5.4 Conclusion
This study’s molecular-assisted taxonomic approach provides insights into the
taxonomy of Plocamium in New Zealand. Although the identification of at least
eleven genetic and possibly morphometrically distinct species has been acknowledge
where there were only seven, a final understanding of species diversity in New

52
Zealand is far from complete. It is evident based on currently recognized species keys
and diagnostic characters that New Zealand Plocamium species are not easily
distinguishable but can to a certain degree be when analyzing multiple measures
across multiple characters. Future study into the Plocamium of New Zealand will
allow for a deeper understanding of its biodiversity, endemism, and evolutionary
relationships with other regions around the world.
53
3. General Discussion
This study has three main findings: 1] the delimitation of additional
Plocamium species within New Zealand; 2] evidence of morphology reflecting
genetic diversity to a certain degree (morphometrics may be the only way to
distinguish between certain species versus single character analyses); 3] the
evolutionary relationships tentatively grouping New Zealand species with Australia,
Chile, and Taiwan.
3.1 DNA Barcoding and MAAT
This study shows that prior to molecular analyses, specimens of Plocamium
that lack reproductive structures could not be convincingly identified at the species
level based on species delimitation keys, which do not take into account multiple
measurements of vegetative characters. Using traditional morphological characters to
accurately identify specimens to the species level can be difficult and seemingly
impossible for many red algal species (Saunders 2005, Leliaert et al. 2014). Similar
studies have identified cryptic and pseudo-cryptic speciation in northern Europe
(Saunders and Lehmkuhl 2005, Cremades et al. 2011) and Japan (Yano et al. 2004).
Molecular techniques are used as a solution to taxonomic problems and to reveal
hidden diversity.
DNA barcoding, the use of various species delimitation methods, and MAAT
for species identification allows for accurate identification, reveals true diversity
between morphologically similar species despite their life stage, and may uncover
new species (Verbruggen et al. 2005, Cianciola et al. 2010, Leliaert et al. 2014). DNA
barcoding is a method intended to deliver fast, accurate, automatable species
identifications by using gene regions as species tags (Hubert and Hanner 2015).
54
However, this requires supported taxonomy so that samples can be identified to an
already named and cataloged species (Hubert and Hanner 2015).
When sequence data reveals genetic differentiation, cryptic or pseudo-cryptic
(species that have not had a specific distinguishing diagnostic trait or set of traits
recognized) species, MAAT and/or morphometric analyses that take into account
multiple measurements of multiple characters can ease the difficulty and increase the
reliability of algal identifications (Verbruggen et al. 2005, Saunders 2008, Cianciola
et al. 2010). MAAT, unlike DNA Barcoding, works towards determining species
based on sequence data that have established a priori genetic species groups.
Combining and comparing statistical analyses of morphological characters with
species delimitation and genetic data helps to create more robust species
identifications, descriptions and taxonomic conclusions.
3.2 Resolving Taxonomic Relationships
Plocamium is a cosmopolitan genus and its taxonomy is a problem worldwide
(Yano et al. 2004, Saunders and Lehmkuhl 2005, Cremades et al. 2011). The
phylogenetic analyses have revealed some Plocamium species in New Zealand may
share relationships with Australian, South American, and Taiwanese samples,
separating it from most other Northern Hemisphere and Southern Hemisphere
lineages. This separation of Northern and Southern Hemisphere species (at least New
Zealand species) indicated within the study means that some names may not hold due
to the apparent differentiation and monophyly of some New Zealand and other
Southern species, as seen in Asparogopsis spp. (Dijoux et al. 2014). However the
relationships in this study were not clear.
55
To resolve these relationships with other parts of the world, there must be
future integrative approaches applied, as here. Additional sampling of Plocamium is
needed; this includes collecting additional specimens from areas that have already
been sampled and collecting samples from new locations (e.g. Australia, South
America, other Indo-Pacific regions) where species may be distributed. In general
estimation of marine species richness is dependent on sampling effort (Costello et al.
2010, Dijoux et al. 2014). Given the worldwide distribution of Plocamium these
sampling efforts will be necessary to clarify the biodiversity and geographic
distribution pattern of these algae.
A wider and more extensive sampling regime needed and these samples must
be vouchered and sequenced with multiple markers then catalogued for future study.
Once catalogued (e.g. Genbank), these regional sequences should then concatenated
and analyzed. Increased sample sizes, sequencing multiple markers, and application
of morphometric analyses considering multiple measures of multiple characters for
respective voucher specimens hopefully elucidate these relationships, creating
stronger support for species relationships (Verbruggen et al. 2005, Cianciola et al.
2010, Costello et al. 2010, De Clerck et al. 2013, Nelson et al. 2013, Dijoux et al.
2014).
However, for proper species names to be applied and new species identified,
type specimens must first be stringently morphologically analyzed and sequenced.
Names of species are based on type specimen and are crucial comparative material for
taxonomic investigations (McNeill et al. 2006). Multiple studies have shown that
extraction and amplification of nuclear and plastid DNA from old (some dating back
to the early 1900’s) algal herbarium material can be isolated in practical and
reproducible ways (Hughey et al. 2001, Hughey and Gabrielson 2012). Other studies

56
highlight the importance of re-documentation of type material, focused on
identification of diagnostic characters different from those used in modern taxonomy
(Aguirre and Braga 1998, Iryu et al. 2009). To further resolve species relationships of
Plocamium within New Zealand and around the world, attempts at type sequencing
and reconsideration of the morphological characters associated with its modern
taxonomy are a must. As shown in this study (P. angustum), it is possible to
morphologically differentiate between species that are identified as the same species
based on current species keys.
Using a combination of morphological and genetic analyses is not the only
way to delineate species. Chemical analyses are also used within algal species as a
way to provide species identifications (Naylor et al. 1983, Brondz and Olsen 1986,
Amsler 2008, Maschek and Baker 2008). The pH measurements of Plocamium cell
sap was investigated in Japan, and were considered useful in resolving species
relationships (Yano et al. 2004). Assessing whether algal species are reproductively
compatible is another possible way to resolve species delimitation problems
(Zuccarello and West 2003). Studies on other algal studies reveal reproductive
incompatibility between species complexes (e.g. Bostrychia spp.), suggesting that
some cryptic and pseudo-cryptic species could be considered species under the
biological species concept as well (Zuccarello and West 2003, Muangmai 2015).
Investigation into the hybridization abilities of Plocamium species may be beneficial
to further indicate species boundaries.
57
3.3 Conclusion
Plocamium within New Zealand and around the world have traditionally been
defined based on morphology (the morphological species concept). This has been
problematic due to the significant and overlapping morphology associated with this
taxa. Not only does morphological continuity present a challenge for species
identifications within Plocamium, this holds across other red algal taxa as well. In an
attempt to address these underlying issues, a molecular-assisted approach to
taxonomy was used. This studies use of molecular analyses of COI, rbcL, LSU, and
combined data sets provide the first molecular evidence that Plocamium diversity has
been underestimated in New Zealand. To investigate the genetic diversity, further
morphometric analyses of multiple measures of multiple characters from a wide range
of specimens collected throughout New Zealand were conducted. These results
indicated that the eleven genetic species revealed in this study could be distinguished
morphologically when multiple measures of multiple characters were considered.
However, using current delimitation keys only allows us to identify three
morphological variants within the study It is evident based on currently recognized
species keys and diagnostic characters that Plocamium in New Zealand is not clearly
distinguishable. This study showed the most useful characters for morphologically
differentiating species were WMA, WLBR, ANASR, and SERBR (when multiple
measures were taken). This set of characters may aid in field-identifications, however
there is still more investigation that needs to be done, specifically incorporating
reproductive structures into analyses.
Future studies to create more robust species identifications and delimitations
need to occur. Further morphological analyses, molecular analyses, chemical analysis
of intracellular acidity (Yano et al. 2004), investigation into the reproductive potential
58
between species (Zuccarello and West 2003), physiological differences (Muangmai et
al. 2014), and an attempt at a revision of morphology of the type specimens (or
samples from the type localities) (Aguirre and Braga 1998) and molecular
characterization of types (Hughey and Gabrielson 2012) are necessary to ensure
proper names are being used. These studies will benefit New Zealand and aid in
understanding its biodiversity, endemism, and evolutionary relationships with other
parts of the world.

56
References ADAMS, D.C., ROHLF, F.J. & SLICE, D.E. 2004. Geometric morphometrics: ten years
of progress following the ‘revolution’. Italian Journal of Zoology 71: 5-16.
ADAMS, N.M. 1994. Seaweeds of New Zealand. Canterbury University Press.
AFOLAYAN, A.F., MANN, M.G., LATEGAN, C.A., SMITH, P.J., BOLTON, J.J. & BEUKES,
D.R. 2009. Antiplasmodial halogenated monoterpenes from the marine red
alga Plocamium cornutum. Phytochemistry 70: 597-600.
AGARDH, C. 1824. Synopsis Algarum. Literis Berlingaris. Pt XVI. Lundae.
AGARDH, C.A. 1817. Synopsis algarum Scandinaviae: adjecta dispositione universali
algarum. ex officina Berlingiana.
AGARDH, J.G. 1841. In historiam algarum symbolae (Continuatio prima.).
AGARDH, J.G. 1842. Algae maris Mediterranei et Adriatici (Marine algae from
Mediterranean and Adriatic Sea). Fortin. Masson et C. ie, Paris. pp. X.
AGARDH, J.G. 1876. Epicris systematis floridearum. O. Weigel.
AGUIRRE, J. & BRAGA, J. 1998. Redescription of Lemoine's (1939) types of coralline
algal species from Algeria. Palaeontology 41: 489-508.
AMSLER, C.D. 2008. Algal chemical ecology. Springer.
BJÖRKLUND, M., SEMESI, A., MOHAMMED, S. & BJÖRK, M. 1995. Coralline algae,
important coral-reef builders threatened by pollution.
BOOKSTEIN, F.L., CHERNOFF, B., ELDER, R.L., HUMPHRIES, J.M., SMITH, G.R. &
STRAUSS, R.E. 1985. Morphometrics in evolutionary biology: the geometry of
size and shape change, with examples from fishes.
BORNET, J.B.E. & THURET, G.A. 1867. Recherches sur la fécondation des Floridées.
Victor Masson et Fils.
BRONDZ, I. & OLSEN, I. 1986. Chemotaxonomy at a crossroads?: Gas
chromatographic analyses of a single colony from the bacterium Haemophilus
aphrophilus. Journal of Chromatography B: Biomedical Sciences and
Applications 374: 119-124.
BROOM, J., FARR, T. & NELSON, W. 2004. Phylogeny of the Bangia flora of New
Zealand suggests a southern origin for Porphyra and Bangia (Bangiales,
Rhodophyta). Molecular Phylogenetics and Evolution 31: 1197-1207.
BUCHANAN, J. 2005. The crustose brown algae of New Zealand: a taxonomic study.
CHAPIN III, F.S., ZAVALETA, E.S., EVINER, V.T., NAYLOR, R.L., VITOUSEK, P.M.,
REYNOLDS, H.L., HOOPER, D.U., LAVOREL, S., SALA, O.E. & HOBBIE, S.E.
2000. Consequences of changing biodiversity. Nature 405: 234-242.
CIANCIOLA, E.N., POPOLIZIO, T.R., SCHNEIDER, C.W. & LANE, C.E. 2010. Using
molecular-assisted alpha taxonomy to better understand red algal biodiversity
in Bermuda. Diversity 2: 946-958.
COLE, K.M. & SHEATH, R.G. 1990. Biology of the red algae. Cambridge University
Press.
COSTELLO, M.J., COLL, M., DANOVARO, R., HALPIN, P., OJAVEER, H. & MILOSLAVICH,
P. 2010. A census of marine biodiversity knowledge, resources, and future
challenges. PloS one 5: e12110.
CREMADES, J., BARREIRO, R., MANEIRO, I. & SAUNDERS, G.W. 2011. A new
taxonomic interpretation of the type of Plocamium cartilagineum
(Plocamiales, Florideophyceae) and its consequences. European journal of
phycology 46: 125-142.
DAYRAT, B. 2005. Towards integrative taxonomy. Biological journal of the Linnean
society 85: 407-415.
57
DE CLERCK, O., GUIRY, M.D., LELIAERT, F., SAMYN, Y. & VERBRUGGEN, H. 2013.
Algal taxonomy: a road to nowhere? Journal of Phycology 49: 215-225.
DE QUEIROZ, K. 2007. Species concepts and species delimitation. Systematic biology
56: 879-886.
DÍAZ-MARTÍNEZ, S., ZUCCARELLO, G.C., CHÁVEZ, G.A.S., PEDROCHE, F.F. & AVILA-
ORTIZ, A.G. 2016. Species of Padina (Dictyotales, Phaeophyceae) in tropical
Mexican waters based on molecular-assisted taxonomy. Phycologia 55: 673-
687.
DIJOUX, L., VIARD, F. & PAYRI, C. 2014. The more we search, the more we find:
discovery of a new lineage and a new species complex in the genus
Asparagopsis. PLoS One 9: e103826.
DIKOW, T., MEIER, R., VAIDYA, G.G. & LONDT, J.G.H. 2009. Biodiversity research
based on taxonomic revisions-a tale of unrealized opportunities. Diptera
Diversity: Status, Challenges and Tools. Brill Academic Publishers, Leiden:
323-345.
DIXON, P. & IRVINE, L. 1977. Seaweeds of the British Isles, vol 1 Rhodophyta.
London: Natural History Museum.
DIXON, P.S. 1967. The typification of Fucus cartilagineus L. and F. corneus Huds.
Blumea-Biodiversity, Evolution and Biogeography of Plants 15: 55-62.
EZARD, T., FUJISAWA, T. & BARRACLOUGH, T. 2009. SPLITS: species’ limits by
threshold statistics. R package version 1.
FISHER, R.A. 1935. The logic of inductive inference. Journal of the royal statistical
society 98: 39-82.
FRANCAVILLA, M., MANARA, P., KAMATEROU, P., MONTELEONE, M. & ZABANIOTOU,
A. 2015. Cascade approach of red macroalgae Gracilaria gracilis sustainable
valorization by extraction of phycobiliproteins and pyrolysis of residue.
Bioresource technology 184: 305-313.
FRASER, C.I., HAY, C.H., SPENCER, H.G. & WATERS, J.M. 2009. Genetic and
morphological analyses of the southern bull kelp Durvillaea antarctica
(Phaeophyceae: Durbillaeales) in New Zealand reveal cryptic species. Journal
of Phycology 45: 436-443.
FREDERICQ, S., HOMMERSAND, M.H. & FRESHWATER, D.W. 1996. The molecular
systematics of some agar-and carrageenan-containing marine red algae based
on rbcL sequence analysis. Hydrobiologia 326: 125-135.
FRESHWATER, D.W. & RUENESS, J. 1994. Phylogenetic relationships of some
European Gelidium (Gelidiales, Rhodophyta) species, based on rbcL
nucleotide sequence analysis. Phycologia 33: 187-194.
FRESHWATER, D.W., FREDERICQ, S., BUTLER, B.S., HOMMERSAND, M.H. & CHASE,
M.W. 1994. A gene phylogeny of the red algae (Rhodophyta) based on plastid
rbcL. Proceedings of the National Academy of Sciences 91: 7281-7285.
GABRIELSON, P.W., GARBARY, D.J. & SCAGEL, R.F. 1985. The nature of the ancestral
red alga: inferences from a cladistic analysis. BioSystems 18: 335-346.
GAMFELDT, L., LEFCHECK, J.S., BYRNES, J.E.K., CARDINALE, B.J., DUFFY, J.E. &
GRIFFIN, J.N. 2015. Marine biodiversity and ecosystem functioning: what's
known and what's next? Oikos 124: 252-265.
GLEDITSCH, J.G. 1764. Systema plantarum a staminum situ.
GOFF, L.J., MOON, D.A., NYVALL, P., STACHE, B., MANGIN, K. & ZUCCARELLO, G.
1996. The evolution of parasitism in the red algae: Molecular comparisons of
adelphoparasites and their hosts. Journal of Phycology 32: 297-312.

58
GORDON, D.P., BEAUMONT, J., MACDIARMID, A., ROBERTSON, D.A. & AHYONG, S.T.
2010. Marine biodiversity of Aotearoa New Zealand. PLoS One 5: e10905.
GUILLEMIN, M.-L., VALERO, M., FAUGERON, S., NELSON, W. & DESTOMBE, C. 2014.
Tracing the trans-Pacific evolutionary history of a domesticated seaweed
(Gracilaria chilensis) with archaeological and genetic data. PloS one 9:
e114039.
GUIRY, M.D. & GUIRY, G.M. 2016. Algaebase. In World-wide elctronic Publication.
National University of Ireland, Galway.
GURGEL, C.F.D. & LOPEZ‐BAUTISTA, J. 2007. Red algae. eLS.
HARPER, J.T. & SAUNDERS, G.W. 2001. Molecular systematics of the Florideophyceae
(Rhodophyta) using nuclear large and small subunit rDNA sequence data.
Journal of phycology 37: 1073-1082.
HARVEY, W., MACKAY, J. & MACKAY, J. 1836. Flora Hibernica, part third, algae.
MACKAY, J. T., Flora hibernica comprising the flowering plants ferns
characeae musci hepaticae lichenes and algae of Ireland arranged according
to the natural system with a synopsis of the genera according to the Linnaean
system 2: 279.
HEBERT, P.D.N., CYWINSKA, A. & BALL, S.L. 2003. Biological identifications through
DNA barcodes. Proceedings of the Royal Society of London B: Biological
Sciences 270: 313-321.
HEWITT, C.L., WILLING, J., BAUCKHAM, A., CASSIDY, A.M., COX, C.M.S., JONES, L. &
WOTTON, D.M. 2004. New Zealand marine biosecurity: delivering outcomes
in a fluid environment. New Zealand Journal of Marine and Freshwater
Research 38: 429-438.
HILLIS, D.M., MORITZ, C., MABLE, B.K. & OLMSTEAD, R.G. 1996. Molecular
systematics. Sinauer Associates Sunderland, MA.
HIND, K.R., GABRIELSON, P.W., LINDSTROM, S.C. & MARTONE, P.T. 2014. Misleading
morphologies and the importance of sequencing type specimens for resolving
coralline taxonomy (Corallinales, Rhodophyta): Pachyarthron cretaceum is
Corallina officinalis. Journal of Phycology 50: 760-764.
HOOKER, S.J.D. & HARVEY, W.H. 1845. Algae Antarcticæ: being characters and
descriptions of the hitherto unpublished species of Algae, discovered in Lord
Auckland's Group, Campbell's Island, Kerguelen's Land, Falkland Islands,
Cape Horn and other southern circumpolar regions, during the voyage of HM
discovery-ships" Erebus" and" Terror".
HOTELLING, H. 1933. Analysis of a complex of statistical variables into principal
components. Journal of educational psychology 24: 417.
HUBERT, N. & HANNER, R. 2015. DNA Barcoding, species delineation and taxonomy:
a historical perspective. DNA Barcodes 3: 44-58.
HUGHEY, J.R., SILVA, P.C. & HOMMERSAND, M.H. 2001. Solving taxonomic and
nomenclatural problems in Pacific Gigartinaceae (Rhodophyta) using DNA
from type material. Journal of phycology 37: 1091-1109.
HUGHEY, J.R. & GABRIELSON, P.W. 2012. Comment on “Acquiring DNA sequence
data from dried archival red algae (Florideophyceae) for the purpose of
applying available names to contemporary genetic species: a critical
assessment” 1 1 Appears in Botany 90 (3): 191–203. doi: 10.1139/b11-079.
Botany 90: 1191-1194.
IRYU, Y., BASSI, D. & WOELKERLING, W.J. 2009. Re-assessment of the type
collections of fourteen Corallinalean species (Corralinalses, Rhodophyta)
described by W. Ishjima (1942-1960). Palaeontology 52: 401-427.
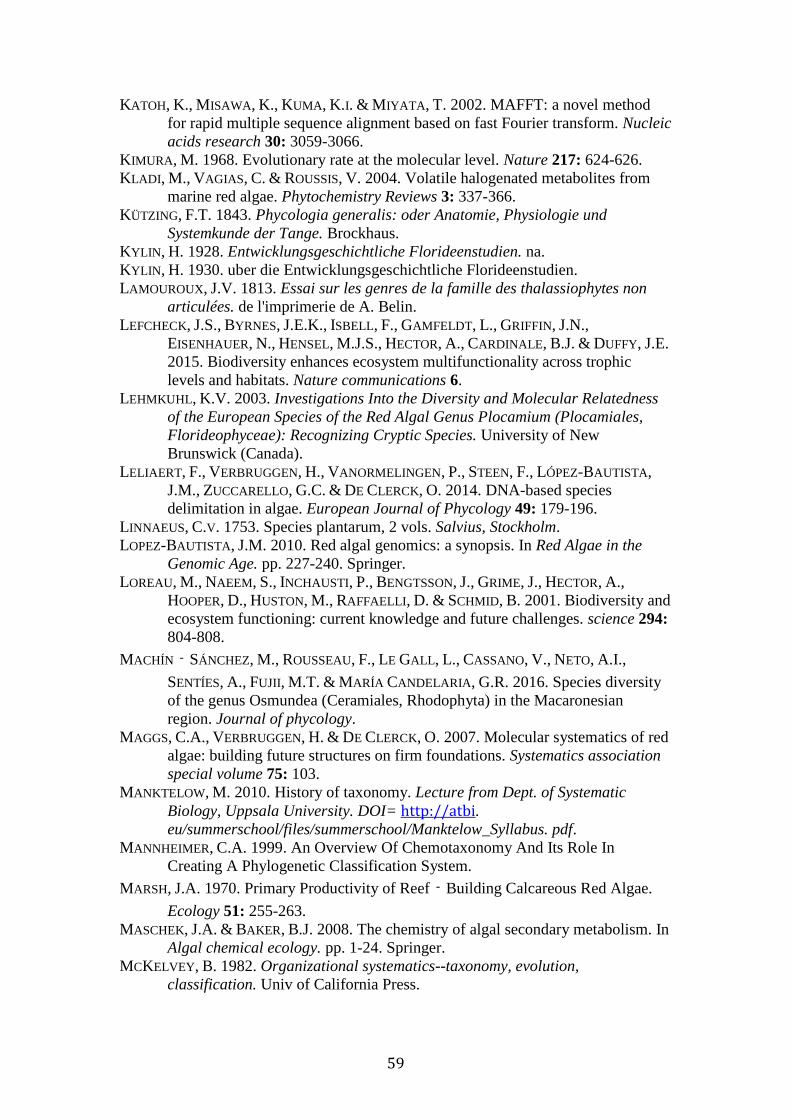
59
KATOH, K., MISAWA, K., KUMA, K.I. & MIYATA, T. 2002. MAFFT: a novel method
for rapid multiple sequence alignment based on fast Fourier transform. Nucleic
acids research 30: 3059-3066.
KIMURA, M. 1968. Evolutionary rate at the molecular level. Nature 217: 624-626.
KLADI, M., VAGIAS, C. & ROUSSIS, V. 2004. Volatile halogenated metabolites from
marine red algae. Phytochemistry Reviews 3: 337-366.
KÜTZING, F.T. 1843. Phycologia generalis: oder Anatomie, Physiologie und
Systemkunde der Tange. Brockhaus.
KYLIN, H. 1928. Entwicklungsgeschichtliche Florideenstudien. na.
KYLIN, H. 1930. uber die Entwicklungsgeschichtliche Florideenstudien.
LAMOUROUX, J.V. 1813. Essai sur les genres de la famille des thalassiophytes non
articulées. de l'imprimerie de A. Belin.
LEFCHECK, J.S., BYRNES, J.E.K., ISBELL, F., GAMFELDT, L., GRIFFIN, J.N.,
EISENHAUER, N., HENSEL, M.J.S., HECTOR, A., CARDINALE, B.J. & DUFFY, J.E.
2015. Biodiversity enhances ecosystem multifunctionality across trophic
levels and habitats. Nature communications 6.
LEHMKUHL, K.V. 2003. Investigations Into the Diversity and Molecular Relatedness
of the European Species of the Red Algal Genus Plocamium (Plocamiales,
Florideophyceae): Recognizing Cryptic Species. University of New
Brunswick (Canada).
LELIAERT, F., VERBRUGGEN, H., VANORMELINGEN, P., STEEN, F., LÓPEZ-BAUTISTA,
J.M., ZUCCARELLO, G.C. & DE CLERCK, O. 2014. DNA-based species
delimitation in algae. European Journal of Phycology 49: 179-196.
LINNAEUS, C.V. 1753. Species plantarum, 2 vols. Salvius, Stockholm.
LOPEZ-BAUTISTA, J.M. 2010. Red algal genomics: a synopsis. In Red Algae in the
Genomic Age. pp. 227-240. Springer.
LOREAU, M., NAEEM, S., INCHAUSTI, P., BENGTSSON, J., GRIME, J., HECTOR, A.,
HOOPER, D., HUSTON, M., RAFFAELLI, D. & SCHMID, B. 2001. Biodiversity and
ecosystem functioning: current knowledge and future challenges. science 294:
804-808.
MACHÍN‐SÁNCHEZ, M., ROUSSEAU, F., LE GALL, L., CASSANO, V., NETO, A.I.,
SENTÍES, A., FUJII, M.T. & MARÍA CANDELARIA, G.R. 2016. Species diversity
of the genus Osmundea (Ceramiales, Rhodophyta) in the Macaronesian
region. Journal of phycology.
MAGGS, C.A., VERBRUGGEN, H. & DE CLERCK, O. 2007. Molecular systematics of red
algae: building future structures on firm foundations. Systematics association
special volume 75: 103.
MANKTELOW, M. 2010. History of taxonomy. Lecture from Dept. of Systematic
Biology, Uppsala University. DOI= http://atbi. eu/summerschool/files/summerschool/Manktelow_Syllabus. pdf.
MANNHEIMER, C.A. 1999. An Overview Of Chemotaxonomy And Its Role In
Creating A Phylogenetic Classification System.
MARSH, J.A. 1970. Primary Productivity of Reef‐Building Calcareous Red Algae.
Ecology 51: 255-263.
MASCHEK, J.A. & BAKER, B.J. 2008. The chemistry of algal secondary metabolism. In
Algal chemical ecology. pp. 1-24. Springer.
MCKELVEY, B. 1982. Organizational systematics--taxonomy, evolution,
classification. Univ of California Press.

60
MCNEILL, J., BARRIE, F., BURDET, H., DEMOULIN, V., HAWKSWORTH, D., MARHOLD,
K., NICOLSON, D., PRADO, J., SILVA, P. & SKOG, J. 2006. International Code of
Botanical Nomenclature (Vienna Code) Journal or equivalent: Book. Book
Chapter.
MOESTRUP, Ø. 2001. Algal taxonomy: historical overview. eLS.
MORITZ, C., HILLIS, D.M. & MABLE, B.K. 1990. Molecular systematics. Sinauer
Associates Sunderland, MA.
MUANGMAI, N., WEST, J.A. & ZUCCARELLO, G.C. 2014. Evolution of four Southern
Hemisphere Bostrychia (Rhodomelaceae, Rhodophyta) species: phylogeny,
species delimitation and divergence times. Phycologia 53: 593-601.
MUANGMAI, N. 2015. Unraveling the secret life of cryptic algal species: evolution,
phylogeography and eco-physiology of the red alga, Bostrychia intricata.
NARASIMHARAO, B.P., ANAND, N., VIDYASHANKAR, S. & SARADA, R. 2012. Algal
Technologies and Challenges to Universities: New Approaches to Reach Out
to Society. Asian Biotechnology & Development Review 14.
NAYLOR, S., HANKE, F.J., MANES, L.V. & CREWS, P. 1983. Chemical and biological
aspects of marine monoterpenes. In Fortschritte der Chemie organischer
Naturstoffe/Progress in the Chemistry of Organic Natural Products. pp. 189-
241. Springer.
NEIGE, P. 2006. Morphometrics of hard structures in cuttlefish. Vie et Milieu 56: 121-
128.
NELSON, W.A., DALEN, J. & NEILL, K.F. 2013. Insights from natural history
collections: analysing the New Zealand macroalgal flora using herbarium data.
PhytoKeys: 1.
NELSON, W.A. 2013. New Zealand seaweeds: an illustrated guide. Te Papa Press.
NELSON, W.A., SUTHERLAND, J.E., FARR, T.J., HART, D.R., NEILL, K.F., KIM, H.J. &
YOON, H.S. 2015. Multi‐gene phylogenetic analyses of New Zealand
coralline algae: Corallinapetra Novaezelandiae gen. et sp. nov. and recognition
of the Hapalidiales ord. nov. Journal of Phycology.
NORTON, T.A., MELKONIAN, M. & ANDERSEN, R.A. 1996. Algal biodiversity*.
Phycologia 35: 308-326.
OLIVEIRA, M.C. & BHATTACHARYA, D. 2000. Phylogeny of the Bangiophycidae
(Rhodophyta) and the secondary endosymbiotic origin of algal plastids.
Journal of Phycology 36: 52-52.
PADIAL, J.M., MIRALLES, A., DE LA RIVA, I. & VENCES, M. 2010. The integrative
future of taxonomy. Frontiers in zoology 7: 1.
PARADAS, W.C., CRESPO, T.M., SALGADO, L.T., ANDRADE, L.R., SOARES, A.R.,
HELLIO, C., PARANHOS, R.R., HILL, L.J., SOUZA, G.M. & KELECOM, A.G.A.C.
2015. Mevalonosomes: specific vacuoles containing the mevalonate pathway
in Plocamium brasiliense cortical cells (Rhodophyta). Journal of phycology
51: 225-235.
PARSONS, M.J. 1985. New Zealand seaweed flora and its relationships∗. New Zealand
Journal of Marine and Freshwater Research 19: 131-138.
PAYO, D.A., LELIAERT, F., VERBRUGGEN, H., D'HONDT, S., CALUMPONG, H.P. & DE
CLERCK, O. 2013. Extensive cryptic species diversity and fine-scale endemism
in the marine red alga Portieria in the Philippines. In Proc. R. Soc. B. pp.
20122660. The Royal Society.
PEARSON, K. 1895. Note on regression and inheritance in the case of two parents.
Proceedings of the Royal Society of London 58: 240-242.
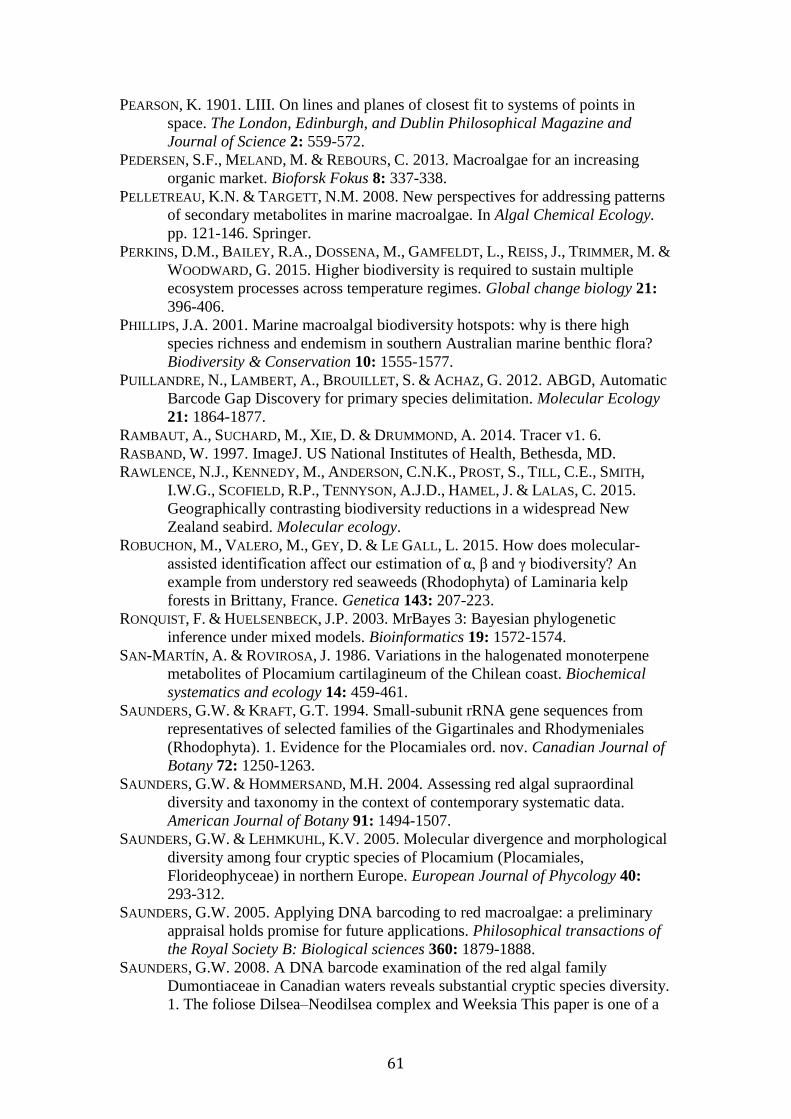
61
PEARSON, K. 1901. LIII. On lines and planes of closest fit to systems of points in
space. The London, Edinburgh, and Dublin Philosophical Magazine and
Journal of Science 2: 559-572.
PEDERSEN, S.F., MELAND, M. & REBOURS, C. 2013. Macroalgae for an increasing
organic market. Bioforsk Fokus 8: 337-338.
PELLETREAU, K.N. & TARGETT, N.M. 2008. New perspectives for addressing patterns
of secondary metabolites in marine macroalgae. In Algal Chemical Ecology.
pp. 121-146. Springer.
PERKINS, D.M., BAILEY, R.A., DOSSENA, M., GAMFELDT, L., REISS, J., TRIMMER, M. &
WOODWARD, G. 2015. Higher biodiversity is required to sustain multiple
ecosystem processes across temperature regimes. Global change biology 21:
396-406.
PHILLIPS, J.A. 2001. Marine macroalgal biodiversity hotspots: why is there high
species richness and endemism in southern Australian marine benthic flora?
Biodiversity & Conservation 10: 1555-1577.
PUILLANDRE, N., LAMBERT, A., BROUILLET, S. & ACHAZ, G. 2012. ABGD, Automatic
Barcode Gap Discovery for primary species delimitation. Molecular Ecology
21: 1864-1877.
RAMBAUT, A., SUCHARD, M., XIE, D. & DRUMMOND, A. 2014. Tracer v1. 6.
RASBAND, W. 1997. ImageJ. US National Institutes of Health, Bethesda, MD.
RAWLENCE, N.J., KENNEDY, M., ANDERSON, C.N.K., PROST, S., TILL, C.E., SMITH,
I.W.G., SCOFIELD, R.P., TENNYSON, A.J.D., HAMEL, J. & LALAS, C. 2015.
Geographically contrasting biodiversity reductions in a widespread New
Zealand seabird. Molecular ecology.
ROBUCHON, M., VALERO, M., GEY, D. & LE GALL, L. 2015. How does molecular-
assisted identification affect our estimation of α, β and γ biodiversity? An
example from understory red seaweeds (Rhodophyta) of Laminaria kelp
forests in Brittany, France. Genetica 143: 207-223.
RONQUIST, F. & HUELSENBECK, J.P. 2003. MrBayes 3: Bayesian phylogenetic
inference under mixed models. Bioinformatics 19: 1572-1574.
SAN-MARTÍN, A. & ROVIROSA, J. 1986. Variations in the halogenated monoterpene
metabolites of Plocamium cartilagineum of the Chilean coast. Biochemical
systematics and ecology 14: 459-461.
SAUNDERS, G.W. & KRAFT, G.T. 1994. Small-subunit rRNA gene sequences from
representatives of selected families of the Gigartinales and Rhodymeniales
(Rhodophyta). 1. Evidence for the Plocamiales ord. nov. Canadian Journal of
Botany 72: 1250-1263.
SAUNDERS, G.W. & HOMMERSAND, M.H. 2004. Assessing red algal supraordinal
diversity and taxonomy in the context of contemporary systematic data.
American Journal of Botany 91: 1494-1507.
SAUNDERS, G.W. & LEHMKUHL, K.V. 2005. Molecular divergence and morphological
diversity among four cryptic species of Plocamium (Plocamiales,
Florideophyceae) in northern Europe. European Journal of Phycology 40:
293-312.
SAUNDERS, G.W. 2005. Applying DNA barcoding to red macroalgae: a preliminary
appraisal holds promise for future applications. Philosophical transactions of
the Royal Society B: Biological sciences 360: 1879-1888.
SAUNDERS, G.W. 2008. A DNA barcode examination of the red algal family
Dumontiaceae in Canadian waters reveals substantial cryptic species diversity.
1. The foliose Dilsea–Neodilsea complex and Weeksia This paper is one of a
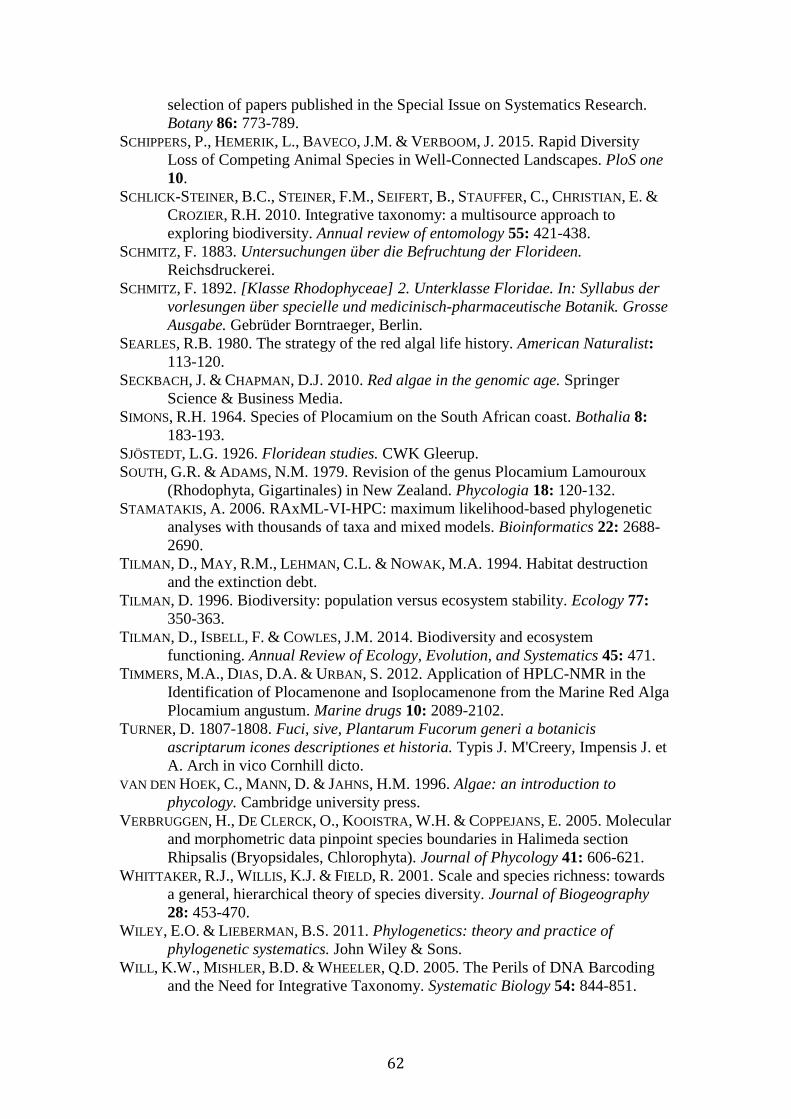
62
selection of papers published in the Special Issue on Systematics Research.
Botany 86: 773-789.
SCHIPPERS, P., HEMERIK, L., BAVECO, J.M. & VERBOOM, J. 2015. Rapid Diversity
Loss of Competing Animal Species in Well-Connected Landscapes. PloS one
10.
SCHLICK-STEINER, B.C., STEINER, F.M., SEIFERT, B., STAUFFER, C., CHRISTIAN, E. &
CROZIER, R.H. 2010. Integrative taxonomy: a multisource approach to
exploring biodiversity. Annual review of entomology 55: 421-438.
SCHMITZ, F. 1883. Untersuchungen über die Befruchtung der Florideen.
Reichsdruckerei.
SCHMITZ, F. 1892. [Klasse Rhodophyceae] 2. Unterklasse Floridae. In: Syllabus der
vorlesungen über specielle und medicinisch-pharmaceutische Botanik. Grosse
Ausgabe. Gebrüder Borntraeger, Berlin.
SEARLES, R.B. 1980. The strategy of the red algal life history. American Naturalist:
113-120.
SECKBACH, J. & CHAPMAN, D.J. 2010. Red algae in the genomic age. Springer
Science & Business Media.
SIMONS, R.H. 1964. Species of Plocamium on the South African coast. Bothalia 8:
183-193.
SJÖSTEDT, L.G. 1926. Floridean studies. CWK Gleerup.
SOUTH, G.R. & ADAMS, N.M. 1979. Revision of the genus Plocamium Lamouroux
(Rhodophyta, Gigartinales) in New Zealand. Phycologia 18: 120-132.
STAMATAKIS, A. 2006. RAxML-VI-HPC: maximum likelihood-based phylogenetic
analyses with thousands of taxa and mixed models. Bioinformatics 22: 2688-
2690.
TILMAN, D., MAY, R.M., LEHMAN, C.L. & NOWAK, M.A. 1994. Habitat destruction
and the extinction debt.
TILMAN, D. 1996. Biodiversity: population versus ecosystem stability. Ecology 77:
350-363.
TILMAN, D., ISBELL, F. & COWLES, J.M. 2014. Biodiversity and ecosystem
functioning. Annual Review of Ecology, Evolution, and Systematics 45: 471.
TIMMERS, M.A., DIAS, D.A. & URBAN, S. 2012. Application of HPLC-NMR in the
Identification of Plocamenone and Isoplocamenone from the Marine Red Alga
Plocamium angustum. Marine drugs 10: 2089-2102.
TURNER, D. 1807-1808. Fuci, sive, Plantarum Fucorum generi a botanicis
ascriptarum icones descriptiones et historia. Typis J. M'Creery, Impensis J. et
A. Arch in vico Cornhill dicto.
VAN DEN HOEK, C., MANN, D. & JAHNS, H.M. 1996. Algae: an introduction to
phycology. Cambridge university press.
VERBRUGGEN, H., DE CLERCK, O., KOOISTRA, W.H. & COPPEJANS, E. 2005. Molecular
and morphometric data pinpoint species boundaries in Halimeda section
Rhipsalis (Bryopsidales, Chlorophyta). Journal of Phycology 41: 606-621.
WHITTAKER, R.J., WILLIS, K.J. & FIELD, R. 2001. Scale and species richness: towards
a general, hierarchical theory of species diversity. Journal of Biogeography
28: 453-470.
WILEY, E.O. & LIEBERMAN, B.S. 2011. Phylogenetics: theory and practice of
phylogenetic systematics. John Wiley & Sons.
WILL, K.W., MISHLER, B.D. & WHEELER, Q.D. 2005. The Perils of DNA Barcoding
and the Need for Integrative Taxonomy. Systematic Biology 54: 844-851.
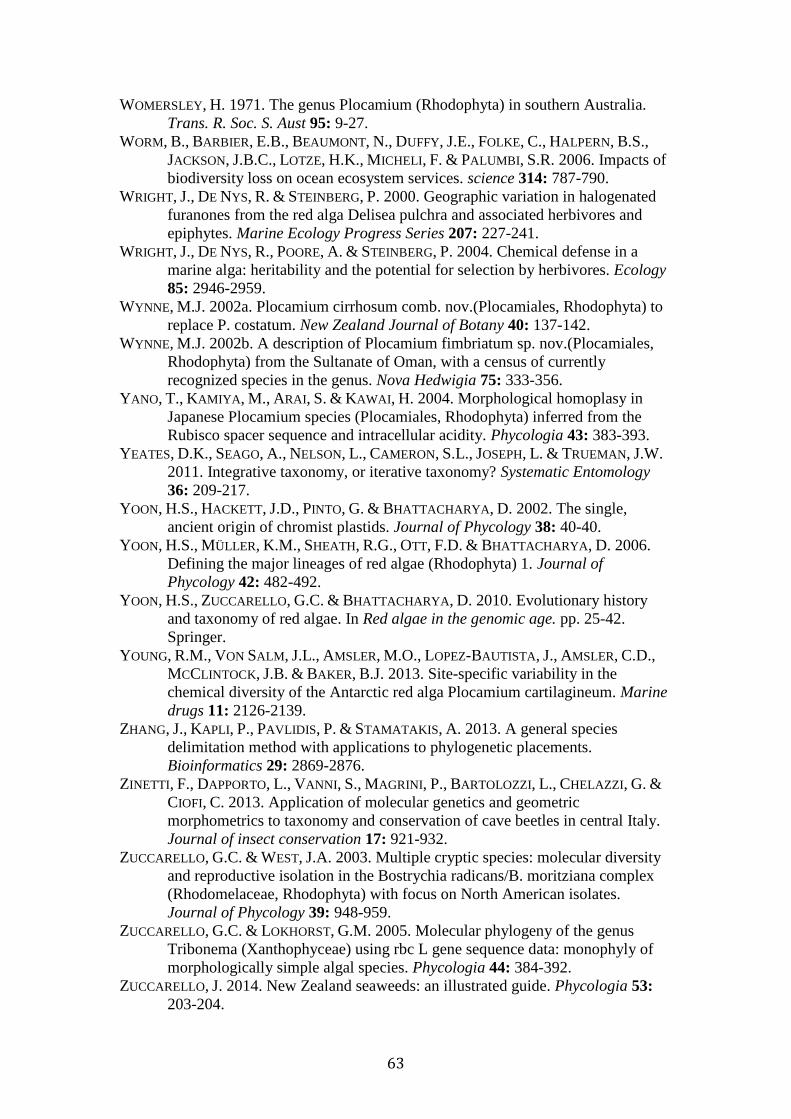
63
WOMERSLEY, H. 1971. The genus Plocamium (Rhodophyta) in southern Australia.
Trans. R. Soc. S. Aust 95: 9-27.
WORM, B., BARBIER, E.B., BEAUMONT, N., DUFFY, J.E., FOLKE, C., HALPERN, B.S.,
JACKSON, J.B.C., LOTZE, H.K., MICHELI, F. & PALUMBI, S.R. 2006. Impacts of
biodiversity loss on ocean ecosystem services. science 314: 787-790.
WRIGHT, J., DE NYS, R. & STEINBERG, P. 2000. Geographic variation in halogenated
furanones from the red alga Delisea pulchra and associated herbivores and
epiphytes. Marine Ecology Progress Series 207: 227-241.
WRIGHT, J., DE NYS, R., POORE, A. & STEINBERG, P. 2004. Chemical defense in a
marine alga: heritability and the potential for selection by herbivores. Ecology
85: 2946-2959.
WYNNE, M.J. 2002a. Plocamium cirrhosum comb. nov.(Plocamiales, Rhodophyta) to
replace P. costatum. New Zealand Journal of Botany 40: 137-142.
WYNNE, M.J. 2002b. A description of Plocamium fimbriatum sp. nov.(Plocamiales,
Rhodophyta) from the Sultanate of Oman, with a census of currently
recognized species in the genus. Nova Hedwigia 75: 333-356.
YANO, T., KAMIYA, M., ARAI, S. & KAWAI, H. 2004. Morphological homoplasy in
Japanese Plocamium species (Plocamiales, Rhodophyta) inferred from the
Rubisco spacer sequence and intracellular acidity. Phycologia 43: 383-393.
YEATES, D.K., SEAGO, A., NELSON, L., CAMERON, S.L., JOSEPH, L. & TRUEMAN, J.W.
2011. Integrative taxonomy, or iterative taxonomy? Systematic Entomology
36: 209-217.
YOON, H.S., HACKETT, J.D., PINTO, G. & BHATTACHARYA, D. 2002. The single,
ancient origin of chromist plastids. Journal of Phycology 38: 40-40.
YOON, H.S., MÜLLER, K.M., SHEATH, R.G., OTT, F.D. & BHATTACHARYA, D. 2006.
Defining the major lineages of red algae (Rhodophyta) 1. Journal of
Phycology 42: 482-492.
YOON, H.S., ZUCCARELLO, G.C. & BHATTACHARYA, D. 2010. Evolutionary history
and taxonomy of red algae. In Red algae in the genomic age. pp. 25-42.
Springer.
YOUNG, R.M., VON SALM, J.L., AMSLER, M.O., LOPEZ-BAUTISTA, J., AMSLER, C.D.,
MCCLINTOCK, J.B. & BAKER, B.J. 2013. Site-specific variability in the
chemical diversity of the Antarctic red alga Plocamium cartilagineum. Marine
drugs 11: 2126-2139.
ZHANG, J., KAPLI, P., PAVLIDIS, P. & STAMATAKIS, A. 2013. A general species
delimitation method with applications to phylogenetic placements.
Bioinformatics 29: 2869-2876.
ZINETTI, F., DAPPORTO, L., VANNI, S., MAGRINI, P., BARTOLOZZI, L., CHELAZZI, G. &
CIOFI, C. 2013. Application of molecular genetics and geometric
morphometrics to taxonomy and conservation of cave beetles in central Italy.
Journal of insect conservation 17: 921-932.
ZUCCARELLO, G.C. & WEST, J.A. 2003. Multiple cryptic species: molecular diversity
and reproductive isolation in the Bostrychia radicans/B. moritziana complex
(Rhodomelaceae, Rhodophyta) with focus on North American isolates.
Journal of Phycology 39: 948-959.
ZUCCARELLO, G.C. & LOKHORST, G.M. 2005. Molecular phylogeny of the genus
Tribonema (Xanthophyceae) using rbc L gene sequence data: monophyly of
morphologically simple algal species. Phycologia 44: 384-392.
ZUCCARELLO, J. 2014. New Zealand seaweeds: an illustrated guide. Phycologia 53:
203-204.
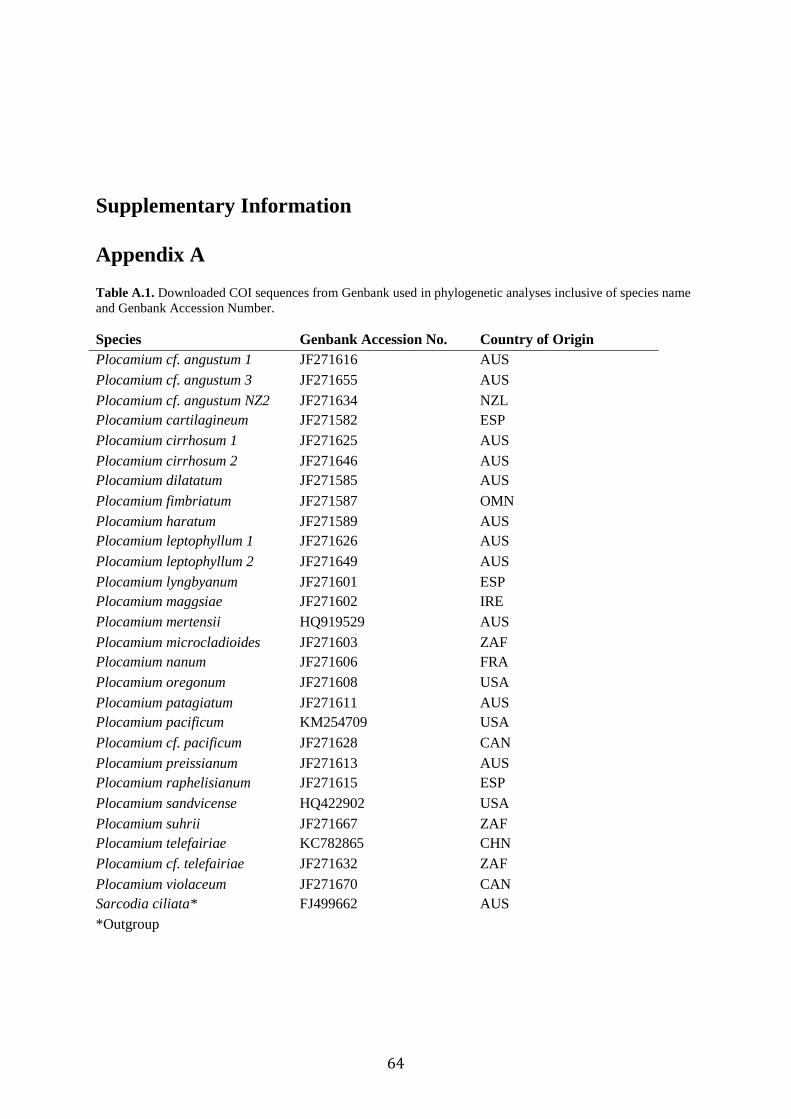
64
Supplementary Information
Appendix A Table A.1. Downloaded COI sequences from Genbank used in phylogenetic analyses inclusive of species name
and Genbank Accession Number.
Species Genbank Accession No. Country of Origin
Plocamium cf. angustum 1 JF271616 AUS
Plocamium cf. angustum 3 JF271655 AUS
Plocamium cf. angustum NZ2 JF271634 NZL
Plocamium cartilagineum JF271582 ESP
Plocamium cirrhosum 1 JF271625 AUS
Plocamium cirrhosum 2 JF271646 AUS
Plocamium dilatatum JF271585 AUS
Plocamium fimbriatum JF271587 OMN
Plocamium haratum JF271589 AUS
Plocamium leptophyllum 1 JF271626 AUS
Plocamium leptophyllum 2 JF271649 AUS
Plocamium lyngbyanum JF271601 ESP
Plocamium maggsiae JF271602 IRE
Plocamium mertensii HQ919529 AUS
Plocamium microcladioides JF271603 ZAF
Plocamium nanum JF271606 FRA
Plocamium oregonum JF271608 USA
Plocamium patagiatum JF271611 AUS
Plocamium pacificum KM254709 USA
Plocamium cf. pacificum JF271628 CAN
Plocamium preissianum JF271613 AUS
Plocamium raphelisianum JF271615 ESP
Plocamium sandvicense HQ422902 USA
Plocamium suhrii JF271667 ZAF
Plocamium telefairiae KC782865 CHN
Plocamium cf. telefairiae JF271632 ZAF
Plocamium violaceum JF271670 CAN
Sarcodia ciliata* FJ499662 AUS
*Outgroup

65
Table A.2. List of redundant sequences identified by McClade, recorded as Specimen Number (No.) paired with
respective identical specimen numbers.
Specimen No. Identical Specimen No.
A50 A47, A48, A51, R9, R19
A31 A5, A18, A23, A24, A46, R20, R23
A30 A40
A90 A89
R24 A3, A11, A54, A66
A15 A16
A1 A2, A72, R18
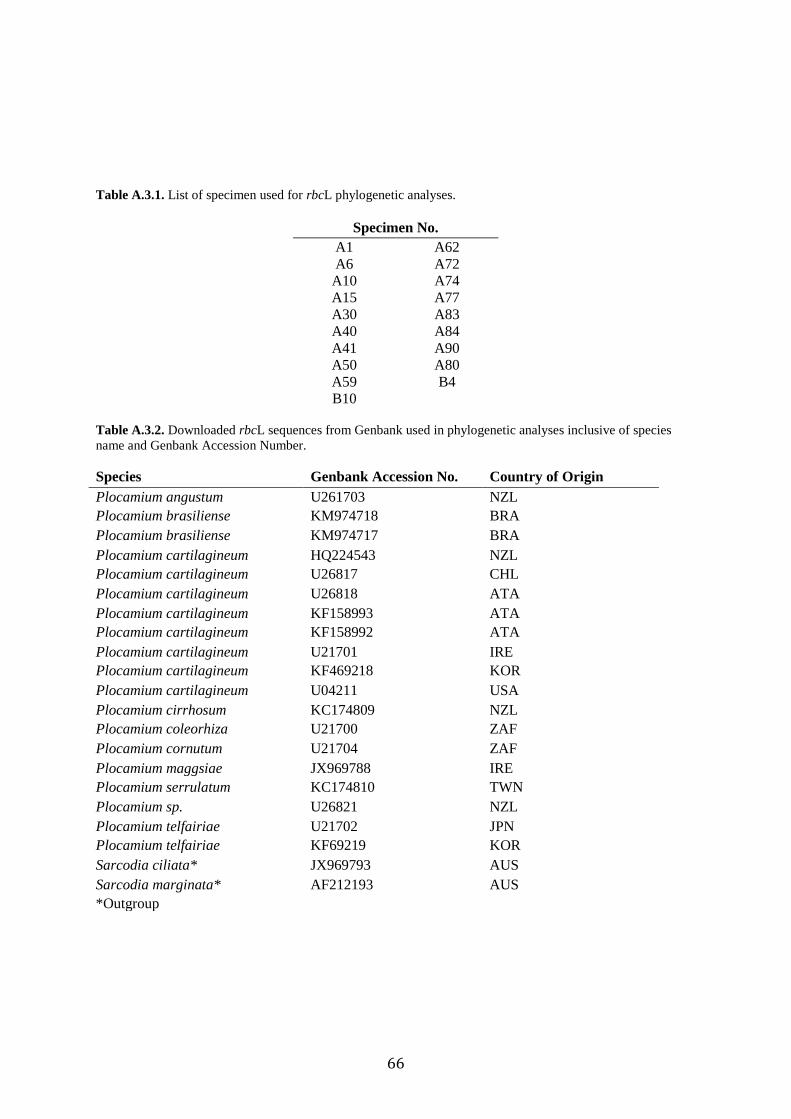
66
Table A.3.1. List of specimen used for rbcL phylogenetic analyses.
Specimen No.
A1 A62
A6 A72
A10 A74
A15 A77
A30 A83
A40 A84
A41 A90
A50 A80
A59 B4
B10
Table A.3.2. Downloaded rbcL sequences from Genbank used in phylogenetic analyses inclusive of species
name and Genbank Accession Number.
Species Genbank Accession No. Country of Origin
Plocamium angustum U261703 NZL
Plocamium brasiliense KM974718 BRA
Plocamium brasiliense KM974717 BRA
Plocamium cartilagineum HQ224543 NZL
Plocamium cartilagineum U26817 CHL
Plocamium cartilagineum U26818 ATA
Plocamium cartilagineum KF158993 ATA
Plocamium cartilagineum KF158992 ATA
Plocamium cartilagineum U21701 IRE
Plocamium cartilagineum KF469218 KOR
Plocamium cartilagineum U04211 USA
Plocamium cirrhosum KC174809 NZL
Plocamium coleorhiza U21700 ZAF
Plocamium cornutum U21704 ZAF
Plocamium maggsiae JX969788 IRE
Plocamium serrulatum KC174810 TWN
Plocamium sp. U26821 NZL
Plocamium telfairiae U21702 JPN
Plocamium telfairiae KF69219 KOR
Sarcodia ciliata* JX969793 AUS
Sarcodia marginata* AF212193 AUS
*Outgroup

67
Table A.4.1. List of specimen used for LSU phylogenetic analyses.
Specimen No.
A1 A62
A6 A72
A10 A74
A15 A77
A30 A80
A40 A84
A41 A90
A50 A98
A59 B4
B10 B7
Table A.4.2. Downloaded LSU sequences from Genbank used in phylogenetic analyses inclusive of species
name and Genbank Accession Number.
Species Genbank Accession No. Country of Origin
Plocamium angustum AY881711 AUS
Plocamium cartilagineum AY881708 FRA
Plocamium cirrhosum AY881714 AUS
Plocamium hamatum AY881715 AUS
Plocamium leptophyllum AY881716 AUS
Plocamium maggsiae AF419141 IRE
Plocamium mertensii AY881717 AUS
Plocamium nanum AY881710 FRA
Plocamium oregonum AY881724 USA
Plocamium pacificum AY881722 CAN
Plocamium patagiatum AY881718 AUS
Plocamium preissianum AY881719 AUS
Plocamium pulvinata AY881721 CAN
Plocamium sp. AY881712 AUS
Plocamium sp. AY881713 AUS
Plocamium sp. AY881720 AUS
Plocamium subtile AY881709 FRA
Plocamium telfairiae AY881725 KOR
Plocamium telefairiae AY881726 KOR
Plocamium violaceum AY881723 CAN
Sarcodia ciliata* DQ343708 AUS
Sarcodia marginata* DQ373709 AUS
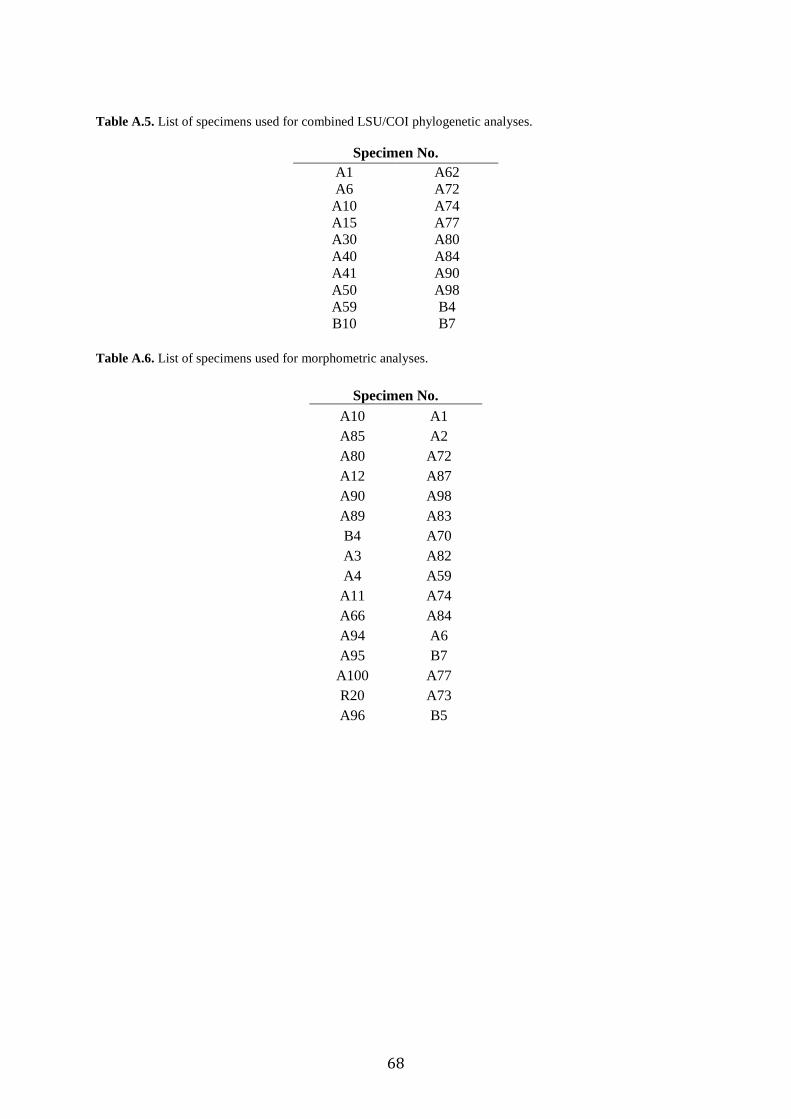
68
Table A.5. List of specimens used for combined LSU/COI phylogenetic analyses.
Specimen No.
A1 A62
A6 A72
A10 A74
A15 A77
A30 A80
A40 A84
A41 A90
A50 A98
A59 B4
B10 B7
Table A.6. List of specimens used for morphometric analyses.
Specimen No.
A10 A1
A85 A2
A80 A72
A12 A87
A90 A98
A89 A83
B4 A70
A3 A82
A4 A59
A11 A74
A66 A84
A94 A6
A95 B7
A100 A77
R20 A73
A96 B5
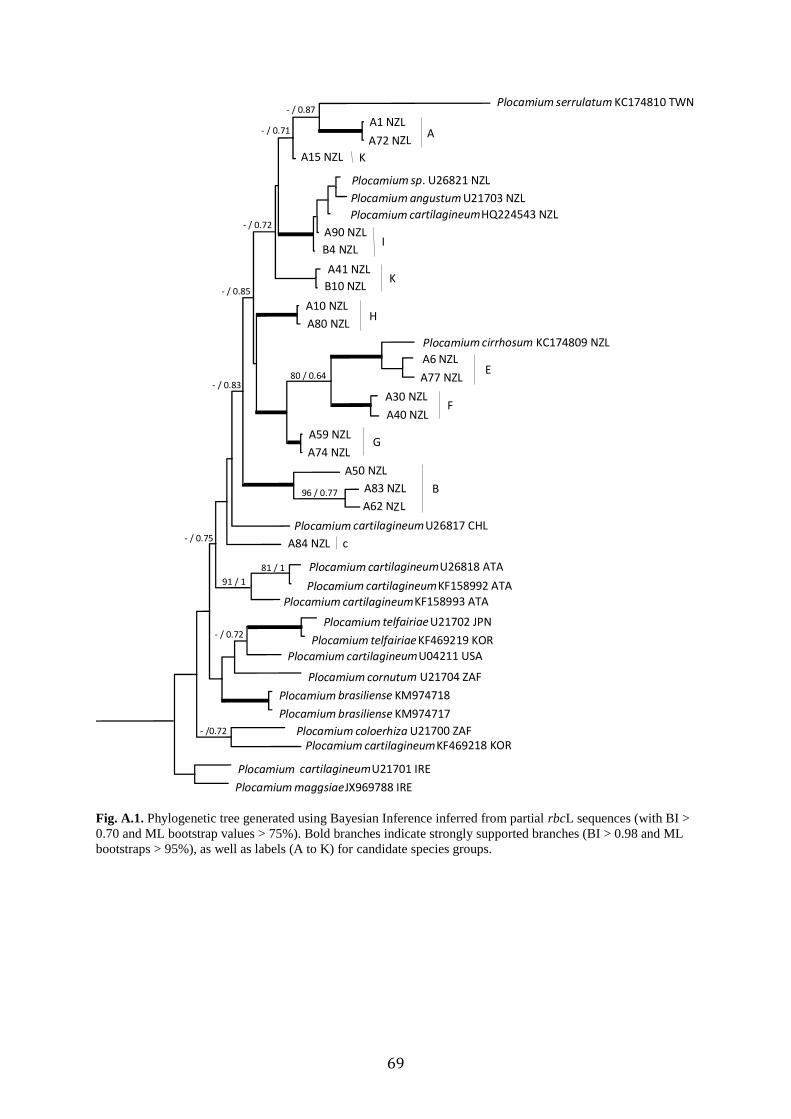
69
Fig. A.1. Phylogenetic tree generated using Bayesian Inference inferred from partial rbcL sequences (with BI >
0.70 and ML bootstrap values > 75%). Bold branches indicate strongly supported branches (BI > 0.98 and ML
bootstraps > 95%), as well as labels (A to K) for candidate species groups.
A10 NZL
A83 NZL
Plocamium cartilagineumU21701 IRE
Plocamium serrulatum KC174810 TWN
A40 NZL
Plocamiumcirrhosum KC174809 NZL
B4 NZL
Plocamiumbrasiliense KM974718
Plocamium cornutum U21704 ZAF
A1 NZL
Plocamium cartilagineumHQ224543 NZL
A6 NZL
A50 NZL
Plocamiumbrasiliense KM974717
A30 NZL
Plocamium coloerhizaU21700 ZAF
PlocamiumangustumU21703 NZL
Plocamium telfairiaeU21702 JPN
Plocamium cartilagineumU04211 USA
Plocamium cartilagineumU26817 CHL
A62 NZL
A77 NZL
A80 NZL
A41 NZL
Plocamium cartilagineumKF158992 ATA
A59 NZL
A72 NZL
A84 NZL
Plocamium cartilagineumU26818 ATA
PlocamiummaggsiaeJX969788 IRE
A74 NZL
Plocamium telfairiaeKF469219 KOR
B10 NZL
Plocamium cartilagineumKF158993 ATA
Plocamium sp. U26821 NZL
A15 NZL
A90 NZL
Plocamium cartilagineumKF469218 KOR
- / 0.87
- / 0.71
- / 0.72
- / 0.85
- / 0.83
- / 0.75
- /0.72
- / 0.72
91 / 1
81 / 1
80 / 0.64
96 / 0.77
c
B
A
F
G
E
H
K
K
I
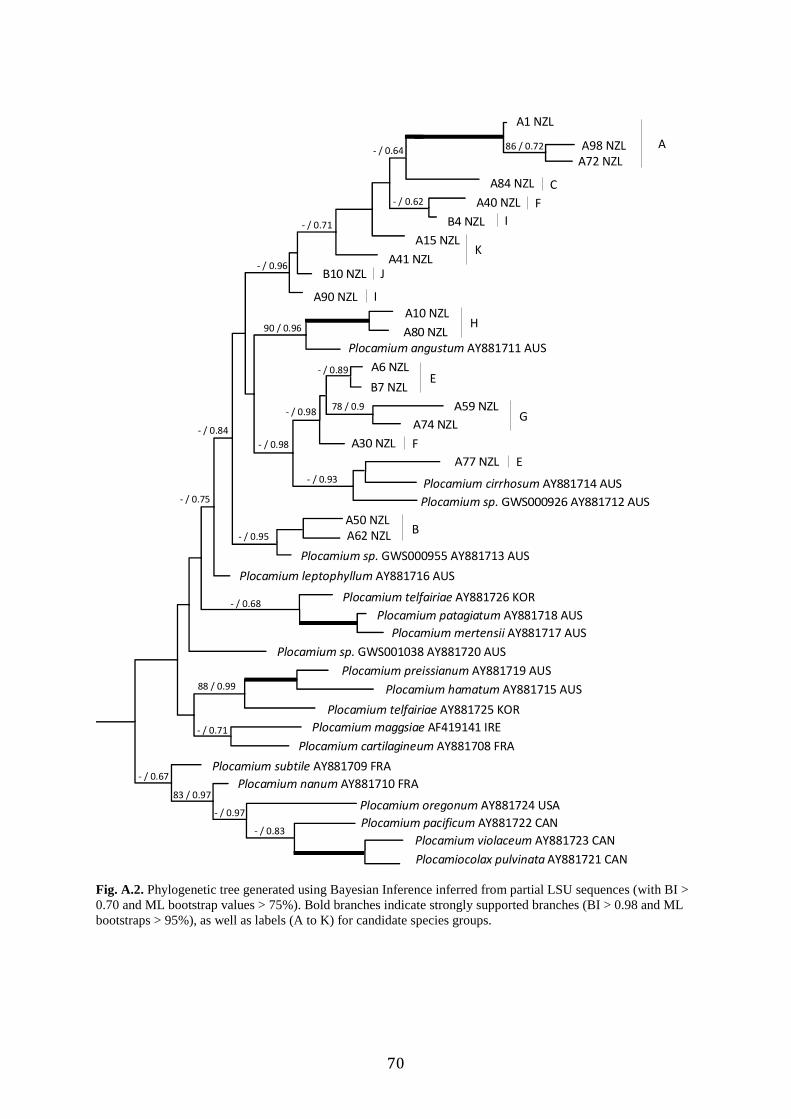
70
Fig. A.2. Phylogenetic tree generated using Bayesian Inference inferred from partial LSU sequences (with BI >
0.70 and ML bootstrap values > 75%). Bold branches indicate strongly supported branches (BI > 0.98 and ML
bootstraps > 95%), as well as labels (A to K) for candidate species groups.
A72 NZL
Plocamium cartilagineum AY881708 FRA
A15 NZL
A10 NZL
Plocamium leptophyllum AY881716 AUS
A41 NZL
A77 NZL
Plocamium pacificum AY881722 CAN
A90 NZL
Plocamium patagiatum AY881718 AUS
A40 NZL
A74 NZL
A6 NZL
B7 NZL
A30 NZL
Plocamium sp. GWS000926 AY881712 AUS
A80 NZL
Plocamium telfairiae AY881726 KOR
Plocamium angustum AY881711 AUS
A59 NZL
Plocamium cirrhosum AY881714 AUS
A84 NZL
Plocamium telfairiae AY881725 KOR
Plocamiummaggsiae AF419141 IRE
B10 NZL
A62 NZL
Plocamium subtile AY881709 FRA
A98 NZL
Plocamium sp. GWS000955 AY881713 AUS
Plocamium preissianum AY881719 AUS
A1 NZL
Plocamium hamatum AY881715 AUS
Plocamium oregonum AY881724 USA
Plocamium violaceum AY881723 CAN
B4 NZL
Plocamium nanum AY881710 FRA
Plocamium sp. GWS001038 AY881720 AUS
Plocamiocolax pulvinataAY881721 CAN
A50 NZL
Plocamiummertensii AY881717 AUS
- / 0.96
- / 0.71
- / 0.83
- / 0.97
83 / 0.97
- / 0.67
- / 0.71
88 / 0.99
- / 0.68
- / 0.95
- / 0.75
- / 0.84
- / 0.93
- / 0.89
78 / 0.9- / 0.98
- / 0.98
90 / 0.96
86 / 0.72- / 0.64
- / 0.62
G
H
E
E
F
B
A
C
K
I
J
F
I

71
Table A.7. Correlations between the original variables and the first two principal components in the
PCA for the 9 candidate species of the Plocamium species tested in the analysis. See Materials and
Methods for an expansion of the variables abbreviated here.
Variable Principal Component 1 Principal Component 2
WMA 0.450 -0.188
WLBR 0.466 -0.238
LLBR 0.444 0.289
NASR -0.412 -0.247
ANRAS -0.013 0.680
CBR -0.166 -0.489
SERBR 0.431 -0.247
Table A.8. Predicted results of the Discriminant Analysis. The table indicates 97.14% of the time
(misclassified I as K one time), considering the chosen diagnostic characters conjointly, the analysis is
able to correctly identify morphology reflective of genetic species delimitation.
Candidate species A B C E G H I J K P. cirrhosum P. microcladioides
A 6 0 0 0 0 0 0 0 0 0 0
B 0 3 0 0 0 0 0 0 0 0 0
C 0 0 1 0 0 0 0 0 0 0 0
E 0 0 0 6 0 0 0 0 0 0 0
G 0 0 0 0 2 0 0 0 0 0 0
H 0 0 0 0 0 4 0 0 0 0 0
I 0 0 0 0 0 0 2 0 0 0 0
J 0 0 0 0 0 0 0 1 0 0 0
K 0 0 0 0 0 0 1 0 6 0 0
P. cirrhosum 0 0 0 0 0 0 0 0 0 1 0
P. microcladioides 0 0 0 0 0 0 0 0 0 0 1
Table A.9. MANOVA test criteria and F approximation for the hypothesis of no overall group effect
indicating significant mean differences between “candidate species”
Statistic Value F Value
Num
DF Den DF Pr>F
Wilks’ Lamba <0.001 5.103 70 105.94 <0.0001
Pillai’s Trace 3.900 2.895 70 161 <0.0001
Hotelling-Lawley Trace 39.097 8.5375 70 107 <0.0001
Roy’s Greatest Root 26.542 61.407 10 23 <0.0001
Table A.10. One-Way ANOVA test criteria and F approximation for the individual characters
analyzed. The results of each ANOVA indicate significant differences between at least two of the
candidate species across all characters (WMA=Width of Main Axes, WLBR=Width of Lowest Basal
Ramuli, Length of Lowest Basal Ramuli, Number of Alternating Series of Ramuli, Average number of
Ramuli per Alternating Series, Curvature of the basal Ramuli, and Serration of Basal Ramuli).
Character F Value Num DF Den DF Pr>F
WMA 12.062 10 23 <0.0001
WLBR 4.52 10 23 0.0013
LLBR 4.149 10 23 0.0023
NASR 8.052 10 23 <0.0001
ANRAS 3.996 10 23 0.0029
CBR 2.859 10 23 0.018
SERBR 15.96 10 23 <0.0001

72
Table A.11. Results of the Tukey Tests multiple comparison of means 95% family-wise confidence
level for WMA.
Species p-value Species p-value
P. cirrhosum-
P. microcladioides
0.006 G-E 1
B-A 0.636 H-E 0.001
C-A 0.112 I-E < 0.001
E-A 0.170 J-E 1
G-A 0.834 K-E < 0.001
H-A 0.191 P. cirrhosum-E 1
I-A 0.029 P. microcladioides-E < 0.001
J-A 0.993 H-G 0.035
K-A 0.004 I-G 0.007
P. cirrhosum-A 0.682 J-G 1
P. microcladioides-A 0.019 K-G 0.002
C-B 0.812 P. cirrhosum-G 1
E-B 0.007 P. microcladioides-G 0.004
G-B 0.136 I-H 0.987
H-B 1 J-H 0.284
I-B 0.887 K-H 0.949
J-B 0.533 P. cirrhosum-H 0.051
K-B 0.748 P. microcladioides-H 0.531
P. cirrhosum-B 0.136 J-I 0.088
P. microcladioides-B 0.357 K-I 1
E-C 0.003 P. cirrhosum-I 0.013
G-C 0.024 P. microcladioides-I 0.937
H-C 0.938 K-J 0.052
I-C 1 P. cirrhosum-J 1
J-C 0.106 P. microcladioides-J 0.028
K-C 1 P. cirrhosum-K 0.006
P. cirrhosum-C 0.024 P. microcladioides-K 0.918
P. microcladioides-C 1
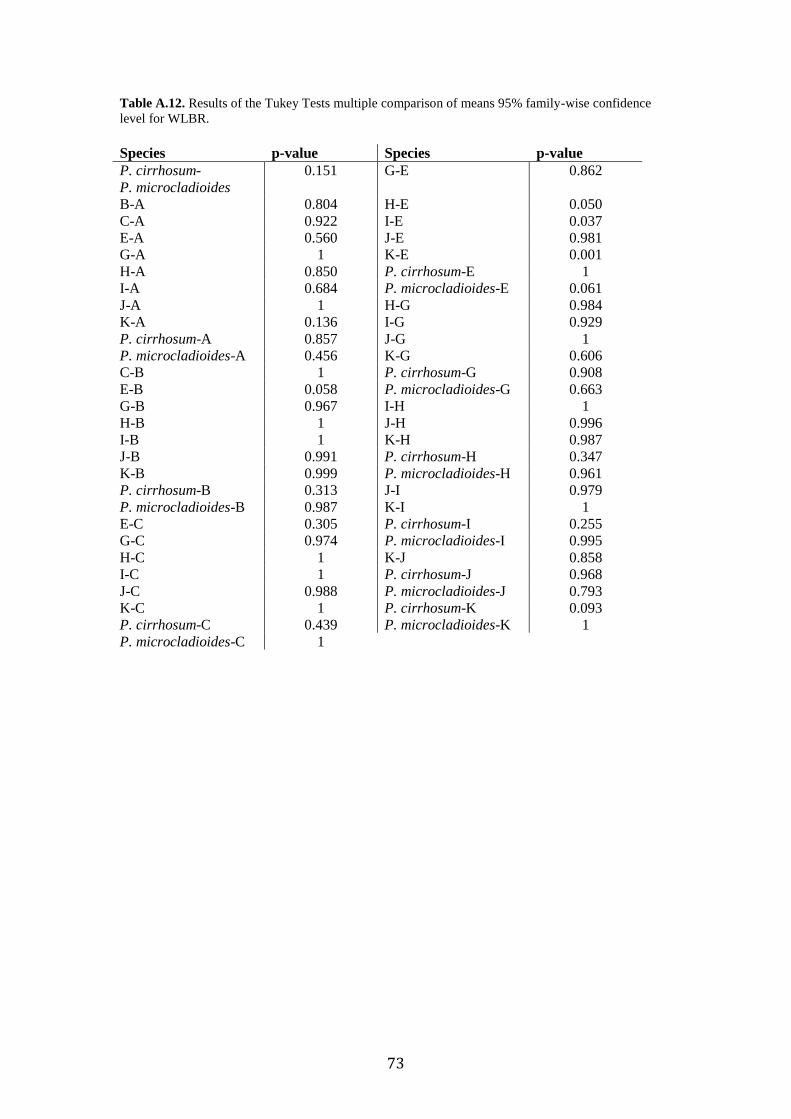
73
Table A.12. Results of the Tukey Tests multiple comparison of means 95% family-wise confidence
level for WLBR.
Species p-value Species p-value
P. cirrhosum-
P. microcladioides
0.151 G-E 0.862
B-A 0.804 H-E 0.050
C-A 0.922 I-E 0.037
E-A 0.560 J-E 0.981
G-A 1 K-E 0.001
H-A 0.850 P. cirrhosum-E 1
I-A 0.684 P. microcladioides-E 0.061
J-A 1 H-G 0.984
K-A 0.136 I-G 0.929
P. cirrhosum-A 0.857 J-G 1
P. microcladioides-A 0.456 K-G 0.606
C-B 1 P. cirrhosum-G 0.908
E-B 0.058 P. microcladioides-G 0.663
G-B 0.967 I-H 1
H-B 1 J-H 0.996
I-B 1 K-H 0.987
J-B 0.991 P. cirrhosum-H 0.347
K-B 0.999 P. microcladioides-H 0.961
P. cirrhosum-B 0.313 J-I 0.979
P. microcladioides-B 0.987 K-I 1
E-C 0.305 P. cirrhosum-I 0.255
G-C 0.974 P. microcladioides-I 0.995
H-C 1 K-J 0.858
I-C 1 P. cirrhosum-J 0.968
J-C 0.988 P. microcladioides-J 0.793
K-C 1 P. cirrhosum-K 0.093
P. cirrhosum-C 0.439 P. microcladioides-K 1
P. microcladioides-C 1

74
Table A.13. Results of the Tukey Tests multiple comparison of means 95% family-wise confidence
level for LLBR.
Species p-value Species p-value
P. cirrhosum-
P. microcladioides
0.055 G-E 1
B-A 0.997 H-E 0.008
C-A 0.983 I-E 0.992
E-A 0.376 J-E 1
G-A 0.823 K-E 0.690
H-A 0.553 P. cirrhosum-E 1
I-A 0.994 P. microcladioides-E 0.009
J-A 1 H-G 0.103
K-A 1 I-G 1
P. cirrhosum-A 0.868 J-G 1
P. microcladioides-A 0.151 K-G 0.954
C-B 1 P. cirrhosum-G 1
E-B 0.177 P. microcladioides-G 0.031
G-B 0.511 I-H 0.024
H-B 0.995 J-H 0.741
I-B 0.847 K-H 0.292
J-B 0.982 P. cirrhosum-H 0.223
K-B 0.951 P. microcladioides-H 0.841
P. cirrhosum-B 0.618 J-I 1
P. microcladioides-B 0.495 K-I 1
E-C 0.375 P. cirrhosum-I 0.997
G-C 0.563 P. microcladioides-I 0.068
H-C 1 K-J 1
I-C 0.833 P. cirrhosum-J 0.999
J-C 0.948 P. microcladioides-J 0.229
K-C 0.930 P. cirrhosum-K 0.956
P. cirrhosum-C 0.592 P. microcladioides-K 0.088
P. microcladioides-C 0.931

75
Table A.14. Results of the Tukey Tests multiple comparison of means 95% family-wise confidence
level for NASR.
Species p-value Species p-value
P. cirrhosum-
P. microcladioides
0.002 G-E 0.797
B-A 1 H-E 0.093
C-A 1 I-E 0.943
E-A 0.003 J-E 1
G-A 0.001 K-E 0.039
H-A 0.991 P. cirrhosum-E 0.999
I-A 0.326 P. microcladioides-E <0.001
J-A 0.730 H-G 0.016
K-A 0.984 I-G 0.291
P. cirrhosum-A 0.072 J-G 0.777
P. microcladioides-A 0.125 K-G 0.009
C-B 1 P. cirrhosum-G 1
E-B 0.018 P. microcladioides-G <0.001
G-B 0.004 I-H 0.912
H-B 0.994 J-H 0.976
I-B 0.463 K-H 1
J-B 0.761 P. cirrhosum-H 0.273
K-B 0.992 P. microcladioides-H 0.045
P. cirrhosum-B 0.098 J-I 1
P. microcladioides-B 0.204 K-I 0.853
E-C 0.159 P. cirrhosum-I 0.865
G-C 0.030 P. microcladioides-I 0.006
H-C 0.994 K-J 0.966
I-C 0.684 P. cirrhosum-J 0.981
J-C 0.802 P. microcladioides-J 0.030
K-C 0.993 P. cirrhosum-K 0.225
P. cirrhosum-C 0.184 P. microcladioides-K 0.036
P. microcladioides-C 0.613
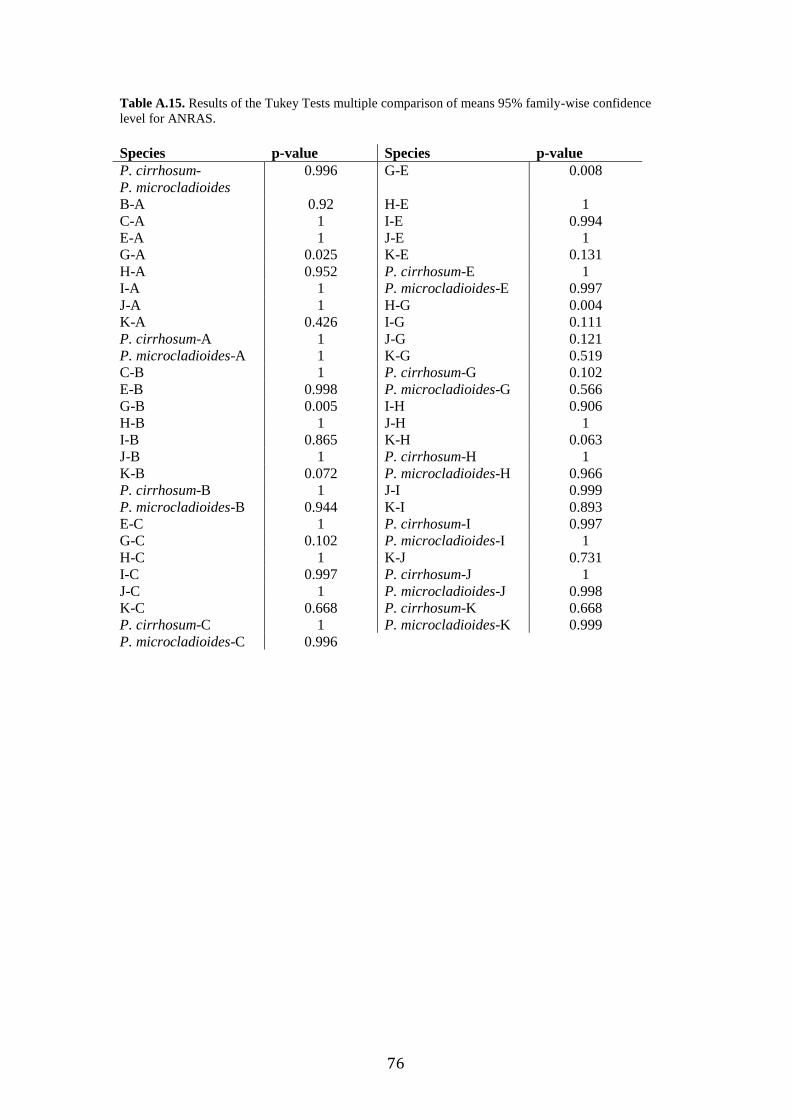
76
Table A.15. Results of the Tukey Tests multiple comparison of means 95% family-wise confidence
level for ANRAS.
Species p-value Species p-value
P. cirrhosum-
P. microcladioides
0.996 G-E 0.008
B-A 0.92 H-E 1
C-A 1 I-E 0.994
E-A 1 J-E 1
G-A 0.025 K-E 0.131
H-A 0.952 P. cirrhosum-E 1
I-A 1 P. microcladioides-E 0.997
J-A 1 H-G 0.004
K-A 0.426 I-G 0.111
P. cirrhosum-A 1 J-G 0.121
P. microcladioides-A 1 K-G 0.519
C-B 1 P. cirrhosum-G 0.102
E-B 0.998 P. microcladioides-G 0.566
G-B 0.005 I-H 0.906
H-B 1 J-H 1
I-B 0.865 K-H 0.063
J-B 1 P. cirrhosum-H 1
K-B 0.072 P. microcladioides-H 0.966
P. cirrhosum-B 1 J-I 0.999
P. microcladioides-B 0.944 K-I 0.893
E-C 1 P. cirrhosum-I 0.997
G-C 0.102 P. microcladioides-I 1
H-C 1 K-J 0.731
I-C 0.997 P. cirrhosum-J 1
J-C 1 P. microcladioides-J 0.998
K-C 0.668 P. cirrhosum-K 0.668
P. cirrhosum-C 1 P. microcladioides-K 0.999
P. microcladioides-C 0.996
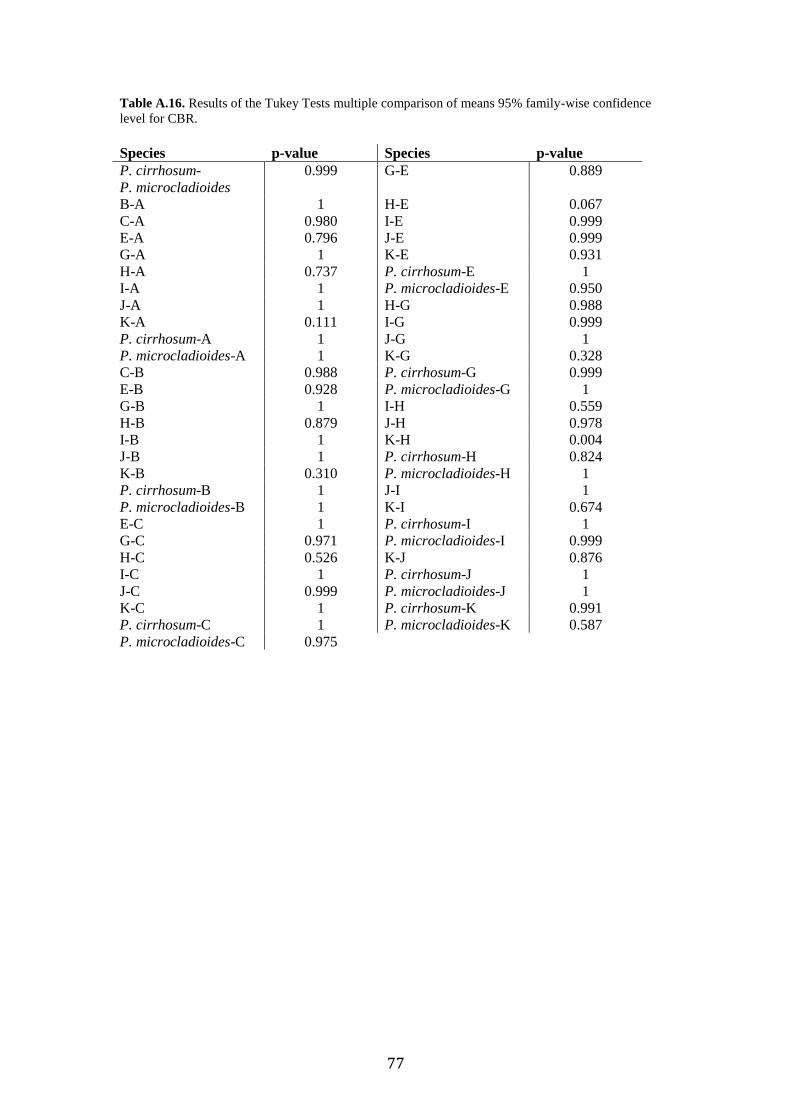
77
Table A.16. Results of the Tukey Tests multiple comparison of means 95% family-wise confidence
level for CBR.
Species p-value Species p-value
P. cirrhosum-
P. microcladioides
0.999 G-E 0.889
B-A 1 H-E 0.067
C-A 0.980 I-E 0.999
E-A 0.796 J-E 0.999
G-A 1 K-E 0.931
H-A 0.737 P. cirrhosum-E 1
I-A 1 P. microcladioides-E 0.950
J-A 1 H-G 0.988
K-A 0.111 I-G 0.999
P. cirrhosum-A 1 J-G 1
P. microcladioides-A 1 K-G 0.328
C-B 0.988 P. cirrhosum-G 0.999
E-B 0.928 P. microcladioides-G 1
G-B 1 I-H 0.559
H-B 0.879 J-H 0.978
I-B 1 K-H 0.004
J-B 1 P. cirrhosum-H 0.824
K-B 0.310 P. microcladioides-H 1
P. cirrhosum-B 1 J-I 1
P. microcladioides-B 1 K-I 0.674
E-C 1 P. cirrhosum-I 1
G-C 0.971 P. microcladioides-I 0.999
H-C 0.526 K-J 0.876
I-C 1 P. cirrhosum-J 1
J-C 0.999 P. microcladioides-J 1
K-C 1 P. cirrhosum-K 0.991
P. cirrhosum-C 1 P. microcladioides-K 0.587
P. microcladioides-C 0.975
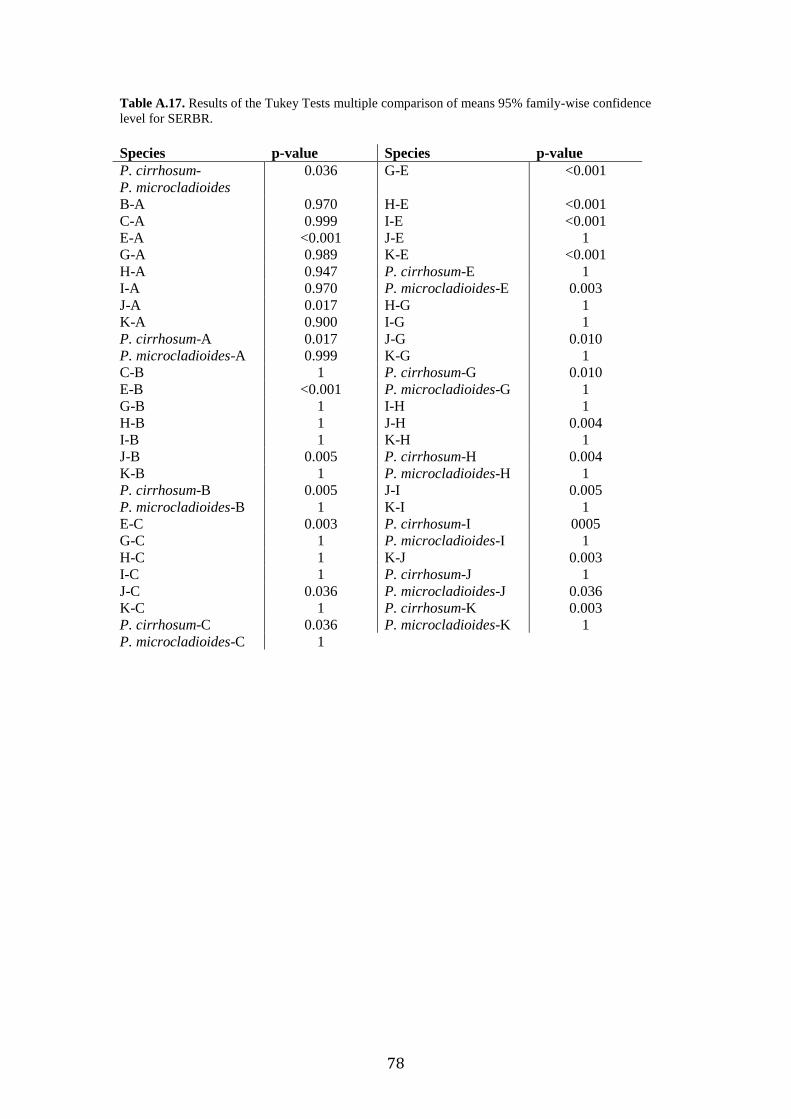
78
Table A.17. Results of the Tukey Tests multiple comparison of means 95% family-wise confidence
level for SERBR.
Species p-value Species p-value
P. cirrhosum-
P. microcladioides
0.036 G-E <0.001
B-A 0.970 H-E <0.001
C-A 0.999 I-E <0.001
E-A <0.001 J-E 1
G-A 0.989 K-E <0.001
H-A 0.947 P. cirrhosum-E 1
I-A 0.970 P. microcladioides-E 0.003
J-A 0.017 H-G 1
K-A 0.900 I-G 1
P. cirrhosum-A 0.017 J-G 0.010
P. microcladioides-A 0.999 K-G 1
C-B 1 P. cirrhosum-G 0.010
E-B <0.001 P. microcladioides-G 1
G-B 1 I-H 1
H-B 1 J-H 0.004
I-B 1 K-H 1
J-B 0.005 P. cirrhosum-H 0.004
K-B 1 P. microcladioides-H 1
P. cirrhosum-B 0.005 J-I 0.005
P. microcladioides-B 1 K-I 1
E-C 0.003 P. cirrhosum-I 0005
G-C 1 P. microcladioides-I 1
H-C 1 K-J 0.003
I-C 1 P. cirrhosum-J 1
J-C 0.036 P. microcladioides-J 0.036
K-C 1 P. cirrhosum-K 0.003
P. cirrhosum-C 0.036 P. microcladioides-K 1
P. microcladioides-C 1