a methodology for calculating the abstract of structures
TRANSCRIPT

A methodology for calculating the
response of structures to earthquakes
on specific faults
D.B. McCallen, F.E. Heuze, P.W. Kasameyer
Lawrence Livermore National Laboratory,
Livermore CA, USA
ABSTRACT
We are developing a methodology chain to estimate the response
of structures to large earthquakes from specific faults. The
methodology consists of three distinct steps: generation of synthetic
bedrock motion at the site of the structure due to a postulated large
earthquake; nonlinear effective stress analysis of the soil response at
the site to transform bedrock motion to surface motion; and
linear/nonlinear finite element analysis of the structure based on
the predicted surface motions. Progress in all steps is reported here.
INTRODUCTION
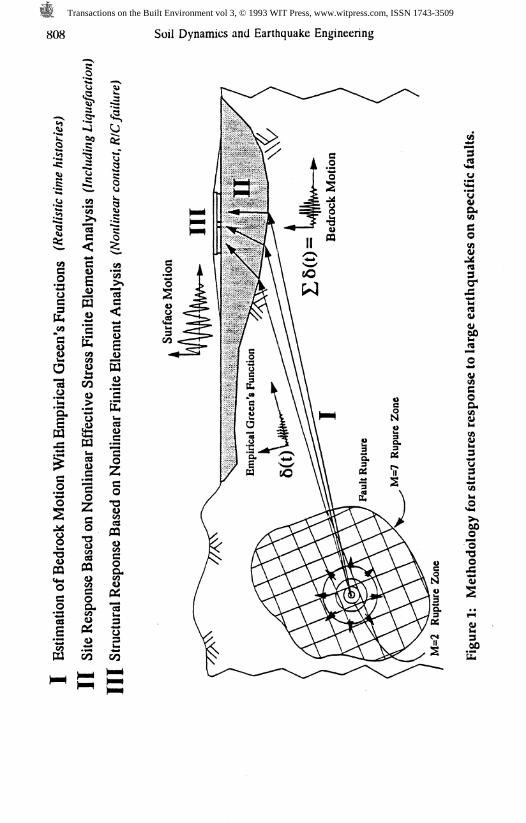
Our computational simulation of the seismic response of a
critical structure is illustrated in Figure 1. To envelope the motions
that might be observed at the structure site, the seismologists
develop a suite of possible earthquake rupture scenarios for each
fault that can contribute significant ground motion at the site. Field
instrumentation is placed in bedrock under the structure site, and
over a period of time, bedrock motions due to micro-earthquakes
emanating from the causative fault(s) are recorded. These
recordings serve as empirical Green's functions, which characterize
the motion at the structure site location due to slip of an elemental
segment of the fault. By appropriate summation of the responses
due to each element of the fault rupture zone for a given rupture
Transactions on the Built Environment vol 3, © 1993 WIT Press, www.witpress.com, ISSN 1743-3509
808 Soil Dynamics and Earthquake Engineering
•2 "2
Si
<§. I. a.
op
3
8.v eg g3 'SL .§
itimation of Bedrock Motion With Empirical Green's Functions (Keal
te Response Based on Nonlinear
Effective Stress Finite Element Anal
ructural Response Based on Nonlinear
Finite Element Analysis (Nonli
co co
(A
3
exCfl
OCO
<*o0)CDO
I
O
Transactions on the Built Environment vol 3, © 1993 WIT Press, www.witpress.com, ISSN 1743-3509

Soil Dynamics and Earthquake Engineering 809
scenario, the bedrock motion due to slip over a large area of the
fault (corresponding to a large magnitude earthquake) can be
estimated. By considering a suite of several possible fault rupture
models, which characterize the different manners in which the
fault rupture can propagate across the total fault rupture zone, a
suite of acceleration time histories is generated. That family of time
histories is representative of the range of ground accelerations that
could be expected at the site for a given size earthquake. Hutchings
et al. [1-3] have led the development of the empirical Green's
function technique and demonstrated the utility of this method
using Loma Prieta earthquake data and a suite of 25 rupture models
on the San Andreas fault [2].
The transmission of earthquake motion from bedrock through
the soil to the soil surface can result in significant modification of
the bedrock motion. Traditionally, the nonlinear behavior of the
soil under strong seismic motion has been modeled with
'equivalent linear' methods [4]. But such equivalent linear models
cannot describe the evolution of pore pressure and predict
liquefaction; i.e. they cannot perform the "effective-stress" analysis
which we deemed essential for this project. So, \ve are working in
partnership with Princeton University whose 3-D DYNAFLOW
model is capable of seismic effective stress analysis [5].
Nonlinear structural-response computations are being performed
with nonlinear finite element software developed at LLNL. The
implicit, nonlinear, finite deformation program NIKE3D [6]
principally is being used to model the structures. NIKE3D has a
number of nonlinear constitutive models and advanced contact-
surface capabilities for modeling gap opening and closing.
The seismic analysis procedures and capabilities under
development are being applied to two transportation structures in
California. The first structure is the Dumbarton Bridge, which is the
southern-most crossing of the San Francisco Bay. The second is the
Painter Street Bridge at Rio Dell, in northern California. This paper
focuses on the Painter Street Bridge, which has been heavily
instrumented by the California Department of Mines and Geology
(CDMG). The high rate of occurrence of earthquakes in that
Transactions on the Built Environment vol 3, © 1993 WIT Press, www.witpress.com, ISSN 1743-3509

810 Soil Dynamics and Earthquake Engineering
seismically active region of northern California has allowed the
measurement of response of this bridge to a number of significant
earthquakes. In April 1992, three earthquakes with magnitudes up
to 7.0 occurred within close proximity to Rio Dell and the Painter
Street Bridge location (Figure 2); they are called the Petrolia
earthquake and aftershocks. During the largest of these shocks, the
Painter Street Bridge was shaken violently, with lateral deck
accelerations up to 1.23 times gravity. These accelerations are among
the largest ever measured on a structure during an earthquake.
Prior to the April earthquakes, McCalien, et al. [7] had constructed a
detailed finite element model of the Painter Street bridge/abutment
system (Figure 3) and had performed detailed parameter studies on
the dynamic response of the system. Since an extensive modeling
effort had already been initiated on this bridge, the latest set of
quakes was a fortuitous event, that offered a new opportunity for
validating our methodology in a location of strong ground motion.
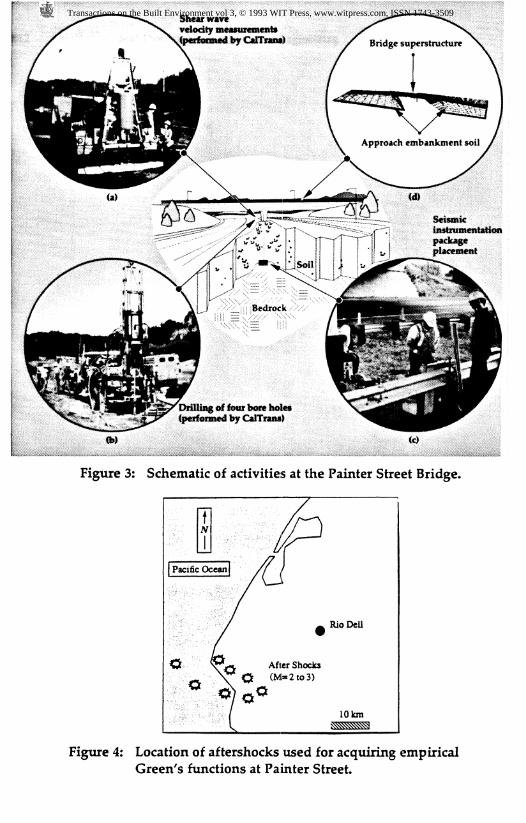
PROGRESS
As a result of the Petrolia quakes, the LLNL efforts at the Painter
Street site have been scaled up significantly. At our request, the
California Department of Transportation drilled four new
boreholes, two in the abutments and two at road level (Figure 3).
The soil-rock interface was about 24 m below road elevation. Core
samples of soils were tested in cyclic triaxial compression at the
University of California, Berkeley. One of the road-level holes was
used for up-hole S-wave surveying. A seismometer was emplaced
6 m into bedrock in the other road-level hole. Another
seismometer was emplaced 1 m into the ground, near the collar of
that hole. The package at bedrock depth is currently being used by
seismologists to measure empirical Green's functions for micro-
earthquakes emanating from nearby faults, including those
causative of the Petrolia shocks. To date, Painter Street site bedrock
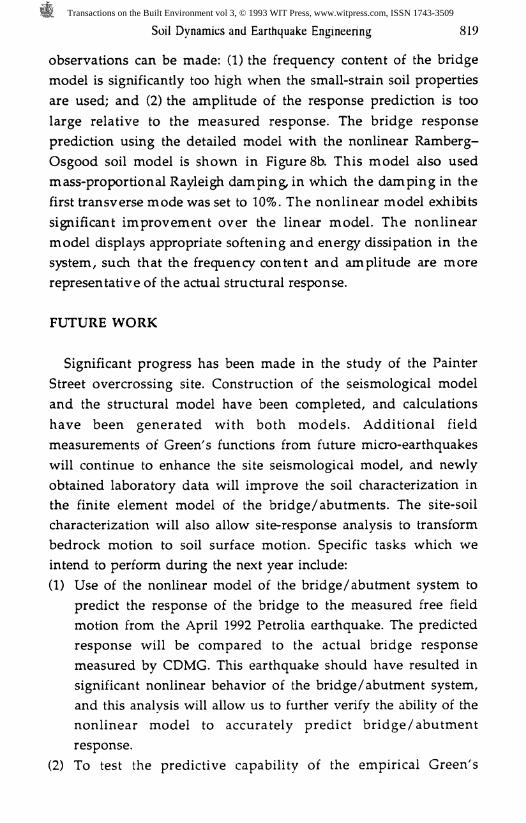
responses have been measured for eight micro-earthquakes
emanating from the fault locations indicated in Figure 4. Based on
the empirical Green's functions obtained from these measurements,
Transactions on the Built Environment vol 3, © 1993 WIT Press, www.witpress.com, ISSN 1743-3509

Soil Dynamics and Earthquake Engineering 811
M=6.0 Aftershock]Cape Mendocino
\M=6.5 AftershockM=7.0 Epicenter \
I
# Petrolia101cm
Figure 2: The Painter Street Bridge in Rio Dell, CA, and location ofthe Petrolia Earthquakes of April 1992.
Transactions on the Built Environment vol 3, © 1993 WIT Press, www.witpress.com, ISSN 1743-3509
Shear wavevelocity measurements, (performed by CalTrans> Bridge superstructure
Approach embankment soil
Seismicinstrumentationpackageplacement
Drilling of tour bore holes(performed by CaJTrans)
Figure 3: Schematic of activities at the Painter Street Bridge.
Rio Dell
Figure 4: Location of aftershocks used for acquiring empiricalGreen's functions at Painter Street.
Transactions on the Built Environment vol 3, © 1993 WIT Press, www.witpress.com, ISSN 1743-3509

Soil Dynamics and Earthquake Engineering 813
synthetic bedrock-ground-motion time histories have recently been
generated for a number of earthquakes of magnitude M = 7.0.
Samples of Painter Street site synthetic time histories, each based on
a different fault rupture propagation model, are shown in Figure 5.
In parallel to the seismological work, finite element modeling of
the Painter Street bridge/abutment system has progressed into the
nonlinear regime. For dynamic analyses, the superstructure, pile
foundation, and approach embankment soil masses have been
modeled as shown in Figure 6. Nonlinear hysteretic behavior of the
soil embankments has been experimentally identified as a very
important factor in the dynamic response of such a bridge system [8,
9]. The primary objective of constructing a detailed, three-
dimensional model of the bridge/soil system was to allow
incorporation of the effects of nonlinear soil stiffness and soil mass.
This is in contrast to finite element models which are used in
traditional design and analysis for this type of bridge; such models
neglect the soil mass, and the soil stiffness typically is represented by
linear elastic, amplitude-independent springs. For the Painter Street
non linear analyses, the detailed finite element model is truncated
at approximately the original ground surface elevation, and the
surface free field motion is applied directly to the base of the model
at that elevation (Fig. 3). This approach neglects potential soil-
structure interaction effects between the piles and soil below this
level, and prevents radiation of energy vertically back into the soil.
However, interaction between the soil and piles typically occurs in
the top portion of the piles, and energy loss through radiation will
be small relative to the energy dissipated by the nonlinear hysteretic
behavior of the soil embankments.
The small-amplitude shear moduli for the approach
embankments and original grade soils were estimated from our P
and S-wave surface refraction measurements [10]. To represent the
nonlinearity of the soil in the bridge/abutment finite element
model, the small-strain shear moduli obtained from these
measurements were used with standard soil modulus degradation
and damping curves [11]. To represent the standardized modulus
degradation and damping curves in the NIKE3D finite element code,
Transactions on the Built Environment vol 3, © 1993 WIT Press, www.witpress.com, ISSN 1743-3509

814 Soil Dynamics and Earthquake Engineering
W)"oo***'§2jj
<
0.60-0.20--0.20--0.60-.1 00-
1 1 f— 1 (-L Rupture Model MPEOO|
— uuWUlMlAAMkril lj|jll iyi/ A rkJu_rtAJ^ rnvpY r MwW" 1 1 " "— -
Fault Rupture Plane 10 15 20 30
10 15 20 25 30
10
10
15 20 25
co"cov-c,02JU
<
0.60-0.20--0.20--0.60--1 00-
1 1 1 hL Rupture Model MPE16
: ^ ^ ^— j
30
15
Acceleration (g's)
0.60-
0.20-
-0.20-
-0.60--1 00-
L Rupture Model MPE08
' - nw uWWkjJkw*
-
: 1 1 1 1 :20 25 30
Acceleration (g's)
0.60-
0.20-
-0.20-
-0.60-
L Rupture Model MPE04
- ..u, jJljL,..i,i., , -^ " " "' "'"'WYf|^
5 10 15 20 25 30Time (sec)
Figure 5: Five fault rupture scenarios, and resulting bedrockmotion under the Painter Street Bridge. (M = 7.0)
Transactions on the Built Environment vol 3, © 1993 WIT Press, www.witpress.com, ISSN 1743-3509

Superstructure
& Foundation
Superstructure
Detail
System
Figure 6: Detailed finite element model of the Painter Street Bridge, its abutments and foundations.
CO
g.mCJ
Transactions on the Built Environment vol 3, © 1993 WIT Press, www.witpress.com, ISSN 1743-3509

816 Soil Dynamics and Earthquake Engineering
a simple Ramberg-Osgood constitutive model was used to model
the soil. The material parameters were set such that the Ramberg-
Osgood hysteresis loop would yield modulus degradation and
damping curves very similar to Seed's standardized curves [11]. The
procedure for determining the Ramberg-Osgood parameters to
approximate given modulus degradation and damping curves was
developed by Ueng and Chen [12]. The modulus and damping
curves obtained from the Ramberg-Osgood constitutive model fit
with Ueng and Chen's technique are shown in Figure 7 along with
the original curves of Seed. The shear stress-strain behavior
generated with the fitted Ramberg-Osgood model in the NIKE3D
finite element program also is shown in Figure 7.
A number of time history analyses have been carried out with the
detailed bridge abutment model shown in Figure 3, as well as with
simple reduced-order stick models of the bridge [13]. The bridge
instrumentation records for the April 1992 Petrolia earthquakes
have not yet been completely processed by the CDMG; thus, the
measured free field motions were not available to apply to our
model prior to this report. However, free field and bridge-response
data for a magnitude 5.5 earthquake of November 1986 were
available and were used to examine the accuracy of the finite
element models of the bridge system.
The 1986 free-field acceleration time histories were used as input
motion to the base of the bridge system models. The model
response predictions were compared to the actual bridge response
data measured by the CDMG bridge instrumentation array. Since
the details of all of the response predictions are given elsewhere [13],
only an illustrative example of the response predictions is provided
here. The detailed model response predictions for the absolute
displacement at channel 7 (transverse motion at mid-span) are
shown in Figure 8. Figure 8a shows the response of the detailed
model when a linear elastic soil model is used, and mass- and
stiffness-proportional Rayleigh damping is used to provide
approximately 5% damping in the first transverse and longitudinal
modes of the bridge system. For the linear analysis, soil properties
were set equal to the small-strain soil properties [10]. Two
Transactions on the Built Environment vol 3, © 1993 WIT Press, www.witpress.com, ISSN 1743-3509

i
30.00
25.00-:
20.00-
15.00- L
10.00
5.00
0.00
Secant Shear Modulus vs. Strain Level
- Ramberg-Osgood modelSeed et. al. sand curve
0.1Shear Strain (percent)
Damping Ratio vs Strain Level
10
4- 4- 4- 4-Ramberg-Osgood Model
- Seed et. al. sand curves
0.001 0.1Shear Strain (percent)
10
Soil Stress-Strain Behavior
2.00-
1.00 +
0.00
-i.oo-
-2.00--
-3.00
±-NikeSD Finite Element Program(Ramberg-Osgood model)
4-
/\
I-0.010 -0.005 0.000 0.005 0.010
Shear Strain (Rad.)
BnV)pjc.tn
era
Figure 7: Non-linear model of bridge abutment for initial 3-D dynamic analysis.
Transactions on the Built Environment vol 3, © 1993 WIT Press, www.witpress.com, ISSN 1743-3509

818 Soil Dynamics and Earthquake Engineering
Painter Street SeismicInstrumentation Layout
Ch 6 Ch 5AChl9
Yd 13Ch2^
Chi
-Chi
F dew _ ^Chl4
1.5
1.0 —
| 0.5 -jr8•1. ™
a -i.o —
-1.5
Channel 7 (measured)Channel 7 (detailed model with5% damping in selected modes)
0.0 1.0 2.0 3.0 4.0 5.0 6.0Time (sec.)
7.0 8.0
1.57 (measured)7 (detailed model with
Ramberg-Osgood soil model)
3.0 4.0 5.0Time (sec.)
6.0 7.0 8.0
Figure 8: Comparison of Painter Street Bridge response for M = 5.5event, using linear and non-linear soil models.
Transactions on the Built Environment vol 3, © 1993 WIT Press, www.witpress.com, ISSN 1743-3509
Soil Dynamics and Earthquake Engineering 819
observations can be made: (1) the frequency content of the bridge
model is significantly too high when the small-strain soil properties
are used; and (2) the amplitude of the response prediction is too
large relative to the measured response. The bridge response
prediction using the detailed model with the nonlinear Ramberg-
Osgood soil model is shown in Figure 8b. This model also used
mass-proportional Rayleigh damping, in which the damping in the
first transverse mode was set to 10%. The nonlinear model exhibits
significant improvement over the linear model. The nonlinear
model displays appropriate softening and energy dissipation in the
system, such that the frequency content and amplitude are more
representative of the actual structural response.
FUTURE WORK
Significant progress has been made in the study of the Painter
Street overcrossing site. Construction of the seismological model
and the structural model have been completed, and calculations
have been generated with both models. Additional field
measurements of Green's functions from future micro-earthquakes
will continue to enhance the site seismological model, and newly
obtained laboratory data will improve the soil characterization in
the finite element model of the bridge/abutments. The site-soil
characterization will also allow site-response analysis to transform
bedrock motion to soil surface motion. Specific tasks which we
intend to perform during the next year include:
(1) Use of the nonlinear model of the bridge/abutment system to
predict the response of the bridge to the measured free field
motion from the April 1992 Petrolia earthquake. The predicted
response will be compared to the actual bridge response
measured by CDMG. This earthquake should have resulted in
significant nonlinear behavior of the bridge/abutment system,
and this analysis will allow us to further verify the ability of the
nonlinear model to accurately predict bridge/abutment
response.
(2) To test the predictive capability of the empirical Green's
Transactions on the Built Environment vol 3, © 1993 WIT Press, www.witpress.com, ISSN 1743-3509

820 Soil Dynamics and Earthquake Engineering
function approach, generate the suite of 25 time histories that
would be used to model a M=7.0 event on the fault causative of
the Petrolia earthquake.
(3) The bedrock-motion time histories will be transformed to
surface motion with a soil response analysis, and the suite of
surface time histories will be compared to the actual free field
motion measured at the site by CDMG.
(4) The suite of predicted free field responses will be run through
the structural model, and response statistics will be compared to
the actual response from the April 1992, M = 7.0, earthquake.
The ultimate goal of our project is to allow accurate site-specific
estimates of structural response for a specified earthquake on a
specified fault. For practical applications of this methodology, it will
be essential to decide how the structural engineer may best use the
information provided by the suite of time histories developed by
the seismological portion of the study. It will generally be
impractical to perform 25 time history analyses (or more if multiple
faults/multiple rupture zones are considered) for a large structural
model. It is necessary to consolidate the information obtained from
the time histories into a simplified form (e.g., a representative
response spectrum and corresponding single time history) to
achieve practical application.
The Painter Street site study will allow a critical evaluation of the
accuracy of the method that is being developed, and a
demonstration of our technology in all segments of the
methodology chain. It will also provide an opportunity for
interaction between structural analysts and seismologists, so that
appropriate procedures for using the earthquake ground motion in
structural response calculations can be developed.
The Dumbarton bridge, a much larger structure founded on piles
and soft soils, will be the object of our second application of the
entire methodology. It will exercise the effective stress models for
earthquakes up to M = 7.5 on the Hayward Fault and M = 8.0 on the
San Andreas Fault.
Transactions on the Built Environment vol 3, © 1993 WIT Press, www.witpress.com, ISSN 1743-3509

Soil Dynamics and Earthquake Engineering 821
REFERENCES
1. L. Hutchings, "Modeling Earthquake Ground Motion with an
Earthquake Simulation Program (EMPSYN) that Utilizes
Empirical Green's Functions", Lawrence Livermore National
Laboratory, Livermore, California, UCRL-ID-105890, (1992).
2. L. Hutchings, "Prediction of Strong Ground Motion for the
1989 Loma Prieta Earthquake, Using Empirical Green's
Functions", Bull. Seismological Society of America, vol. 81, no.
5, pp 1813-1837, (1991).
3. L. Hutchings, "Empirical Green's Functions from Small
Earthquakes: A Waveform Study of Locally Recorded
Aftershocks of the 1971 San Fernando Earthquake",
/. Geophysical Research, vol. 95, no. B2, pp 1187-1214, (1990).
4. P.B. Schnabel, H.B. Seed, and J. Lysmer, "SHAKE—A
Computer Program for Earthquake Response Analysis of
Horizontally Layered Sites", Earthquake Engineering Research
Center, University of California, Berkeley, California, Report
EERC-72-12, (1972).
5. J.H. Prevost, "DYNAFLOW, User's Manual", Department of
Civil Engineering, Princeton University, (1992).
6. B.N. Maker, R.M. Ferencz, and J.O. Hallquist, "NIKE3D: A
Nonlinear, Implicit, Three-Dimensional Finite Element Code
for Solid and Structural Mechanics", Lawrence Livermore
National Laboratory, Livermore, California, UCRL-MA-105268,
(1992).
7. D.B. McCallen, K.M. Romstad, and G.L. Goudreau, "Dynamic
Response of a Reinforced Concrete Box-Girder Bridge,"
Lawrence Livermore National Laboratory, Livermore,
California, UCRL-53868-91, pp 2-12 (1992).
8. J.C. Wilson, and B.S. Tan, "Bridge Abutments: Assessing Their
Influence on Earthquake Response of Meloland Road
Overpass", ASCE J. Engineering Mechanics, vol. 226, no. 8, pp
1838-1856, (1990).
Transactions on the Built Environment vol 3, © 1993 WIT Press, www.witpress.com, ISSN 1743-3509

822 Soil Dynamics and Earthquake Engineering
9. S.D. Werner, J.L. Beck, and M.B. Levine, "Seismic Response
Evaluation of Meloland Road Overpass Using 1979 Imperial
Valley Earthquake Records", Earthquake Engineering and
Structural Dynamics, vol. 15, pp 249-274, (1987).
10. RE. Heuze and R.P. Swift, "Seismic Refraction Studies at the
Painter Street Bridge Site, Rio Dell, California", Lawrence
Livermore National Laboratory, Livermore, California,
UCRL-ID-108595, (1992).
11. H.B. Seed, R.T. Wong, I.M. Idriss, and K. Tokimatsu, "Moduli
and Damping Factors for Dynamic Analysis of Cohesionless
Soils", Earthquake Engineering Research Center, University of
California, Berkeley, California, Report EERC-84/14, (1984).
12. T.S. Ueng, and J.C. Chen, "Computational Procedure for
Determining Parameters in Ramberg-Osgood Elastoplastic
Model Based on Modulus and Damping Versus Strain",
Lawrence Livermore National Laboratory, Livermore,
California, UCRL-ID-111487 (1992).
13. D.B. McCallen and K.M. Romstad, "Dynamic Response of a
Reinforced Concrete, Box-Girder Bridge", Lawrence Livermore
National Laboratory, Livermore, California, UCRL-ID-110640,
(1992).
ACKNOWLEDGMENTS
This work performed by the Lawrence Livermore National
Laboratory under contract W-7405-ENG-48 with the U. S.
Department of Energy. We thank S. Uhlhorn for her fine typing.
U.S. Government
Transactions on the Built Environment vol 3, © 1993 WIT Press, www.witpress.com, ISSN 1743-3509