photogrammetry methodology development for gossamer ... · photogrammetry methodology development...
TRANSCRIPT

NASA/TM-2002-211739
Photogrammetry Methodology Development
for Gossamer Spacecraft Structures
Richard S. Pappa and Thomas W. Jones
Langley Research Center, Hampton, Virginia
Jonathan T. Black
Joint Institute for Advancement of Flight Sciences
George Washington University
Langley Research Center, Hampton, Virginia
Alan Walford
Eos System, Inc., Vancouver, Canada
Stuart Robson
University College London, London, United Kingdom
Mark R. Shortis
University of Melbourne, Parkville, Australia
June 2002
https://ntrs.nasa.gov/search.jsp?R=20020060459 2018-05-30T00:02:27+00:00Z

The NASA STI Program Office ... in Profile
Since its founding, NASA has been dedicated to
the advancement of aeronautics and spacescience. The NASA Scientific and Technical
Information (STI) Program Office plays a key
part in helping NASA maintain this importantrole.
The NASA STI Program Office is operated by
Langley Research Center, the lead center forNASA's scientific and technical information. The
NASA STI Program Office provides access to the
NASA STI Database, the largest collection of
aeronautical and space science STI in the world.
The Program Office is also NASA's institutional
mechanism for disseminating the results of its
research and development activities. These
results are published by NASA in the NASA STI
Report Series, which includes the following
report types:
TECHNICAL PUBLICATION. Reports of
completed research or a major significant
phase of research that present the results of
NASA programs and include extensive
data or theoretical analysis. Includes
compilations of significant scientific andtechnical data and information deemed to
be of continuing reference value. NASA
counterpart of peer-reviewed formal
professional papers, but having less
stringent limitations on manuscript length
and extent of graphic presentations.
TECHNICAL MEMORANDUM. Scientific
and technical findings that are preliminary
or of specialized interest, e.g., quick release
reports, working papers, and
bibliographies that contain minimalannotation. Does not contain extensive
analysis.
CONTRACTOR REPORT. Scientific and
technical findings by NASA-sponsored
contractors and grantees.
CONFERENCE PUBLICATION. Collected
papers from scientific and technical
conferences, symposia, seminars, or other
meetings sponsored or co-sponsored byNASA.
SPECIAL PUBLICATION. Scientific,
technical, or historical information from
NASA programs, projects, and missions,
often concerned with subjects having
substantial public interest.
TECHNICAL TRANSLATION. English-
language translations of foreign scientific
and technical material pertinent to NASA'smission.
Specialized services that complement the STI
Program Office's diverse offerings include
creating custom thesauri, building customized
databases, organizing and publishing research
results ... even providing videos.
For more infmwnation about the NASA STI
Program Office, see the following:
• Access the NASA STI Program Home Page
at http://www.sti.nasa.gov
• E-mail your question via the Intemet to
• Fax your question to the NASA STI Help
Desk at (301) 621-0134
• Phone the NASA STI Help Desk at
(301) 621-0390
Write to:
NASA STI Help Desk
NASA Center for AeroSpace Infommtion7121 Standard Drive
Hanover, MD 21076-1320

NASA/TM-2002-211739
Photogrammetry Methodology Development
for Gossamer Spacecraft Structures
Richard S. Pappa and Thomas W. Jones
Langley Research Center, Hampton, Virginia
Jonathan T. Black
Joint Institute for Advancement of Flight Sciences
George Washington University
Langley Research Center, Hampton, Virginia
Alan Walford
Eos System, Inc., Vancouver, Canada
Stuart Robson
University College London, London, United Kingdom
Mark R. Shortis
University of Melbourne, Parkville, Australia
National Aeronautics and
Space Administration
Langley Research Center
Hampton, Virginia 23681 2199
June 2002

The use of trademarks or names of manufacturers in the report is for accurate reporting and does not constitute anofficial endorsement, either expressed or implied, of such products or manufacturers by the National Aeronauticsand Space Administration.
Available from:
NASA Center for AeroSpace Information (CASI)
7121 Standard Drive
Hanover, MD 21076-1320
(301) 621-0390
National Technical Information Service (NTIS)
5285 Port Royal Road
Springfield, VA 22161-2171
(703) 605-6000

Photogrammetry Methodology Development for
Gossamer Spacecraft Structures
Richard S. Pappa
NASA Langley Research Center
Hampton, VA 23681
Thomas W. Jones
NASA Langley Research Center
Hampton, VA 23681
Jonathan T. Black
George Washington University
Hampton, VA 23681
Alan Walford
Eos Systems, Inc.
Vancouver, Canada
Stuart Robson
University College London
London, United Kingdom
Mark R. Shortis
University of Melbourne
Parkville, Australia
ABSTRACT
Photogrammetry--the science of calculating 3D
object coordinates from images--is a flexible and robust
approach for measuring the static and dynamic
characteristics of future ultra-lightweight and inflatable
space structures (a.k.a., Gossamer structures), such as
large membrane reflectors, solar sails, and thin-film
solar arrays. Shape and dynamic measurements are
required to validate new structural modeling techniques
and corresponding analytical models for these
unconventional systems. This paper summarizes
experiences at NASA Langley Research Center over
the past three years to develop or adapt
photogrammetry methods for the specific problem of
measuring Gossamer space structures. Turnkey
industrial photogrammetry systems were not considereda cost-effective choice for this basic research effort
because of their high purchase and maintenance costs.
Instead, this research uses mainly off-the-shelf digital-
camera and software technologies that are affordable to
most organizations and provide acceptable accuracy.
INTRODUCTION
Photogrammetry is the science of measuring the
size and location of 3D objects using photographs.1 The
classical application (known as topographic
photogrammetry) is for creating aerial land surveys and
maps. There are also many ground-based applications
(known as non-topographic or close-range
photogrammetry) in such diverse fields as archaeology,
bioengineering, civil engineering, computer animation,
forensic analysis, historical preservation, mechanical
inspection, plant engineering, ship construction, and
surgery.: Modern close-range photogrammetry uses
digital imaging sensors 3and computer data analysis and
often measures hundreds or thousands of object points.
The fundamental theory is based on surveying
principles. 4 When dealing with time sequences of
images, the term "videogrammetry" or "videometrics"is used to describe this technology. 5 Photogrammetry
offers the simplicity of taking photographs coupled
with good to excellent measurement precision.
New analytical and experimental methods for
shape and dynamic characterization of future Gossamer
space structures, such as large membrane reflectors,
solar sails, and thin-film solar arrays, are being
developed at the NASA Langley Research Center(LaRC) and elsewhere. 6 Accurate analytical methods
are required for confident design of new or evolved
structural concepts and for mission simulations.
Correspondingly, experimental methods are required
for measuring the shape and dynamic characteristics of
research test articles and prototypes, which will
typically be scale models, in either air or vacuumenvironments. Accurate test data are needed to validate
analytical methods for these structures in one or more
of the following three conditions: stationary (static
shape), vibrating (modes of vibration), or deploying
(deployment dynamics).
The selected technical focus for making these
measurements is close-range photogrammetry, a
flexible and robust technology with demonstrated
potential for measuring Gossamer-type structures. 7-9
Static shape measurements are the simplest to make,
requiring two or more still photographs of the structure
from convergent viewing directions. Vibration
measurements are more difficult to obtain, requiring
synchronized image sequences from multiple cameras.

With vibratingstructures,off-linedataanalysisissimplerthanreal-timeanalysis,whichneedsspecialhardwareand softwareand can be limitedbycomputationalspeedto a few simultaneousmeasurementpoints.Themostdifficultsituationisquantitativemeasurementof theunsteadydynamiccharacteristicsofinflatingordeployingstructures.Thiscaseis like vibrationmeasurement,butmustalsohandlelargegeometrychangesandtargetobstructionsthatcanoccurasafunctionoftime.
Industrialphotogrammetrysystemsareavailablefor makinghighlyaccurate(1 part in 100,000+)structuralmeasurements.1°'11However,theywerenotconsidereda cost-effectivechoicefor this basicresearcheffort(whichincludescollaborativeresearchanddevelopmentin academiaandsmallbusinesses)becauseoftheirhighpurchaseandmaintenancecosts.Totheextentpossible,thisworkusesconsumerdigital-cameraandsoftwaretechnologiesthatareaffordabletomostorganizationsandprovideacceptableaccuracy.Occasionally,a GeodeticServicesInc. V-STARSindustrialphotogrammetrysystemcanbeborrowedformeasurementcomparisons.*
Theobjectiveof thispaperis to documentinitialexperiencesat theNASALangleyResearchCenterusing various hardwareand software forphotogrammetryofGossamerresearchstructures.Thepaperhastwosections.Thefirstsectionsummarizesexperienceswith sevenlaboratorytest articles,illustratingsomeadvantagesandchallengesofimage-basedmeasurementofGossamerstructures.Thesecondsectionexplainsthetenmainstepsof close-rangephotogrammetryusingrecentdatafroma2-msolarsailmodelasanexample.
TESTARTICLES
Figure 1 shows seven Gossamer-class test articles
measured with photogrammetry at LaRC. The first
three are flight prototypes suitable for use in space
(Figs. la-lc), and the others are generic research
structures built for technology development purposes
only. The following subsections discuss salient points
1-Throughoutthe paper, references to specific commercialitems used
in this research are not an official endorsementor promotionof any
productbyNASA or theUnited Statesgovernment.
of each project.
1. 5-m inflatable parabolic reflector
Figure la is a 5-m-diameter inflatable parabolic
membrane reflector, which weighs only about 4 kg. In
space, it can serve as either a microwave antenna or asolar concentrator. The 3D coordinates of 521 attached
retroreflective targets were measured with
photogrammetry using four Kodak DC290 (2.1-
megapixel) digital cameras. These cameras had the
highest resolution of any consumer model at the time.
The test occurred in a closed chamber to minimize air
currents. Estimated measurement precisions were
1:28,000 (1 part in 28,000) in the horizontal direction,
1:14,000 in the vertical direction, and 1:5,000 in thecamera direction. Later tests showed that measurement
precision would improve somewhat by increasing the
number of camera locations (from four to nine), their
angular separation, or the image resolution. The focal
length of a best-fit parabolic surface for the
measurements was 3.050 m, which closely correlated
with the design focal length of 3.048 m. The root-mean-
square deviation from an ideal parabolic shape wasabout 1.5 ram. Additional details of this work are
published elsewhere.12
2. 1-m flexible Fresnel lens
Figure lb shows test configurations for static-shape
(top) and dynamic (bottom) measurements of a 1-m-
long, membrane solar concentrator. These tests
supported development of a proposed space flight
experiment. 13 The test article is a patented, flexible
Fresnel lens that refracts light onto a narrow line of
solar cells, requiring only 12% of the cell area of
traditional spacecraft solar arrays, which reduces
weight and cost. In service, a 3x8-m array would
contain 280 of these pop-up lenses. Two cameras were
arranged to measure the static shape of the lens with
projected circular dots. Although the projected dots had
good contrast without spraying the lens with a diffuse
coating (not permitted in this case), target centroids
could not be accurately obtained because of the prismsmolded into the membrane. Vibration tests were then
conducted using 40 adhesive circular targets and two
close-up miniature video cameras for stereo
videogrammetry. The bottom of Fig. lb shows a typical
image pair. Image sequences were successfully

processedto obtain3Dtargetcoordinatesversustime.A scanninglaser vibrometer(with sub-micronprecision)madecorroborativevibrationmeasurementsfor comparison.Factorsaffectingthe achievablephotogrammetricaccuracyinthisapplicationwere:
• Marginaltargetimagesizeatedgeoffieldofview,• Imageintensityvariationoverlargertargets,and• Variationin backgroundimageintensitydueto
surfacereflectionandtransmissioncharacteristics.
3. 15-m inflated, rigidized tube
Long slender tubes proposed for solar sail support
structures and other Gossamer spacecraft are difficult
photogrammetry test objects. Figure lc shows a 15-m-
long, rigidized aluminum-laminate inflatable tube with
a length-to-diameter ratio of 100 hanging vertically.
The cross-sectional shape and straightness of the tube
significantly affect the axial strength and buckling
properties, 14 so photogrammetric measurements of
these quantities were desired. The thinness of the tube
wall prevented installation of traditional adhesive
targets without risking local damage, so an
unconventional measurement approach was designed. A
stationary camera on a tall ladder photographed the tube
against a dark background as the tube was rotated
axially in 30-degree steps. In each photograph, the
distances from the edges of the tube to two stationary
plumb lines were measured. These dimensions gave the
desired cross-sectional shape and straightness of the
tube over most of its length.
4. O.7-m oscillating Kapton membrane
The four images in Fig. ld show one epoch (instant
of time) of a 40-sec, 300-frame video sequence of an
oscillating Kapton membrane with 100 illuminated
retroreflective targets. A metal frame tensioned the
membrane by its corners into a slightly warped shape,
and the frame was suspended by strings. An
electrodynamic shaker attached to the bottom of the
frame slowly moved the membrane back and forth at
10.0 sec per period. The image sequence captured four
periods of the repetitive motion. High membrane
tension and slow speed of motion avoided local
vibration of the membrane. This dataset, representing
the rigid-body motion of the structure, is a good test
case for development of new or improved motion
analysis software. Accurate photogrammetric analysis
of the sequence should show four identical periods of a
rigid, warped surface swaying back and forth in the
manner described above. The same motion analysis
software can then be applied to flexible-body datasets
to identify structural dynamic modal parameters
(assuming the vibration is large enough to detect with
cameras). 15Note that both upper images in Fig. ld have
a "hot spot" from reflection of a light source located at
another camera. It is impossible to measure
photogrammetry targets there. The hot spots changelocation as the membrane oscillates.
5. 3-m hexapod reflector
Figure le shows a 3-m-diameter, reflective
membrane research structure developed by ILC Dover,
Inc., Tennessee State University and NASA Langley
for active shape and vibration control experiments. It is
not an actual spacecraft concept, but contains generic
components of proposed inflatable Gossamer
observatories. The structure uses a Stewart Platform
configuration, also known as a hexapod--a design for
controlling all six degrees-of-freedom of the triangular
feed platform. On all six tapered tubes holding the feed
platform and on the membrane boundary are
piezoelectric actuators that can dampen (or create)
vibrations. Control experiments will compare various
feedback circuits or algorithms to sense and adjust the
static shape or dynamics of the system using the
actuators to optimize a selected performance objective.
Photogrammetry can measure the membrane shape
before and during the control experiments. The right-
hand side of Fig. le shows about 550 dots projected
onto the back of the membrane, _6 which also has a
reflective aluminum coating like the front surface. Two
cameras, one on either side, photographed the dots.
Although the surface is shiny, sufficient photographic
contrast was obtained in a darkened room with long
image exposure times (about 30 sec) for accurate
measurement of the static shape.
6. 4.5-m inflatable tripod
Understanding the deployment dynamics of
Gossamer space structures is a key element of making
them a reliable and practical technology.
Videogrammetry (photogrammetry using image
sequences) is a logical way to measure deployment

dynamicsof Gossamerstructuresbytrackingdiscretetargetsonthestructurewithmultiplecameras.17Figureif showsthreestagesof inflationof a simpletripodconstructedof black,150-micron-thick,polyethylenetubing.Basic-researchinvestigationsusedthismaterialbecauseit is inexpensiveandruggedenoughtowithstandmany inflation/deflationcycles.Low-pressureairinflatedallthreelegssimultaneouslyinthisexperiment.Clearly,a significantissuefor reliablevideogrammetrictrackingof targetson inflatingstructuresis obstructionof targetsby foldsof thematerialorbyothermembers.Somesuccessfulreal-timetargettrackingoccurredin thisexperimentforupto two of thethreelegssimultaneouslyusingtwosynchronizedcameras;however,targets werefrequentlylostfromviewof eitherorbothcameras.Recordingtheentiredeploymentsequence,andthenpost-processingtheimagesinreserveorder,generallyisthebestapproachforobtaining3Dtargettrajectoriesindeploymenttests.Algorithmsforextrapolatingpathsoftargetsthatmovetemporarilyoutofviewcanimprovetrackingperformance.
7. Partial lO-m and two complete 2-m solar sailmodels
Fig. lg shows three solar sail structural test
articles. 18 The large one on the left is half of a four-
quadrant, 10-m sail concept (the length of each edge is
10 m). Those on the right are 2-m scale models of
different sail designs. These research structures are in a
16-m-diameter vacuum chamber, large enough to
accommodate testing of a complete 10-m solar sailmodel in both horizontal and vertical orientations. All
three structures use aluminized Kapton membranes (25-
micron-thick) that are shiny, but with sufficient diffuse
reflection for 3D photogrammetry. Useful space
missions require sail sizes of at least 70 m withmembrane thicknesses of less than 7 microns. The 10-m
test article has 80 distributed, 28.5-ram-diameter,
retroreflective targets for laser vibrometry and
photogrammetry measurements of overall shape and
dynamic characteristics. High-density dot projection
has also been used on a portion of the four-quadrant, 2-
m sail, shown in the lower-right corner of Fig. lg, to
measure its static shape with high spatial resolution.
Note that the four-quadrant, 2-m sail has four individual
triangular membrane sections, tensioned by slender
aluminum rods running between them.
PHOTOGRAMMETRY
Figure 2 is a flowchart of the ten main steps of
photogrammetry consistent with PhotoModeler Pro, one
of the software programs used in this research. The
remainder of the paper discusses each step individually
using data from a recent test of the four-quadrant, 2-m
solar sail as an illustrative example. Note that the
flowchart is a "closed loop" since lessons learned in
each application lead to method improvements in later
applications.
Step 1: Establish measurement objectives and
accuracy requirements
The seven projects discussed in the preceding
section show how photogrammetry can measure a wide
variety of structures, using a variety of experimental
methods. There are only three top-level measurement
objectives for Gossamer structures (static shape, modes
of vibration, and deployment dynamics), but there are
many ways to estimate each type of data. Establishing
specific measurement objectives and accuracy
requirements is important for selecting proper test
methods.
An important consideration in developing ground-
test objectives is a good understanding of mission
requirements and important design issues so they can be
adequately validated. For example, with solar sails, the
two biggest technical concerns (at least in early
demonstration experiments) is proper deployment of the
sail and controllability. Next is the ability of the sail to
accelerate as expected using the momentum exchange
imparted by sunlight (photon) reflection. All three
aspects relate to one of the types of data that
photogrammetry can measure. Specifically,
photogrammetry can measure deployment dynamics
and modes of vibration, which relate to the deployment
and attitude control aspects, respectively. Sail
acceleration performance in space relates directly to the
operational shape of the deployed membrane, which
can also be determined with photogrammetry.
A good estimate of the required measurement
accuracy for each photogrammetry project is also
important, avoiding both under- and over-estimating the
requirements. Under estimation can lead to
unacceptableor unreliablemeasurements.Overestimationcanwastetimeandresourcesbecausethecostversusaccuracyrelationshipisoneofdiminishingreturnsat higheraccuracylevels.Photogrammetricaccuracy(specifiedinpartsperthousandofthelargestdimensionofthestructure)canvarybymorethanthreeordersof magnitudedependingon themethodandequipmentused,rangingfrom1:1,000,000withlarge-formatfilm camerasto under1:1000with low-resolutionconsumercamerasandmanualfeaturemarkinginimages.
Step 2: Select and calibrate suitable camerasand lenses
Modern close-range photogrammetry uses digital
cameras almost exclusively rather than traditional film
or analog (for video) equipment because of several
advantages, including:
1. The images are immediately available for
computer analysis (using removable storage
media or cable connection),
2. The photogrammetrist can take many extra
pictures at the test site at no additional cost using
different camera and lighting settings and select
the best images later for the analysis, and
3. The measurement accuracy can be higher than for
standard 35-ram film, which can shift relative to
the camera lens. Also, image transmissions (for
video) are higher quality using digital data lines.
There are also some disadvantages of digital
cameras compared with film or analog (for video)
equipment, including:
1. Higher prices (at least 3x higher than comparable
film cameras), but these are fully recovered by
eliminating film and developing costs,
2. Maximum image resolution capability is still
achieved by medium- or large-format film
cameras designed and calibrated for
photogrammetry, and
3. Cable-length limitations of digital video systems,
which is typically less than 10 m withoutincreased noise.
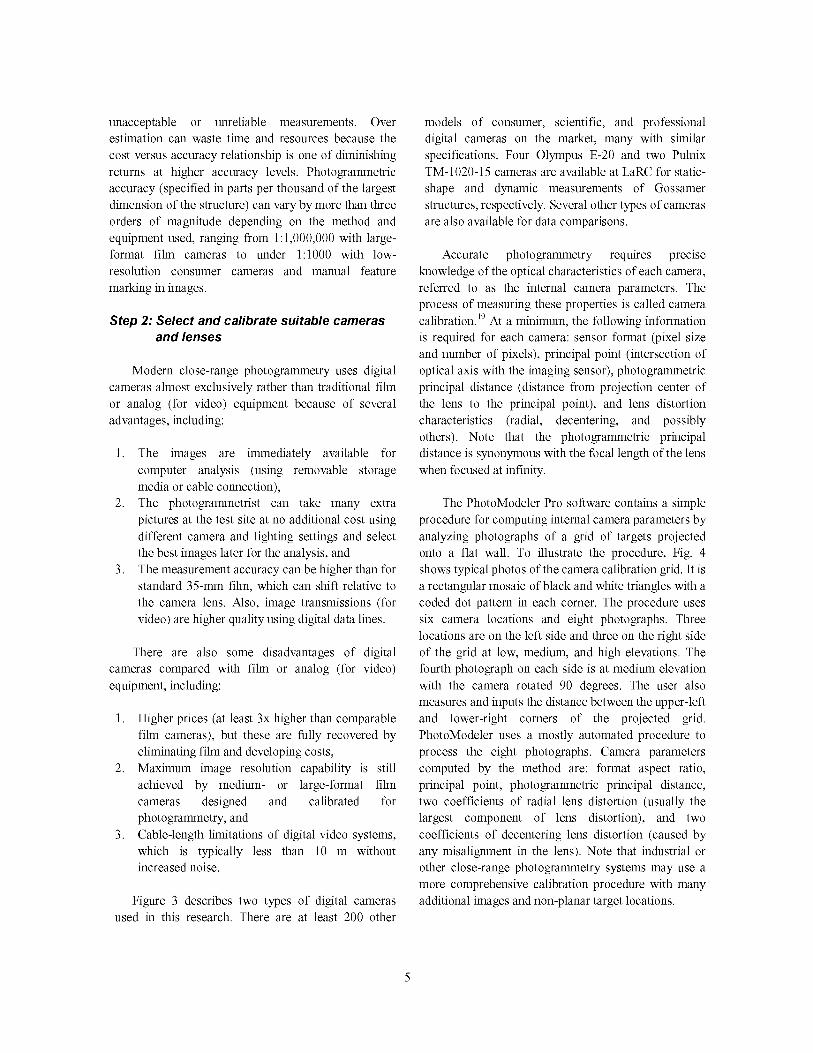
Figure 3 describes two types of digital camerasused in this research. There are at least 200 other
models of consumer, scientific, and professional
digital cameras on the market, many with similar
specifications. Four Olympus E-20 and two Pulnix
TM- 1020-15 cameras are available at LaRC for static-
shape and dynamic measurements of Gossamer
structures, respectively. Several other types of cameras
are also available for data comparisons.
Accurate photogrammetry requires precise
knowledge of the optical characteristics of each camera,
referred to as the internal camera parameters. The
process of measuring these properties is called camera
calibration. 19At a minimum, the following information
is required for each camera: sensor format (pixel size
and number of pixels), principal point (intersection of
optical axis with the imaging sensor), photogrammetric
principal distance (distance from projection center of
the lens to the principal point), and lens distortion
characteristics (radial, decentering, and possibly
others). Note that the photogrammetric principal
distance is synonymous with the focal length of the lens
when focused at infinity.
The PhotoModeler Pro software contains a simple
procedure for computing internal camera parameters by
analyzing photographs of a grid of targets projected
onto a flat wall. To illustrate the procedure, Fig. 4
shows typical photos of the camera calibration grid. It is
a rectangular mosaic of black and white triangles with a
coded dot pattern in each comer. The procedure uses
six camera locations and eight photographs. Three
locations are on the left side and three on the right side
of the grid at low, medium, and high elevations. The
fourth photograph on each side is at medium elevation
with the camera rotated 90 degrees. The user also
measures and inputs the distance between the upper-left
and lower-right corners of the projected grid.
PhotoModeler uses a mostly automated procedure to
process the eight photographs. Camera parameters
computed by the method are: format aspect ratio,
principal point, photogrammetric principal distance,
two coefficients of radial lens distortion (usually the
largest component of lens distortion), and two
coefficients of decentering lens distortion (caused by
any misalignment in the lens). Note that industrial or
other close-range photogrammetry systems may use a
more comprehensive calibration procedure with many
additional images and non-planar target locations.

Step 3: Select type, size, and distribution of
targets
Photogrammetry achieves the best accuracy using
high-contrast, solid-colored circles as targets. Targets
can be light-colored on dark background or dark-
colored on light background, the former being more
common. Targets cover each part of the structure with
enough density to define its shape, usually without
being placed at specific locations, though there can be
advantages to placing some targets at known
coordinates. Circular targets appear in photographs as
elongated ellipses, with the elongation depending on
viewing angle. Accurate calculation of target centers
(centroids) for photogrammetry requires both axes of
the ellipse to be about five pixels in size or larger.
This research uses three types of solid-colored
circular targets: diffuse, retroreflective, and projected.
Diffuse materials, such as common white paper, reflect
light in all directions. Retroreflective materials, such as
highway road signs or markers, reflect light mostly
back in the direction of its source, significantly
increasing visibility in that direction alone. Projected
targets, typically white dots from a standard slide
projector, are an attractive alternative for static-shape
measurements of delicate Gossamer structures, but are
not as useful as attached targets for dynamic
measurements because they do not move with the
structure. Photogrammetry can measure the 3D shape of
a structure at each instant of time with projected dots;
however, motion time histories of specific points on the
structure cannot be obtained without interpolation or
other assumptions.
Figure 5 shows retroreflective and projected
circular targets. Figure 5a is a retroreflector on a black
background, with and without the camera flash turned
on. Without illumination, the target is dull gray in color.
With illumination, it is bright white--many times
brighter than a diffuse white surface. If the exposure is
optimized for the retroreflective dots in the images, as
in Fig. 1d, illuminated retroreflective targets appear as
bright white dots on a dark background and are
excellent photogrammetric targets that computer
software can automatically locate and mark.
Figure 5b compares white dots projected onto twodifferent membrane materials. The left-hand side is
aluminized Kapton, the same material used for the solar
sails in Fig. lg. It is mainly a specular surface
(reflecting light at the same angle as the incident angle),
but has a small diffusivity (reflecting light in every
direction). The right-hand side is matte Mylar film,
which is mainly diffuse. Diffuse materials are much
better for photogrammetry since they give more
uniform target contrast from different viewing
directions relative to the projector. In Fig. 5b, the
projector is directly in front of the membranes and the
camera is about 30 degrees to the left side.
Membrane materials for proposed Gossamer
structures are often reflective or transparent, which are
difficult materials to measure with photogrammetry.
Special ground test articles may be manufactured with a
diffuse white coating on one or both sides of shiny and
transparent membranes to simplify photogrammetry
with dot projection.
Step 4: Design the photogrammetric geometry
and take the photographs
Designing the photogrammetric geometry (a.k.a.,
"network design") involves selecting an adequate
number and distribution of camera positions. 2° A
general guideline is to place cameras at convergent
viewing angles, in both the horizontal and vertical
directions if possible, at about 70 to 90 degrees angular
separation, plus or minus 30 degrees. A key feature of
close-range photogrammetry with bundle adjustment isthat the camera locations and orientations do not have
to be measured, but are calculated by the software along
with the desired target coordinates. The bundle
adjustment, which is the data reduction procedure
preferred by the photogrammetric community, uses an
iterative non-linear least squares solution. Although
details of this process are beyond the scope of this
paper, a brief discussion is provided in Step 8 below.
Each point of interest on the object must appear in
at least two photographs for 3D determination, although
four or more photographs are preferred for improved
least-squares accuracy and reliability. With knowledge
of at least one other constraint, such as knowing that all
object points lie on a plane, photogrammetry can also
use a single camera location. This capability is
particularly useful for real-time measurements to reduce
computational requirements. Gossamer structure tests

will usuallyusetwo or morecameralocationstocompute3Dstructuralcoordinateswithoutassumptionsorconstraints.
Figure6 showstheequipmentfor dot-projectionphotogrammetryofthe2-msolarsailmodel(orothersmalltestarticles).Thisis a stagedphotograph--theactualtestconfigurationwassomewhatdifferent.Tominimizehotspotsin theimages,theprojectorwasmovedto thefloorandangleduptowardthesailatabout45degrees,causingthemainlightbeamtoreflectmostlyabovethecameras.Fortypictureswereshotusingeightcameralocationsin frontofthesail(fouracrossat eachof twotripodheights)andwithfiveimageexposuresettingsateachlocation.Withtheroomdarkened,astandard35-mmslideprojectorhadenoughpowertoprojectabout1500dotswithadequatecontrastononlythelower-rightcomerofthisshinymembrane,indicatedbydashedlinedlinesinFig.6.Thesizeofthisareaisabout835x 585ram.Theaterprojectorswithhigherpowerareavailableforlargerstructures.
Photogrammetryrequirestargetswith goodcontrastthatareinreasonablefocus.Generally,thebestwaytotakethephotographsisusingasmallaperturesetting(f/8orhigher)toobtaingooddepthoffield(i.e.,thedepthintheobjectthatissimultaneouslyinfocus)whileminimizing,or eveneliminating,focusingrequirements.Usingasmallapertureandfocusingthecamerato optimizedepthof field,it is possibletosimultaneouslyfocusallobjectsin thepicturefromashortdistanceinfrontofthecameraouttothehorizon.However,usinga smallaperturerequiresa slowershutterspeedorbrighterilluminationtoobtainadequateimageexposure.Tripodsshouldbeusedwithexposuretimeslongerthanabout30msecto avoidcameramovement.Mostconsumerdigitalcamerashavezoomlenses,andit is importanttobesurethattheyaresetproperly.Normallyeithertheminimumormaximumzoomsetting(focallength)andinfinityfocusareusedtosimplifytheprocessandimproverepeatability.Anychangesin thezoomor focussettingsrequirenewcameracalibrationdata.
Figure7 showsthebestpairofimagesamongthe40thatweretakenofthe2-msolarsail.Thecontrastintheseimagesishigherthanobservedwiththenakedeyefor thisreflectivemembrane.Contrastenhancementoccurredusinglongcameraexposuresettingsofabout
30sec(i.e.,longintegrationtimes).Theimageswereshotusingthelongestfocallengthof thecamera(36ram)sothatthephotographerstayedasfarawayfromthemembraneaspossibletoavoidcausingaircurrentsthatwouldmovethesensitivefilm.FortheimagesinFig.7,thecameraswereabout3mfromthestructureandseparatedby about3.5m.Maximizingthetestarticleimagesizeineachphotoincreasesaccuracy.Theprojecteddotsintheleftphotographoccupy85%oftheimageandintherightphotograph,theyoccupy74%.Ahotspotoccursin therightimagefromslighttwistingof themembraneedgethatredirectedthemainlightbeamtowardthecamera.Theoccurrenceofhotspotson shinymaterialswith dot projectionis almostunavoidable.
Photographicimagesare inherentlynon-dimensional(e.g.,onecannottell fromphotographsaloneif thesolarsailis 2 m or20m in size).Forscalingpurposesandforinitialcalculationof cameralocationsandorientations,tenlight-coloredadhesivetargetswereplacedonthemembraneandarevisibleinthephotoswithcloseexamination.Themeasureddistancebetweenawidelyseparatedpairof adhesivetargetsprovidedphysicalscalingfortheresulting3Dphotogrammetricmodel.
Step 5: Select data analysis software and
import the images
Close-range photogrammetry traditionally has been
a specialized technology with relatively few software
developers. Most photogrammetry software is one of
the following three types: 1) Part of a turnkey system
and interfaces with one particular camera only, 2)
Developed and used by an individual or consulting firm
and not available for sale, or 3) Research code written
at universities and used primarily by its developers and
students. However, with rapidly increasing capabilities
of digital cameras and personal computers in recent
years, some general-purpose photogrammetry software
has appeared on the market. These products can analyze
images from any source. PhotoModeler Pro, one of the
consumer software products, has been used successfully
throughout this research. The remainder of the paper
describes the photogrammetric analysis of the solar sail
images in Fig. 7 with PhotoModeler. Other software
products provide similar capabilities.

First,theimagesaretransferredfromthecamerastothecomputer.Mostdigitalcamerasuseremovable,solid-statememorycardsaboutthesizeofamatchbox,availablein capacitiesashighas512MB.FortheOlympusE-20camerausedto takethe solarsailpictures,eachcardholdsupto150JPEGimagesatthemaximumresolutionof2560x 1920pixels.Thecardisremovedfromthecamera,insertedinaperipheralcardreaderattachedto thecomputer,andtheimagesaretransferredjustasfloppydiskfilesarecopied.ThePhotoModelersoftwareis thenstarted,andtheimagesareselectedandimportedintotheprogramforanalysis.
Next,theuserassociateseachimagewith itsspecific,previouslycalibratedcamera(thecamerascanbeentirelydifferenttypes).Thisallowstheproperinternalcameraparameters,obtainedfromcalibration,to be used with each image.Traditionally,photogrammetricmeasurementof stationaryobjectsusesonlyonerovingcamera,andtherearesomeaccuracyadvantagesof thisapproach(byrunningaself-calibrationprocedureduringthedataanalysis).However,manyGossamerstructuresaresoflimsytheycanchangeshapefromunintentionalair currentscreatedby a rovingphotographer.In addition,testsundervacuumconditionscannoteasilyusearovingcamera.Thesesituationsrequiremultiplestationarycameras.Multipletime-synchronizedcamerasarealsonecessaryfor3Ddynamicmeasurements.
Step 6: Mark the target locations in each image
Data analysis begins by marking the locations of
the targets in the images. In other words, the x-y
coordinates of the centroid of each elliptical target,
projected white dots in this case, must be marked as
accurately as possible in each image. An important
aspect of precision photogrammetry is the availability
of subpixel interpolation algorithms that locate the
center of solid-colored ellipses to an accuracy of one-
tenth of a pixel or less. 21 The 3D spatial measurement
precision obtained with photogrammetry is directly
related to this subpixel interpolation factor. For
example, the overall three-dimensional measurement
precision improves by approximately a factor of two if
the center of ellipses is calculated to a precision of 1/20
ofa pixel rather than to 1/10 ofa pixel.
PhotoModeler contains a robust subpixel marking
tool for circular targets. Individual targets are marked
by clicking them with the mouse, or all targets in a
rectangular region of the image can be selected and
marked collectively. The latter approach is called
"automatic marking" (or auto-marking) and although it
is not entirely automatic, does greatly simplify subpixel
target marking in projects with large numbers of points,
such as in dot-projection tests.
Auto-marking requires the selection of an
appropriate intensity threshold, which is then used to
determine the number and location of targets in the
images. The software assumes that parts of the imagewith intensities below the selected threshold contain no
targets. The user selects an area of the image to analyze
(in this case the entire image is selected), and then
interactively moves a slider bar to adjust and select a
threshold value. Figure 8 shows various displays that
occurred in the left solar sail image as the slider moved
from 255 (pure white) down to zero (pure black). The
objective is to choose as low a threshold as possible
without seeing too much noise in the image or having
the targets join together. With dot projection on this
shiny membrane, there is uneven illumination so a
single threshold value will not work for the entire
image. A threshold intensity of 70 was selected as a
compromise to get as many correctly marked targets
automatically as possible. Note that target marking
procedures may be significantly different and more
automatic in other photogrammetry systems.
Figure 9 shows the automatically marked points for
this image. Most targets were detected and marked with
the exception of several in the upper-center of the
membrane located in the brightest region and several on
the right edge of the membrane located in the darkest
region. There are a few other targets in the image that
were not found automatically, and they were marked by
hand in a second step. PhotoModeler required 70 sec on
a 2.2-GHz computer to calculate the subpixel location
of 1500 targets using a least-squares matching
algorithm. Two other marking algorithms are availablethat are faster but also less accurate.
Step 7: Identify which points in the images
refer to the same physical point
The second step of the data analysis is to match the
marked points in one image with their corresponding

pointsin theotherimages.Thisprocessis called"referencing"thepoints.Whena pointis initiallymarkedon an image,it is assigneda uniqueidentificationnumber.Then,whenamarkedpointononeimageisreferencedtoamarkedpointonanotherimage,thesoftwarereassignsthesameidentificationnumberto bothpointsindicatingtheyarethesamephysicallocationonthestructure.Inthebeginningofthedataanalysis,theusermustperformthisreferencingoperationmanuallyuntilacertainminimumnumberofpoints(atleastsix)arereferencedonall photos,atwhichtimetheuser"processes"thedata.Processingthedatarunsa photogrammetricbundleadjustmentalgorithm,describedinStep8.
Whenthesecalculationsfinish(typicallyinafewseconds),theuserreturnstotheReferencingphase.Atthispoint,automatichelpertoolsareavailabletospeeduptheprocess.Thesetoolsappearasaresultoftheinitialprocessingof thedata,whichyieldsthespatiallocationandorientationanglesof thecameras.Now,the imagesaresaidto be "oriented."In a typicalPhotoModelerprojectwithoutcontrolpoints(specialpointswithknowncoordinates),thecameralocationsandorientationscalculatedabovearerelativequantitieswithrespecttooneofthecameras,usuallyCamera1.Atthispoint,it isagoodideatoverifythatthesoftwarepositionedthecamerasproperly,whichcanbecheckedeasilyin the graphical3D vieweravailableinPhotoModeler.Theviewershowssmallcameraiconsattheirlocationsandorientationsrelativetotargetswithcalculated3Dcoordinates,displayedassmalldots.Controlsareavailabletorotateorresizethe3Dgraphicforbetterviewing.
Figure10illustratestheuseof aninteractive,referencinghelpertool.Theuserselectsoneormorepointsin thefirst imageto referencein theotherimages.Forexample,selectPoint5820in Fig.10a.Oncetheimagesareoriented,thesoftwareknowsthedirectionofalightrayfromPoint5820onthestructureto the first camera.It projectsthisray ontotheremainingimages.Thephotogrammetrictermforthisprojectedlineisan"epipolarline."Theuserknowsthatthedesiredpointshouldbesomewherealongtheline.In mostcases,thisgreatlysimplifiesreferencingthepoint.InFigure10b,thecorrespondingtargetinImage2istheonlyonedirectlyontheepipolarline,locatedinthethirdcolumnofpoints.
PhotoModeleralso containsfully automaticreferencingalgorithmsfor applicationswithtwoormoreimages(whichis standard).Thesealgorithmsworkbestwithatleastthreeimages,butthereisalsoanewtechniquefor auto-referencingtwo imagesofplanaror near-planarstructures.The constraintprovidedbythesurfaceshapeallowsthesoftwaretoworkwith the normallyambiguouscaseof twophotographs.Thealgorithmaskstheusertoselectthreeormorepointswith3Dcoordinatesthatdefinethenear-planarsurface.Thesoftwarecalculatestheequationofthis plane,then automaticallysearchesfor andreferencespairsofpointsusingtheepipolarlineandauser-specifieddistancefromtheindicatedplane.It isdifficultto seein theimages,but themeasurementregionin the2-msolarsailtestis,in fact,notplanarenoughforthisalgorithmtoreferencetheentireimagesimultaneously.Aswillbeclearlater,theright-handsailquadrantis significantlydisplacedoutwardatthetop--bymorethan5cm--fromthelowerquadrant.Thisgeometryrequiredauto-referencingtobeperformedintwosteps,aseparateoperationforeachregion.
Noticein Fig.10thatmanysmall,brightspotsappearthroughouttheimages.TheKaptonmembraneforthissolarsailmodelisperforated,andthebrightspotsarefromlightreflectedbytheedgesoftheholes.Thesespotscausesmallerrorsin the calculatedcentroidsofthetargets,buttheeffectsareminimal.
Step 8: Process, scale, and rotate the data
The third and final step of the data analysis is to
"process" the data using the bundle adjustment
algorithm. In the technical literature, several variations
of the bundle adjustment method appear, with different
user options and levels of sophistication. 22As discussed
in the preceding section, the data are processed initially
after referencing at least six points in each image. This
orients the images. Then the user returns to referencing
(and marking, if necessary) additional points. It is often
better not to reference all remaining points at this time,
but stop after adding some additional points and re-
process the data. With the 2-m solar sail images, points
were referenced and processed mostly in two large sets
(the lower-left and upper-right regions). Then some
additional points were added that did not auto-mark or
auto-reference previously, such as on the curved edges.

Thisapproachavoidswastingtimeif forsomereasonthe algorithmsfail to handlea largenumberofadditionalpoints,usuallybecauseofreferencingerrors.Referencingerrorscanbelocatedandfixedmoreeasilyif alimitednumberofnewpointsareaddedateachstepof theprocedure.
Thebundleadjustmentalgorithmdoestwothingssimultaneously:1)Computesthespatiallocationsandorientationanglesofeachcamera,and2)Computesthe3Dcoordinatesofallreferencedpointsandestimatestheirmeasurementprecision.Bundleadjustmentisalwaysaniterativesolution(sincetheunderlyingmathisnon-linear),andhencethecalculationscontinueuntila specifiedconsistencyor maximumnumberofiterationsoccurs.If theobjectpointsaredistributedonthestructureandthephotographsareatsuitableangles,thebundleadjustmentwillusuallyrunsuccessfully.Inmanycases,cameraself-calibrationorfield-calibrationareaddedtothebundleadjustmentequationsduringthedataprocessingtoimprovetheinternalconsistencyofthesolutionandtheaccuracyofthepointcoordinates.
Thesestepswere followedwith the twophotographsofthe2-msolarsail,andthecoordinatesof all targetsweresuccessfullydeterminedusingsuccessivebundleadjustmentcalculations.Theresultwas1449photogrammetricallycomputed3Dpointsdescribingthestaticshapeofthestructure.Followingeachbundleadjustment,thecameralocationsandorientationsweredisplayedin thePhotoModeler3DViewer.Thecamerasalwaysappearedto bein theirproperpositionsandorientations,addingconfidencethatthesoftwarewasworkingproperly.Recallthatthesoftwarecomputesthe camerapositionsandorientationsfromtheimages.
Atthispoint,thesetof3Dpoints(a.k.a.,the"pointcloud")canbescaledtophysicalunitsandtranslatedandrotatedtoanydesiredcoordinatesystem.ScalingandchangingcoordinatesystemsinPhotoModelerisasimplematterof selectingtwodistantpointsin animage,enteringtheirseparationdistanceinengineeringunits,andthenselectingthreepointsto definethecoordinatesystem.(Thethreepointsspecifytheneworigin,directionof adesignatedaxis,andtheplaneofanotherdesignatedaxis.)In thistest,twoof thetensmalladhesivedotsplacedonthemembranewereusedforscaling,andthreeoftheprojecteddotsdefinedthe
coordinatesystem.In somephotogrammetryprojects,thesescalingandcoordinatesystempointsmaybelocatedoffthestructure,e.g.,onarigidframeorotherstationarysupportstructure.
Step 9: Examine results and export for
additional analyses
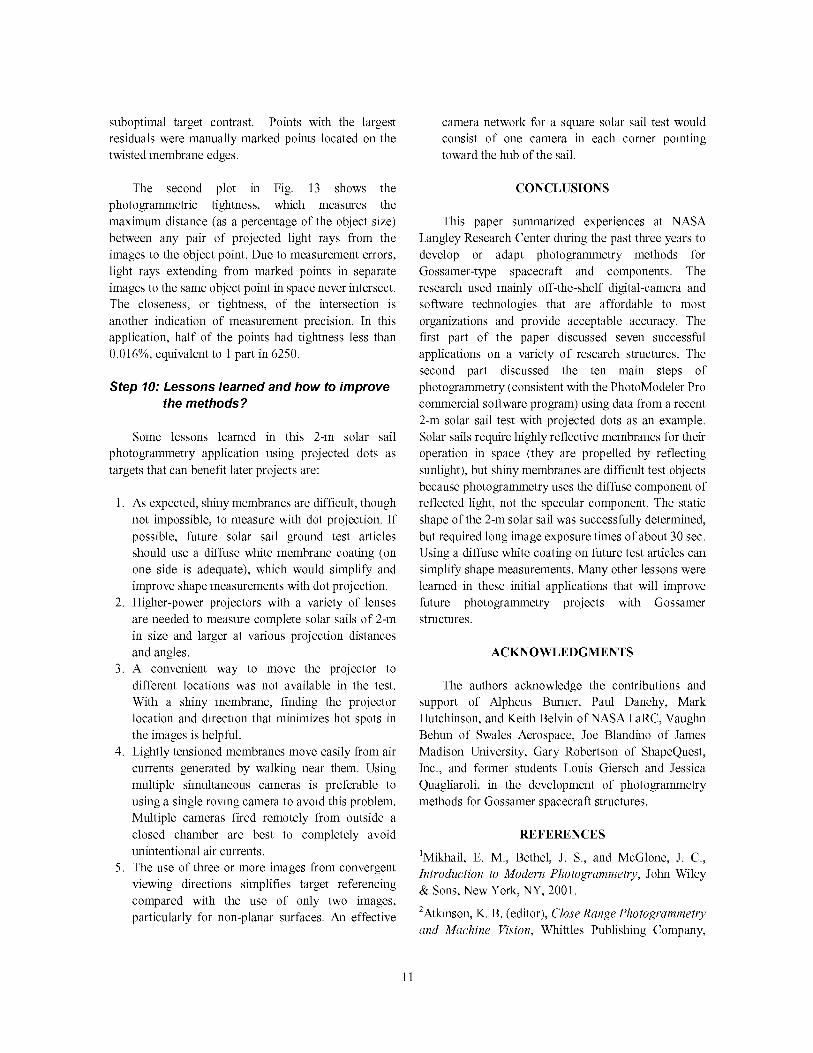
Figure 11 shows two views of the final structural
model displayed as a point cloud in the 3D Viewer.
Note that it was impossible to mark a region of targets
at the hot spot in the right-hand image, so the resulting
3D model contains a hole at this location. There is also
a gap between the two individual membrane sections
because projected dots on the slender aluminum tube
between the membranes were larger than the tubediameter and therefore the centroids could not be
accurately calculated.
It is easier to see the shape of the membrane by
examining cross-sectional slices through the model at
various elevations, shown in Fig. 12. These contours
were created by exporting the 3D data from
PhotoModeler in ASCII format and doing cubic-spline
curve fits to the data points on five horizontal rows of
dots. Note that this plot uses different scales on the x
and y axes, so the out-of-plane membrane shape (Z
direction) is amplified in the plot by about 20x relative
to the horizontal dimension (X direction). The data
show a significant displacement of the upper region
relative to the lower region by up to 6 cm. This warped
shape, caused by the two upper rods of the sail bending
considerably forward by gravity, was the initial
configuration of the structure. Later (for the picture in
Fig. 6), the upper rods were pulled back and tied in a
straighter position by cords. Curling of the membrane
edges is also apparent in Fig. 12.
Photogrammetric precision achieved in the project
can also be examined using the exported data. Figure 13
shows two principal parameters, largest marking
residual and tightness, that can be studied. The plots
show the results for the 1449 3D points sorted in
descending order. Marking residuals are the least-
squares error distances in the camera image planes.
Residuals under 1.0 pixel indicate sub-pixel
measurement precision. In this application, half of the
points had residuals less than 0.20 pixel, which is good
considering the shiny nature of the membranes and
10
suboptimaltargetcontrast.Pointswiththe largestresidualsweremanuallymarkedpointslocatedonthetwistedmembraneedges.
The secondplot in Fig. 13 showsthephotogrammetrictightness,which measuresthemaximumdistance(asapercentageoftheobjectsize)betweenanypair of projectedlightraysfromtheimagestotheobjectpoint.Duetomeasurementerrors,lightraysextendingfrommarkedpointsin separateimagestothesameobjectpointinspaceneverintersect.Thecloseness,or tightness,of the intersectionisanotherindicationof measurementprecision.In thisapplication,halfofthepointshadtightnesslessthan0.016%,equivalentto1partin6250.
Step 10: Lessons learned and how to improve
the methods?
Some lessons learned in this 2-m solar sail
photogrammetry application using projected dots as
targets that can benefit later projects are:
1. As expected, shiny membranes are difficult, though
not impossible, to measure with dot projection. If
possible, future solar sail ground test articles
should use a diffuse white membrane coating (on
one side is adequate), which would simplify and
improve shape measurements with dot projection.
2. Higher-power projectors with a variety of lenses
are needed to measure complete solar sails of 2-m
in size and larger at various projection distances
and angles.
3. A convenient way to move the projector to
different locations was not available in the test.
With a shiny membrane, finding the projector
location and direction that minimizes hot spots in
the images is helpful.
4. Lightly tensioned membranes move easily from air
currents generated by walking near them. Using
multiple simultaneous cameras is preferable to
using a single roving camera to avoid this problem.
Multiple cameras fired remotely from outside a
closed chamber are best to completely avoidunintentional air currents.
5. The use of three or more images from convergent
viewing directions simplifies target referencing
compared with the use of only two images,
particularly for non-planar surfaces. An effective
camera network for a square solar sail test would
consist of one camera in each comer pointingtoward the hub of the sail.
CONCLUSIONS
This paper summarized experiences at NASA
Langley Research Center during the past three years to
develop or adapt photogrammetry methods for
Gossamer-type spacecraft and components. The
research used mainly off-the-shelf digital-camera and
software technologies that are affordable to most
organizations and provide acceptable accuracy. The
first part of the paper discussed seven successful
applications on a variety of research structures. The
second part discussed the ten main steps of
photogrammetry (consistent with the PhotoModeler Pro
commercial software program) using data from a recent
2-m solar sail test with projected dots as an example.
Solar sails require highly reflective membranes for their
operation in space (they are propelled by reflecting
sunlight), but shiny membranes are difficult test objects
because photogrammetry uses the diffuse component of
reflected light, not the specular component. The static
shape of the 2-m solar sail was successfully determined,
but required long image exposure times of about 30 sec.
Using a diffuse white coating on future test articles can
simplify shape measurements. Many other lessons were
learned in these initial applications that will improve
future photogrammetry projects with Gossamerstructures.
ACKNOWLEDGMENTS
The authors acknowledge the contributions and
support of Alpheus Burner, Paul Danehy, Mark
Hutchinson, and Keith Belvin of NASA LaRC, Vaughn
Behun of Swales Aerospace, Joe Blandino of James
Madison University, Gary Robertson of ShapeQuest,
Inc., and former students Louis Giersch and Jessica
Quagliaroli, in the development of photogrammetry
methods for Gossamer spacecraft structures.
REFERENCES
1Mikhail, E. M., Bethel, J. S., and McGlone, J. C.,
Introduction to Modern Photogrammetry, John Wiley
& Sons, New York, NY, 2001.
2Atkinson, K. B. (editor), Close Range Photogrammetry
and Machine Vision, Whittles Publishing Company,
11

Scotland,UK,2001.3Shortis,M.R.andBeyer,H.A.,"SensorTechnologyfor DigitalPhotogrammetryandMachineVision,"ibid.,pp.106-155.4Cooper,M.A.R.andRobson,S.,"Theoryof CloseRangePhotogrammetry,"ibid.,pp.9-51.5El-Hakim,S.F. (editor),Videometrics and Optical
Methods Jot 3D Shape Measurement, SPIE Proceedings
No. 4309, Jan. 2001.
6jenkins, C. H. M. (editor), Gossamer Spacecraft."
Membrane and Inflatable Structures Technology Jot
Space Applications, Vol. 191, Progress in Astronautics
and Aeronautics, AIAA, Reston, VA, 2001.
7L'Garde, Inc., "Photogrammetry Capability,"
http ://www.lgarde.comJcapabilities/photo.html.
8Giersch, L. R., "Pathfinder Photogrammetry Research
for Ultra-Lightweight and Inflatable Space Structures,"
M.S. Thesis, George Washington University, Aug.
2001 (also published as NASA CR-2001-211244, Nov.
2001).
9Dharamsi, U. K., Evanchik, D. M., and Blandino, J. R.,
"Comparing Photogrammetry with a Conventional
Displacement Measurement Technique on a Square
Kapton Membrane," AIAA paper 2002-1258, April2002.
l°Geodetic Services, Inc., Melbourne, FL, V-STARS
Industrial Photogrammetry Systems,
http ://www.geodetic.com.
HImetric SA, Porrentruy, Switzerland, 3D Image
Metrology Systems, http://www.imetric.com.
_2pappa, R. S., Giersch, L. R., and Quagliaroli, J. M.,
"Photogrammetry of a 5-m Inflatable Space Antenna
With Consumer Digital Cameras," Experimental
Techniques, July/Aug. 2001, pp. 21-29.
13pappa, R. S., Woods-Vedeler, J. A., and Jones, T. W.,
"In-Space Structural Validation Plan for a Stretched-
Lens Solar Array Flight Experiment," Proceedings of
the 20th International Modal Analysis ConJerence, Feb.
2002, pp. 461-471.
14Watson, J. J., "Static-Test Results for the
Characterization of Inflatable Rigidizable Columns,"
AIAA Paper 2001-1269, April 2001.
15Pappa, R. S., Lassiter, J. O., and Ross, B. P.,
"Structural Dynamics Experimental Activities in Ultra-
Lightweight and Inflatable Space Structures," AIAA
Paper 2001-1263, April 2001.
_6jones, T. W. and Pappa, R. S., "Dot Projection
Photogrammetric Technique for Shape Measurements
of Aerospace Test Articles," AIAA Paper 2002-0532,Jan. 2002.
_7Shortis, M. R. and Snow, W. L., "Videometric
Tracking of Wind Tunnel Aerospace Models at NASA
Langley Research Center," The Photogrammetric
Record, Vol. 15, No. 85, 1997, pp. 673-689.
_SSlade, K. N., Belvin, W. K., and Behun, V., "Solar
Sail Loads, Dynamics, and Membrane Studies," AIAA
paper 2002-1265, April 2002.
19Fryer, J. G., "Camera Calibration," Close Range
Photogrammetry and Machine Vision, edited by K. B.
Atkinson, Whittles Publishing, Scotland, UK, 2001, pp.156-179.
2°Fraser, C. S., "Network Design," ibid., pp. 256-281.
2_West, G. A. W. and Clarke, T. A., "A Survey and
Examination of Subpixel Measurement Techniques,"
SPIE Proceedings No. 1395, Sept. 1990, pp. 456-463.
22Granshaw, S. I., "Bundle Adjustment Methods in
Engineering Photogrammetry," Photogrammetric
Record, Vol. 10, No. 56, 1980, pp. 181-207.
12

a)5-minflatableparabolicreflector
i s:..
b) 1-m flexible Fresnel lens
(1 -projected dots, 2-adhesive targets)c) 15-m inflated,
rigidized tube
d) 0.7-m oscillating Kapton membrane
with retroreflective targets
e) 3-m hexapod reflector for active control experiments
(projected dots on stretched membrane reflector)
f) 4.5-m inflatable tripod g) Partial 10-m and two complete 2-m solar sail models
Fig. 1. Gossamer test articles.
13

Fig.2. The10stepsofphotogrammetry.
Used for static shape measurements
Olympus E-20 color digital SLR cameras
CCD: 2560 x 1920 pixels, 8.704 x 6.528 mm
Non-removable lens: 9 - 36 mm, f/2.0 - f/11
Shutter speed: 1/640 - 60 sec
iiiiiiiiiiiiiiiiiiiiiiiiiiiiiiiiiiiiiiiiiiiiiiiiiii?' i_ii _iii
Used for dynamic measurements
Pulnix TM-1020-15 monochrome digital video cameras
CCD: 1008 x 1018 pixels, 9.072 x 9.162 man
Removable lens: 24 - 85 man, f/2.8 - f/22
Up to 30 frames per sec
Fig. 3. Camera characteristics.
14

Fig. 4. Camera calibration images.
With camera With camera
flash off flash on
a) Retroreflectors appear bright white b) Comparison of projected dots on shiny (left)
when illuminated from camera position and diffuse-white (right) membranes
Fig. 5. Retroreflective and projected circular targets.
Fig. 6. Equipment for photogrammetry of 2-m solar sail model using projected dots.
15

Leftimage Rightimage
Fig.7. Bestimagesoflower-rightcorner(835x585ram)of2-msolarsailmodel
Fig.8. Leftimagedisplayedatvariousbinaryintensitythresholds.
16

Fig. 9. Automatically marked points using an intensity threshold of 70.
a) Select a point in Image 1 (e.g., #5820) b) Corresponding point in Image 2 is on the epipolar line
Fig. 10. Epipolar line assists target referencing.
17
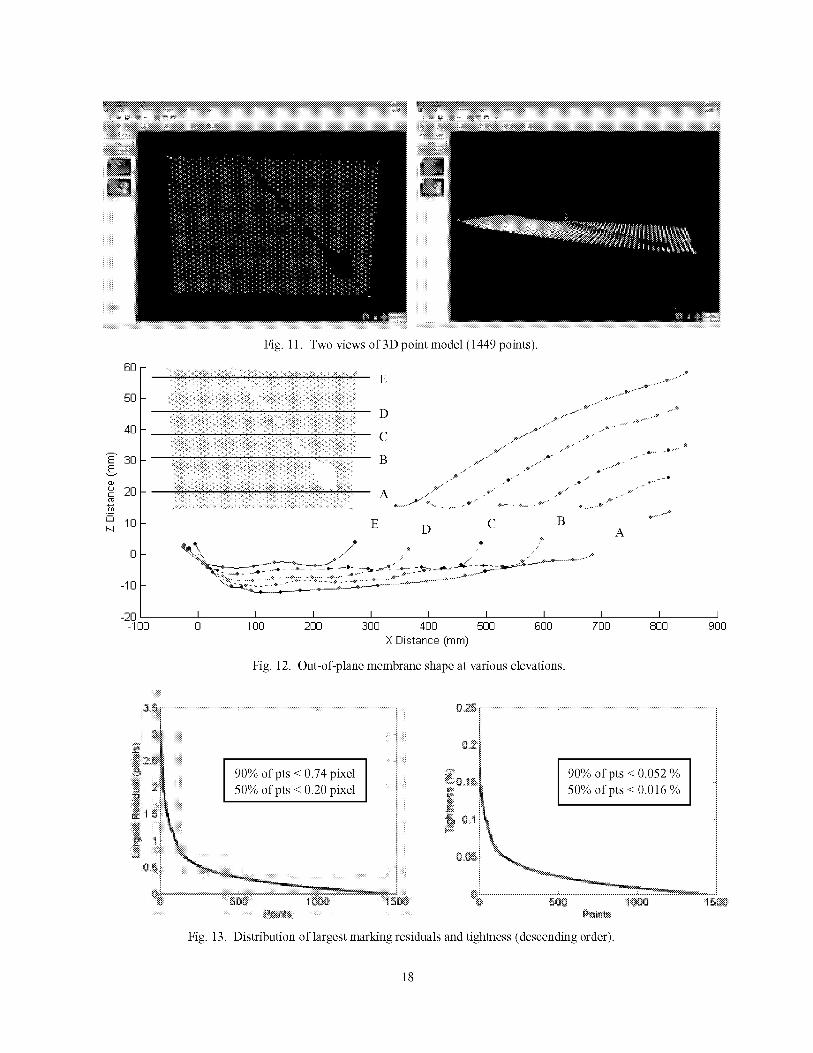
Fig.11.Twoviewsof3Dpointmodel(1449points).
o
-1o
-20-1oo
E
D
C
B
A
0 1O0 200 300 400 500 600 700
× Distance (ram)
Fig. 12. Out-of-plane membrane shape at various elevations.
800 900
,90 ofpts oos2 _,°,_°_ I_o_ofpts<o.o_
-\
Fig. 13. Distribution of largest marking residuals and tightness (descending order).
18

REPORT DOCUM ENTATION PAGE Form ApprovedOMB No. 0704-0188
Public reporting burden for this collection of information is estimated to average 1 hour per response, including the time for reviewing instructions, searching existing datasources, gathering and maintaining the data needed, and completing and reviewing the collection of information. Send comments regarding this burden estimate or any otheraspect of this collection of information, including suggestions for reducing this burden, to Washington Headquarters Services, Directorate for Information Operations andReports, 1215 Jefferson Davis Highway, Suite 1204, Arlington, VA 22202-4302, and to the Office of Management and Budget, Paperwork Reduction Project (0704-0188),Washington r DC 20503.1. AGENCY USE ONLY (Leave blank) 2. REPORT DATE 3. REPORT TYPE AND DATES COVERED
June 2002 Technical Memorandum
4. TITLE AND SUBTITLE 5. FUNDING NUMBERS
Photogrammetry Methodology Development for Gossamer Spacecraft
Structures WU-755-06-00-11
6. AUTHOR(S)Richard S. Pappa
Thomas W. Jones
Jonathan T. Black
Alan Walford
Stuart Robson
Mark R. Shortis
7. PERFORMING ORGANIZATION NAME(S) AND ADDRESS(ES)
NASA Langley Research Center
Hampton, VA 23681-2199
9. SPONSORING/MONITORING AGENCY NAME(S) AND ADDRESS(ES)
National Aeronautics and Space Administration
Washington, DC 20546-0001
8. PERFORMING ORGANIZATIONREPORT NUMBER
L-18200
10. SPONSORING/MONITORINGAGENCY REPORT NUMBER
NASA/TM-2002-211739
11. SUPPLEMENTARY NOTES
Pappa and Jones: Langley Research Center, Hampton, Va; Black: George Washington University; Walford: Eos
System, Inc.,Vancouver, Canada; Robson: University College London, London, United Kingdom; Shortis:
University of Melbourne, Parkville, Australia. Presented as paper number AIAA-2002-1375, April 22-25, 2002.12a. DISTRIBUTION/AVAILABILITY STATEMENT
Unclassified-Unlimited
Subject Category 39 Distribution: Standard
Availability: NASA CASI (301) 621-0390
12b. DISTRIBUTION CODE
13. ABSTRACT (Maximum 200 words)
Photogrammetry--the science of calculating 3D object coordinates from images--is a flexible and robust
approach for measuring the static and dynamic characteristics of future ultra-lightweight and inflatable space
structures (a.k.a., Gossamer structures), such as large membrane reflectors, solar sails, and thin-film solar arrays.
Shape and dynamic measurements are required to validate new structural modeling techniques and
corresponding analytical models for these unconventional systems. This paper summarizes experiences at NASA
Langley Research Center over the past three years to develop or adapt photogrammetry methods for the specific
problem of measuring Gossamer space structures. Turnkey industrial photogrammetry systems were not
considered a cost-effective choice for this basic research effort because of their high purchase and maintenance
costs. Instead, this research uses mainly off-the-shelf digital-camera and software technologies that are
affordable to most organizations and provide acceptable accuracy.
14. SUBJECT TERMS
Close-Range Photogrammetry, Videogrammetry, Gossamer Spacecraft, Ultra-
Lightweight and Inflatable Space Structures, Optical Measurement Techniques
17. SECURITY CLASSIFICATION 18. SECURITY CLASSIFICATION 19. SECURITY CLASSIFICATIONOF REPORT OF THIS PAGE OF ABSTRACT
Unclassified Unclassified Unclassified
NSN 7540-01-280-5500
15. NUMBER OF PAGES
2316. PRICE CODE
20. LIMITATIONOF ABSTRACT
LrL
Standard Form 298 (Rev. 2-89)Prescribed by ANSI Std. Z-39-18298-102