methodology for calculating latency of gps probe … · methodology for calculating latency of gps...
TRANSCRIPT
ZhongxiangWang
Jan 10th 2017
Masoud Hamedi
Methodology for Calculating Latency of GPS Probe Data
Stanley Young

2
OUTLINE
1. INTRODUCTION
2. LITERATURE REVIEW
3. METHODOLOGY
4. CASE STUDY
5. CONCLUSION
Latency

LATENCY is the time
difference between GPS-
probe data and real traffic
condition;
It describes the
punctuality of data;
It is crucial to real-time
applications.
What is Latency?
3
INT
RO
DU
CT
ION
Latency

4
LITE
RA
TU
RE
RE
VIE
WSources of Latency

5
LITE
RA
TU
RE
RE
VIE
W
Latency is defined as “the difference between the time the traffic flow isperturbed and the time that the change in speed is reflected in the data”.
Latency
Definition of Latency
Latency

6
LITE
RA
TU
RE
RE
VIE
W
Kim, Seoungbum, and Benjamin Coifman. "Comparing INRIX speed data against concurrent loop detector stations over several months." Transportation Research Part C: Emerging Technologies 49 (2014): 59-72.
• Objective: Maximizing Correlation Coefficient • Average latency : 6.8 minutes• Maximum latency could exceed 10 minutes in many time periodso Reference data: Loop detectoro Aggregating data into 10 second time interval
• INRIX will deliver current speed, travel time, average speed…with latency on average of 4.5 minutes.
INRIX.(2007). Traffic Data and Associated Services along the I-95 Corridor
Current Research

7
ME
TH
OD
OLO
GY
Bluetooth data preparation
• Transferring travel time data into TMC segment space mean speed data;
• Aggregating Bluetooth data into one minute basis.
Data Filtering
The following observations are identified and discarded:
• Observations with unreasonably low or high speeds;
• Observations in a particular time interval that are far from the average of the rest of
the speeds observed in the same time interval.
Data Processing

8
ME
TH
OD
OLO
GY
Data Interpolation
( )1 1, 2,31t i t t n t
is s s s in+ + += + − ∀ =+
Missing Interval: n=3
i=1 i=2 i=3
𝑠𝑠𝑡𝑡𝑠𝑠𝑡𝑡−1 𝑠𝑠𝑡𝑡+𝑖𝑖 𝑠𝑠𝑡𝑡+𝑛𝑛+1 𝑠𝑠𝑡𝑡+𝑛𝑛+2… …
The average of the neighboring observations is considered as the travel speed for the missing interval (only applied to less than or equal to 5 mins).
Data Processing

9
ME
TH
OD
OLO
GY
Data Smoothing
Weighted moving average function
1 2 3 40.33 0.27 0.20 0.13 0.07k k k k k ky x x x x x− − − −= + + + +
Arithmetic growth of the weights with the previous five time intervals
Why filtfilt? Smoothing may introduce undesired horizontal shift into the time series, however in filtfilt, forward shift is followed by a backward shift, so the artificial shift is compensated.
Data Processing
𝑥𝑥𝑘𝑘−4 𝑥𝑥𝑘𝑘−3 𝑥𝑥𝑘𝑘−2 𝑥𝑥𝑘𝑘−1 𝑥𝑥𝑘𝑘𝑦𝑦𝑘𝑘 =Smoothed Raw Data

10
ME
TH
OD
OLO
GY
Data Smoothing
Less noise
No shift
Data Processing

11
ME
TH
OD
OLO
GY
Flow chartBluetooth Field
Data
Paired Travel Time Data
Paired Data without Outliers
Segment Travel Speed Data
Speed Data without Gap
GPS-probe Data
GPS-probe Data without Gap
Path dataBluetooth Data
Processing
GPS-probe Data
Processing
Filter
Convert
Interpolate
One-min Speed Data
Aggregate
Smoothed Speed Data
SmoothSmoothed GPS-
probe Data
Filter (rule out data with low confidence score)
Interpolate
Smooth
Calculating Latency
Data Processing

12
ME
TH
OD
OLO
GY
Find the shift distance that maximizes the overlapping of Bluetooth data and GPS-probe data.
( )
1
2
1
min 1 =
min 2 =
min 3 = corr( , )
nBT probe datat t latency
t
nBT probe datat t latency
t
BT probe datat t latency
f S S
f S S
f S S
lb latency ub
−=
−=
−
−
−
≤ ≤
∑
∑ Gives more weights to the points that have bigger difference
Statistical representation of the linear relationship between two curves
Absolute vertical distance between two curves
Objective

13
Latency
ME
TH
OD
OLO
GY
1min 1 =
nBT probe datat t latency
tf S S −
=
−∑
– as exampleMinimize Absolute Vertical Distance (f1)

14
CA
SE ST
UD
Y
Road type: Freeway
Location: South Carolina, I-85 (Exit 48 to Exit 54, 7.15 miles) & I-26 (Exit 103 to Exit 108 , 4.28 miles)
Direction: both directions
Time: Dec 3, 2015 to Dec15, 2015
Test scenarios: 1. Morning & Afternoon Peaks;2. Different TMC segments; 3. Slowdown & recovery.
Data Selection I-85
I-26

15
CA
SE ST
UD
YComparisonResult
Latency
16
CA
SE ST
UD
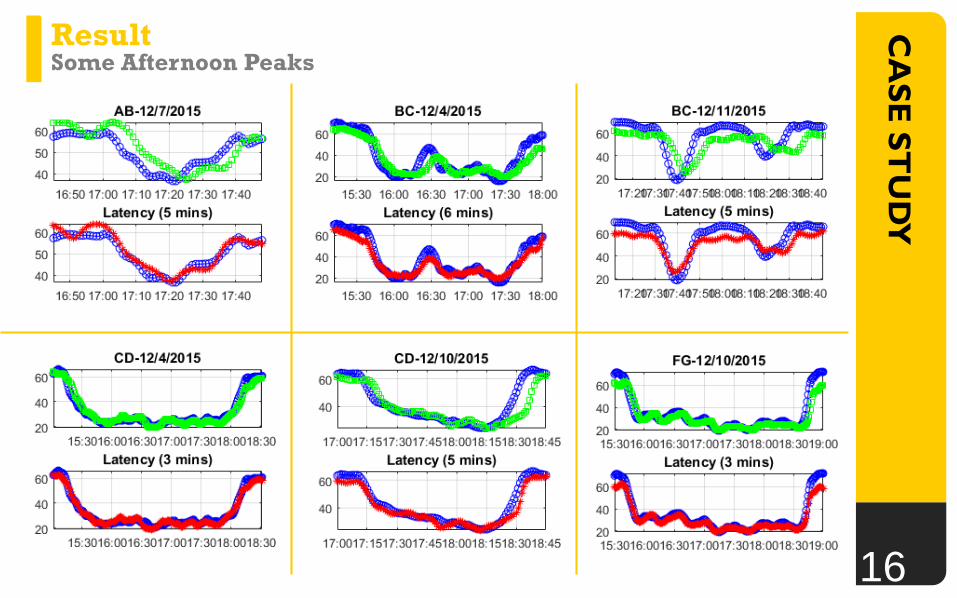
YResultSome Afternoon Peaks

17
CA
SE ST
UD
YTest One: Average Latency at Peak PeriodsResult
Period Number of Observations
Average Latency (minute)f1 (AVD) f2 (SVD) f3 (COR) Average
Morning 32 3.96 4.42 4.41 4.26Afternoon 45 3.64 4.01 4.19 3.94
Latency measured by three different fitness objectives “converged”;
Latency in the morning peaks in slightly higher than that in the afternoon, but not significant;

18
CA
SE ST
UD
YResult
Similar distributions at
morning and afternoon;
4 minutes latency has
the highest
probability/distribution;
95% of latency values
fall within 6 minutes for
both morning/afternoon
peaks.
Test One: Average Latency at Peak Periods

19
CA
SE ST
UD
YResult
Segment Length (mile)
Average Latency (minute)f1
(AVD)f2
(SVD)f3
(COR) Avg.
BC 1.17 4.80 5.00 5.00 4.93KL 1.28 4.43 4.86 5.00 4.76LM 1.60 3.33 3.83 3.83 3.66OP 1.64 4.67 5.00 5.00 4.89AB 1.69 4.56 4.56 4.67 4.60PQ 1.70 4.78 4.89 4.89 4.85MN 1.78 4.00 4.18 3.95 4.04GH 2.02 3.40 3.40 3.00 3.27CD 2.07 3.92 4.50 4.50 4.31FG 2.20 2.76 4.06 4.59 3.80
Avg. for all segments 1.72 4.06 4.43 4.44 4.31
Latency is not significantly correlated with the length of the segment;
Latency is consistent with previous analysis.
Test Two: Average Latency at Different Segments
20
CA
SE ST
UD
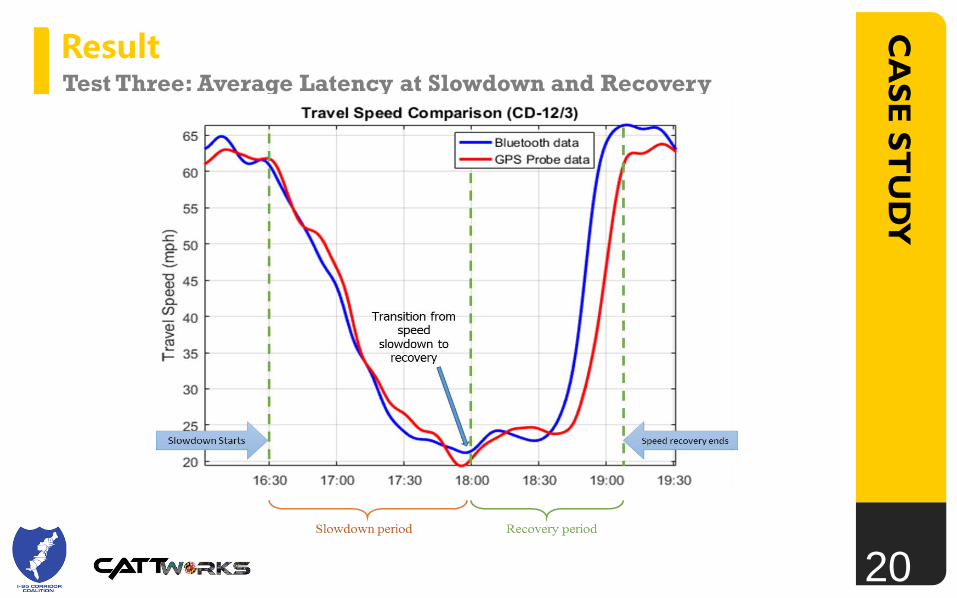
YTest Three: Average Latency at Slowdown and RecoveryResult

21
CA
SE ST
UD
YResult
Time Period Scenario Number of
ObservationsAverage Latency (minute)
f1 (AVD) f2 (SVD) f3 (COR) Average
MorningSlowdown 32 3.55 3.60 3.90 3.68
Recovery 32 4.76 5.15 4.45 4.83
AfternoonSlowdown 45 3.43 3.45 3.75 3.54
Recovery 45 4.70 4.94 4.62 4.76
OverallSlowdown 77 3.48 3.51 3.81 3.60
Recovery 77 4.72 5.03 4.55 4.79
Significant reduction in traffic speed slowdown seems to be reflected in probe data with 25% less latency compared to the recovery from slowdowns.
Test Three: Average Latency at Slowdown and Recovery

22
CO
NC
LUSIO
N
Analyze latency associated with GPS probe data Propose an iterative methodology to quantify the latency Conduct case study on two freeway segments at South
Carolina (average latency is around 4 mins)
Conclusion
Latency: is slightly higher at morning peaks than afternoon peaks has no significant difference at different segments is smaller at slowdown than recovery

23
FUT
UR
E R
ESE
AR
CH
Future Research
Investigate the impact of smoothing
Pattern matching algorithms applied to arterials
Larger dataset from multiple probe data vendors
Test other potential influential attributes
If exists consistent latency under similar condition (off-line)

Thank you Q & A
Masoud HamediSenior Research ScientistCenter for Advanced Transportation TechnologyUniversity of Maryland5000 College AveCollege Park, MD 20740Email: [email protected] | Phone:301-405-2350
Zhongxiang WangGraduate StudentDepartment of Civil & Environmental EngineeringUniversity of MarylandEmail: [email protected]
Stanley YoungAdvanced Transportation and Urban ScientistNational Renewable Energy LaboratoryEmail: [email protected]