methods of calculating total equivalent warming …...6 methods of calculating total equivalent...
TRANSCRIPT

Methods of calculating Total Equivalent Warming Impact (TEWI) 2012
BEST PRACTICE
GUIDELINES
THE AUSTRALIAN INSTITUTE OF REFRIGERATION, AIR CONDITIONING AND HEATING
2
METHODS OF CALCULATING TOTAL EQUIVALENT WARMING IMPACT (TEWI) BEST PRACTICE GUIDELINES
www.airah.org.au
DisclaimerThe Australian Institute of Refrigeration, Air conditioning and Heating (AIRAH) would like to thank all those involved in developing the Best Practice Guideline: Methods of Calculating TEWI 2012, including the British Refrigeration Association for allowing AIRAH to use the 2006 standard as a base reference, project sponsors Refrigerants Australia, AIRAH Natural Refrigerants special technical group, and the principal author, Expert Group. Special mention is made of Jonathan Fryer M.AIRAH, Kevin Lee M.AIRAH and Tony Queenin for their technical input.
© AIRAH 2012
Design and layout: Artifishal Studios 140 Johnston St, Fitzroy Victoria 3065 Tel: 03 9417 7420 | www.artifishal.com.au
Methods of calculating Total Equivalent Warming Impact (TEWI) 2012
BEST PRACTICE
GUIDELINES
www.airah.org.au
3
METHODS OF CALCULATING TOTAL EQUIVALENT WARMING IMPACT (TEWI)BEST PRACTICE GUIDELINES
Contents1. Introduction 4
1.1. Introduction 4
1.2. What is TEWI? 4
1.3. What is lCCP? 4
1.4. Relevance of TEWI 5
1.5. Limitations 5
1.6. Existing systems 5
1.7. Calculation factors or parameters 5
1.8. Revisions 6
2. Method of calculation 7
2.1. Method of calculation 7
3. Calculation parameters and factors 8
3.1. Direct emissions 8
3.1.1. Leak rates 8
3.1.2. Global Warming Potential values for refrigerants 9
3.1.3. Refrigerant recovery rates 10
3.2. Indirect emissions 11
3.2.1. Indirect emission factors 11
3.3. Total annual electricity consumption 11
3.3.1. Compressor energy consumption 13
3.3.2. Ambient temperature BINS and operating hours 15
3.3.3. Energy consumption of ancillary components 16
3.3.4. Load factors for ancillary components 17
3.3.5. Heat rejection considerations 17
3.3.6. Electricity consumption check 17
3.4. Limitations 18
Appendices 20
Appendix A: Glossary 20
Appendix B: Sample calculations 23
I) Self-contained retail display case 23
II) Supermarket refrigeration system 25
Appendix C: Resources 26
I) Refrigerant leak rate references 26
II) Useful references 27
Methods of calculating TotalEquivalent Warming Impact (TEWI) 2012
BEST PRACTICE
GUIDELINES
www.airah.org.au

4
METHODS OF CALCULATING TOTAL EQUIVALENT WARMING IMPACT (TEWI) BEST PRACTICE GUIDELINES
www.airah.org.au
1.1. IntroductionThis guide provides a standardised method of calculating Total Equivalent Warming Impact (TEWI) for new, stationary refrigeration and air conditioning systems at the design stage. Its aim is to assist facility operators, designers and industry practitioners to compare the environmental implications of different technical options available to meet their HVAC&R requirements.
1.2. What is TEWI?TEWI is a measure of the global warming impact of equipment based on the total related emissions of greenhouse gases during the operation of the equipment and the disposal of the operating fluids at the end-of-life. TEWI takes into account both direct fugitive emissions, and indirect emissions produced through the energy consumed in operating the equipment. TEWI is measured in units of mass in kg of carbon dioxide equivalent (CO2-e).
TEWI is calculated as the sum of two parts, they are:
1. Refrigerant released during the lifetime of the equipment, including unrecovered losses on final disposal, and
2. The impact of CO2 emissions from fossil fuels used to generate energy to operate the equipment throughout its lifetime.
1.3. What is LCCP?LCCP = TEWI
+ GWP (indirect; energy consumption from chemical production and transport, manufacturing components/assembly and end-of-life)
+ GWP (direct; chemical refrigerant emissions incl. atmospheric reaction products, manufacturing leakage and end-of-life)
LCCP differs from TEWI in that it specifically includes some items excluded from TEWI. These are the direct fugitive emissions during manufacture of equipment and fluids, and the greenhouse gas emissions associated with their embodied energy. Pearson found that combined fugitive emissions and embodied energy for the production of R-134a and of R-404A accounted for around 1% of the GWP value, considerably less than the uncertainty in an LCCP calculation for stationary equipment.
The Air Conditioning, Heating and Refrigeration Technology Institute (AHRTI) have developed a standardised methodology to calculate the LCCP of stationary refrigeration and air conditioning equipment, contact AHRTI for details on their model.
1.4. Relevance of TEWIThe need to control emissions of greenhouse gases as set out in the Kyoto Protocol requires ongoing careful consideration and evaluation of energy consuming activities. Many activities can result in the emission of more than one of the greenhouse gases. TEWI is a methodology for computing the total relevant emissions of greenhouse gases for specific applications, in this case refrigeration and air conditioning. It is important to note that the largest impact of global warming from stationary refrigeration and air conditioning is through electricity generation to power the equipment. Approximately 45,000 GWh, or 21.9% of all electricity sent out in Australia in 2006 and resulted in as much as 7% (including mobile air conditioning and refrigeration) of all greenhouse gas emission in Australia in that year or 40 Mt of CO2-e.
1.5. LimitationsTEWI calculations are dependent on a number of assumptions about equipment performance and use patterns, refrigerant properties, and electricity generation
Introduction1
www.airah.org.au
5
METHODS OF CALCULATING TOTAL EQUIVALENT WARMING IMPACT (TEWI)BEST PRACTICE GUIDELINES
efficiencies. The values used will be subject to considerable uncertainty. In particular, refrigerant GWP values are subject to wide uncertainty levels (see section 3.1.2). It is important to appreciate therefore that small differences in TEWI may not be meaningful.
Recommendations about sensitivity analysis (i.e. upper and lower threshold) and validity of comparisons are included and it is important to bear these in mind if TEWI is to be a useful design tool. It must be emphasised that the TEWI comparison, to be of real value, must relate to systems of equal duty and function. There is little practical purpose in comparing, for example, the TEWI values of a domestic refrigerator and of a supermarket display cabinet.
1.6. Existing systemsTEWI for an existing refrigeration system can be readily derived from actual refrigerant usage data and measured energy consumed, normally over a full year. The purpose of this Guideline is to address the need to estimate TEWI at the design stage, in order to assist proper decision-making and investment in lower emission technology.
1.7. Calculation factors or parameters
Calculation factors presented in this Guideline for various industry sectors represent current technology and industry best practice for new stationary installations. The factors are subject to change and will be updated as appropriate. It will therefore be important to use only factors from the latest published version of the AIRAH guide and current refrigerant properties and indirect emission factors.
The general method shown for calculating TEWI is simple and straightforward to use. Examples of simple and complex vapour compression cycle refrigeration applications are given in Appendix B for a self-contained display case and a supermarket refrigeration system. Detailed models of these examples are provided in spreadsheet format to allow users to undertake further analysis. The principles given here are readily extended to other applications, including air conditioning, process refrigeration and cold storage facilities, and the workbook templates provided can be adapted for these applications.
1.8. RevisionsRecommendations for improvements or additions to this document will be welcomed and should be addressed to AIRAH.
www.airah.org.au

6
METHODS OF CALCULATING TOTAL EQUIVALENT WARMING IMPACT (TEWI) BEST PRACTICE GUIDELINES
www.airah.org.au
2.1. Method of calculationThis methodology for calculating total equivalent warming impact (TEWI) is for new stationary refrigeration and air conditioning (RAC) systems that operate on vapour compression principles and are powered by mains electricity connected to the grid.
The method of calculating TEWI is provided below:
TEWI = GWP (direct; refrigerant leaks incl. EOL) + GWP (indirect; operation)
= (GWP x m x L annual x n) + GWP x m x (1 – αrecovery)) + (Eannual x β x n)
Where:
GWP = Global Warming Potential of refrigerant, relative to CO2 (GWP CO2 = 1)
Lannual = Leakage rate p.a. (Units: kg)
n = System operating life (Units: years)
m = Refrigerant charge (Units: kg)
αrecovery = Recovery/recycling factor from 0 to 1
Eannual = Energy consumption per year (Units: kWh p.a.)
β = Indirect emission factor (Units: kg CO2 per kWh)
Method of calculation2
The TEWI equation provided can be found, amongst other places, in EN 378-1: 2008, Refrigerating System and Heat Pumps Safety and Environmental Requirements, Annex B. When greenhouse gases may be emitted by insulation (i.e. display cases) or other components in the cooling or heating system the global warming potential of such gases is to be added to the above equation.
The aim of this method is to provide predictive estimates for the TEWI values of new systems that can be usefully compared with confidence, even when different estimators have prepared these. Sensitivity analysis is recommended to calculate lower and upper threshold TEWI values, which provides an expected band.

7
METHODS OF CALCULATING TOTAL EQUIVALENT WARMING IMPACT (TEWI)BEST PRACTICE GUIDELINES
www.airah.org.au
3.1. Direct emissionsThere are four main types of direct emissions from HVAC&R equipment, they are:
• Gradualleaksduringnormaloperation
• Catastrophiclossesduringnormaloperation
• Lossesduringplantserviceandmaintenance
• Lossesatendofplantlife
3.1.1. Leak ratesThe annual leak rate referred to in this Guideline is the sum of gradual leakage during normal operation, catastrophic losses amortized over the life of the equipment and losses during service and maintenance expressed as a percentage of the initial charge per annum. Losses at the end of plant life are not included in the annual leak rate.
Annual leak rates vary significantly depending on the class of equipment, refrigerant type, vintage, equipment design (i.e. flared connections, Schrader valves, type of condenser), workmanship of installation, vibration elimination, refrigerant leak detection, maintenance and operating conditions.
This Guideline provides an upper, lower and typical annual leak rate for a variety of classes of HVAC&R equipment as a guide for practioners to undertake a TEWI calculation based on a typical application or provide a range based on an upper and lower threshold. The annual leak rates are provided in Table 1 and Appendix C, i) Leak rate references provides supporting references for these guidelines.
3.1.2. Global Warming Potential values for refrigerants
The Global Warming Potential of a refrigerant is defined as the integrated radiative forcing over a ‘time horizon’ following an assumed release of 1kg divided by the integrated radiative forcing over the same period from release of 1 kg of carbon dioxide.
The (Intergovernmental Panel on Climate Change) IPCC has refined GWP values over the past two decades, publishing four assessments, with a fifth assessment underway. The IPCC is recognized as the most authoritative scientific and technical voice on GWP values, and its assessments are used in the United Nations Framework Convention (UNFCCC) and its Kyoto Protocol. The UNFCCC adopted the 100 year second assessment values (AR2), which are used as a basis for regulation in Australia and are the most widely used GWP values internationally.
Whilst the fourth assessment values (AR4) are considered a more accurate technical appraisal, and it is possible that the AR4 values will be adopted by the UNFCCC in any post Kyoto Protocol agreements, for the time being the AR2 values are the ones being used as the basis for regulation and are the values recommended by this guideline.
Table 2 provides a comparison of commonly used refrigerant gases and blends calculated based on the second and fourth assessments.
Calculation parameters and factors
3

8
METHODS OF CALCULATING TOTAL EQUIVALENT WARMING IMPACT (TEWI) BEST PRACTICE GUIDELINES
www.airah.org.au
3.1.3. Refrigerant recovery rates
The Intergovernmental Panel of Climate Change (IPCC) issue good practice guidelines of refrigerant recovery efficiencies that range from 70% to 95% of remaining charge depending on the equipment classes. In practice the refrigerant recovery rate from a system with a refrigerant charge greater than 100 kg would be expected to be 90 to 95% of the remaining charge, and around 70% for equipment with smaller charges. The losses at the end of plant life equate to less than 1% per annum amortized over the life of the equipment.
This Guideline recommends the use of a refrigerant recovery rate of 70% of the original charge for systems with a refrigerant charge less than 100 kg and 95% for systems with larger charges.
3.2. Indirect emissionsIndirect electricity emission factors, sometimes referred to as CO2 emission factors, are based on average emissions intensity of total electric sector generation for the country, State or region. The kg of CO2 emitted per kWh of electricity supplied is dependent on the fuel mix for electricity generation. For coal fired power stations the figure is relatively high, for gas-fired stations it is lower, and for hydroelectric, wind power, or solar it is close to zero.
Table 1: Annual leak rates by equipment class/application
Equipment class/applicationAnnual leak rates (% p.a.)
Lower Typical Upper
Refrigeration applications
Centralised system (i.e. supermarket rack) 5%Maintained = 12.5%,
otherwise 15%23%
Chillers (i.e. cold storage facilities, process refrigeration) 5% 7% 16%
Condensing units (i.e. Walk-in coolrooms) 5%Maintained = 12.5%,
otherwise 15%23%
Self-contained refrigeration system — 2% —
Road transport 15% 20% 23%
Marine 20% 30% 40%
Air conditioning applications
Chillers 5% 7% 9%
Chillers (HCFC-123) — 2% —
Roof top packaged systems 4% 5% 9%
Split systems (single and multi) 3% 4% 9%
Window/wall units and portable — 2% —
Table 2: GWP values for selected refrigerants
GWP values for selected refrigerants
AR2 1996 AR4 2007
CO2 1 1
HFC-32 650 675
HFC-134a 1,300 1,430
HFC-407A 1,770 2,107
HFC-407C 1,526 1,774
HFC-404A 3,260 3,922
HFC-410A 1,725 2,088
HFC-507 3,300 3,985
HFC-422D 2,232 2,729
HFC-427A 1,828 2,138
For comparison only, not covered by Kyoto Protocol or permitted for use in new equipment in Australia.
HCFC-22 1,500 1,810
9
METHODS OF CALCULATING TOTAL EQUIVALENT WARMING IMPACT (TEWI)BEST PRACTICE GUIDELINES
www.airah.org.au
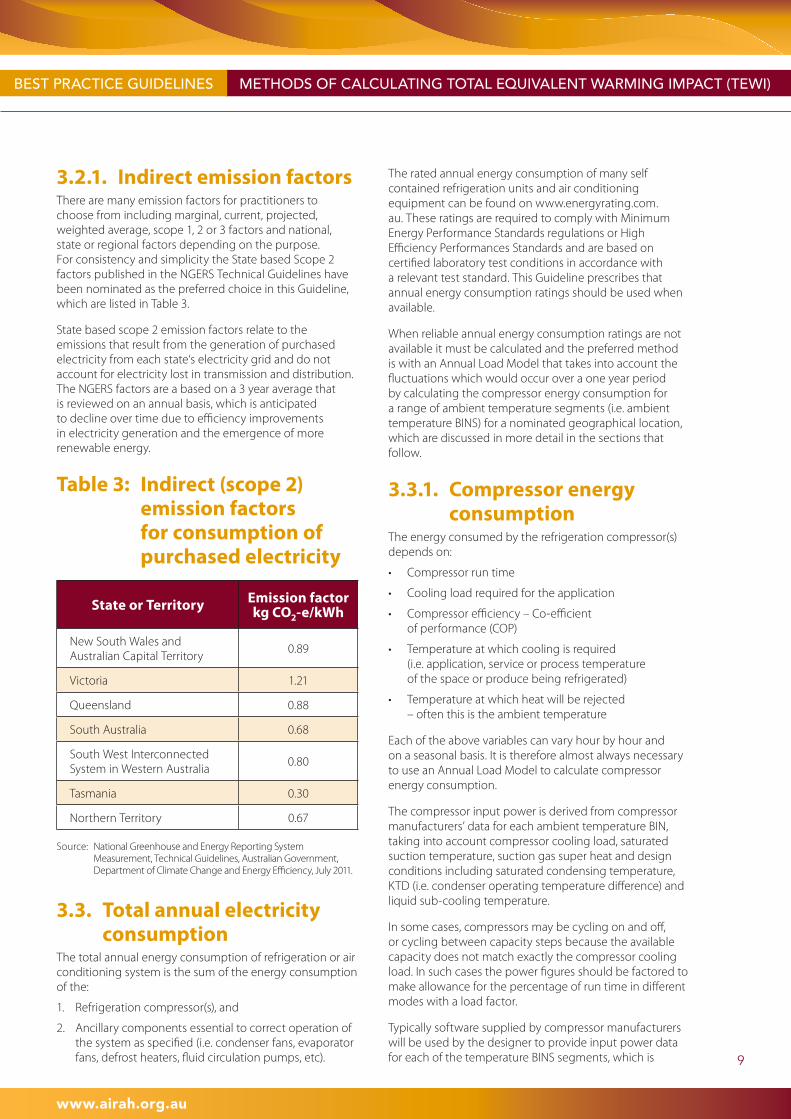
3.2.1. Indirect emission factorsThere are many emission factors for practitioners to choose from including marginal, current, projected, weighted average, scope 1, 2 or 3 factors and national, state or regional factors depending on the purpose. For consistency and simplicity the State based Scope 2 factors published in the NGERS Technical Guidelines have been nominated as the preferred choice in this Guideline, which are listed in Table 3.
State based scope 2 emission factors relate to the emissions that result from the generation of purchased electricity from each state‘s electricity grid and do not account for electricity lost in transmission and distribution. The NGERS factors are a based on a 3 year average that is reviewed on an annual basis, which is anticipated to decline over time due to efficiency improvements in electricity generation and the emergence of more renewable energy.
Table 3: Indirect (scope 2) emission factors for consumption of purchased electricity
3.3. Total annual electricity
consumptionThe total annual energy consumption of refrigeration or air conditioning system is the sum of the energy consumption of the:
1. Refrigeration compressor(s), and
2. Ancillary components essential to correct operation of the system as specified (i.e. condenser fans, evaporator fans, defrost heaters, fluid circulation pumps, etc).
The rated annual energy consumption of many self contained refrigeration units and air conditioning equipment can be found on www.energyrating.com.au. These ratings are required to comply with Minimum Energy Performance Standards regulations or High Efficiency Performances Standards and are based on certified laboratory test conditions in accordance with a relevant test standard. This Guideline prescribes that annual energy consumption ratings should be used when available.
When reliable annual energy consumption ratings are not available it must be calculated and the preferred method is with an Annual Load Model that takes into account the fluctuations which would occur over a one year period by calculating the compressor energy consumption for a range of ambient temperature segments (i.e. ambient temperature BINS) for a nominated geographical location, which are discussed in more detail in the sections that follow.
3.3.1. Compressor energy consumption
The energy consumed by the refrigeration compressor(s) depends on:
• Compressorruntime
• Coolingloadrequiredfortheapplication
• Compressorefficiency–Co-efficient of performance (COP)
• Temperatureatwhichcoolingisrequired (i.e. application, service or process temperature of the space or produce being refrigerated)
• Temperatureatwhichheatwillberejected – often this is the ambient temperature
Each of the above variables can vary hour by hour and on a seasonal basis. It is therefore almost always necessary to use an Annual Load Model to calculate compressor energy consumption.
The compressor input power is derived from compressor manufacturers’ data for each ambient temperature BIN, taking into account compressor cooling load, saturated suction temperature, suction gas super heat and design conditions including saturated condensing temperature, KTD (i.e. condenser operating temperature difference) and liquid sub-cooling temperature.
In some cases, compressors may be cycling on and off, or cycling between capacity steps because the available capacity does not match exactly the compressor cooling load. In such cases the power figures should be factored to make allowance for the percentage of run time in different modes with a load factor.
Typically software supplied by compressor manufacturers will be used by the designer to provide input power data for each of the temperature BINS segments, which is
State or Territory Emission factor kg CO2-e/kWh
New South Wales and Australian Capital Territory
0.89
Victoria 1.21
Queensland 0.88
South Australia 0.68
South West Interconnected System in Western Australia
0.80
Tasmania 0.30
Northern Territory 0.67
Source: National Greenhouse and Energy Reporting System Measurement, Technical Guidelines, Australian Government, Department of Climate Change and Energy Efficiency, July 2011.
10
METHODS OF CALCULATING TOTAL EQUIVALENT WARMING IMPACT (TEWI) BEST PRACTICE GUIDELINES
www.airah.org.au
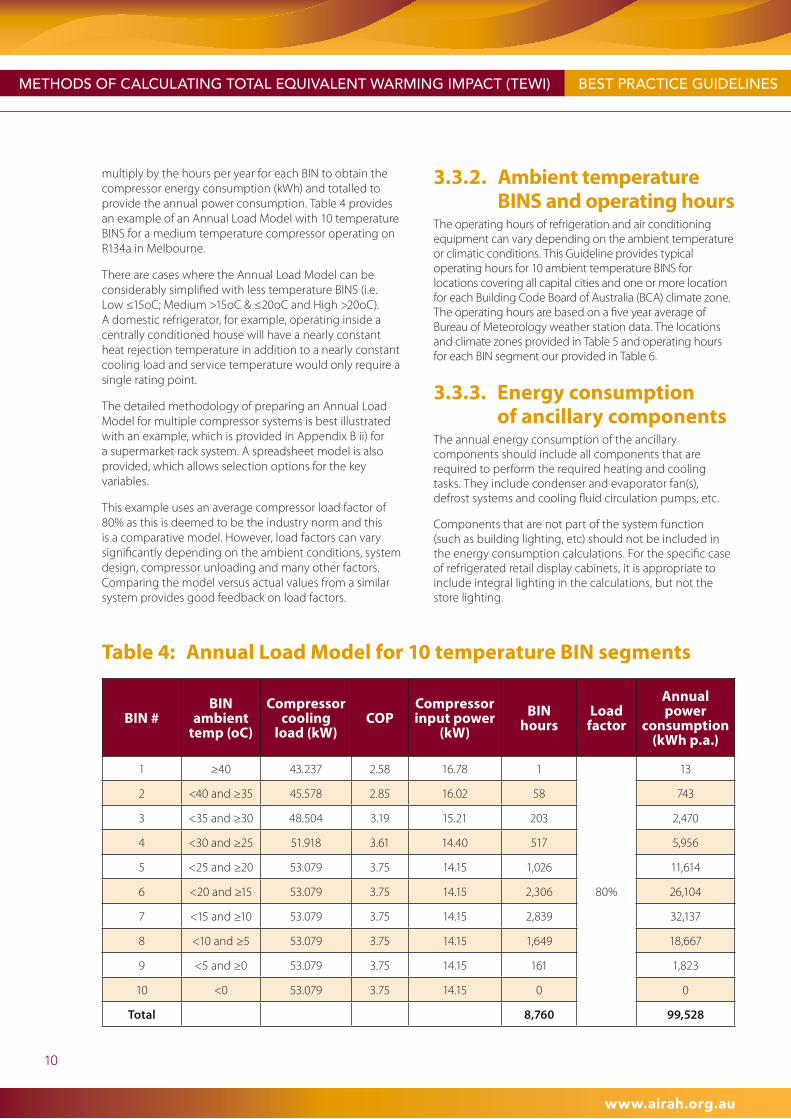
multiply by the hours per year for each BIN to obtain the compressor energy consumption (kWh) and totalled to provide the annual power consumption. Table 4 provides an example of an Annual Load Model with 10 temperature BINS for a medium temperature compressor operating on R134a in Melbourne.
There are cases where the Annual Load Model can be considerably simplified with less temperature BINS (i.e. Low ≤15oC; Medium >15oC & ≤20oC and High >20oC). A domestic refrigerator, for example, operating inside a centrally conditioned house will have a nearly constant heat rejection temperature in addition to a nearly constant cooling load and service temperature would only require a single rating point.
The detailed methodology of preparing an Annual Load Model for multiple compressor systems is best illustrated with an example, which is provided in Appendix B ii) for a supermarket rack system. A spreadsheet model is also provided, which allows selection options for the key variables.
This example uses an average compressor load factor of 80% as this is deemed to be the industry norm and this is a comparative model. However, load factors can vary significantly depending on the ambient conditions, system design, compressor unloading and many other factors. Comparing the model versus actual values from a similar system provides good feedback on load factors.
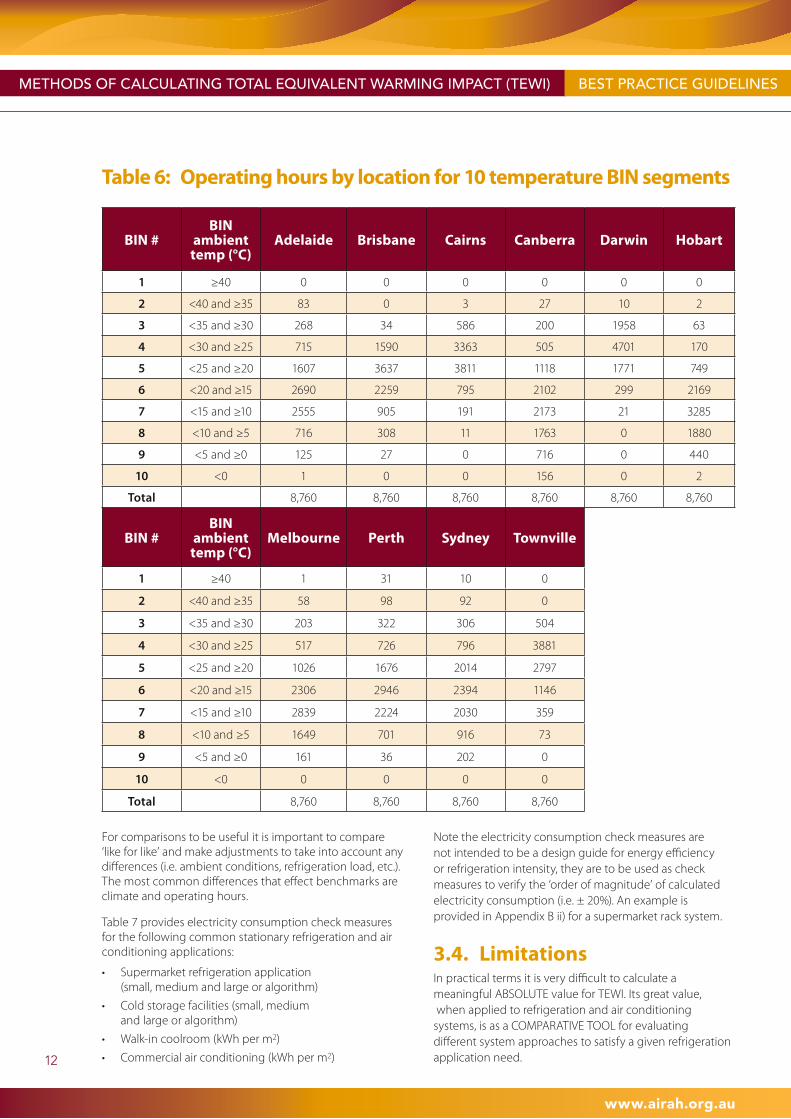
3.3.2. Ambient temperature BINS and operating hours
The operating hours of refrigeration and air conditioning equipment can vary depending on the ambient temperature or climatic conditions. This Guideline provides typical operating hours for 10 ambient temperature BINS for locations covering all capital cities and one or more location for each Building Code Board of Australia (BCA) climate zone. The operating hours are based on a five year average of Bureau of Meteorology weather station data. The locations and climate zones provided in Table 5 and operating hours for each BIN segment our provided in Table 6.
3.3.3. Energy consumption of ancillary components
The annual energy consumption of the ancillary components should include all components that are required to perform the required heating and cooling tasks. They include condenser and evaporator fan(s), defrost systems and cooling fluid circulation pumps, etc.
Components that are not part of the system function (such as building lighting, etc) should not be included in the energy consumption calculations. For the specific case of refrigerated retail display cabinets, it is appropriate to include integral lighting in the calculations, but not the store lighting.
BIN #BIN
ambient temp (oC)
Compressor cooling
load (kW)COP
Compressor input power
(kW)
BIN hours
Load factor
Annual power
consumption (kWh p.a.)
1 ≥40 43.237 2.58 16.78 1
80%
13
2 <40 and ≥35 45.578 2.85 16.02 58 743
3 <35 and ≥30 48.504 3.19 15.21 203 2,470
4 <30 and ≥25 51.918 3.61 14.40 517 5,956
5 <25 and ≥20 53.079 3.75 14.15 1,026 11,614
6 <20 and ≥15 53.079 3.75 14.15 2,306 26,104
7 <15 and ≥10 53.079 3.75 14.15 2,839 32,137
8 <10 and ≥5 53.079 3.75 14.15 1,649 18,667
9 <5 and ≥0 53.079 3.75 14.15 161 1,823
10 <0 53.079 3.75 14.15 0 0
Total 8,760 99,528
Table 4: Annual Load Model for 10 temperature BIN segments

11
METHODS OF CALCULATING TOTAL EQUIVALENT WARMING IMPACT (TEWI)BEST PRACTICE GUIDELINES
www.airah.org.au
Table 5: Locations and climate zones
BCA Climate zones Description Location
BOM Weather station
Station # Location
1High humid summer, warm winter
Cairns 31011 Cairns Airport
Darwin 14015 Darwin Airport
Townsville 32040 Townsville Airport
2 Warm humid summer, mild winter Brisbane 40913 Brisbane
3 Hot dry summer, warm winter Alice Springs 15590 Alice Springs Airport
4 Hot dry summer, cool winter Mildura 76031 Mildura Airport
5 Warm temperate
Sydney 66037 Sydney Airport
Adelaide 23090 Adelaide (Kent Town)
Perth 9021 Perth Airport
6 Mild temperate Melbourne 86071 Melbourne Regional Office
7 Cool temperateHobart 94008 Hobart Airport
Canberra 70351 Canberra Airport
8 Alpine Thredbo 71032 Thredbow
3.3.4. Load factors for ancillary components
When TEWI is being used in a competitive tendering situation, each of those tendering MUST use exactly the same load factors for ancillary equipment for comparisons of TEWI factors to be meaningful.
A recommended set of assumptions for this application, in terms of running time, is as follows.
Fixed speed fans 90%
AC VSD fans (1-phase) 70%
AC VSD fans (3-phase) 60%
DC EC fans 50%
Door heaters 100%
Cabinet integral lighting 50%
Defrost Heaters 5%
Crank case heaters have not been included as an ancillary component as in commercial refrigeration applications the energy consumption is negligible and for residential and light commercial air conditioning applications it is already included in the rated annual energy consumption calculations.
If for any particular installation different assumptions are known to be realistic, these may be used; however, the same assumptions MUST be used for any comparative assessments.
3.3.5. Heat rejection considerations
The aim of the TEWI calculation methodology is to provide predictive estimates so that new systems performing the same tasks can be usefully compared with confidence. In some instances different equipment configurations such as external or internal heat rejection may impact on the refrigeration loads, equipment operating times and TEWI values.
For example, if a self-contained refrigeration display case that rejects heat into the conditioned space were compared to a display case of equal duty and function with a remote condensing unit that rejects heat externally; an allowance for the heat rejection treatment would need to be included in the TEWI calculation. This allowance may take into account the additional air conditioner operating time or energy required to remove the heat added by the self-contained equipment on hot days less the energy savings on cold days.
3.3.6. Electricity consumption check
It is important to compare estimated electricity consumption values versus actual electricity consumption of a similar system. Electricity intensity check measures can be useful tools to verify electricity consumption estimates and assumptions.
12
METHODS OF CALCULATING TOTAL EQUIVALENT WARMING IMPACT (TEWI) BEST PRACTICE GUIDELINES
www.airah.org.au
For comparisons to be useful it is important to compare ‘like for like’ and make adjustments to take into account any differences (i.e. ambient conditions, refrigeration load, etc.). The most common differences that effect benchmarks are climate and operating hours.
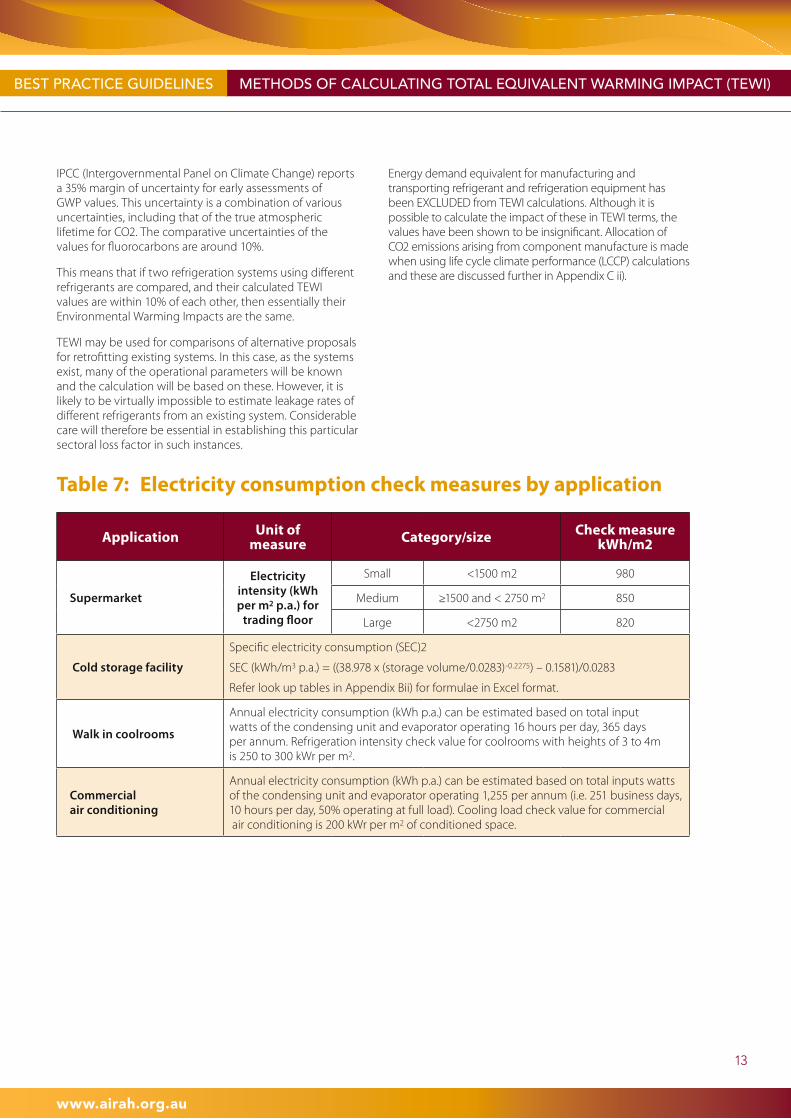
Table 7 provides electricity consumption check measures for the following common stationary refrigeration and air conditioning applications:
• Supermarketrefrigerationapplication (small, medium and large or algorithm)
• Coldstoragefacilities(small,medium and large or algorithm)
• Walk-incoolroom(kWhperm2)
• Commercialairconditioning(kWhperm2)
Note the electricity consumption check measures are not intended to be a design guide for energy efficiency or refrigeration intensity, they are to be used as check measures to verify the ‘order of magnitude’ of calculated electricity consumption (i.e. ± 20%). An example is provided in Appendix B ii) for a supermarket rack system.
3.4. LimitationsIn practical terms it is very difficult to calculate a meaningful ABSOLUTE value for TEWI. Its great value, when applied to refrigeration and air conditioning systems, is as a COMPARATIVE TOOL for evaluating different system approaches to satisfy a given refrigeration application need.
Table 6: Operating hours by location for 10 temperature BIN segments
BIN #BIN
ambient temp (°C)
Adelaide Brisbane Cairns Canberra Darwin Hobart
1 ≥40 0 0 0 0 0 0
2 <40 and ≥35 83 0 3 27 10 2
3 <35 and ≥30 268 34 586 200 1958 63
4 <30 and ≥25 715 1590 3363 505 4701 170
5 <25 and ≥20 1607 3637 3811 1118 1771 749
6 <20 and ≥15 2690 2259 795 2102 299 2169
7 <15 and ≥10 2555 905 191 2173 21 3285
8 <10 and ≥5 716 308 11 1763 0 1880
9 <5 and ≥0 125 27 0 716 0 440
10 <0 1 0 0 156 0 2
Total 8,760 8,760 8,760 8,760 8,760 8,760
BIN #BIN
ambient temp (°C)
Melbourne Perth Sydney Townville
1 ≥40 1 31 10 0
2 <40 and ≥35 58 98 92 0
3 <35 and ≥30 203 322 306 504
4 <30 and ≥25 517 726 796 3881
5 <25 and ≥20 1026 1676 2014 2797
6 <20 and ≥15 2306 2946 2394 1146
7 <15 and ≥10 2839 2224 2030 359
8 <10 and ≥5 1649 701 916 73
9 <5 and ≥0 161 36 202 0
10 <0 0 0 0 0
Total 8,760 8,760 8,760 8,760
13
METHODS OF CALCULATING TOTAL EQUIVALENT WARMING IMPACT (TEWI)BEST PRACTICE GUIDELINES
www.airah.org.au
IPCC (Intergovernmental Panel on Climate Change) reports a 35% margin of uncertainty for early assessments of GWP values. This uncertainty is a combination of various uncertainties, including that of the true atmospheric lifetime for CO2. The comparative uncertainties of the values for fluorocarbons are around 10%.
This means that if two refrigeration systems using different refrigerants are compared, and their calculated TEWI values are within 10% of each other, then essentially their Environmental Warming Impacts are the same.
TEWI may be used for comparisons of alternative proposals for retrofitting existing systems. In this case, as the systems exist, many of the operational parameters will be known and the calculation will be based on these. However, it is likely to be virtually impossible to estimate leakage rates of different refrigerants from an existing system. Considerable care will therefore be essential in establishing this particular sectoral loss factor in such instances.
Energy demand equivalent for manufacturing and transporting refrigerant and refrigeration equipment has been EXCLUDED from TEWI calculations. Although it is possible to calculate the impact of these in TEWI terms, the values have been shown to be insignificant. Allocation of CO2 emissions arising from component manufacture is made when using life cycle climate performance (LCCP) calculations and these are discussed further in Appendix C ii).
Table 7: Electricity consumption check measures by application
Application Unit of measure Category/size Check measure
kWh/m2
Supermarket
Electricity intensity (kWh per m2 p.a.) for
trading floor
Small <1500 m2 980
Medium ≥1500 and < 2750 m2 850
Large <2750 m2 820
Cold storage facility
Specific electricity consumption (SEC)2
SEC (kWh/m3 p.a.) = ((38.978 x (storage volume/0.0283)-0.2275) – 0.1581)/0.0283
Refer look up tables in Appendix Bii) for formulae in Excel format.
Walk in coolrooms
Annual electricity consumption (kWh p.a.) can be estimated based on total input watts of the condensing unit and evaporator operating 16 hours per day, 365 days per annum. Refrigeration intensity check value for coolrooms with heights of 3 to 4m is 250 to 300 kWr per m2.
Commercial air conditioning
Annual electricity consumption (kWh p.a.) can be estimated based on total inputs watts of the condensing unit and evaporator operating 1,255 per annum (i.e. 251 business days, 10 hours per day, 50% operating at full load). Cooling load check value for commercial air conditioning is 200 kWr per m2 of conditioned space.
14
METHODS OF CALCULATING TOTAL EQUIVALENT WARMING IMPACT (TEWI) BEST PRACTICE GUIDELINES
www.airah.org.au
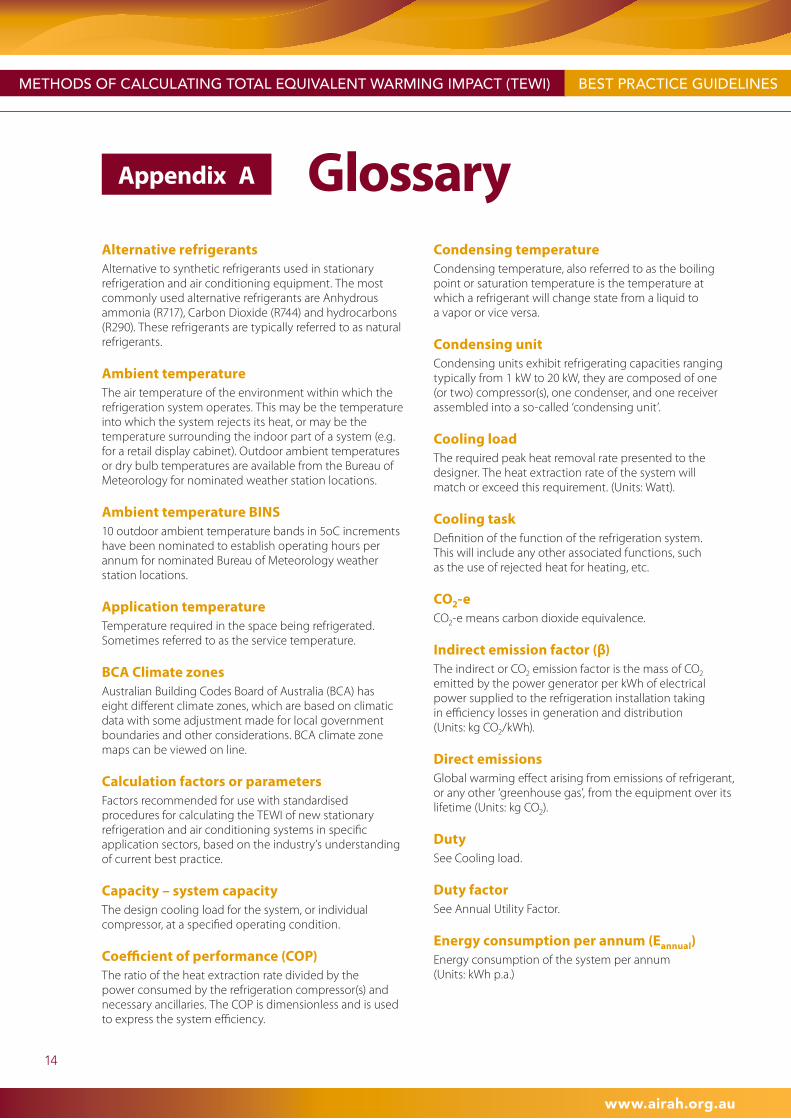
Alternative refrigerantsAlternative to synthetic refrigerants used in stationary refrigeration and air conditioning equipment. The most commonly used alternative refrigerants are Anhydrous ammonia (R717), Carbon Dioxide (R744) and hydrocarbons (R290). These refrigerants are typically referred to as natural refrigerants.
Ambient temperatureThe air temperature of the environment within which the refrigeration system operates. This may be the temperature into which the system rejects its heat, or may be the temperature surrounding the indoor part of a system (e.g. for a retail display cabinet). Outdoor ambient temperatures or dry bulb temperatures are available from the Bureau of Meteorology for nominated weather station locations.
Ambient temperature BINS10 outdoor ambient temperature bands in 5oC increments have been nominated to establish operating hours per annum for nominated Bureau of Meteorology weather station locations.
Application temperatureTemperature required in the space being refrigerated. Sometimes referred to as the service temperature.
BCA Climate zonesAustralian Building Codes Board of Australia (BCA) has eight different climate zones, which are based on climatic data with some adjustment made for local government boundaries and other considerations. BCA climate zone maps can be viewed on line.
Calculation factors or parametersFactors recommended for use with standardised procedures for calculating the TEWI of new stationary refrigeration and air conditioning systems in specific application sectors, based on the industry’s understanding of current best practice.
Capacity – system capacityThe design cooling load for the system, or individual compressor, at a specified operating condition.
Coefficient of performance (COP)The ratio of the heat extraction rate divided by the power consumed by the refrigeration compressor(s) and necessary ancillaries. The COP is dimensionless and is used to express the system efficiency.
Condensing temperatureCondensing temperature, also referred to as the boiling point or saturation temperature is the temperature at which a refrigerant will change state from a liquid to a vapor or vice versa.
Condensing unitCondensing units exhibit refrigerating capacities ranging typically from 1 kW to 20 kW, they are composed of one (or two) compressor(s), one condenser, and one receiver assembled into a so-called ‘condensing unit’.
Cooling loadThe required peak heat removal rate presented to the designer. The heat extraction rate of the system will match or exceed this requirement. (Units: Watt).
Cooling taskDefinition of the function of the refrigeration system. This will include any other associated functions, such as the use of rejected heat for heating, etc.
CO2-eCO2-e means carbon dioxide equivalence.
Indirect emission factor (β)The indirect or CO2 emission factor is the mass of CO2 emitted by the power generator per kWh of electrical power supplied to the refrigeration installation taking in efficiency losses in generation and distribution (Units: kg CO2/kWh).
Direct emissionsGlobal warming effect arising from emissions of refrigerant, or any other ‘greenhouse gas’, from the equipment over its lifetime (Units: kg CO2).
DutySee Cooling load.
Duty factorSee Annual Utility Factor.
Energy consumption per annum (Eannual)Energy consumption of the system per annum (Units: kWh p.a.)
GlossaryAppendix A
15
METHODS OF CALCULATING TOTAL EQUIVALENT WARMING IMPACT (TEWI)BEST PRACTICE GUIDELINES
www.airah.org.au
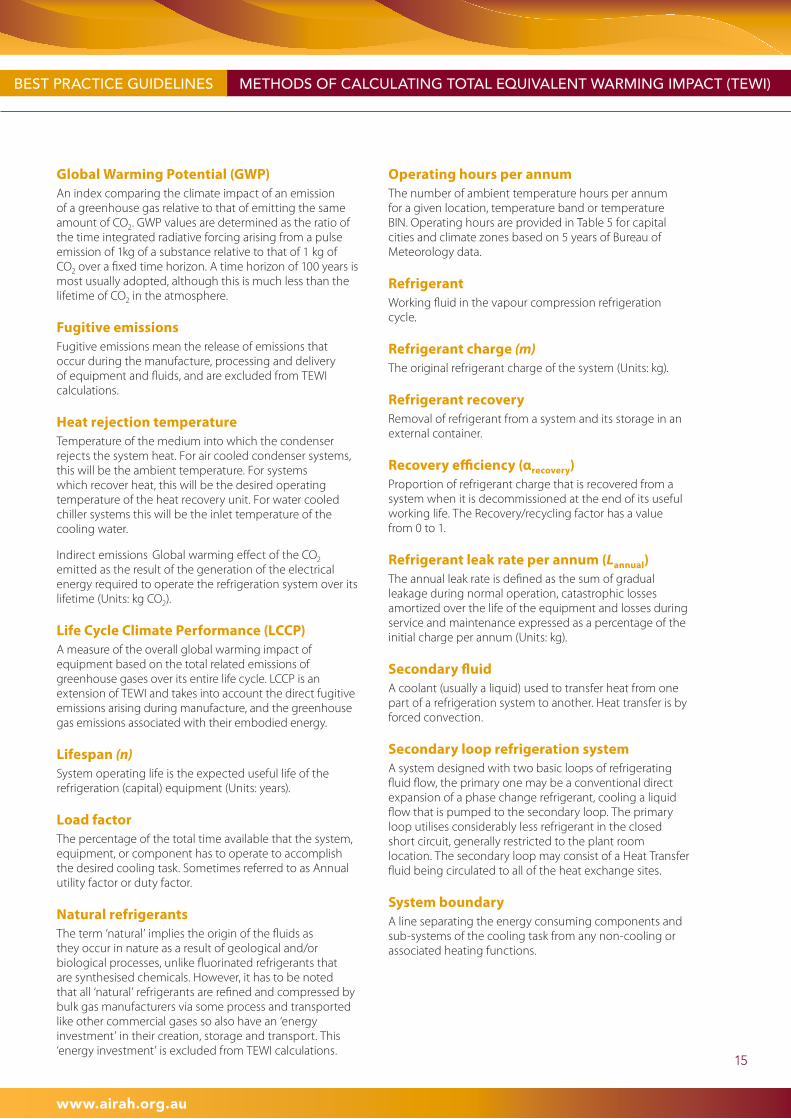
Global Warming Potential (GWP)An index comparing the climate impact of an emission of a greenhouse gas relative to that of emitting the same amount of CO2. GWP values are determined as the ratio of the time integrated radiative forcing arising from a pulse emission of 1kg of a substance relative to that of 1 kg of CO2 over a fixed time horizon. A time horizon of 100 years is most usually adopted, although this is much less than the lifetime of CO2 in the atmosphere.
Fugitive emissions Fugitive emissions mean the release of emissions that occur during the manufacture, processing and delivery of equipment and fluids, and are excluded from TEWI calculations.
Heat rejection temperatureTemperature of the medium into which the condenser rejects the system heat. For air cooled condenser systems, this will be the ambient temperature. For systems which recover heat, this will be the desired operating temperature of the heat recovery unit. For water cooled chiller systems this will be the inlet temperature of the cooling water.
Indirect emissions Global warming effect of the CO2 emitted as the result of the generation of the electrical energy required to operate the refrigeration system over its lifetime (Units: kg CO2).
Life Cycle Climate Performance (LCCP)A measure of the overall global warming impact of equipment based on the total related emissions of greenhouse gases over its entire life cycle. LCCP is an extension of TEWI and takes into account the direct fugitive emissions arising during manufacture, and the greenhouse gas emissions associated with their embodied energy.
Lifespan (n)System operating life is the expected useful life of the refrigeration (capital) equipment (Units: years).
Load factorThe percentage of the total time available that the system, equipment, or component has to operate to accomplish the desired cooling task. Sometimes referred to as Annual utility factor or duty factor.
Natural refrigerantsThe term ‘natural’ implies the origin of the fluids as they occur in nature as a result of geological and/or biological processes, unlike fluorinated refrigerants that are synthesised chemicals. However, it has to be noted that all ‘natural’ refrigerants are refined and compressed by bulk gas manufacturers via some process and transported like other commercial gases so also have an ‘energy investment’ in their creation, storage and transport. This ‘energy investment’ is excluded from TEWI calculations.
Operating hours per annumThe number of ambient temperature hours per annum for a given location, temperature band or temperature BIN. Operating hours are provided in Table 5 for capital cities and climate zones based on 5 years of Bureau of Meteorology data.
RefrigerantWorking fluid in the vapour compression refrigeration cycle.
Refrigerant charge (m)The original refrigerant charge of the system (Units: kg).
Refrigerant recoveryRemoval of refrigerant from a system and its storage in an external container.
Recovery efficiency (αrecovery)Proportion of refrigerant charge that is recovered from a system when it is decommissioned at the end of its useful working life. The Recovery/recycling factor has a value from 0 to 1.
Refrigerant leak rate per annum (Lannual)The annual leak rate is defined as the sum of gradual leakage during normal operation, catastrophic losses amortized over the life of the equipment and losses during service and maintenance expressed as a percentage of the initial charge per annum (Units: kg).
Secondary fluidA coolant (usually a liquid) used to transfer heat from one part of a refrigeration system to another. Heat transfer is by forced convection.
Secondary loop refrigeration systemA system designed with two basic loops of refrigerating fluid flow, the primary one may be a conventional direct expansion of a phase change refrigerant, cooling a liquid flow that is pumped to the secondary loop. The primary loop utilises considerably less refrigerant in the closed short circuit, generally restricted to the plant room location. The secondary loop may consist of a Heat Transfer fluid being circulated to all of the heat exchange sites.
System boundaryA line separating the energy consuming components and sub-systems of the cooling task from any non-cooling or associated heating functions.
16
METHODS OF CALCULATING TOTAL EQUIVALENT WARMING IMPACT (TEWI) BEST PRACTICE GUIDELINES
www.airah.org.au
Sample calculations
Appendix B
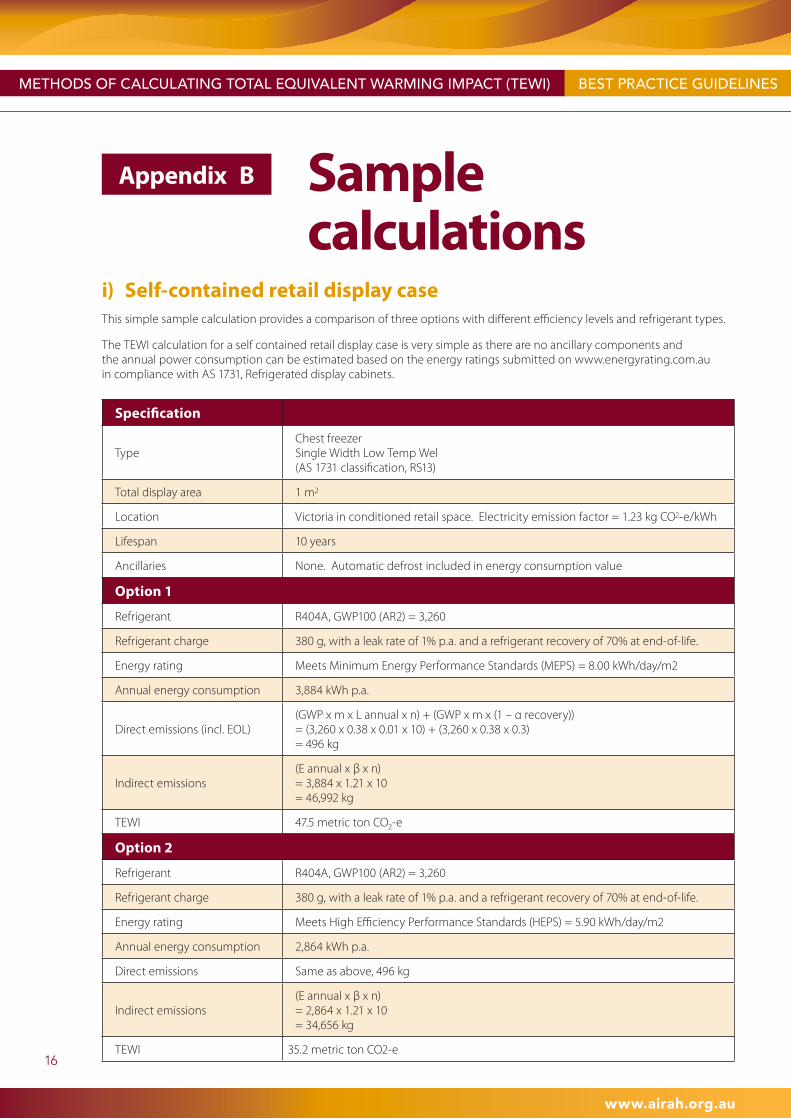
i) Self-contained retail display caseThis simple sample calculation provides a comparison of three options with different efficiency levels and refrigerant types.
The TEWI calculation for a self contained retail display case is very simple as there are no ancillary components and the annual power consumption can be estimated based on the energy ratings submitted on www.energyrating.com.au in compliance with AS 1731, Refrigerated display cabinets.
Specification
TypeChest freezer Single Width Low Temp Wel (AS 1731 classification, RS13)
Total display area 1 m2
Location Victoria in conditioned retail space. Electricity emission factor = 1.23 kg CO2-e/kWh
Lifespan 10 years
Ancillaries None. Automatic defrost included in energy consumption value
Option 1
Refrigerant R404A, GWP100 (AR2) = 3,260
Refrigerant charge 380 g, with a leak rate of 1% p.a. and a refrigerant recovery of 70% at end-of-life.
Energy rating Meets Minimum Energy Performance Standards (MEPS) = 8.00 kWh/day/m2
Annual energy consumption 3,884 kWh p.a.
Direct emissions (incl. EOL)(GWP x m x L annual x n) + (GWP x m x (1 – α recovery)) = (3,260 x 0.38 x 0.01 x 10) + (3,260 x 0.38 x 0.3) = 496 kg
Indirect emissions(E annual x β x n) = 3,884 x 1.21 x 10 = 46,992 kg
TEWI 47.5 metric ton CO2-e
Option 2
Refrigerant R404A, GWP100 (AR2) = 3,260
Refrigerant charge 380 g, with a leak rate of 1% p.a. and a refrigerant recovery of 70% at end-of-life.
Energy rating Meets High Efficiency Performance Standards (HEPS) = 5.90 kWh/day/m2
Annual energy consumption 2,864 kWh p.a.
Direct emissions Same as above, 496 kg
Indirect emissions(E annual x β x n) = 2,864 x 1.21 x 10 = 34,656 kg
TEWI 35.2 metric ton CO2-e
17
METHODS OF CALCULATING TOTAL EQUIVALENT WARMING IMPACT (TEWI)BEST PRACTICE GUIDELINES
www.airah.org.au
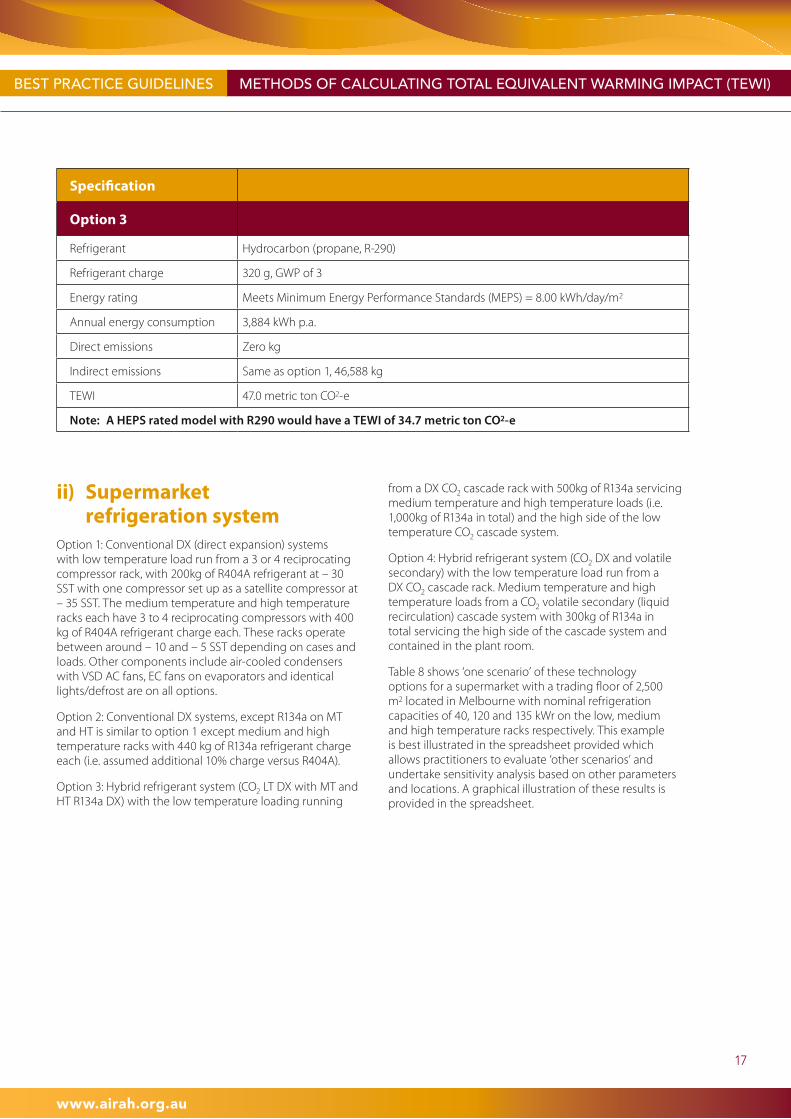
ii) Supermarket refrigeration system
Option 1: Conventional DX (direct expansion) systems with low temperature load run from a 3 or 4 reciprocating compressor rack, with 200kg of R404A refrigerant at – 30 SST with one compressor set up as a satellite compressor at – 35 SST. The medium temperature and high temperature racks each have 3 to 4 reciprocating compressors with 400 kg of R404A refrigerant charge each. These racks operate between around – 10 and – 5 SST depending on cases and loads. Other components include air-cooled condensers with VSD AC fans, EC fans on evaporators and identical lights/defrost are on all options.
Option 2: Conventional DX systems, except R134a on MT and HT is similar to option 1 except medium and high temperature racks with 440 kg of R134a refrigerant charge each (i.e. assumed additional 10% charge versus R404A).
Option 3: Hybrid refrigerant system (CO2 LT DX with MT and HT R134a DX) with the low temperature loading running
from a DX CO2 cascade rack with 500kg of R134a servicing medium temperature and high temperature loads (i.e. 1,000kg of R134a in total) and the high side of the low temperature CO2 cascade system.
Option 4: Hybrid refrigerant system (CO2 DX and volatile secondary) with the low temperature load run from a DX CO2 cascade rack. Medium temperature and high temperature loads from a CO2 volatile secondary (liquid recirculation) cascade system with 300kg of R134a in total servicing the high side of the cascade system and contained in the plant room.
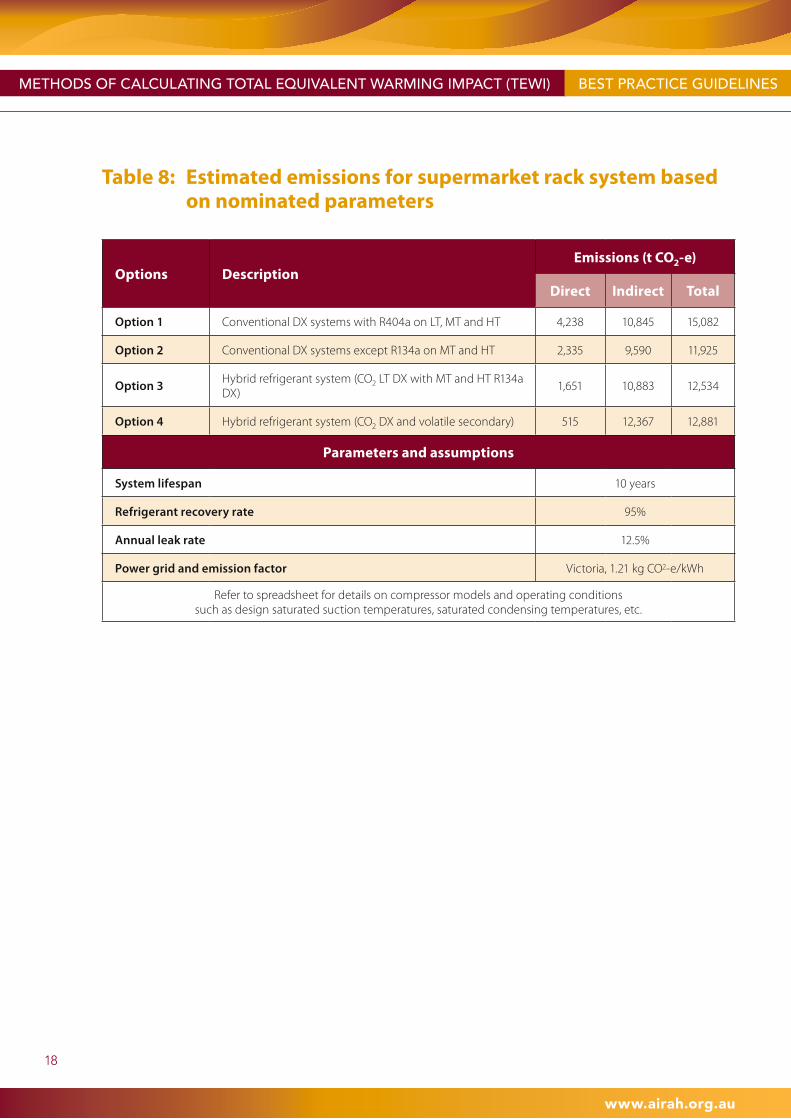
Table 8 shows ‘one scenario’ of these technology options for a supermarket with a trading floor of 2,500 m2 located in Melbourne with nominal refrigeration capacities of 40, 120 and 135 kWr on the low, medium and high temperature racks respectively. This example is best illustrated in the spreadsheet provided which allows practitioners to evaluate ‘other scenarios’ and undertake sensitivity analysis based on other parameters and locations. A graphical illustration of these results is provided in the spreadsheet.
Specification
Option 3
Refrigerant Hydrocarbon (propane, R-290)
Refrigerant charge 320 g, GWP of 3
Energy rating Meets Minimum Energy Performance Standards (MEPS) = 8.00 kWh/day/m2
Annual energy consumption 3,884 kWh p.a.
Direct emissions Zero kg
Indirect emissions Same as option 1, 46,588 kg
TEWI 47.0 metric ton CO2-e
Note: A HEPS rated model with R290 would have a TEWI of 34.7 metric ton CO2-e
18
METHODS OF CALCULATING TOTAL EQUIVALENT WARMING IMPACT (TEWI) BEST PRACTICE GUIDELINES
www.airah.org.au
Table 8: Estimated emissions for supermarket rack system based on nominated parameters
Options DescriptionEmissions (t CO2-e)
Direct Indirect Total
Option 1 Conventional DX systems with R404a on LT, MT and HT 4,238 10,845 15,082
Option 2 Conventional DX systems except R134a on MT and HT 2,335 9,590 11,925
Option 3Hybrid refrigerant system (CO2 LT DX with MT and HT R134a DX)
1,651 10,883 12,534
Option 4 Hybrid refrigerant system (CO2 DX and volatile secondary) 515 12,367 12,881
Parameters and assumptions
System lifespan 10 years
Refrigerant recovery rate 95%
Annual leak rate 12.5%
Power grid and emission factor Victoria, 1.21 kg CO2-e/kWh
Refer to spreadsheet for details on compressor models and operating conditions such as design saturated suction temperatures, saturated condensing temperatures, etc.
19
METHODS OF CALCULATING TOTAL EQUIVALENT WARMING IMPACT (TEWI)BEST PRACTICE GUIDELINES
www.airah.org.au
i) Refrigerant leak rate references
The upper, lower and typical leak rates nominated by this Guideline in Table 1 were based on the following references:
Institute of Refrigeration, UK Refrigeration Roadmap Study, 2010 = 10% (maintained) to 20% for a supermarket operating on R404A.
European Commission DG ENTR, Preparatory Study for Eco-design Requirements, Lot 1, Refrigerating and freezing equipment, Task 4 (October 2010) = 15% for remote condensing units based on a weighted average.
The United Nations Environment Programme (UNEP), the Technology and Economic Assessment Panel (TEAP) co-chairs and members, the Refrigeration, Air Conditioning and Heat Pumps Technical Options Committee, cited leak rates throughout their 2010 report including;
• InmostoftheA5countries,theuseofsystemsemploying condensing units is very extensive. Annual emission rates are estimated between 7 and 12%.
• ResearchperformedbytheU.S.EPAindicatesthatthe reduction in leak rates in the U.S. has been most dramatic in comfort cooling chillers. Leak rates have been lowered from between 10 and 15% per year, to less than 5% per year in many cases, through design changes.
• Somecommercialcompanieshavestudiedandtakenmeasures in order to limit refrigerant leaks; their report show how they reduce emissions from 25% annual emission level to about 12%. So the typical emission rates of small supermarkets vary between 15 and 25% and those of large supermarkets between 20 and 35%.
• Transportrefrigerationrefrigerantleaksinevitablyoccurwithin the refrigeration systems because of vibrations and shocks, and sometimes because of collisions with other objects. In addition, the harsh environmental conditions tend to accelerate the equipment aging.
• Marinerefrigeration,atypicalrefrigerantchargeforvessels above 100 gross tones is between 100 and 500 kg for direct systems, and between 10 to 100 kg for indirect systems. The annual refrigerant leakage rate could be as high as 20 to 40%.
Institute of Refrigeration and British Refrigeration Association, Guideline Methods of Calculating TEWI, 2006 uses 5% leak rate in examples.
Department of Climate Change National Greenhouse and Energy Reporting (NGERS) Technical Guidelines and the NGERS Act 2007 prescribe 9% for commercial air
conditioning, 23% for commercial refrigeration and 16% for industrial refrigeration.
Prior to the introduction of F-gas legislation in the EU there were reports by STEK (translates roughly as the Refrigeration and Emission Prevention Foundation) in the Netherlands claimed leak rates of 4.1% to 4.8% and counter claims in a report “Is STEK as good as reported?” quoted 6.9% to 12.7%.
IPCC good practice guidelines (2003) nominate leak rate ranges; stand-alone commercial refrigeration = 1% to 15%; medium and large commercial refrigeration = 10% to 35%; transport refrigeration = 15% to 50%; process refrigeration and cold storage = 7% to 25%; Chillers = 2% to 15%; residential and commercial air conditioning = 1% to 10%.
ii) Useful references
AIRAH 2003Refrigerant selection guide, Australian Institute of Refrigeration, Air Conditioning and Heating, 2003
Bitzer 2008Refrigerant report, 15th edition, Bitzer Group of Companies, 2008
BRA 2006Guideline Methods of Calculating TEWI, endorsed by the Institute of Refrigeration, British Standards, 2nd Edition, 2006
CARB 2009Inventory of Direct and Indirect GHG Emissions from Stationary Air Conditioning and Refrigeration Sources, with Special Emphasis on Retail Food Refrigeration and Unitary Air Conditioning, State of California Air Resources Board Research Division, Prepared by: Sabine SABA, Rayan Slim, Lionel Palandre, Denis Clodic and the participation of Aline Garnier, Simon Clodic and Martin Lansard, 2009
DCC 2008National greenhouse and energy reporting (measurement) technical guidelines, V 1.0, Department of Climate Change, 2008
DOE 2003Advanced Supermarket Refrigeration/Heat Recovery Systems, prepared by Oak Ridge National Laboratory and participants under Annex 26 for Department of Energy, 2003
ResourcesAppendix C
20
METHODS OF CALCULATING TOTAL EQUIVALENT WARMING IMPACT (TEWI) BEST PRACTICE GUIDELINES
www.airah.org.au
DOE 1996Energy and global warming impacts of HFC refrigerants and emerging technologies, prepared by Oak Ridge National Laboratory, Department of Energy, 1996
Dupont 2009HFO-1234yf Low GWP refrigerant LCCP analysis, Mary Koban, DuPont Fluoroproducts, April 2009
FEA, 2009Comparative Assessment of the Climate Relevance of Supermarket Refrigeration Systems and Equipment, prepared by Ecofys Germany GmbH, Prof. Dr. Michael Kauffeld and Dr. André Leisewitz for the Federal Environment Agency (Germany), 2009
EN 378-1: 2008Refrigerating Systems and Heat Pumps – Safety and environmental requirements, European Standards, 2008
EPA 2008GREEN MAC LCCP, The metric for MAC environmental superiority, Dr Steve Anderson, US Environmental Protection Agency and Stella Papasavva, General Motors Research & Development Center, June 2008
ISO 1440: 2006Environmental management, Life cycle assessment, principles and framework, International Organization for Standardization, 2006
Little, A .D. 2002Global Comparative Analysis of HFC and Alternative Technologies for Refrigeration, Air Conditioning, Foam, Solvent, Aerosol Propellant, and Fire Protection Applications, prepared by Arthur D Little Inc. for The Alliance for Responsible Atmospheric Policy, 2002
Pearson 2004Assessment of life cycle climate performance for chillers, 6th IIR Gustav, Lorentzen Conference, Glasgow, 2004
