47670003 karpe development - noise report
TRANSCRIPT

NORTH AMERICA | EUROPE | AFRICA | AUSTRALIA | ASIA
WWW.FIRSTCARBONSOLUTIONS.COM
Noise Impact Analysis Report Karpe Development Project
City of Bakersfield, Kern County, California
Prepared for: Elmer F. Karpe, Inc.
8501 Camino Media #400 Bakersfield, CA 93311
Contact: Tom Teagarden
Prepared by: FirstCarbon Solutions
7265 N. First Street, Suite 101 Fresno, CA 93720
909.884.2255
Contact: Mary Bean, Project Director Philip Ault, Project Manager, Noise Scientist
Date: November 4, 2019

THIS PAGE INTENTIONALLY LEFT BLANK

Elmer F. Karpe, Inc.—Karpe Development Project Noise Impact Analysis Report Table of Contents
FirstCarbon Solutions iii Y:\Publications\Client (PN-JN)\4767\47670003\Noise Report\47670003 Karpe Development - Noise Report.docx
Table of Contents
Acronyms and Abbreviations ......................................................................................................... v
Section 1: Introduction .................................................................................................................. 1 1.1 - Purpose of Analysis and Study Objectives......................................................................... 1 1.2 - Project Summary ............................................................................................................... 1
Section 2: Noise and Vibration Fundamentals ................................................................................ 9 2.1 - Characteristics of Noise ..................................................................................................... 9 2.2 - Characteristics of Groundborne Vibration and Noise ..................................................... 13
Section 3: Regulatory Setting ....................................................................................................... 17 3.1 - Federal Regulations ......................................................................................................... 17 3.2 - State Regulations ............................................................................................................. 18 3.3 - Local Regulations ............................................................................................................. 19
Section 4: Existing Noise Conditions ............................................................................................. 21 4.1 - Existing Ambient Noise Levels ......................................................................................... 21 4.2 - Existing Traffic Noise Levels ............................................................................................. 21
Section 5: Thresholds of Significance and Impact Analysis ............................................................ 23 5.1 - Thresholds of Significance ............................................................................................... 23 5.2 - Noise levels that would conflict with any land use plan, policy, or regulation ............... 23 5.3 - Substantial Noise Increase in Excess of Standards .......................................................... 25 5.4 - Groundborne Vibration/Noise Levels .............................................................................. 30 5.5 - Excessive Noise Levels from Airport Activity ................................................................... 31
Appendix A: Noise Monitoring and Modeling Data
List of Tables
Table 1: Sound Terminology ................................................................................................................. 11
Table 2: Typical Construction Equipment Maximum Noise Levels, Lmax ............................................... 12
Table 3: Vibration Levels of Construction Equipment .......................................................................... 14
Table 4: Summary of EPA Recommended Noise Levels to Protect Public Welfare ............................... 17
Table 5: Federal Transit Administration Construction Vibration Impact Criteria.................................. 18
Table 6: Land Use Compatibility Standards for Community Noise Environments ................................ 19
Table 7: Existing Traffic Noise Levels ..................................................................................................... 21
Table 8: Traffic Noise Model Results Summary .................................................................................... 24
Table 9: Traffic Noise Increase Summary .............................................................................................. 27

Elmer F. Karpe, Inc.—Karpe Development Project Table of Contents Noise Impact Analysis Report
iv FirstCarbon Solutions
Y:\Publications\Client (PN-JN)\4767\47670003\Noise Report\47670003 Karpe Development - Noise Report.docx
List of Exhibits
Exhibit 1: Regional Location Map ............................................................................................................ 3
Exhibit 2: Local Vicinity Map, Aerial Base ............................................................................................... 5
Exhibit 3: Site Plan ................................................................................................................................... 7

Elmer F. Karpe, Inc.—Karpe Development Project Noise Impact Analysis Report Acronyms and Abbreviations
FirstCarbon Solutions v Y:\Publications\Client (PN-JN)\4767\47670003\Noise Report\47670003 Karpe Development - Noise Report.docx
ACRONYMS AND ABBREVIATIONS
ADA Americans with Disabilities Act ADT average daily traffic ANSI American National Standards Institute Caltrans California Department of Transportation CEQA California Environmental Quality Act CNEL Community Noise Equivalent Level dB decibel dBA A-weighted decibel FCS FirstCarbon Solutions FHWA Federal Highway Administration FTA Federal Transit Administration GPA General Plan Amendment in/sec inch per second Ldn day-night average sound level Leq equivalent continuous sound level Lmax maximum noise/sound level OSHA Occupational Safety and Health Administration PPV peak particle velocity rms root mean square SEL Single Event Level VdB vibration in decibels

THIS PAGE INTENTIONALLY LEFT BLANK

Elmer F. Karpe, Inc.—Karpe Development Project Noise Impact Analysis Report Introduction
FirstCarbon Solutions 1 Y:\Publications\Client (PN-JN)\4767\47670003\Noise Report\47670003 Karpe Development - Noise Report.docx
SECTION 1: INTRODUCTION
1.1 - Purpose of Analysis and Study Objectives This Noise Impact Analysis Report has been prepared by FirstCarbon Solutions (FCS) to determine the off-site and on-site noise impacts associated with the proposed Karpe Development Project (project). The following is provided in this report:
• A description of the study area, project site, and proposed project
• Information regarding the fundamentals of noise and vibration
• A description of the local noise guidelines and standards
• A description of the existing noise environment
• An analysis of the potential short-term, construction-related noise and vibration impacts from the proposed project
• An analysis of long-term, operations-related noise and vibration impacts from the proposed project
1.2 - Project Summary
1.2.1 - Site Location The proposed project is located in the City of Bakersfield, in Kern County, California (Exhibit 1). The 20.55-acre site is located in the northeast quadrant of State Route (SR)-119 (Taft Highway) and H Street. The project site is located on two vacant parcels. Surrounding the project site is vacant land to the north and east, a mobile home park to the southeast, mobile home sales and RV storage to the south, and a commercial land use to the west. Regional access to the project site is provided via SR-99 through the Taft Highway interchange, located to the south of the project site. Local access to the project site is provided via Taft Highway and H Street (Exhibit 2).
1.2.2 - Project Description The Applicant proposes to construct an 11,166-square-foot convenience store space, 3,485-square-foot fast food space with drive thru, and a 3-bay 10,992-square-foot maintenance building on the project site. The project would include a total of 177 parking stalls, with 78 auto parking stalls, 94 truck parking stalls, and 5 RV parking stalls. The project would also include fueling islands (16 auto fueling positions and 8 truck fueling positions), above and below ground diesel storage tanks, dog park areas, and bioretention areas. Associated landscaping would total 121,151 square feet.1 The tentative site plan is shown in Exhibit 3.
1 Lane Engineers, Inc. 2019. Karpe Development Site Plan Map.

Elmer F. Karpe, Inc.—Karpe Development Project Introduction Noise Impact Analysis
2 FirstCarbon Solutions
Y:\Publications\Client (PN-JN)\4767\47670003\Noise Report\47670003 Karpe Development - Noise Report.docx
The primary activities that will be performed on site will be travelers (auto and truck) stopping to fuel, rest, and/or eat. The proposed project will be open and operational 24-hours, 7-days per week. The on-site maintenance building will provide light service to over the road trucks, including repairing and replacing truck tires, and performing light maintenance (e.g., air filters, wiper blades, oil, and other fluid changes); no major engine repairs or major services will be performed on the site. It is anticipated that there will be approximately 450 truck visits and approximately 900 auto visits to the site per day. It is also anticipated that there will be approximately 1–3 small deliveries per day for the convenience store, and approximately 2 deliveries per week for the restaurants.

65
99
58
99
5
119
223
184
Fort TejonState
Hist Park
Oildale
Lamont
ArvinConner
Kern Lake
Lakeview
BakersfieldKern City
Edison
Wible OrchardVenolaGosford
Millux
Mettler
Meridian
Wheeler Ridge
San Emidio
BuenaVista
Lake Bed
SequoiaNationalForest
Exhibit 1Regiona l Loca tion Ma p
5 0 52.5Miles
Text
Project Site
58
Source: Census 2000 Da ta , The Ca SIL
KARPE DEVELOPMENT PROJECTNOISE IMPACT ANALYSIS
47670003 • 11/2019 | 1_regiona l.mxd
Project Site
178
166

THIS PAGE INTENTIONALLY LEFT BLANK

47670003 • 11/2019 | 2_lo cal_aerial.m xd
Exhibit2Lo cal V icinity Map
Aerial Base
So urce: ESRI Aerial Im agery.
KARPE DEV ELOPMENT PROJECTNOISE IMPACT ANALYSIS
99
Taft Hwy
H St
Curnow Rd
Mckee Rd
Hudson Dr
Mckee Rd
Curnow Rd
Astor Ave
Hug
hes L
n
Shan
non D
r C
heva
lier R
d Southland Ct
Charterten Ave
Cam
pagn
oni S
t
Kern
Islan
d Can
al
1,000 0 1,000500Feet
LegendProject Site

THIS PAGE INTENTIONALLY LEFT BLANK

47670003 • 11/2019 | 3_site_plan.cdr
Exhibit 3Site Plan
KARPE DEVELOPMENT PROJECTNOISE IMPACT ANALYSIS
Source: Lane Engineers Inc.

THIS PAGE INTENTIONALLY LEFT BLANK

Elmer F. Karpe, Inc.—Karpe Development Project Noise Impact Analysis Report Noise and Vibration Fundamentals
FirstCarbon Solutions 9 Y:\Publications\Client (PN-JN)\4767\47670003\Noise Report\47670003 Karpe Development - Noise Report.docx
SECTION 2: NOISE AND VIBRATION FUNDAMENTALS
2.1 - Characteristics of Noise Noise is generally defined as unwanted or objectionable sound. Sound becomes unwanted when it interferes with normal activities, when it causes actual physical harm, or when it has adverse effects on health. The effects of noise on people can include general annoyance, interference with speech communication, sleep disturbance, and in the extreme, hearing impairment. Noise effects can be caused by pitch or loudness. Pitch is the number of complete vibrations or cycles per second of a wave that result in the range of tone from high to low; higher-pitched sounds are louder to humans than lower-pitched sounds. Loudness is the intensity or amplitude of sound.
Sound is produced by the vibration of sound pressure waves in the air. Sound pressure levels are used to measure the intensity of sound and are described in terms of decibels. The decibel (dB) is a logarithmic unit, which expresses the ratio of the sound pressure level being measured to a standard reference level. The 0 point on the dB scale is based on the lowest sound level that the healthy, unimpaired human ear can detect. Changes of 3 dB or less are only perceptible in laboratory environments. Audible increases in noise levels generally refer to a change of 3 dB or more, as this level has been found to be barely perceptible to the human ear in outdoor environments. Only audible changes in existing ambient or background noise levels are considered potentially significant.
The human ear is not equally sensitive to all frequencies within the audible sound spectrum, so sound pressure level measurements can be weighted to better represent frequency-based sensitivity of average healthy human hearing. One such specific “filtering” of sound is called “A-weighting.” A-weighted decibels (dBA) approximate the subjective response of the human ear to a broad frequency noise source by discriminating against very low and very high frequencies of the audible spectrum. They are adjusted to reflect only those frequencies that are audible to the human ear. Because decibels are logarithmic units, they cannot be added or subtracted by ordinary arithmetic means. For example, if one noise source produces a noise level of 70 dB, the addition of another noise source with the same noise level would not produce 140 dB; rather, they would combine to produce a noise level of 73 dB.
As noise spreads from a source, it loses energy so that the farther away the noise receiver is from the noise source, the lower the perceived noise level. Noise levels diminish or attenuate as distance from the source increases based on an inverse square rule, depending on how the noise source is physically configured. Noise levels from a single-point source, such as a single piece of construction equipment at ground level, attenuate at a rate of 6 dB for each doubling of distance (between the single-point source of noise and the noise-sensitive receptor of concern). Heavily traveled roads with few gaps in traffic behave as continuous line sources and attenuate roughly at a rate of 3 dB per doubling of distance.

Elmer F. Karpe, Inc.—Karpe Development Project Noise and Vibration Fundamentals Noise Impact Analysis Report
10 FirstCarbon Solutions
Y:\Publications\Client (PN-JN)\4767\47670003\Noise Report\47670003 Karpe Development - Noise Report.docx
2.1.1 - Noise Descriptors There are many ways to rate noise for various time periods, but an appropriate rating of ambient noise affecting humans also accounts for the annoying effects of sound. Equivalent continuous sound level (Leq) is the total sound energy of time-varying noise over a sample period. However, the predominant rating scales for human communities in the State of California are the Leq and community noise equivalent level (CNEL) or the day-night average level (Ldn) based on dBA. CNEL is the time-varying noise over a 24-hour period, with a 5 dBA weighting factor applied to the hourly Leq for noises occurring from 7:00 p.m. to 10:00 p.m. (defined as relaxation hours) and a 10 dBA weighting factor applied to noise occurring from 10:00 p.m. to 7:00 a.m. (defined as sleeping hours). Ldn is similar to the CNEL scale but without the adjustment for events occurring during the evening hours. CNEL and Ldn are within 1 dBA of each other and are normally exchangeable. The noise adjustments are added to the noise events occurring during the more sensitive hours.
Other noise rating scales of importance when assessing the annoyance factor include the maximum noise level (Lmax), which is the highest exponential time-averaged sound level that occurs during a stated time period. The noise environments discussed in this analysis are specified in terms of maximum levels denoted by Lmax for short-term noise impacts. Lmax reflects peak operating conditions and addresses the annoying aspects of intermittent noise.
2.1.2 - Noise Propagation From the noise source to the receiver, noise changes both in level and frequency spectrum. The most obvious is the decrease in noise as the distance from the source increases. The manner in which noise reduces with distance depends on whether the source is a point or line source, as well as ground absorption, atmospheric conditions (wind, temperature gradients, and humidity) and refraction, and shielding by natural and manmade features. Sound from point sources, such as an air conditioning condenser, a piece of construction equipment, or an idling truck, radiates uniformly outward as it travels away from the source in a spherical pattern.
The attenuation or sound drop-off rate is dependent on the conditions of the land between the noise source and receiver. To account for this ground-effect attenuation (absorption), two types of site conditions are commonly used in noise models: soft-site and hard-site conditions. Soft-site conditions account for the sound propagation loss over natural surfaces such as normal earth and ground vegetation. For point sources, a drop-off rate of 7.5 dBA per each doubling of the distance (dBA/DD) is typically observed over soft ground with landscaping, as compared with a 6 dBA/DD drop-off rate over hard ground such as asphalt, concrete, stone and very hard packed earth. For line sources, such as traffic noise on a roadway, a 4.5 dBA/DD is typically observed for soft-site conditions compared to the 3 dBA/DD drop-off rate for hard-site conditions. Table 1 briefly defines these measurement descriptors and other sound terminology used in this section.

Elmer F. Karpe, Inc.—Karpe Development Project Noise Impact Analysis Report Noise and Vibration Fundamentals
FirstCarbon Solutions 11 Y:\Publications\Client (PN-JN)\4767\47670003\Noise Report\47670003 Karpe Development - Noise Report.docx
Table 1: Sound Terminology
Term Definition
Sound A vibratory disturbance created by a vibrating object which, when transmitted by pressure waves through a medium such as air, can be detected by a receiving mechanism such as the human ear or a microphone.
Noise Sound that is loud, unpleasant, unexpected, or otherwise undesirable.
Ambient Noise The composite of noise from all sources near and far in a given environment.
Decibel (dB) A unitless measure of sound on a logarithmic scale, which represents the squared ratio of sound-pressure amplitude to a reference sound pressure. The reference pressure is 20 micropascals, representing the threshold of human hearing (0 dB).
A-Weighted Decibel (dBA) An overall frequency-weighted sound level that approximates the frequency response of the human ear.
Equivalent Noise Level (Leq) The average sound energy occurring over a specified time period. In effect, Leq is the steady-state sound level that in a stated period would contain the same acoustical energy as the time-varying sound that actually occurs during the same period.
Maximum and Minimum Noise Levels (Lmax and Lmin) The maximum or minimum instantaneous sound level measured during a measurement period.
Day-Night Level (DNL or Ldn) The energy average of the A-weighted sound levels occurring during a 24-hour period, with 10 dB added to the A-weighted sound levels occurring between 10:00 p.m. and 7:00 a.m. (nighttime).
Community Noise Equivalent Level (CNEL) The energy average of the A-weighted sound levels occurring during a 24-hour period, with 5 dB added to the A-weighted sound levels occurring between 7:00 p.m. and 10:00 p.m. and 10 dB added to the A-weighted sound levels occurring between 10:00 p.m. and 7:00 a.m.
Source: Data compiled by FCS 2018
2.1.3 - Traffic Noise The level of traffic noise depends on the three primary factors: (1) the volume of the traffic, (2) the speed of the traffic, and (3) the number of trucks in the flow of traffic. Generally, the loudness of traffic noise is increased by heavier traffic volumes, higher speeds, and greater number of trucks. Vehicle noise is a combination of the noise produced by the engine, exhaust, and tires. Because of the logarithmic nature of noise levels, a doubling of the traffic volume (assuming that the speed and truck mix do not change) results in a noise level increase of 3 dBA. Based on the Federal Highway

Elmer F. Karpe, Inc.—Karpe Development Project Noise and Vibration Fundamentals Noise Impact Analysis Report
12 FirstCarbon Solutions
Y:\Publications\Client (PN-JN)\4767\47670003\Noise Report\47670003 Karpe Development - Noise Report.docx
Administration (FHWA) community noise assessment criteria, this change is “barely perceptible.” For reference, a doubling of perceived noise levels would require an increase of approximately 10 dBA. The truck mix on a given roadway also has an effect on community noise levels. As the number of heavy trucks increases and becomes a larger percentage of the vehicle mix, adjacent noise levels increase.
2.1.4 - Stationary Noise A stationary noise producer is any entity in a fixed location that emits noise. Examples of stationary noise sources include machinery, engines, energy production, and other mechanical or powered equipment and activities such as loading and unloading or public assembly that may occur at commercial, industrial, manufacturing, or institutional facilities. Furthermore, while noise generated by the use of motor vehicles over public roads is preempted from local regulation, the use of these vehicles is considered a stationary noise source when operated on private property such as at a construction site, a truck terminal, or warehousing facility.
The effects of stationary noise depend on factors such as characteristics of the equipment and operations, distance and pathway between the generator and receptor, and weather. Stationary noise sources may be regulated at the point of manufacture (e.g., equipment or engines), with limitations on the hours of operation, or with provision of intervening structures, barriers or topography.
Construction activities are a common source of stationary noise. Construction-period noise levels are higher than background ambient noise levels but eventually cease once construction is complete. Construction is performed in discrete steps, each of which has its own mix of equipment and, consequently, its own noise characteristics. These various sequential phases would change the character of the noise generated on each construction site and, therefore, would change the noise levels as construction progresses. Despite the variety in the type and size of construction equipment, similarities in the dominant noise sources and patterns of operation allow construction related noise ranges to be categorized by work phase. Table 2 shows typical noise levels of construction equipment as measured at a distance of 50 feet from the operating equipment.
Table 2: Typical Construction Equipment Maximum Noise Levels, Lmax
Type of Equipment Impact Device? (Yes/No) Specification Maximum Sound Levels
for Analysis (dBA at 50 feet)
Impact Pile Driver Yes 95
Auger Drill Rig No 85
Vibratory Pile Driver No 95
Jackhammers Yes 85
Pneumatic Tools No 85
Pumps No 77
Scrapers No 85
Cranes No 85
Portable Generators No 82

Elmer F. Karpe, Inc.—Karpe Development Project Noise Impact Analysis Report Noise and Vibration Fundamentals
FirstCarbon Solutions 13 Y:\Publications\Client (PN-JN)\4767\47670003\Noise Report\47670003 Karpe Development - Noise Report.docx
Table 2 (cont.): Typical Construction Equipment Maximum Noise Levels, Lmax
Type of Equipment Impact Device? (Yes/No) Specification Maximum Sound Levels
for Analysis (dBA at 50 feet)
Rollers No 85
Dozers No 85
Tractors No 84
Front-End Loaders No 80
Backhoe No 80
Excavators No 85
Graders No 85
Air Compressors No 80
Dump Truck No 84
Concrete Mixer Truck No 85
Pickup Truck No 55
Source: Federal Highway Administration (FHWA). 2006. Highway Construction Noise Handbook. August.
2.1.5 - Noise from Multiple Sources Because sound pressure levels in decibels are based on a logarithmic scale, they cannot be added or subtracted in the usual arithmetical way. Therefore, sound pressure levels in decibels are logarithmically added on an energy summation basis. In other words, adding a new noise source to an existing noise source, both producing noise at the same level, will not double the noise level. Instead, if the difference between two noise sources is 10 dBA or more, the louder noise source will dominate and the resultant noise level will be equal to the noise level of the louder source. In general, if the difference between two noise sources is 0–1 dBA, the resultant noise level will be 3 dBA higher than the louder noise source, or both sources if they are equal. If the difference between two noise sources is 2–3 dBA, the resultant noise level will be 2 dBA above the louder noise source. If the difference between two noise sources is 4–10 dBA, the resultant noise level will be 1 dBA higher than the louder noise source.
2.2 - Characteristics of Groundborne Vibration and Noise Groundborne vibration consists of rapidly fluctuating motion through a solid medium, specifically the ground, that has an average motion of zero and in which the motion’s amplitude can be described in terms of displacement, velocity, or acceleration. The effects of groundborne vibration typically only causes a nuisance to people, but in extreme cases, excessive groundborne vibration has the potential to cause structural damage to buildings. Although groundborne vibration can be felt outdoors, it is typically only an annoyance to people indoors where the associated effects of the shaking of a building can be notable. Groundborne noise is an effect of groundborne vibration and

Elmer F. Karpe, Inc.—Karpe Development Project Noise and Vibration Fundamentals Noise Impact Analysis Report
14 FirstCarbon Solutions
Y:\Publications\Client (PN-JN)\4767\47670003\Noise Report\47670003 Karpe Development - Noise Report.docx
only exists indoors, since it is produced from noise radiated from the motion of the walls and floors of a room, and may also consist of the rattling of windows or dishes on shelves.
Several different methods are used to quantify vibration amplitude such as the maximum instantaneous peak in the vibrations velocity, which is known as the peak particle velocity (PPV) or the root mean square (rms) amplitude of the vibration velocity. Because of the typically small amplitudes of vibrations, vibration velocity is often expressed in decibels—denoted as LV—and is based on the reference quantity of 1 micro inch per second. To distinguish these vibration levels referenced in decibels from noise levels referenced in decibels, the unit is written as “VdB.”
Although groundborne vibration can be felt outdoors, it is typically only an annoyance to people indoors where the associated effects of the shaking of a building can be notable. When assessing annoyance from groundborne vibration, vibration is typically expressed as rms velocity in units of decibels of 1 micro-inch per second, with the unit written in VdB. Typically, developed areas are continuously affected by vibration velocities of 50 VdB or lower. Human perception to vibration starts at levels as low as 67 VdB. Annoyance due to vibration in residential settings starts at approximately 70 VdB.
Off-site sources that may produce perceptible vibrations are usually caused by construction equipment, steel-wheeled trains, and traffic on rough roads, while smooth roads rarely produce perceptible groundborne noise or vibration. Construction activities, such as blasting, pile driving and operating heavy earthmoving equipment, are common sources of groundborne vibration. Construction vibration impacts on building structures are generally assessed in terms of PPV. Typical vibration source levels from construction equipment are shown in Table 3.
Table 3: Vibration Levels of Construction Equipment
Construction Equipment PPV at 25 Feet (inches/second) rms Velocity in Decibels (VdB)
at 25 Feet
Water Trucks 0.001 57
Scraper 0.002 58
Bulldozer—small 0.003 58
Jackhammer 0.035 79
Concrete Mixer 0.046 81
Concrete Pump 0.046 81
Paver 0.046 81
Pickup Truck 0.046 81
Auger Drill Rig 0.051 82
Backhoe 0.051 82
Crane (Mobile) 0.051 82
Excavator 0.051 82
Grader 0.051 82

Elmer F. Karpe, Inc.—Karpe Development Project Noise Impact Analysis Report Noise and Vibration Fundamentals
FirstCarbon Solutions 15 Y:\Publications\Client (PN-JN)\4767\47670003\Noise Report\47670003 Karpe Development - Noise Report.docx
Table 3 (cont.): Vibration Levels of Construction Equipment
Construction Equipment PPV at 25 Feet (inches/second) rms Velocity in Decibels (VdB)
at 25 Feet
Loader 0.051 82
Loaded Trucks 0.076 86
Bulldozer—Large 0.089 87
Caisson drilling 0.089 87
Vibratory Roller (small) 0.101 88
Compactor 0.138 90
Clam shovel drop 0.202 94
Vibratory Roller (large) 0.210 94
Pile Driver (impact-typical) 0.644 104
Pile Driver (impact-upper range) 1.518 112
Source: Compilation of scientific and academic literature, generated by the Federal Transit Administration (FTA) and FHWA.
The propagation of groundborne vibration is not as simple to model as airborne noise. This is because noise in the air travels through a relatively uniform medium, while groundborne vibrations travel through the earth, which may contain significant geological differences. Factors that influence groundborne vibration include:
• Vibration source: Type of activity or equipment, such as impact or mobile, and depth of vibration source;
• Vibration path: Soil type, rock layers, soil layering, depth to water table, and frost depth; and
• Vibration receiver: Foundation type, building construction, and acoustical absorption. Among these factors that influence groundborne vibration, there are significant differences in the vibration characteristics when the source is underground compared to at the ground surface. In addition, soil conditions are known to have a strong influence on the levels of groundborne vibration. Among the most important factors are the stiffness and internal damping of the soil and the depth to bedrock. Vibration propagation is more efficient in stiff clay soils than in loose sandy soils, and shallow rock seems to concentrate the vibration energy close to the surface, and can result in groundborne vibration problems at large distance from the source. Factors such as layering of the soil and depth to the water table can have significant effects on the propagation of groundborne vibration. Soft, loose, sandy soils tend to attenuate more vibration energy than hard, rocky materials. Vibration propagation through groundwater is more efficient than through sandy soils. There are three main types of vibration propagation: surface, compression, and shear waves. Surface waves, or Rayleigh waves, travel along the ground’s surface. These waves carry most of their energy along an expanding circular wave front, similar to ripples produced by throwing a rock into a pool of water. P-

Elmer F. Karpe, Inc.—Karpe Development Project Noise and Vibration Fundamentals Noise Impact Analysis Report
16 FirstCarbon Solutions
Y:\Publications\Client (PN-JN)\4767\47670003\Noise Report\47670003 Karpe Development - Noise Report.docx
waves, or compression waves, are body waves that carry their energy along an expanding spherical wave front. The particle motion in these waves is longitudinal (i.e., in a “push-pull” fashion). P-waves are analogous to airborne sound waves. S-waves, or shear waves, are also body waves that carry energy along an expanding spherical wave front. However, unlike P-waves, the particle motion is transverse, or side-to-side and perpendicular to the direction of propagation.
As vibration waves propagate from a source, the vibration energy decreases in a logarithmic nature and the vibration levels typically decrease by 6 VdB per doubling of the distance from the vibration source. As stated above, this drop-off rate can vary greatly depending on the soil type, but it has been shown to be effective enough for screening purposes, in order to identify potential vibration impacts that may need to be studied through actual field tests. The vibration level (calculated below as PPV) at a distance from a point source can generally be calculated using the vibration reference equation:
PPV = PPVref * (25/D)^n (in/sec)
Where:
PPVref = reference measurement at 25 feet from vibration source D = distance from equipment to property line n = vibration attenuation rate through ground
According to Section 7 of the Federal Transit Administration (FTA) Transit Noise and Vibration Impact Assessment Manual, an “n” value of 1.5 is recommended to calculate vibration propagation through typical soil conditions.2
2 Federal Transit Administration (FTA). 2018. Transit Noise and Vibration Impact Assessment Manual. September.

Elmer F. Karpe, Inc.—Karpe Development Project Noise Impact Analysis Report Regulatory Setting
FirstCarbon Solutions 17 Y:\Publications\Client (PN-JN)\4767\47670003\Noise Report\47670003 Karpe Development - Noise Report.docx
SECTION 3: REGULATORY SETTING
3.1 - Federal Regulations
3.1.1 - United States Environmental Protection AgencyIn 1972, Congress enacted the Noise Control Act. This act authorized the United States Environmental Protection Agency (EPA) to publish descriptive data on the effects of noise and establish levels of sound “requisite to protect the public welfare with an adequate margin of safety.” These levels are separated into health (hearing loss levels) and welfare (annoyance levels) categories, as shown in Table 4. The EPA cautions that these identified levels are not standards because they do not take into account the cost or feasibility of the levels.
For protection against hearing loss, 96 percent of the population would be protected if sound levels are less than or equal to an Leq(24) of 70 dBA. The EPA activity and interference guidelines are designed to ensure reliable speech communication at about 5 feet in the outdoor environment. For outdoor and indoor environments, interference with activity and annoyance should not occur if levels are below 55 dBA and 45 dBA, respectively.
Table 4: Summary of EPA Recommended Noise Levels to Protect Public Welfare
Effect Level Area
Hearing loss Leq(24) < 70 dB All areas
Outdoor activity interference and annoyance
Ldn < 55 dB Outdoors in residential areas, farms, and other outdoor areas where people spend widely varying amounts of time and other places in which quiet is a basis for use.
Leq(24) < 55 dB Outdoor areas where people spend limited amounts of time, such as school yards, playgrounds, etc.
Indoor activity interference and annoyance
Leq < 45 dB Indoor residential areas.
Leq(24) < 45 dB Other indoor areas with human activities such as schools, etc.
Note: (24) signifies an Leq duration of 24 hours. Source: United States Environmental Protection Agency. 1978. Protective Noise Levels, EPA 550/9-79-100. November.
3.1.2 - Federal Transit Administration The FTA has established industry accepted standards for vibration impact criteria and impact assessment. These guidelines are published in its Transit Noise and Vibration Impact Assessment

Elmer F. Karpe, Inc.—Karpe Development Project Regulatory Setting Noise Impact Analysis Report
18 FirstCarbon Solutions Y:\Publications\Client (PN-JN)\4767\47670003\Noise Report\47670003 Karpe Development - Noise Report.docx
Manual.3 The FTA guidelines include thresholds for construction vibration impacts for various structural categories as shown in Table 5.
Table 5: Federal Transit Administration Construction Vibration Impact Criteria
Building Category PPV (in/sec) Approximate VdB
I. Reinforced—Concrete, Steel or Timber (no plaster) 0.5 102
II. Engineered Concrete and Masonry (no plaster) 0.3 98
III. Non Engineer Timber and Masonry Buildings 0.2 94
IV. Buildings Extremely Susceptible to Vibration Damage 0.12 90
Note: VdB = vibration measured as rms velocity in decibels of 1 micro-inch per second Source: Federal Transit Administration (FTA). 2018. Transit Noise and Vibration Impact Assessment Manual. September.
3.2 - State Regulations The State of California has established regulations that help prevent adverse impacts to occupants of buildings located near noise sources. Referred to as the “State Noise Insulation Standard,” it requires buildings to meet performance standards through design and/or building materials that would offset any noise source in the vicinity of the receptor. State regulations include requirements for the construction of new hotels, motels, apartment houses, and dwellings other than detached single-family dwellings that are intended to limit the extent of noise transmitted into habitable spaces. These requirements are found in the California Code of Regulations, Title 24 (known as the Building Standards Administrative Code), Part 2 (known as the California Building Code), Appendix Chapters 12 and 12A. For limiting noise transmitted between adjacent dwelling units, the noise insulation standards specify the extent to which walls, doors, and floor-ceiling assemblies must block or absorb sound. For limiting noise from exterior noise sources, the noise insulation standards set an interior standard of 45 dBA CNEL in any habitable room with all doors and windows closed. In addition, the standards require preparation of an acoustical analysis demonstrating the manner in which dwelling units have been designed to meet this interior standard, where such units are proposed in an area with exterior noise levels greater than 60 dBA CNEL.
The proposed project does not include any type of residential development. Therefore, these standards are not applicable to the proposed project. However, the State has established land use compatibility guidelines for determining acceptable noise levels for specified land uses, including industrial type land uses such as the proposed project, which the City of Bakersfield has adopted as described below.
3 Federal Transit Administration (FTA). 2018. Transit Noise and Vibration Impact Assessment Manual. September.
Elmer F. Karpe, Inc.—Karpe Development Project Noise Impact Analysis Report Regulatory Setting
FirstCarbon Solutions 19 Y:\Publications\Client (PN-JN)\4767\47670003\Noise Report\47670003 Karpe Development - Noise Report.docx
3.3 - Local Regulations The project site is located within the City of Bakersfield, in Kern County, California. The City of Bakersfield addresses noise in the Noise Element of the Metropolitan Bakersfield General Plan4 and in the Bakersfield Municipal Code.5
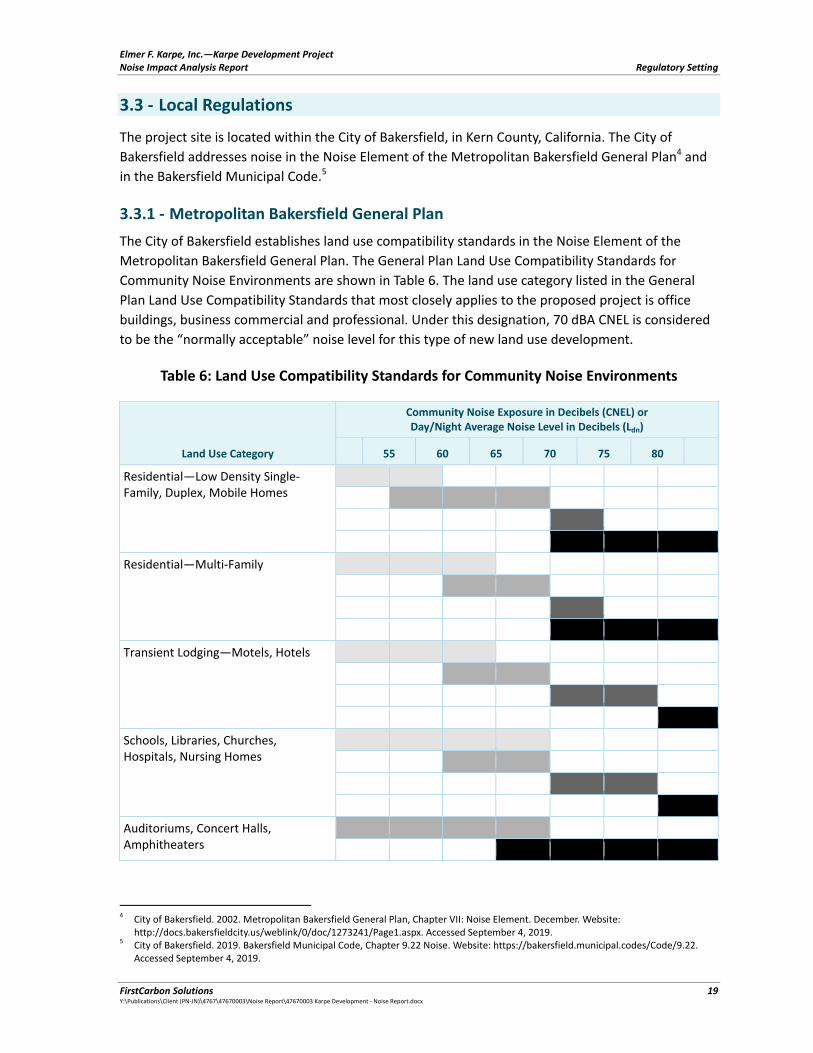
3.3.1 - Metropolitan Bakersfield General Plan The City of Bakersfield establishes land use compatibility standards in the Noise Element of the Metropolitan Bakersfield General Plan. The General Plan Land Use Compatibility Standards for Community Noise Environments are shown in Table 6. The land use category listed in the General Plan Land Use Compatibility Standards that most closely applies to the proposed project is office buildings, business commercial and professional. Under this designation, 70 dBA CNEL is considered to be the “normally acceptable” noise level for this type of new land use development.
Table 6: Land Use Compatibility Standards for Community Noise Environments
Land Use Category
Community Noise Exposure in Decibels (CNEL) or Day/Night Average Noise Level in Decibels (Ldn)
55 60 65 70 75 80
Residential—Low Density Single-Family, Duplex, Mobile Homes
Residential—Multi-Family
Transient Lodging—Motels, Hotels
Schools, Libraries, Churches, Hospitals, Nursing Homes
Auditoriums, Concert Halls, Amphitheaters
4 City of Bakersfield. 2002. Metropolitan Bakersfield General Plan, Chapter VII: Noise Element. December. Website:
http://docs.bakersfieldcity.us/weblink/0/doc/1273241/Page1.aspx. Accessed September 4, 2019. 5 City of Bakersfield. 2019. Bakersfield Municipal Code, Chapter 9.22 Noise. Website: https://bakersfield.municipal.codes/Code/9.22.
Accessed September 4, 2019.

Elmer F. Karpe, Inc.—Karpe Development Project Regulatory Setting Noise Impact Analysis Report
20 FirstCarbon Solutions
Y:\Publications\Client (PN-JN)\4767\47670003\Noise Report\47670003 Karpe Development - Noise Report.docx
Table 6 (cont.): Land Use Compatibility Standards for Community Noise Environments
Land Use Category
Community Noise Exposure in Decibels (CNEL) or Day/Night Average Noise Level in Decibels (Ldn)
55 60 65 70 75 80
Sports Arena, Outdoor Spectator Sports
Playgrounds, Neighborhood Parks
Golf Courses, Riding Stables, Water Recreation, Cemeteries
Office Buildings, Business Commercial and Professional
Industrial, Manufacturing, Utilities, Agriculture
NORMALLY ACCEPTABLE Specified land use is satisfactory, based upon the assumption that any buildings involved are of normal conventional construction, without any special noise insulation requirements.
NORMALLY UNACCEPTABLE New construction or development should be discouraged. If new construction or development does proceed, a detailed analysis of the noise reduction requirements must be made and needed noise insulation features included in the design.
CONDITIONALLY ACCEPTABLE New construction or development should be undertaken only after a detailed analysis of the noise reduction requirements is made and needed noise insulation features included in the design.
CLEARLY UNACCEPTABLE New construction or development clearly should not be undertaken.
Source: City of Bakersfield. 2002. Metropolitan Bakersfield General Plan, Chapter VII: Noise Element. December. Website: http://docs.bakersfieldcity.us/weblink/0/doc/1273241/Page1.aspx. Accessed September 4, 2019.
The Metropolitan Bakersfield General Plan also establishes exterior noise level performance standards. The exterior noise level standard for daytime hours, between 7:00 a.m. and 10:00 p.m., is 55 dBA L50 for a cumulative of 30 minutes in any 1-hour time period. The exterior noise level standard for nighttime hours, between 10:00 p.m. and 7:00 a.m., is 50 dBA L50 for a cumulative of 30 minutes in any 1-hour time period. Each of these noise level standards shall be reduced by 5 dBA for pure tone noises, noises consisting primarily of speech or music, or for recurring impulsive noises.
Bakersfield Municipal Code The City of Bakersfield Noise Ordinance is codified in Chapter 9.22 of the City’s Municipal Code. Section 9.22.050 restricts permissible hours of construction to between the hours of 6:00 a.m. and 9:00 p.m. Monday through Friday, and between the hours of 8:00 a.m. and 9:00 p.m. on Saturday and Sunday.

Elmer F. Karpe, Inc.—Karpe Development Project Noise Impact Analysis Report Existing Noise Conditions
FirstCarbon Solutions 21 Y:\Publications\Client (PN-JN)\4767\47670003\Noise Report\47670003 Karpe Development - Noise Report.docx
SECTION 4: EXISTING NOISE CONDITIONS
The following section describes the existing ambient noise environment of the project vicinity.
4.1 - Existing Ambient Noise Levels The proposed project site is located within the City of Bakersfield, in Kern County, California. Surrounding the project site is vacant land to the north and east, a mobile home park to the southeast, mobile home sales and RV storage to the south, and a commercial land use to the west. The dominant noise source in the project vicinity is traffic noise from Taft Highway, which runs along the southern boundary of the project site. Traffic noise from SR-99, located approximately 700 feet west of the project site. However, due to distance attenuation, while noise from traffic on SR-99 is audible on the project site, the dominant noise source in the project vicinity is noise from traffic on the Taft Highway immediately adjacent to the project site.
4.2 - Existing Traffic Noise Levels Existing traffic noise levels along selected roadway segments in the project vicinity were modeled using the FHWA Traffic Noise Prediction Model (FHWA-RD-77-108). Site-specific information is entered, such as roadway traffic volumes, roadway active width, source-to-receiver distances, travel speed, noise source and receiver heights, and the percentages of automobiles, medium trucks, and heavy trucks that the traffic is made up of throughout the day, amongst other variables. The daily traffic volumes were obtained from the traffic analysis prepared for the project by Ruettgers & Schuler Civil Engineers.6 The traffic volumes described here correspond to the existing without project conditions traffic scenario as described in the transportation analysis. The model inputs and outputs—including the 60 dBA, 65 dBA, and 70 dBA CNEL noise contour distances—are provided in the Appendix of this document. A summary of the modeling results is shown in Table 7.
Table 7: Existing Traffic Noise Levels
Roadway Segment Approximate
ADT
Centerline to 70 CNEL
(feet) Centerline to 65 CNEL (feet)
Centerline to 60 CNEL (feet)
CNEL (dBA) 50 feet from Centerline of Outermost
Lane
Taft Highway—H Street to La Jolla Street 9,500 < 50 62 128 64.3
Taft Highway—east of La Jolla Street 9,000 < 50 60 124 64.1
H Street—Taft Highway to SR-99 off ramp 2,700 < 50 < 50 80 62.3
H Street—south of SR-99 off ramp 1,700 < 50 < 50 61 59.3
Notes: 1 Modeling results do not take into account mitigating features such as topography, vegetative screening, fencing,
building design, or structure screening. Rather it assumes a worst case of having a direct line of site on flat terrain. ADT = average daily traffic Source: FCS 2019.
6 Ruettgers & Schuler Civil Engineers. 2019. Traffic Study, Proposed Commercial Development at the Northeast Corner of South H Street & Taft Highway (SR-119). July.

THIS PAGE INTENTIONALLY LEFT BLANK

Elmer F. Karpe, Inc.—Karpe Development Project Noise Impact Analysis Report Thresholds of Significance and Impact Analysis
FirstCarbon Solutions 23 Y:\Publications\Client (PN-JN)\4767\47670003\Noise Report\47670003 Karpe Development - Noise Report.docx
SECTION 5: THRESHOLDS OF SIGNIFICANCE AND IMPACT ANALYSIS
5.1 - Thresholds of Significance According to California Environmental Quality Act (CEQA) Guidelines updated Appendix G (2019), to determine whether impacts related to noise and vibration are significant environmental effects, the following questions are analyzed and evaluated.
It should be noted that the significance criteria question (a), below, is from the Land Use and Planning section of the CEQA Guidelines Appendix G checklist questions. However, this question addresses impacts related to conflicts with land use plans, which would include project-related conflicts to the noise land use compatibility standards of the Noise Element of the Metropolitan Bakersfield General Plan. Therefore, these impacts are addressed here.
Would the proposed plan:
a) Cause a significant environmental impact due to a conflict with any land use plan, policy, or regulation adopted for the purpose of avoiding or mitigating an environmental effect?
b) Generate a substantial temporary or permanent increase in ambient noise levels in the vicinity of the project in excess of standards established in the local general plan or noise ordinance, or applicable standards of other agencies?
c) Generate excessive groundborne vibration or groundborne noise levels?
d) For a project located within the vicinity of a private airstrip or an airport land use plan or, where such a plan has not been adopted, within two miles of a public airport or public use airport, would the project expose people residing or working in the project area to excessive noise levels?
5.2 - Noise levels that would conflict with any land use plan, policy, or regulation
A significant impact would occur if the project would result in a conflict with the City’s adopted land use compatibility standards. The Metropolitan Bakersfield General Plan indicates that for office buildings, business commercial and professional land use developments, environments with ambient noise levels ranging up to 70 dBA CNEL are considered “normally acceptable.”
The ambient noise environment of the project site has been documented through traffic noise modeling. The FHWA highway traffic noise prediction model (FHWA RD-77-108) was used to evaluate existing and future traffic noise conditions in the project vicinity. The projected future traffic noise levels adjacent to the project site were analyzed to determine compliance with the City’s noise and land use compatibility standards. The daily traffic volumes were obtained from the traffic analysis

Elmer F. Karpe, Inc.—Karpe Development Project Thresholds of Significance and Impact Analysis Noise Impact Analysis Report
24 FirstCarbon Solutions
Y:\Publications\Client (PN-JN)\4767\47670003\Noise Report\47670003 Karpe Development - Noise Report.docx
prepared for the project by Ruettgers & Schuler Civil Engineers.7 The resultant noise levels were weighed and summed over a 24-hour period in order to determine the CNEL values. The traffic noise modeling input and output files are included in Appendix A of this document. Table 8 shows a summary of the traffic noise levels for Existing (2019), Existing Plus Project (2019), Opening Year (2021), Opening Year Plus Project (2021), Future Cumulative (2035), and Future Cumulative Plus Project (2035) conditions as measured at 50 feet from the centerline of the outermost travel lane.
Table 8: Traffic Noise Model Results Summary
Roadway Segment
Existing (2019)
(dBA) CNEL
Existing Plus Project
(2019) (dBA) CNEL
Opening Year (2021) (dBA) CNEL
Opening Year Plus Project (2021)
(dBA) CNEL
Future Cumulative
(2035) (dBA) CNEL
Future Cumulative Plus Project (2035) (dBA)
CNEL
Taft Highway—H Street to La Jolla Street 64.3 65.1 64.6 65.3 64.9 65.6
Taft Highway—east of La Jolla Street 64.1 64.3 64.3 64.6 64.7 64.9
H Street—Taft Highway to SR-99 off ramp 62.3 62.9 62.7 63.2 62.8 63.3
H Street—south of SR-99 off ramp 59.3 59.3 59.3 59.3 59.5 59.5
Note: Noise levels as measured at 50 feet from the centerline of the outermost travel lane. Source: FCS 2018.
As shown in Table 8, projected traffic noise levels along Taft Highway between H Street and La Jolla Street, adjacent to the project site, would range up to 65.6 dBA CNEL as measured at 50 feet from the centerline of the outermost travel lane under Future Cumulative Plus Project (2035) conditions.
The nearest façade of the proposed convenience store building to the Taft Highway roadway segment would be located approximately 255 feet from the centerline of the outermost travel lane of Taft Highway. At this distance, traffic noise levels from Taft Highway would attenuate to below 52 dBA CNEL at this building’s nearest façade. These noise levels are well below the City’s “Normally Acceptable” threshold of 70 dBA CNEL for office buildings, business commercial, and professional land use developments. Therefore, the proposed project would not result in a conflict with the City’s land use compatibility standards, which would represent a less than significant impact.
7 Ruettgers & Schuler Civil Engineers. 2019. Traffic Study, Proposed Commercial Development at the Northeast Corner of South H
Street & Taft Highway (SR 119). July.

Elmer F. Karpe, Inc.—Karpe Development Project Noise Impact Analysis Report Thresholds of Significance and Impact Analysis
FirstCarbon Solutions 25 Y:\Publications\Client (PN-JN)\4767\47670003\Noise Report\47670003 Karpe Development - Noise Report.docx
5.3 - Substantial Noise Increase in Excess of Standards
5.3.1 - Construction Noise Impacts For purposes of this analysis, a significant impact would occur if construction activities would result in a substantial temporary increase in ambient noise levels outside of the City’s permissible hours for construction (6:00 a.m. to 9:00 p.m. on weekdays, and 8:00 a.m. to 9:00 p.m. on weekends) that would result in annoyance or sleep disturbance of nearby sensitive receptors.
Construction-related Traffic Noise Noise impacts from construction activities associated with the project would be a function of the noise generated by construction equipment, equipment location, sensitivity of nearby land uses, and the timing and duration of the construction activities. One type of short-term noise impact that could occur during project construction would result from the increase in traffic flow on local streets, associated with the transport of workers, equipment, and materials to and from the project site. The transport of workers and construction equipment and materials to the project site would incrementally increase noise levels on access roads leading to the site. Because workers and construction equipment would use existing routes, noise from passing trucks would be similar to existing vehicle-generated noise on these local roadways. Typically, a doubling of the average daily trip (ADT) hourly volumes on a roadway segment is required in order to result in an increase of 3 dBA in traffic noise levels; which, as discussed in the characteristics of nose discussion above, is the lowest change that can be perceptible to the human ear in outdoor environments. Project-related construction trips would not be expected to double the hourly or daily traffic volumes along any roadway segment in the project vicinity. For this reason, short-term intermittent noise from construction trips would not be expected to result in a perceptible increase in hourly- or daily-average traffic noise levels in the project vicinity. Therefore, short-term construction-related noise impacts associated with the transportation of workers and equipment to the project site would be less than significant.
Construction Equipment Operational Noise The second type of short-term noise impact is related to noise generated during construction on the project site. Construction is completed in discrete steps, each of which has its own mix of equipment and, consequently, its own noise characteristics. These various sequential phases would change the character of the noise generated on the site and, therefore, the noise levels surrounding the site as construction progresses. Despite the variety in the type and size of construction equipment, similarities in the dominant noise sources and patterns of operation allow construction related noise ranges to be categorized by work phase. Table 1 lists typical construction equipment noise levels, based on a distance of 50 feet between the equipment and a noise receptor. Typical operating cycles for these types of construction equipment may involve 1 or 2 minutes of full-power operation followed by 3 or 4 minutes at lower power settings. Impact equipment such as pile drivers are not expected to be used during construction of this project.
The site preparation phase, which includes excavation and grading of the site, tends to generate the highest noise levels because the noisiest construction equipment is earthmoving equipment.

Elmer F. Karpe, Inc.—Karpe Development Project Thresholds of Significance and Impact Analysis Noise Impact Analysis Report
26 FirstCarbon Solutions
Y:\Publications\Client (PN-JN)\4767\47670003\Noise Report\47670003 Karpe Development - Noise Report.docx
Earthmoving equipment includes excavating machinery and compacting equipment, such as bulldozers, draglines, backhoes, front loaders, roller compactors, scrapers, and graders. Typical operating cycles for these types of construction equipment may involve 1 or 2 minutes of full power operation followed by 3 or 4 minutes at lower power settings.
Construction of the project is expected to require the use of scrapers, bulldozers, water trucks, haul trucks, and pickup trucks. Based on the information provided in Table 2, the maximum noise level generated by each scraper is assumed to be 85 dBA Lmax at 50 feet from this equipment. Each bulldozer would also generate 85 dBA Lmax at 50 feet. The maximum noise level generated by graders is approximately 85 dBA Lmax at 50 feet. A characteristic of sound is that each doubling of sound sources with equal strength increases a sound level by 3 dBA. Assuming that each piece of construction equipment operates at some distance from the other equipment, a reasonable worst-case combined noise level during this phase of construction would be 90 dBA Lmax at a distance of 50 feet from the acoustic center of a construction area. This would result in a reasonable worst-case hourly average of 86 dBA Leq, at a distance of 50 feet from the acoustic center of a construction area when multiple pieces of heavy equipment operate simultaneously in relatively the same location for an hour period.
The closest noise-sensitive receptors to the project site is the single-family residence located south of the southeastern corner of the project site, south of Taft Highway and west La Jolla Street. The façade of this closest home would be located approximately 200 feet from the acoustic center of construction activity where multiple pieces of heavy construction equipment would operate simultaneously. At this distance, construction noise levels could range up to approximately 78 dBA Lmax, with a relative worst-case hourly average of 74 dBA Leq at this receptor. These noise levels could occur temporarily under the reasonable worst-case scenario of multiple pieces of heavy construction equipment operating simultaneously in relatively the same locations at the nearest project boundary for an hour period.
Although there could be a relatively high single event noise exposure potential causing an intermittent noise nuisance, the effect of construction activities on longer-term (hourly or daily) ambient noise levels would be small but could result in a temporary increase in ambient noise levels in the project vicinity that could result in annoyance or sleep disturbance of nearby sensitive receptors. However, Section 9.22.050 of the Bakersfield Municipal Code restricts permissible hours of construction to between the hours of 6:00 a.m. and 9:00 p.m. Monday through Friday, and between the hours of 8:00 a.m. and 9:00 p.m. on Saturday and Sunday. Therefore, compliance with the City’s permissible hours of construction, as well as implementing the best management noise reduction techniques and practices outlined in Mitigation Measure (MM) NOI-1, would ensure that construction noise would not result in a substantial temporary increase in ambient noise levels that would result in annoyance or sleep disturbance of nearby sensitive receptors. Therefore, with implementation of MM NOI-1, temporary construction noise impacts would be reduced to less than significant.
5.3.2 - Mobile Source Operational Noise Impacts A significant impact would occur if project-generated traffic would result in a substantial increase in ambient noise levels compared with those that would exist without the project. The Metropolitan

Elmer F. Karpe, Inc.—Karpe Development Project Noise Impact Analysis Report Thresholds of Significance and Impact Analysis
FirstCarbon Solutions 27 Y:\Publications\Client (PN-JN)\4767\47670003\Noise Report\47670003 Karpe Development - Noise Report.docx
Bakersfield General Plan establishes the following criteria for project mobile source noise impacts. A significant impact would occur if the project would cause the CNEL to increase by any of the following:
• 5 dBA or more where the existing ambient noise level is less than 60 dBA CNEL. • 3 dBA or more where the existing ambient noise level is 60 dBA to 65 dBA CNEL. • 1.5 dBA or more where the existing ambient noise level is greater than 65 dBA CNEL.
Table 9 shows a summary of the traffic noise levels for Existing (2019), Existing Plus Project (2019), Opening Year (2021), Opening Year Plus Project (2021), Future Cumulative (2035), and Future Cumulative Plus Project (2035) conditions as measured at 50 feet from the centerline of the outermost travel lane.
Table 9: Traffic Noise Increase Summary
Roadway Segment
Existing (dBA) CNEL
Existing Plus
Project (dBA) CNEL
Increase over
Existing (dBA)
Opening Year
(dBA) CNEL
Opening Year Plus
Project (dBA) CNEL
Increase over
Opening Year
(dBA)
Future Cumulative (dBA) CNEL
Future Cumulative
Plus Project
(dBA) CNEL
Increase over
Future Cumulative
(dBA)
Taft Highway—H Street to La Jolla Street
64.3 65.1 0.8 64.6 65.3 0.7 64.9 65.6 0.7
Taft Highway—east of La Jolla Street
64.1 64.3 0.2 64.3 64.6 0.3 64.7 64.9 0.2
H Street—Taft Highway to SR-99 off ramp
62.3 62.9 0.6 62.7 63.2 0.5 62.8 63.3 0.5
H Street—south of SR-99 off ramp
59.3 59.3 0.0 59.3 59.3 0.0 59.5 59.5 0.0
Source: FCS 2019.
As shown in Table 9, the highest traffic noise level increase with implementation of the project would occur along Taft Highway between H Street and La Jolla Street, under Existing Plus Project (2019) conditions. Along this roadway segment, the project would result in an increase in traffic noise levels of 0.8 dBA over existing conditions for this roadway segment. This increase is below the 1.5 dBA increase that would be considered a substantial permanent increase in noise levels compared with noise levels that would exist without the project. Therefore, project-related traffic noise levels would not result in a substantial permanent increase in traffic noise levels in excess of applicable standards, and would represent a less than significant impact.
5.3.3 - Stationary Source Operational Noise Impacts A significant impact would occur if operational noise levels generated by stationary noise sources at the proposed project site would result in a substantial permanent increase in ambient noise levels in excess of any of the noise performance thresholds established in the City’s General Plan. The

Elmer F. Karpe, Inc.—Karpe Development Project Thresholds of Significance and Impact Analysis Noise Impact Analysis Report
28 FirstCarbon Solutions
Y:\Publications\Client (PN-JN)\4767\47670003\Noise Report\47670003 Karpe Development - Noise Report.docx
Metropolitan Bakersfield General Plan establishes exterior noise level standards, measured as a cumulative of 30 minutes in any 1-hour time period, of 55 dBA L50 during daytime hours between 7:00 a.m. and 10:00 p.m., and 50 dBA L50 during nighttime hours between 10:00 p.m. and 7:00 a.m.
As noted in the characteristics of noise discussion, audible increases in noise levels generally refer to a change of 3 dBA or more, as this level has been found to be barely perceptible to the human ear in outdoor environments. A change of 5 dBA is considered the minimum readily perceptible change to the human ear in outdoor environments. Therefore, for purposes of this analysis, an increase of more than 3 dBA above the applicable noise performance thresholds would be considered a substantial permanent increase in ambient noise levels.
The proposed project would include new stationary noise sources, including parking lot activities, truck repair equipment, and mechanical ventilation equipment.
Parking Lot Activities Typical parking lot activities include people conversing, doors shutting, and vehicles idling which generate noise levels ranging from approximately 60 dBA to 70 dBA Lmax at 50 feet. These activities are expected to occur sporadically throughout the day and night, as cars, RVs, and trucks arrive and leave parking lot areas on the project site.
The nearest noise-sensitive receptor to the parking areas of the proposed project is the single-family residence located south of the southeastern corner of the project site, south of Taft Highway and west La Jolla Street. This residence would be located approximately 350 feet from the nearest parking areas on the project site. This closest parking area is one of the parking area designated for large truck parking. Assuming a minimum of one parking movement per stall per hour, hourly average noise levels associated with daily parking lot activities would be approximately 42 dBA Leq at the nearest residential property line. These noise levels would not exceed the City’s most restrictive noise performance threshold, the nighttime exterior noise level standard, of 50 dBA L50, as measured at the closest receiving residential land use. Therefore, operational parking lot activity noise levels would not result in a substantial permanent increase in ambient noise levels in excess of any of the City’s noise performance thresholds, and would represent a less than significant impact.
Truck Repair Equipment Noise would also be generated by truck repair equipment operations, such as air compressor and generators. Operation of this equipment would occur inside the proposed maintenance building; the walls of this building, even with bay doors open, would provide a minimum 10 dBA reduction, as measured at residential land uses south of the project site. In addition, there is an existing 6-foot high soundwall bordering this residential land use that would block the line of sight to the maintenance building. The loudest pieces of equipment that could operate in this facility are air compressor and generator types of equipment. As shown in Table 2, typical noise levels from air compressors and generators can range up to 82 dBA Lmax as measured at 50 feet. The maintenance building would be located approximately 565 feet from the nearest off-site noise-sensitive receptor, which is the single-family residence located south of the southeastern corner of the project site, south of Taft Highway and west La Jolla Street. At this distance, truck repair equipment could result

Elmer F. Karpe, Inc.—Karpe Development Project Noise Impact Analysis Report Thresholds of Significance and Impact Analysis
FirstCarbon Solutions 29 Y:\Publications\Client (PN-JN)\4767\47670003\Noise Report\47670003 Karpe Development - Noise Report.docx
in intermittent noise levels ranging up to approximately 48 dBA Lmax. These activities are expected to occur primarily during the day and minimally at night. Assuming multiple generator or air compressor equipment operating in a single hour period, reasonable worst-case hourly average noise levels associated with these activities would be approximately 45 dBA Leq at the nearest residential property line. Therefore, these projected loudest operational noise levels from stationary noise sources associated with the maintenance building operations would not exceed the City’s most restrictive noise performance threshold, the nighttime exterior noise level standard, of 50 dBA L50, as measured at the nearest residential receptor. Therefore, operational noise levels from truck repair equipment would not result in a substantial permanent increase in ambient noise levels in excess of any of the noise performance thresholds, and would represent a less than significant impact.
Mechanical Ventilation Equipment Implementation of the project would include operation of new rooftop mechanical ventilation equipment on the proposed convenience store, which would be a new stationary noise source in the project vicinity. At the time of preparation of this analysis, specific details of rooftop mechanical ventilation systems were not available; therefore, a reference noise level for typical rooftop mechanical ventilation systems was used. Noise levels from typical commercial-grade mechanical ventilation equipment systems range up to approximately 60 dBA Leq at a distance of 25 feet. The rooftop mechanical ventilation systems could be located as close as 855 feet from the nearest off-site noise-sensitive receptor, which is the single-family residence located south of the southeastern corner of the project site, south of Taft Highway and west La Jolla Street. At this distance, these mechanical ventilation system operational noise levels would attenuate to below 29 dBA Leq, as measured at the nearest noise-sensitive receptor. These noise levels would not exceed the City’s most restrictive noise performance threshold, the nighttime exterior noise level standard, of 50 dBA L50, as measured at the nearest residential receptor. Therefore, operational noise levels generated by the proposed mechanical ventilation equipment would not result in a substantial permanent increase in ambient noise levels in excess of any of the noise performance thresholds, and would represent a less than significant impact.
Mitigation Measures Project construction activity noise impacts, which could result in a temporary increase in ambient noise levels in the project vicinity that could result in annoyance or sleep disturbance of nearby sensitive receptors, would be reduced to less than significant with implementation of the following multi-part mitigation measure.
MM NOI-1 Implementation of the following multi-part mitigation measure is required to reduce potential construction period noise impacts:
• The construction contractor shall ensure that all equipment driven by internal combustion engines shall be equipped with mufflers that are in good condition and appropriate for the equipment.
• The construction contractor shall ensure that unnecessary idling of internal combustion engines (i.e., idling in excess of 5 minutes) is prohibited.

Elmer F. Karpe, Inc.—Karpe Development Project Thresholds of Significance and Impact Analysis Noise Impact Analysis Report
30 FirstCarbon Solutions
Y:\Publications\Client (PN-JN)\4767\47670003\Noise Report\47670003 Karpe Development - Noise Report.docx
• The construction contractor shall utilize “quiet” models of air compressors and other stationary noise sources where technology exists.
• At all times during project grading and construction, the construction contractor shall ensure that stationary noise-generating equipment shall be located as far as practicable from sensitive receptors and placed so that emitted noise is directed away from adjacent residences.
• The construction contractor shall ensure that the construction staging areas shall be located to create the greatest feasible distance between the staging area and noise-sensitive receptors nearest the project site.
• The construction contractor shall ensure that all on-site construction activities, including the operation of any tools or equipment used in construction, drilling, repair, alteration, grading or demolition work, are limited to between the hours of 6:00 a.m. and 9:00 p.m. Monday through Friday, and between the hours of 8:00 a.m. and 9:00 p.m. on Saturday and Sunday.
5.4 - Groundborne Vibration/Noise Levels This section analyzes both construction and operational groundborne vibration and noise impacts. Groundborne vibrations consist of rapidly fluctuating motions within the ground that have an average motion of zero. Vibrating objects in contact with the ground radiate vibration waves through various soil and rock strata to the foundations of nearby buildings. Groundborne noise is generated when vibrating building components radiate sound, or noise generated by groundborne vibration. In general, if groundborne vibration levels do not exceed levels considered to be perceptible, then groundborne noise levels would not be perceptible in most interior environments. Therefore, this analysis focuses on determining exceedances of groundborne vibration levels.
The City of Bakersfield has not adopted criteria for groundborne vibration impacts. Therefore, for purposes of this analysis, the FTA’s vibration impact criteria are utilized. The FTA has established industry accepted standards for vibration impact criteria and impact assessment. These guidelines are published in its Transit Noise and Vibration Impact Assessment Manual.8 These guidelines are summarized in Table 5.
5.4.1 - Short-term Construction Vibration Impacts A significant impact would occur if existing structures at the project site or in the project vicinity would be exposed to groundborne vibration levels in excess of levels established by the FTA’s Construction Vibration Impact Criteria for the listed type of structure, as shown in Table 5.
Of the variety of equipment used during construction, the small vibratory rollers that are anticipated to be used in the site preparation phase of construction would produce the greatest groundborne vibration levels. Small vibratory rollers produce groundborne vibration levels ranging up to 0.101 inch per second (in/sec) PPV at 25 feet from the operating equipment.
8 Federal Transit Administration (FTA). 2018. Transit Noise and Vibration Impact Assessment Manual. September.

Elmer F. Karpe, Inc.—Karpe Development Project Noise Impact Analysis Report Thresholds of Significance and Impact Analysis
FirstCarbon Solutions 31 Y:\Publications\Client (PN-JN)\4767\47670003\Noise Report\47670003 Karpe Development - Noise Report.docx
The nearest off-site receptor to the project site is the commercial building located west of the project site, across H Street. The façade of this building would be located approximately 90 feet from the nearest construction footprint where the heaviest construction equipment would potentially operate. At this distance, groundborne vibration levels would range up to 0.015 PPV from operation of the types of equipment that would produce the highest vibration levels. This is well below the FTA’s Construction Vibration Impact Criteria of 0.2 PPV for this type of structure, a building of non-engineer timber construction. Therefore, the impact of short-term groundborne vibration associated with construction to off-site receptors would be less than significant.
5.4.2 - Operational Vibration Impacts Implementation of the project would not include any permanent sources that would expose persons in the project vicinity to groundborne vibration levels that could be perceptible without instruments at any existing sensitive land use in the project vicinity. In addition, there are no existing significant permanent sources of groundborne vibration in the project vicinity to which the proposed project would be exposed. Therefore, project operational groundborne vibration level impacts would be considered less than significant.
5.5 - Excessive Noise Levels from Airport Activity A significant impact would occur if the project would expose people residing or working in the project area to excessive noise levels for a project located within the vicinity of a private airstrip or an airport land use plan or, where such a plan has not been adopted, within 2 miles of a public airport or public use airport.
The project site is not located within the vicinity of a private airstrip. The nearest public airport to the project site is the Bakersfield Municipal Airport, located approximately 3.6 miles north of the project site. Because of the distance of the project site from the airport runways, the project site is located outside of the 65 dBA CNEL airport noise contours. While aircraft noise is occasionally audible on the project site from aircraft flyovers, aircraft noise associated with nearby airport activity would not expose people residing or working near the project site to excessive noise levels. Therefore, implementation of the project would not expose persons residing or working in the project vicinity to noise levels from airport activity that would be in excess of normally acceptable standards for the proposed land use development, and no impact would occur.

THIS PAGE INTENTIONALLY LEFT BLANK
Elmer F. Karpe, Inc.—Karpe Development Project Noise Impact Analysis Report
FirstCarbon Solutions Y:\Publications\Client (PN-JN)\4767\47670003\Noise Report\47670003 Karpe Development - Noise Report.docx
Appendix A: Noise Modeling Data

THIS PAGE INTENTIONALLY LEFT BLANK

TABLE Existing (2019)-01 FHWA ROADWAY NOISE LEVEL ANALYSIS RUN DATE: 11/04/2019 ROADWAY SEGMENT: Taft Highway - H Street to La Jolla Street NOTES: Karpe Development Project - Existing (2019) ______________________________________________________________________ * * ASSUMPTIONS * * AVERAGE DAILY TRAFFIC: 9500 SPEED (MPH): 40 GRADE: .5 TRAFFIC DISTRIBUTION PERCENTAGES DAY EVENING NIGHT --- ------- ----- AUTOS 75.51 12.57 9.34 M-TRUCKS 1.56 0.09 0.19 H-TRUCKS 0.64 0.02 0.08 ACTIVE HALF-WIDTH (FT): 18 SITE CHARACTERISTICS: SOFT ______________________________________________________________________ * * CALCULATED NOISE LEVELS * * CNEL AT 50 FT FROM NEAR TRAVEL LANE CENTERLINE (dB) = 64.32 DISTANCE (FEET) FROM ROADWAY CENTERLINE TO CNEL 70 CNEL 65 CNEL 60 CNEL 55 CNEL ------- ------- ------- ------- 0.0 61.7 128.4 274.4 ______________________________________________________________________

TABLE Existing (2019)-02 FHWA ROADWAY NOISE LEVEL ANALYSIS RUN DATE: 11/04/2019 ROADWAY SEGMENT: Taft Highway - east of La Jolla Street NOTES: Karpe Development Project - Existing (2019) ______________________________________________________________________ * * ASSUMPTIONS * * AVERAGE DAILY TRAFFIC: 9000 SPEED (MPH): 40 GRADE: .5 TRAFFIC DISTRIBUTION PERCENTAGES DAY EVENING NIGHT --- ------- ----- AUTOS 75.51 12.57 9.34 M-TRUCKS 1.56 0.09 0.19 H-TRUCKS 0.64 0.02 0.08 ACTIVE HALF-WIDTH (FT): 18 SITE CHARACTERISTICS: SOFT ______________________________________________________________________ * * CALCULATED NOISE LEVELS * * CNEL AT 50 FT FROM NEAR TRAVEL LANE CENTERLINE (dB) = 64.08 DISTANCE (FEET) FROM ROADWAY CENTERLINE TO CNEL 70 CNEL 65 CNEL 60 CNEL 55 CNEL ------- ------- ------- ------- 0.0 59.7 124.0 264.8 ______________________________________________________________________

TABLE Existing (2019)-03 FHWA ROADWAY NOISE LEVEL ANALYSIS RUN DATE: 11/04/2019 ROADWAY SEGMENT: H Street - Taft Highway to SR 99 off ramp NOTES: Karpe Development Project - Existing (2019) ______________________________________________________________________ * * ASSUMPTIONS * * AVERAGE DAILY TRAFFIC: 2700 SPEED (MPH): 50 GRADE: .5 TRAFFIC DISTRIBUTION PERCENTAGES DAY EVENING NIGHT --- ------- ----- AUTOS 75.51 12.57 9.34 M-TRUCKS 1.56 0.09 0.19 H-TRUCKS 0.64 0.02 0.08 ACTIVE HALF-WIDTH (FT): 6 SITE CHARACTERISTICS: SOFT ______________________________________________________________________ * * CALCULATED NOISE LEVELS * * CNEL AT 50 FT FROM NEAR TRAVEL LANE CENTERLINE (dB) = 62.35 DISTANCE (FEET) FROM ROADWAY CENTERLINE TO CNEL 70 CNEL 65 CNEL 60 CNEL 55 CNEL ------- ------- ------- ------- 0.0 0.0 80.0 172.0 ______________________________________________________________________

TABLE Existing (2019)-04 FHWA ROADWAY NOISE LEVEL ANALYSIS RUN DATE: 11/04/2019 ROADWAY SEGMENT: H Street - south of SR 99 off ramp NOTES: Karpe Development Project - Existing (2019) ______________________________________________________________________ * * ASSUMPTIONS * * AVERAGE DAILY TRAFFIC: 1700 SPEED (MPH): 50 GRADE: .5 TRAFFIC DISTRIBUTION PERCENTAGES DAY EVENING NIGHT --- ------- ----- AUTOS 75.51 12.57 9.34 M-TRUCKS 1.56 0.09 0.19 H-TRUCKS 0.64 0.02 0.08 ACTIVE HALF-WIDTH (FT): 18 SITE CHARACTERISTICS: SOFT ______________________________________________________________________ * * CALCULATED NOISE LEVELS * * CNEL AT 50 FT FROM NEAR TRAVEL LANE CENTERLINE (dB) = 59.27 DISTANCE (FEET) FROM ROADWAY CENTERLINE TO CNEL 70 CNEL 65 CNEL 60 CNEL 55 CNEL ------- ------- ------- ------- 0.0 0.0 61.3 127.4 ______________________________________________________________________

TABLE Existing + Project (2019)-01 FHWA ROADWAY NOISE LEVEL ANALYSIS RUN DATE: 11/04/2019 ROADWAY SEGMENT: Taft Highway - H Street to La Jolla Street NOTES: Karpe Development Project - Existing + Project (2019) ______________________________________________________________________ * * ASSUMPTIONS * * AVERAGE DAILY TRAFFIC: 11400 SPEED (MPH): 40 GRADE: .5 TRAFFIC DISTRIBUTION PERCENTAGES DAY EVENING NIGHT --- ------- ----- AUTOS 75.51 12.57 9.34 M-TRUCKS 1.56 0.09 0.19 H-TRUCKS 0.64 0.02 0.08 ACTIVE HALF-WIDTH (FT): 18 SITE CHARACTERISTICS: SOFT ______________________________________________________________________ * * CALCULATED NOISE LEVELS * * CNEL AT 50 FT FROM NEAR TRAVEL LANE CENTERLINE (dB) = 65.11 DISTANCE (FEET) FROM ROADWAY CENTERLINE TO CNEL 70 CNEL 65 CNEL 60 CNEL 55 CNEL ------- ------- ------- ------- 0.0 69.0 144.7 309.8 ______________________________________________________________________

TABLE Existing + Project (2019)-02 FHWA ROADWAY NOISE LEVEL ANALYSIS RUN DATE: 11/04/2019 ROADWAY SEGMENT: Taft Highway - east of La Jolla Street NOTES: Karpe Development Project - Existing + Project (2019) ______________________________________________________________________ * * ASSUMPTIONS * * AVERAGE DAILY TRAFFIC: 9500 SPEED (MPH): 40 GRADE: .5 TRAFFIC DISTRIBUTION PERCENTAGES DAY EVENING NIGHT --- ------- ----- AUTOS 75.51 12.57 9.34 M-TRUCKS 1.56 0.09 0.19 H-TRUCKS 0.64 0.02 0.08 ACTIVE HALF-WIDTH (FT): 18 SITE CHARACTERISTICS: SOFT ______________________________________________________________________ * * CALCULATED NOISE LEVELS * * CNEL AT 50 FT FROM NEAR TRAVEL LANE CENTERLINE (dB) = 64.32 DISTANCE (FEET) FROM ROADWAY CENTERLINE TO CNEL 70 CNEL 65 CNEL 60 CNEL 55 CNEL ------- ------- ------- ------- 0.0 61.7 128.4 274.4 ______________________________________________________________________

TABLE Existing + Project (2019)-03 FHWA ROADWAY NOISE LEVEL ANALYSIS RUN DATE: 11/04/2019 ROADWAY SEGMENT: H Street - Taft Highway to SR 99 off ramp NOTES: Karpe Development Project - Existing + Project (2019) ______________________________________________________________________ * * ASSUMPTIONS * * AVERAGE DAILY TRAFFIC: 3100 SPEED (MPH): 50 GRADE: .5 TRAFFIC DISTRIBUTION PERCENTAGES DAY EVENING NIGHT --- ------- ----- AUTOS 75.51 12.57 9.34 M-TRUCKS 1.56 0.09 0.19 H-TRUCKS 0.64 0.02 0.08 ACTIVE HALF-WIDTH (FT): 6 SITE CHARACTERISTICS: SOFT ______________________________________________________________________ * * CALCULATED NOISE LEVELS * * CNEL AT 50 FT FROM NEAR TRAVEL LANE CENTERLINE (dB) = 62.95 DISTANCE (FEET) FROM ROADWAY CENTERLINE TO CNEL 70 CNEL 65 CNEL 60 CNEL 55 CNEL ------- ------- ------- ------- 0.0 0.0 87.7 188.6 ______________________________________________________________________
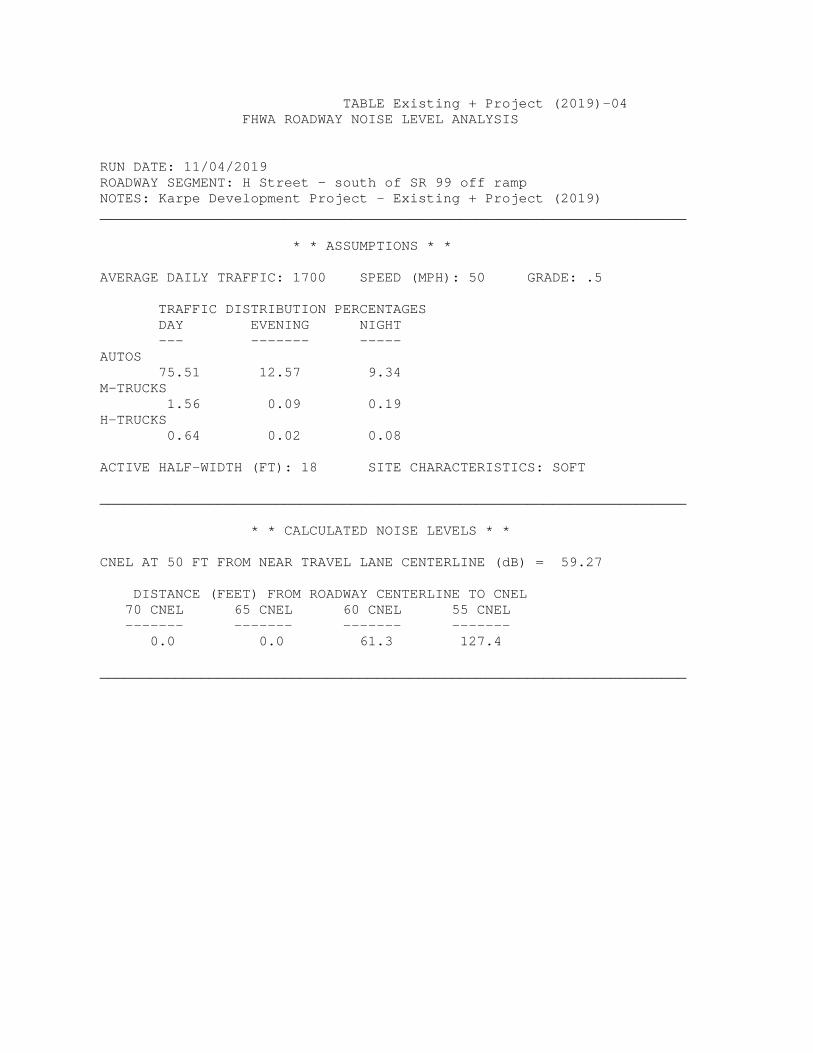
TABLE Existing + Project (2019)-04 FHWA ROADWAY NOISE LEVEL ANALYSIS RUN DATE: 11/04/2019 ROADWAY SEGMENT: H Street - south of SR 99 off ramp NOTES: Karpe Development Project - Existing + Project (2019) ______________________________________________________________________ * * ASSUMPTIONS * * AVERAGE DAILY TRAFFIC: 1700 SPEED (MPH): 50 GRADE: .5 TRAFFIC DISTRIBUTION PERCENTAGES DAY EVENING NIGHT --- ------- ----- AUTOS 75.51 12.57 9.34 M-TRUCKS 1.56 0.09 0.19 H-TRUCKS 0.64 0.02 0.08 ACTIVE HALF-WIDTH (FT): 18 SITE CHARACTERISTICS: SOFT ______________________________________________________________________ * * CALCULATED NOISE LEVELS * * CNEL AT 50 FT FROM NEAR TRAVEL LANE CENTERLINE (dB) = 59.27 DISTANCE (FEET) FROM ROADWAY CENTERLINE TO CNEL 70 CNEL 65 CNEL 60 CNEL 55 CNEL ------- ------- ------- ------- 0.0 0.0 61.3 127.4 ______________________________________________________________________

TABLE Opening Year (2021)-01 FHWA ROADWAY NOISE LEVEL ANALYSIS RUN DATE: 11/04/2019 ROADWAY SEGMENT: Taft Highway - H Street to La Jolla Street NOTES: Karpe Development Project - Opening Year (2021) ______________________________________________________________________ * * ASSUMPTIONS * * AVERAGE DAILY TRAFFIC: 10100 SPEED (MPH): 40 GRADE: .5 TRAFFIC DISTRIBUTION PERCENTAGES DAY EVENING NIGHT --- ------- ----- AUTOS 75.51 12.57 9.34 M-TRUCKS 1.56 0.09 0.19 H-TRUCKS 0.64 0.02 0.08 ACTIVE HALF-WIDTH (FT): 18 SITE CHARACTERISTICS: SOFT ______________________________________________________________________ * * CALCULATED NOISE LEVELS * * CNEL AT 50 FT FROM NEAR TRAVEL LANE CENTERLINE (dB) = 64.58 DISTANCE (FEET) FROM ROADWAY CENTERLINE TO CNEL 70 CNEL 65 CNEL 60 CNEL 55 CNEL ------- ------- ------- ------- 0.0 64.1 133.7 285.8 ______________________________________________________________________

TABLE Opening Year (2021)-02 FHWA ROADWAY NOISE LEVEL ANALYSIS RUN DATE: 11/04/2019 ROADWAY SEGMENT: Taft Highway - east of La Jolla Street NOTES: Karpe Development Project - Opening Year (2021) ______________________________________________________________________ * * ASSUMPTIONS * * AVERAGE DAILY TRAFFIC: 9500 SPEED (MPH): 40 GRADE: .5 TRAFFIC DISTRIBUTION PERCENTAGES DAY EVENING NIGHT --- ------- ----- AUTOS 75.51 12.57 9.34 M-TRUCKS 1.56 0.09 0.19 H-TRUCKS 0.64 0.02 0.08 ACTIVE HALF-WIDTH (FT): 18 SITE CHARACTERISTICS: SOFT ______________________________________________________________________ * * CALCULATED NOISE LEVELS * * CNEL AT 50 FT FROM NEAR TRAVEL LANE CENTERLINE (dB) = 64.32 DISTANCE (FEET) FROM ROADWAY CENTERLINE TO CNEL 70 CNEL 65 CNEL 60 CNEL 55 CNEL ------- ------- ------- ------- 0.0 61.7 128.4 274.4 ______________________________________________________________________

TABLE Opening Year (2021)-03 FHWA ROADWAY NOISE LEVEL ANALYSIS RUN DATE: 11/04/2019 ROADWAY SEGMENT: H Street - Taft Highway to SR 99 off ramp NOTES: Karpe Development Project - Opening Year (2021) ______________________________________________________________________ * * ASSUMPTIONS * * AVERAGE DAILY TRAFFIC: 2900 SPEED (MPH): 50 GRADE: .5 TRAFFIC DISTRIBUTION PERCENTAGES DAY EVENING NIGHT --- ------- ----- AUTOS 75.51 12.57 9.34 M-TRUCKS 1.56 0.09 0.19 H-TRUCKS 0.64 0.02 0.08 ACTIVE HALF-WIDTH (FT): 6 SITE CHARACTERISTICS: SOFT ______________________________________________________________________ * * CALCULATED NOISE LEVELS * * CNEL AT 50 FT FROM NEAR TRAVEL LANE CENTERLINE (dB) = 62.66 DISTANCE (FEET) FROM ROADWAY CENTERLINE TO CNEL 70 CNEL 65 CNEL 60 CNEL 55 CNEL ------- ------- ------- ------- 0.0 0.0 83.9 180.4 ______________________________________________________________________

TABLE Opening Year (2021)-04 FHWA ROADWAY NOISE LEVEL ANALYSIS RUN DATE: 11/04/2019 ROADWAY SEGMENT: H Street - south of SR 99 off ramp NOTES: Karpe Development Project - Opening Year (2021) ______________________________________________________________________ * * ASSUMPTIONS * * AVERAGE DAILY TRAFFIC: 1700 SPEED (MPH): 50 GRADE: .5 TRAFFIC DISTRIBUTION PERCENTAGES DAY EVENING NIGHT --- ------- ----- AUTOS 75.51 12.57 9.34 M-TRUCKS 1.56 0.09 0.19 H-TRUCKS 0.64 0.02 0.08 ACTIVE HALF-WIDTH (FT): 18 SITE CHARACTERISTICS: SOFT ______________________________________________________________________ * * CALCULATED NOISE LEVELS * * CNEL AT 50 FT FROM NEAR TRAVEL LANE CENTERLINE (dB) = 59.27 DISTANCE (FEET) FROM ROADWAY CENTERLINE TO CNEL 70 CNEL 65 CNEL 60 CNEL 55 CNEL ------- ------- ------- ------- 0.0 0.0 61.3 127.4 ______________________________________________________________________

TABLE Opening Year + Project (2021) -01 FHWA ROADWAY NOISE LEVEL ANALYSIS RUN DATE: 11/04/2019 ROADWAY SEGMENT: Taft Highway - H Street to La Jolla Street NOTES: Karpe Development Project - Opening Year + Project (2021) ______________________________________________________________________ * * ASSUMPTIONS * * AVERAGE DAILY TRAFFIC: 12000 SPEED (MPH): 40 GRADE: .5 TRAFFIC DISTRIBUTION PERCENTAGES DAY EVENING NIGHT --- ------- ----- AUTOS 75.51 12.57 9.34 M-TRUCKS 1.56 0.09 0.19 H-TRUCKS 0.64 0.02 0.08 ACTIVE HALF-WIDTH (FT): 18 SITE CHARACTERISTICS: SOFT ______________________________________________________________________ * * CALCULATED NOISE LEVELS * * CNEL AT 50 FT FROM NEAR TRAVEL LANE CENTERLINE (dB) = 65.33 DISTANCE (FEET) FROM ROADWAY CENTERLINE TO CNEL 70 CNEL 65 CNEL 60 CNEL 55 CNEL ------- ------- ------- ------- 0.0 71.3 149.7 320.5 ______________________________________________________________________

TABLE Opening Year + Project (2021) -02 FHWA ROADWAY NOISE LEVEL ANALYSIS RUN DATE: 11/04/2019 ROADWAY SEGMENT: Taft Highway - east of La Jolla Street NOTES: Karpe Development Project - Opening Year + Project (2021) ______________________________________________________________________ * * ASSUMPTIONS * * AVERAGE DAILY TRAFFIC: 10100 SPEED (MPH): 40 GRADE: .5 TRAFFIC DISTRIBUTION PERCENTAGES DAY EVENING NIGHT --- ------- ----- AUTOS 75.51 12.57 9.34 M-TRUCKS 1.56 0.09 0.19 H-TRUCKS 0.64 0.02 0.08 ACTIVE HALF-WIDTH (FT): 18 SITE CHARACTERISTICS: SOFT ______________________________________________________________________ * * CALCULATED NOISE LEVELS * * CNEL AT 50 FT FROM NEAR TRAVEL LANE CENTERLINE (dB) = 64.58 DISTANCE (FEET) FROM ROADWAY CENTERLINE TO CNEL 70 CNEL 65 CNEL 60 CNEL 55 CNEL ------- ------- ------- ------- 0.0 64.1 133.7 285.8 ______________________________________________________________________

TABLE Opening Year + Project (2021) -03 FHWA ROADWAY NOISE LEVEL ANALYSIS RUN DATE: 11/04/2019 ROADWAY SEGMENT: H Street - Taft Highway to SR 99 off ramp NOTES: Karpe Development Project - Opening Year + Project (2021) ______________________________________________________________________ * * ASSUMPTIONS * * AVERAGE DAILY TRAFFIC: 3300 SPEED (MPH): 50 GRADE: .5 TRAFFIC DISTRIBUTION PERCENTAGES DAY EVENING NIGHT --- ------- ----- AUTOS 75.51 12.57 9.34 M-TRUCKS 1.56 0.09 0.19 H-TRUCKS 0.64 0.02 0.08 ACTIVE HALF-WIDTH (FT): 6 SITE CHARACTERISTICS: SOFT ______________________________________________________________________ * * CALCULATED NOISE LEVELS * * CNEL AT 50 FT FROM NEAR TRAVEL LANE CENTERLINE (dB) = 63.22 DISTANCE (FEET) FROM ROADWAY CENTERLINE TO CNEL 70 CNEL 65 CNEL 60 CNEL 55 CNEL ------- ------- ------- ------- 0.0 0.0 91.4 196.6 ______________________________________________________________________

TABLE Opening Year + Project (2021) -04 FHWA ROADWAY NOISE LEVEL ANALYSIS RUN DATE: 11/04/2019 ROADWAY SEGMENT: H Street - south of SR 99 off ramp NOTES: Karpe Development Project - Opening Year + Project (2021) ______________________________________________________________________ * * ASSUMPTIONS * * AVERAGE DAILY TRAFFIC: 1700 SPEED (MPH): 50 GRADE: .5 TRAFFIC DISTRIBUTION PERCENTAGES DAY EVENING NIGHT --- ------- ----- AUTOS 75.51 12.57 9.34 M-TRUCKS 1.56 0.09 0.19 H-TRUCKS 0.64 0.02 0.08 ACTIVE HALF-WIDTH (FT): 18 SITE CHARACTERISTICS: SOFT ______________________________________________________________________ * * CALCULATED NOISE LEVELS * * CNEL AT 50 FT FROM NEAR TRAVEL LANE CENTERLINE (dB) = 59.27 DISTANCE (FEET) FROM ROADWAY CENTERLINE TO CNEL 70 CNEL 65 CNEL 60 CNEL 55 CNEL ------- ------- ------- ------- 0.0 0.0 61.3 127.4 ______________________________________________________________________
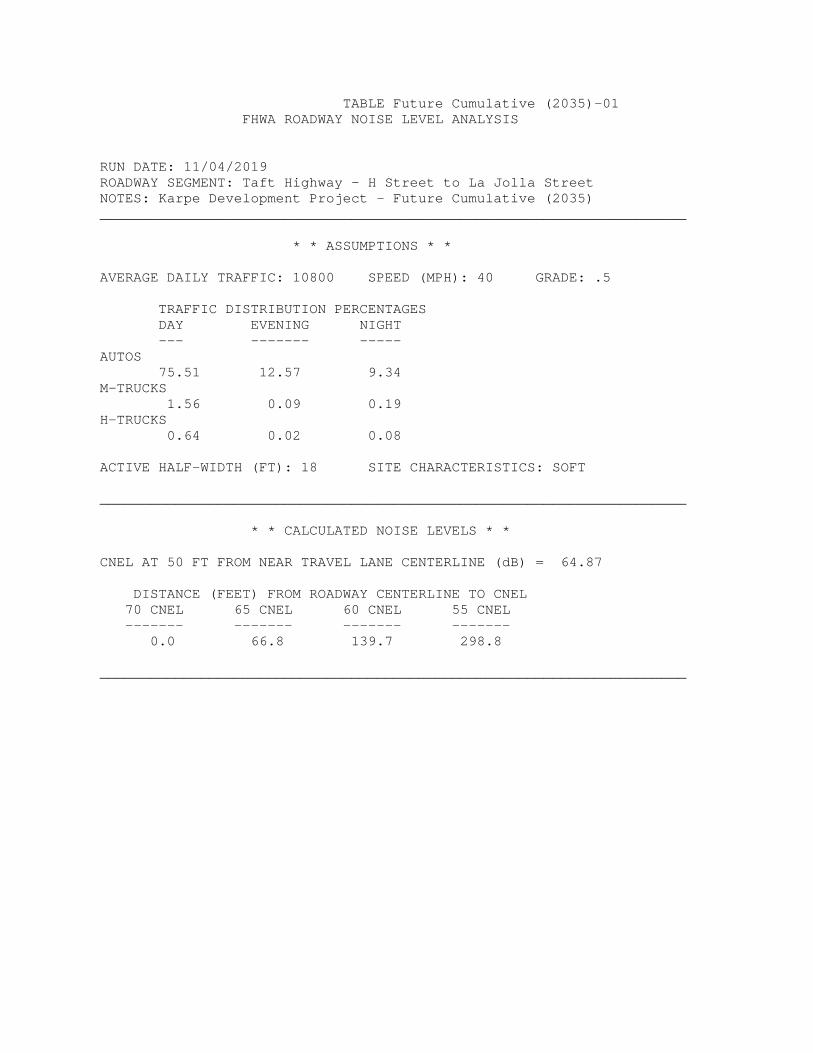
TABLE Future Cumulative (2035)-01 FHWA ROADWAY NOISE LEVEL ANALYSIS RUN DATE: 11/04/2019 ROADWAY SEGMENT: Taft Highway - H Street to La Jolla Street NOTES: Karpe Development Project - Future Cumulative (2035) ______________________________________________________________________ * * ASSUMPTIONS * * AVERAGE DAILY TRAFFIC: 10800 SPEED (MPH): 40 GRADE: .5 TRAFFIC DISTRIBUTION PERCENTAGES DAY EVENING NIGHT --- ------- ----- AUTOS 75.51 12.57 9.34 M-TRUCKS 1.56 0.09 0.19 H-TRUCKS 0.64 0.02 0.08 ACTIVE HALF-WIDTH (FT): 18 SITE CHARACTERISTICS: SOFT ______________________________________________________________________ * * CALCULATED NOISE LEVELS * * CNEL AT 50 FT FROM NEAR TRAVEL LANE CENTERLINE (dB) = 64.87 DISTANCE (FEET) FROM ROADWAY CENTERLINE TO CNEL 70 CNEL 65 CNEL 60 CNEL 55 CNEL ------- ------- ------- ------- 0.0 66.8 139.7 298.8 ______________________________________________________________________

TABLE Future Cumulative (2035)-02 FHWA ROADWAY NOISE LEVEL ANALYSIS RUN DATE: 11/04/2019 ROADWAY SEGMENT: Taft Highway - east of La Jolla Street NOTES: Karpe Development Project - Future Cumulative (2035) ______________________________________________________________________ * * ASSUMPTIONS * * AVERAGE DAILY TRAFFIC: 10300 SPEED (MPH): 40 GRADE: .5 TRAFFIC DISTRIBUTION PERCENTAGES DAY EVENING NIGHT --- ------- ----- AUTOS 75.51 12.57 9.34 M-TRUCKS 1.56 0.09 0.19 H-TRUCKS 0.64 0.02 0.08 ACTIVE HALF-WIDTH (FT): 18 SITE CHARACTERISTICS: SOFT ______________________________________________________________________ * * CALCULATED NOISE LEVELS * * CNEL AT 50 FT FROM NEAR TRAVEL LANE CENTERLINE (dB) = 64.67 DISTANCE (FEET) FROM ROADWAY CENTERLINE TO CNEL 70 CNEL 65 CNEL 60 CNEL 55 CNEL ------- ------- ------- ------- 0.0 64.8 135.4 289.6 ______________________________________________________________________

TABLE Future Cumulative (2035)-03 FHWA ROADWAY NOISE LEVEL ANALYSIS RUN DATE: 11/04/2019 ROADWAY SEGMENT: H Street - Taft Highway to SR 99 off ramp NOTES: Karpe Development Project - Future Cumulative (2035) ______________________________________________________________________ * * ASSUMPTIONS * * AVERAGE DAILY TRAFFIC: 3000 SPEED (MPH): 50 GRADE: .5 TRAFFIC DISTRIBUTION PERCENTAGES DAY EVENING NIGHT --- ------- ----- AUTOS 75.51 12.57 9.34 M-TRUCKS 1.56 0.09 0.19 H-TRUCKS 0.64 0.02 0.08 ACTIVE HALF-WIDTH (FT): 6 SITE CHARACTERISTICS: SOFT ______________________________________________________________________ * * CALCULATED NOISE LEVELS * * CNEL AT 50 FT FROM NEAR TRAVEL LANE CENTERLINE (dB) = 62.81 DISTANCE (FEET) FROM ROADWAY CENTERLINE TO CNEL 70 CNEL 65 CNEL 60 CNEL 55 CNEL ------- ------- ------- ------- 0.0 0.0 85.8 184.5 ______________________________________________________________________

TABLE Future Cumulative (2035)-04 FHWA ROADWAY NOISE LEVEL ANALYSIS RUN DATE: 11/04/2019 ROADWAY SEGMENT: H Street - south of SR 99 off ramp NOTES: Karpe Development Project - Future Cumulative (2035) ______________________________________________________________________ * * ASSUMPTIONS * * AVERAGE DAILY TRAFFIC: 1800 SPEED (MPH): 50 GRADE: .5 TRAFFIC DISTRIBUTION PERCENTAGES DAY EVENING NIGHT --- ------- ----- AUTOS 75.51 12.57 9.34 M-TRUCKS 1.56 0.09 0.19 H-TRUCKS 0.64 0.02 0.08 ACTIVE HALF-WIDTH (FT): 18 SITE CHARACTERISTICS: SOFT ______________________________________________________________________ * * CALCULATED NOISE LEVELS * * CNEL AT 50 FT FROM NEAR TRAVEL LANE CENTERLINE (dB) = 59.51 DISTANCE (FEET) FROM ROADWAY CENTERLINE TO CNEL 70 CNEL 65 CNEL 60 CNEL 55 CNEL ------- ------- ------- ------- 0.0 0.0 63.4 132.3 ______________________________________________________________________

TABLE Future Cumulative + Project (2035)-01 FHWA ROADWAY NOISE LEVEL ANALYSIS RUN DATE: 11/04/2019 ROADWAY SEGMENT: Taft Highway - H Street to La Jolla Street NOTES: Karpe Development Project - Future Cumulative + Project (2035) ______________________________________________________________________ * * ASSUMPTIONS * * AVERAGE DAILY TRAFFIC: 12700 SPEED (MPH): 40 GRADE: .5 TRAFFIC DISTRIBUTION PERCENTAGES DAY EVENING NIGHT --- ------- ----- AUTOS 75.51 12.57 9.34 M-TRUCKS 1.56 0.09 0.19 H-TRUCKS 0.64 0.02 0.08 ACTIVE HALF-WIDTH (FT): 18 SITE CHARACTERISTICS: SOFT ______________________________________________________________________ * * CALCULATED NOISE LEVELS * * CNEL AT 50 FT FROM NEAR TRAVEL LANE CENTERLINE (dB) = 65.58 DISTANCE (FEET) FROM ROADWAY CENTERLINE TO CNEL 70 CNEL 65 CNEL 60 CNEL 55 CNEL ------- ------- ------- ------- 0.0 73.9 155.3 332.8 ______________________________________________________________________

TABLE Future Cumulative + Project (2035)-02 FHWA ROADWAY NOISE LEVEL ANALYSIS RUN DATE: 11/04/2019 ROADWAY SEGMENT: Taft Highway - east of La Jolla Street NOTES: Karpe Development Project - Future Cumulative + Project (2035) ______________________________________________________________________ * * ASSUMPTIONS * * AVERAGE DAILY TRAFFIC: 10800 SPEED (MPH): 40 GRADE: .5 TRAFFIC DISTRIBUTION PERCENTAGES DAY EVENING NIGHT --- ------- ----- AUTOS 75.51 12.57 9.34 M-TRUCKS 1.56 0.09 0.19 H-TRUCKS 0.64 0.02 0.08 ACTIVE HALF-WIDTH (FT): 18 SITE CHARACTERISTICS: SOFT ______________________________________________________________________ * * CALCULATED NOISE LEVELS * * CNEL AT 50 FT FROM NEAR TRAVEL LANE CENTERLINE (dB) = 64.87 DISTANCE (FEET) FROM ROADWAY CENTERLINE TO CNEL 70 CNEL 65 CNEL 60 CNEL 55 CNEL ------- ------- ------- ------- 0.0 66.8 139.7 298.8 ______________________________________________________________________
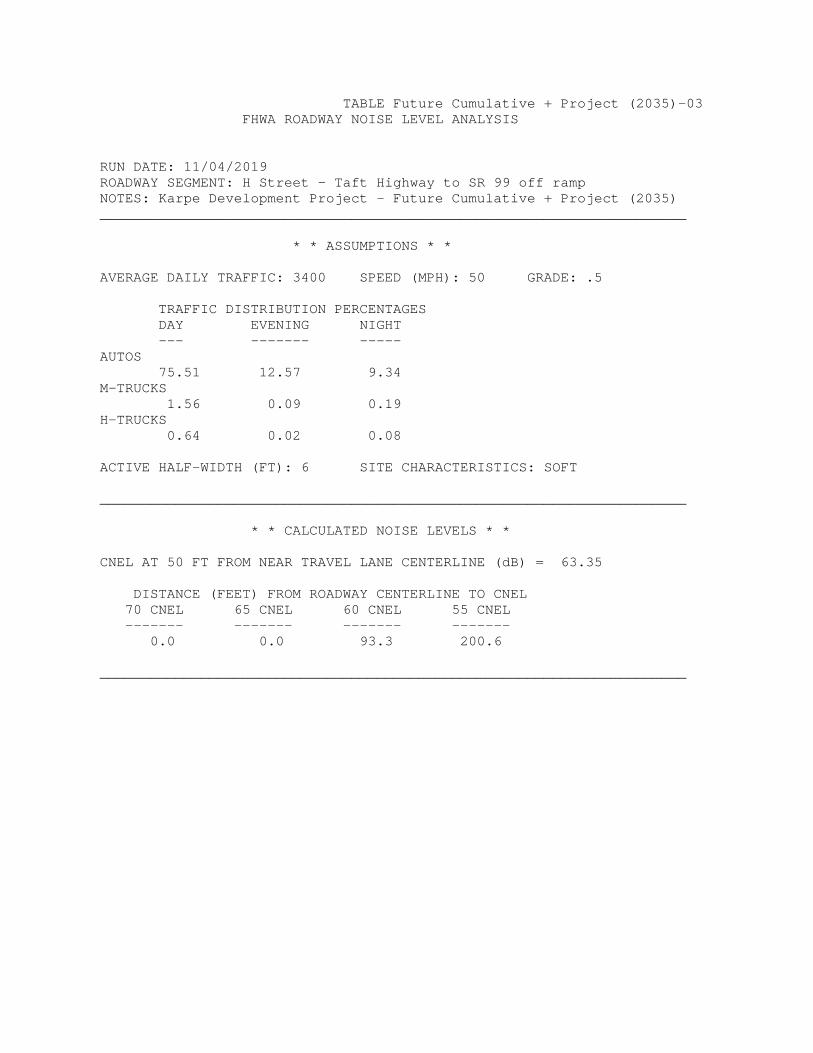
TABLE Future Cumulative + Project (2035)-03 FHWA ROADWAY NOISE LEVEL ANALYSIS RUN DATE: 11/04/2019 ROADWAY SEGMENT: H Street - Taft Highway to SR 99 off ramp NOTES: Karpe Development Project - Future Cumulative + Project (2035) ______________________________________________________________________ * * ASSUMPTIONS * * AVERAGE DAILY TRAFFIC: 3400 SPEED (MPH): 50 GRADE: .5 TRAFFIC DISTRIBUTION PERCENTAGES DAY EVENING NIGHT --- ------- ----- AUTOS 75.51 12.57 9.34 M-TRUCKS 1.56 0.09 0.19 H-TRUCKS 0.64 0.02 0.08 ACTIVE HALF-WIDTH (FT): 6 SITE CHARACTERISTICS: SOFT ______________________________________________________________________ * * CALCULATED NOISE LEVELS * * CNEL AT 50 FT FROM NEAR TRAVEL LANE CENTERLINE (dB) = 63.35 DISTANCE (FEET) FROM ROADWAY CENTERLINE TO CNEL 70 CNEL 65 CNEL 60 CNEL 55 CNEL ------- ------- ------- ------- 0.0 0.0 93.3 200.6 ______________________________________________________________________

TABLE Future Cumulative + Project (2035)-04 FHWA ROADWAY NOISE LEVEL ANALYSIS RUN DATE: 11/04/2019 ROADWAY SEGMENT: H Street - south of SR 99 off ramp NOTES: Karpe Development Project - Future Cumulative + Project (2035) ______________________________________________________________________ * * ASSUMPTIONS * * AVERAGE DAILY TRAFFIC: 1800 SPEED (MPH): 50 GRADE: .5 TRAFFIC DISTRIBUTION PERCENTAGES DAY EVENING NIGHT --- ------- ----- AUTOS 75.51 12.57 9.34 M-TRUCKS 1.56 0.09 0.19 H-TRUCKS 0.64 0.02 0.08 ACTIVE HALF-WIDTH (FT): 18 SITE CHARACTERISTICS: SOFT ______________________________________________________________________ * * CALCULATED NOISE LEVELS * * CNEL AT 50 FT FROM NEAR TRAVEL LANE CENTERLINE (dB) = 59.51 DISTANCE (FEET) FROM ROADWAY CENTERLINE TO CNEL 70 CNEL 65 CNEL 60 CNEL 55 CNEL ------- ------- ------- ------- 0.0 0.0 63.4 132.3 ______________________________________________________________________


Parking Lot activityReceptor: Hypothetical Noise Level Calculation Prior to Implementation of Noise Attenuation Requirements
No. Equipment Description Lmax Lmax Leq1 parking lot activity(6 stalls nearest southeast corner) 70 6 1 350 0.5 0 53.1 36.7 4628.1364042 parking lot activity (next 6 stalls farther to the west) 70 6 1 358 0.5 0 52.9 36.4 4373.8984393 parking lot activity (next 6 stalls farther to the west) 70 6 1 395 0.5 0 52.0 35.3 3420.452173
4parking lot activity (6 stalls north of southeast corner)
70 6 1 443 0.5 0 51.1 34.1 2567.8340045678910
Notes: Lmax* 53.0 Leq 42*Calculated Lmax is the Loudest value.** Percentage of time per hour of a parking eventMeasured to center point of each group of 6 parking stallsShielding accounts for fence and vegetation shielding
Shielding (dBA)
Calculated (dBA)Energy
Reference (dBA) 50 ft
QuantityUsage
factor**Distance to Receptor
Ground Effect

Generator/Air Compresor Operational Noise CalculationReceptor: Hypothetical Noise Level Calculation Prior to Implementation of Noise Attenuation Requirements
No. Equipment Description Lmax Lmax Leq1 generator/air compressor 82 4 40 565 0.5 13 47.9 44.7 29609.009132345678910
Notes: Lmax* 48 Leq 45*Calculated Lmax is the Loudest value.** Percentage of time during a construction noise operation that a piece of equipment is operating at full power
Shielding (dBA)
Calculated (dBA)Energy
Reference (dBA) 50 ft
QuantityUsage
factor**Distance to Receptor
Ground Effect

THIS PAGE INTENTIONALLY LEFT BLANK