3. demand forecasts
TRANSCRIPT
70
3. DEMAND FORECASTS
This section documents Umgeni Water’s water demand forecast review that was completed in September 2015. The review process:
Reviewed the figures for the financial year ending in June 2015 (2014/2015).
Assessed and revised the short-term forecast for the financial year ending in June 2016 (2015/2016);
Compiled short-term forecasts for the financial years ending in June 2017 (2016/2017), June 2018 (2017/2018) and June 2019 (2018/2019); and
Extended these short-term forecasts to a long-term forecast (30-year forecast) to the end of June 2046 (2045/2046)
All data presented has been updated to include the November 2015 sales figures and all statistics and trends have been based on the moving annual average and year-on-year growth figures as determined at 30 November 2015.
3.1 Review of 2014/15 Sales The initial forecasted water sales value for the financial year ending in June 2015 (2014/15), as determined in September 2013, was 1173 Mℓ/day. In September 2014 this figure was revised to 1229 Mℓ/day after updated discussions with customers. Total sales recorded for the 2014/15 financial year averaged 1 225 Mℓ/day (447 121 Mℓ). This was significantly higher (4.4%) than the September 2013 projection but only 0.3% lower than the September 2014 projection. Total average water sales for the 2013/14 financial year was 1 206 Mℓ/day, and hence the 2014/15 sales are 1.6% year-on-year higher than the 2013/14 financial year. This is close to the long term growth of 1.5% which is applied to the thirty year forecast but less than the 4.3% growth that was realized in the previous financial year. The 4.3% growth experienced in 2013/2014 was considered exceptionally high and was as a result of decreased water demand management initiatives being implemented by eThekwini Metro. The current 1.6% growth is considered reasonable and in line with projections. Figure 3.1 shows the 12-month moving average of Umgeni Water’s total average daily water sales for the past 10 years. Bulk water sales to eThekwini Municipality constituted by far the largest percentage (74.2%) of Umgeni Water’s total water sales for 2014/15. Their proportion of the total sales has decreased slightly from the previous year (74.4%), due primarily to increased demands from Ugu and Msunduzi municipalities. The Msunduzi Municipality is Umgeni Water’s second largest customer, accounting for 15.7% of the organisation’s total sales. The remaining customers make up the balance of the sales. Figure 3.2 illustrates the average daily sales volume distribution per customer for the financial year 2014/15.

71
Figure 3.1 Umgeni Water Total Average Daily Sales.
Figure 3.2 Distribution of Sales Volumes for 2014/2015.

72
3.2 2015 Short-Term Bulk Water Sales Forecasts Umgeni Water’s customers project relatively strong growth in demands over the next few years. Some of this growth will, however, be tempered by water demand management initiatives that are and will be implemented by the Municipalities. The Umgeni Water short term bulk water sales forecast for 2015/2016 and 2016/2017 is estimated to be 1242 Mℓ/day and 1284 Mℓ/day, respectively (Figure 3.3). This represents a 1.4% year-on-year increase in growth from 2014/2015, which is again primarily determined by the forecast provided by eThekwini Municipality.
Figure 3.3 Total Average Daily Sales Volumes - Annual short-term forecast comparison.
3.2.1 eThekwini Municipality
In the 2014/2015 financial year, the year-on-year growth in sales to eThekwini Municipality increased marginally by 0.9%. Delays with both the northern and western aqueduct projects in 2015 resulted in the predicted substantial growth not materialising in the northern eThekwini area with the proposed development of formal housing projects and the industrial development of the Dube Trade Port. This is shown in Figure 3.4, where the twelve-month moving average of sales only increased from 900 Mℓ/day in July 2014 to 908 Mℓ/day in June 2015. eThekwini Municipality do not believe that their water demand management initiatives will further reduce their sales in the short term when compared against the natural growth and have predicted an increase in demand from 908 Mℓ/day to 923 Mℓ/day over the 2015/2016 financial year and to

73
939 Mℓ/day in 2016/2017 (pre-drought projection). The historical sales and future demand projection for eThekwini Municipality are presented in Figure 3.4. eThekwini Municipality have predicted an increased demand from the Hazelmere WTP, due to proposed development on the KwaZulu-Natal North Coast. At present this demand has been shifted to the Durban Heights WTP to minimise the overall demand on Hazelmere Dam as a result of the drought conditions currently being experienced. This load shift could be placed back on Hazelmere WTP once the Lower Thukela Bulk Water Supply Scheme is commissioned mid-2016.
Figure 3.4 eThekwini Municipality Total Volumes - Annual short-term forecast.
3.2.2 The Msunduzi Municipality
The water sales to Msunduzi Municipality increased by 7.6% from 182 Mℓ/day in the 2013/2014 financial year to 197 Mℓ/day in 2014/2015.
The projected demands for 2015/2016 (pre-drought projection) were determined in consultation with the municipality and it was agreed that the demand will increase at a rate of 2% for the short term forecast. The following factors influenced this short term forecast:
There are developments for medium to low cost housing that will result in an increase in demand within the Vulindlela areas.
74
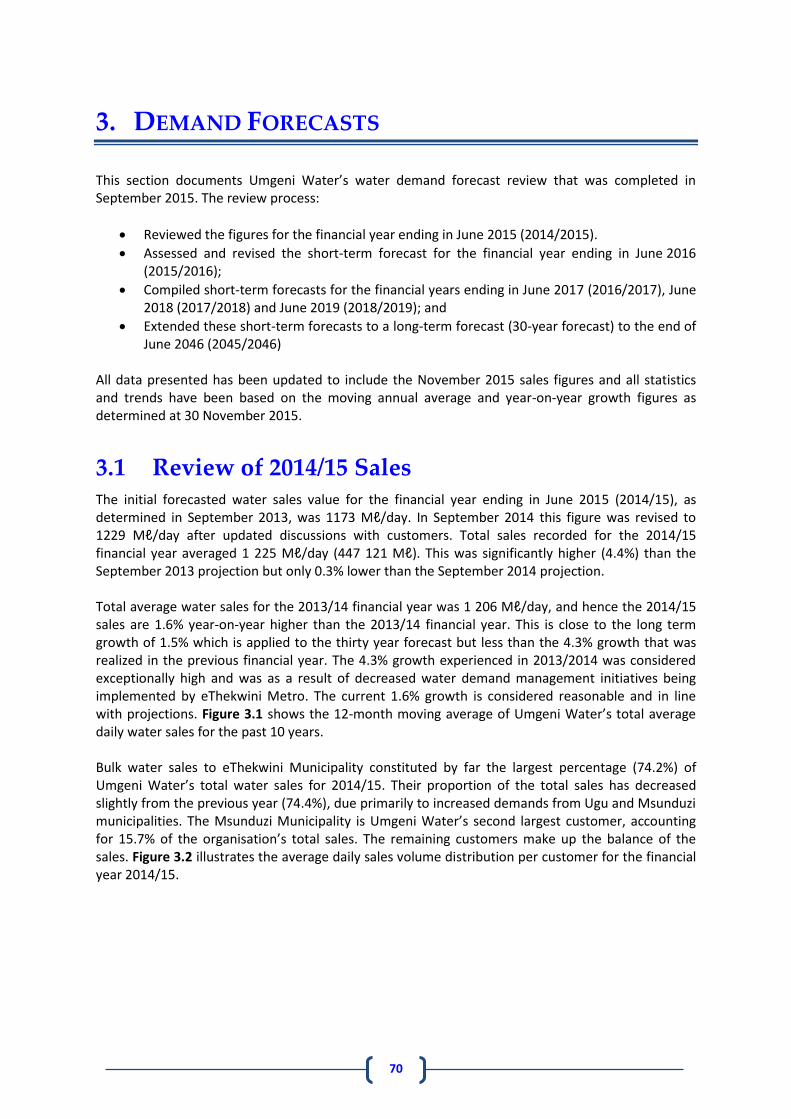
The Msunduzi Municipality is implementing water demand management (WDM) initiatives within the Vulindlela area. It is estimated that savings from these initiatives will offset the growth in sales in the near future for the area. The projection for Msunduzi Municipality is reflected in Figure 3.5
3.2.3 Umgungundlovu District Municipality
The water sales to Umgungundlovu District Municipality increased from 41 Mℓ/day in the 2014/2015 financial year to 45 Mℓ/day in 2015/2016. The projected demands for 2015/2016 were determined in consultation with the municipality and it was agreed that the demand would increase at a rate of 2% for the short term forecast. The expected demand for 2016/2017 is 48 Mℓ/day and in 2017/2018 a projected amount of 51 Mℓ/day. The following significant factors influenced this short term forecast:
Gradual implementation of the Greater Eston Bulk Water Supply Scheme.
Khayelisha housing development.
Richmond Demands.
Expected commercial and industrial growth in Camperdown. The stepped forecast represents sales for the Richmond area. The projection for Umgungundlovu District Municipality is reflected in Figure 3.6.
Figure 3.5 Msunduzi Municipality Total Sales Volumes - Annual short-term forecast.

75
3.2.4 iLembe District Municipality (including Sembcorp Siza
Water)
Sales to Ilembe District Municipality can be described as follows:
Sales to the Coastal Area of iLembe through Sembcorp Siza Water.
Sales to the Coastal Area of iLembe through Ilembe District Municipality.
Sales to iLembe District Municipality through schemes owned by the municipality and managed by Umgeni Water.
Due to the drought conditions that currently prevail over this region, mandatory restrictions are being implemented. As a result, demand in the latter half 2015 and the early periods of 2016 (up to the writing of this report) has been restricted to 40% of the three month average demand up to August 2014. The Lower Thukela Bulk Water Supply Scheme will be commissioned in April / May 2016 and, following this, it is likely that these restrictions might be relaxed. Once restrictions are lifted, it is anticipated that demand will reach the pre-drought demands over the period of one year and thereafter organic growth of about 2%, to existing supply areas, is expected. The demand for Sembcorp Siza Water is expected to be 9.4 Mℓ/day in 2015/2016, 11.5 Mℓ/day in 2016/2017 and 13.4 Mℓ/day in 2017/2018. The historical and future predicted increase in demand for Sembcorp Siza Water is presented in Figure 3.7.
Figure 3.6 Umgungungdlovu District Municipality Total Sales Volumes - Annual short-term forecast.

76
Figure 3.7 Siza Water Total Sales Volumes - Annual short-term forecast.
The demand for iLembe District Municipality is expected to be 30.97 Mℓ/day in 2015/2016, 44.9 Mℓ/day in 2016/2017 and 48.7 Mℓ/day in 2017/2018. The historical and future predicted increase in demand for iLembe District Municipality is presented in Figure 3.8.

77
Figure 3.8 iLembe District Municipality Total Sales Volumes - Annual short-term forecast.
3.2.5 Ugu District Municipality
Total sales to the Ugu District Municipality increased marginally during 2015 as sales were affected by the drought experienced during the 2014/2015 financial year, in which the EJ Smith Dam water level reached dead storage on 5th September 2014. Sales recovered showing a small increase of 2.0% (27.4 Mℓ/day to 27.9Mℓ/day) during the financial year. The expected growth in sales to the Ugu District Municipality (as confirmed by them) is estimated at 2.2% in the 2015/2016 financial year and 7.4% in 2016/2017 (Figure 3.9). Ugu District Municipality ratified growth of sales to the Middle South Coast following the commissioning of the South Coast Pipeline (SCP-2a). The full potential will be available once the Phase 2b is commissioned (refer to Section 7). This expected growth is a result of Ugu District Municipality’s proposed initiatives towards the reduction of backlogs, specifically in water sales in the inland rural areas of the municipality; i.e. the recently commissioned Mhlbatshane BWSS Phase 1. Ugu District Municipality has embarked on a number of water demand management initiatives. However, these are mainly in the Lower South Coast region area of supply and hence these are not expected to have a major impact on projected water demand growth rates.

78
Figure 3.9 Ugu District Municipality Total Sales Volumes - Annual short-term forecast.
3.2.6 Harry Gwala District Municipality
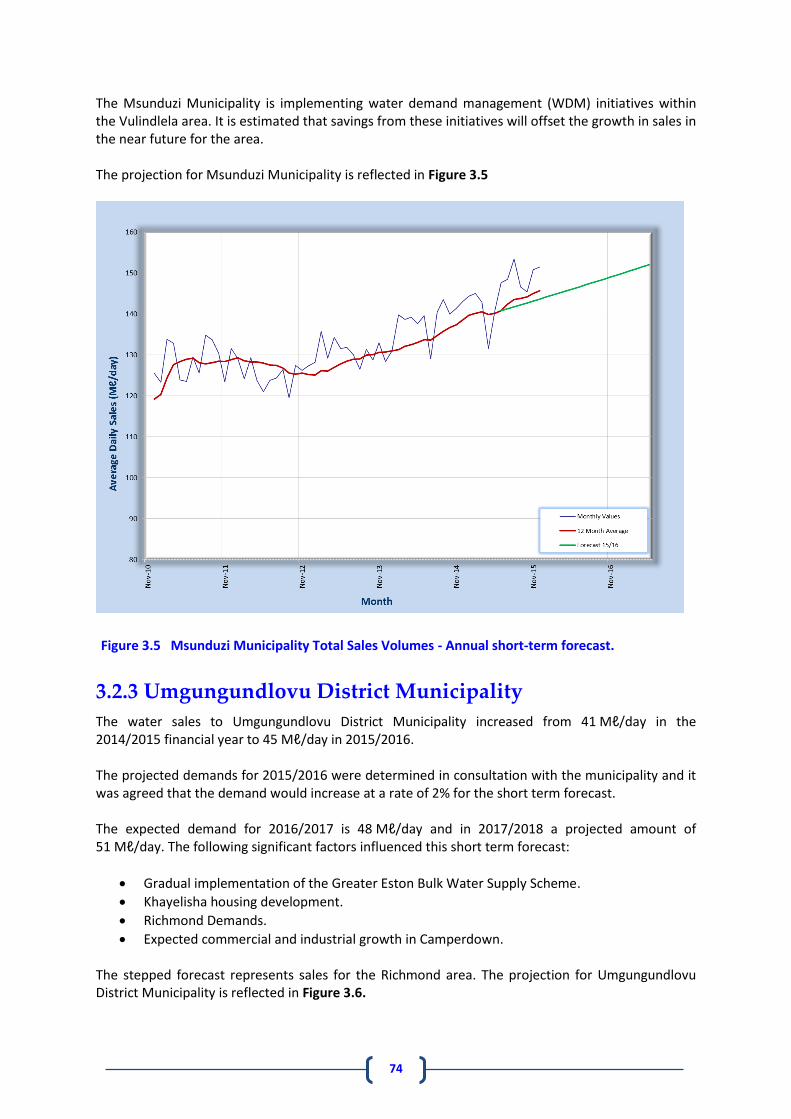
The Ixopo WTP supplies the Greater Ixopo area. Average daily sales from the WTP currently amount to approximately 2.3 Mℓ/day. There has been a slight decrease in the monthly sales from July 2014 to June 2015, mainly due to water demand initiatives implemented by the district municipality. Following this period drought interventions were put into place that reduced the supply to 1.2 Mℓ/day i.e. 50% of the normal supply. Discussions with the municipality resulted in the demand projection for Harry Gwala District Municipality being set at a 0% (Figure 3.10). This will continue throughout the drought period and will gradually return to the normal demand value and thereafter the projection will be revised.
79
Figure 3.10 Harry Gwala District Municipality Total Sales Volumes - Annual short-term forecast
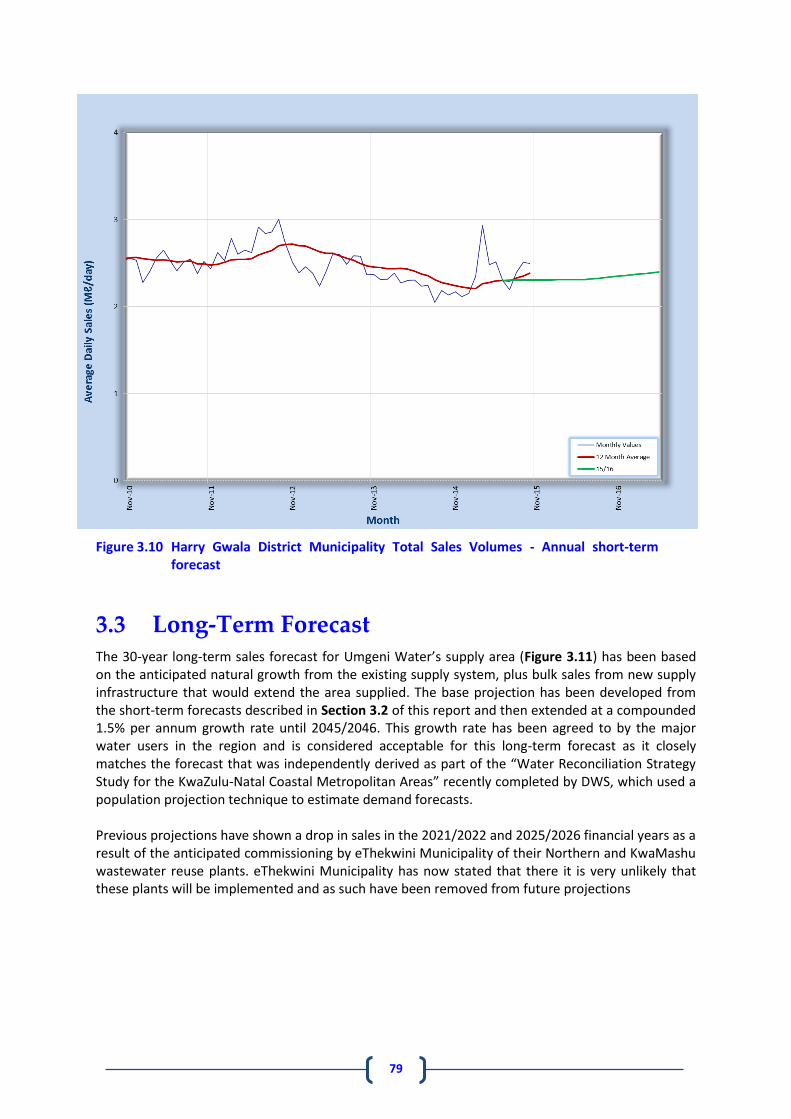
3.3 Long-Term Forecast The 30-year long-term sales forecast for Umgeni Water’s supply area (Figure 3.11) has been based on the anticipated natural growth from the existing supply system, plus bulk sales from new supply infrastructure that would extend the area supplied. The base projection has been developed from the short-term forecasts described in Section 3.2 of this report and then extended at a compounded 1.5% per annum growth rate until 2045/2046. This growth rate has been agreed to by the major water users in the region and is considered acceptable for this long-term forecast as it closely matches the forecast that was independently derived as part of the “Water Reconciliation Strategy Study for the KwaZulu-Natal Coastal Metropolitan Areas” recently completed by DWS, which used a population projection technique to estimate demand forecasts. Previous projections have shown a drop in sales in the 2021/2022 and 2025/2026 financial years as a result of the anticipated commissioning by eThekwini Municipality of their Northern and KwaMashu wastewater reuse plants. eThekwini Municipality has now stated that there it is very unlikely that these plants will be implemented and as such have been removed from future projections
80
Figure 3.11 Umgeni Water Long-Term Bulk Water Sales Forecast.
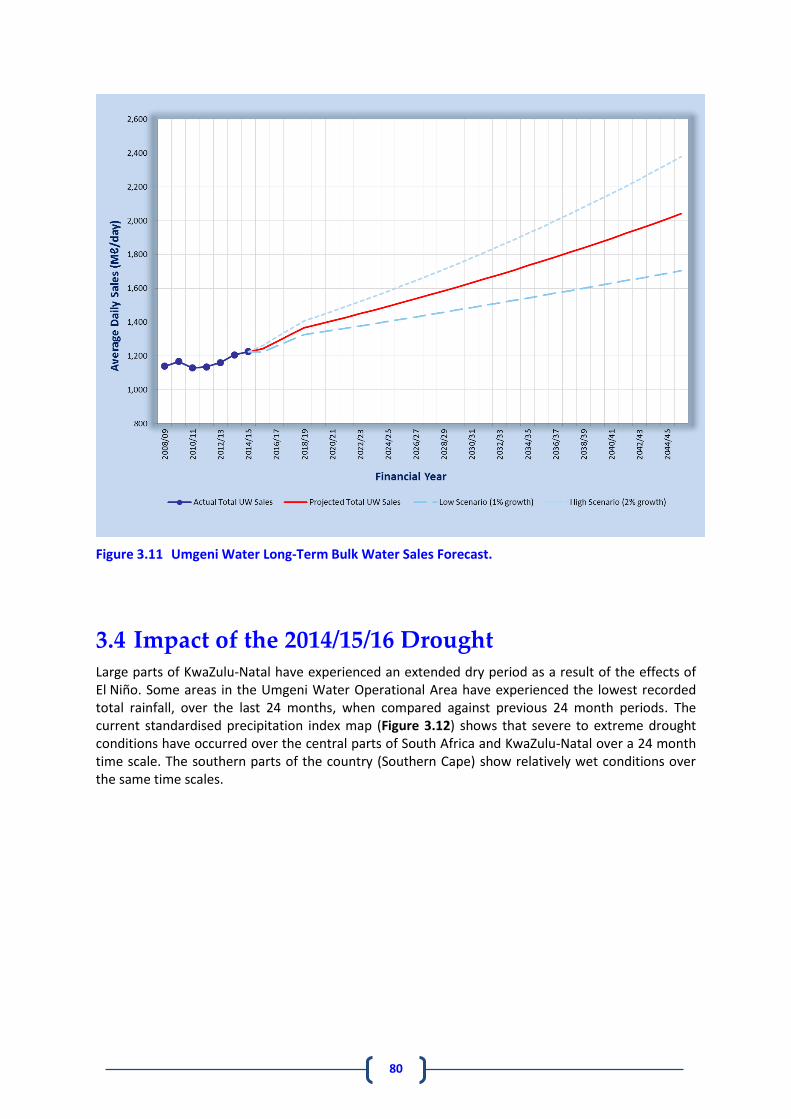
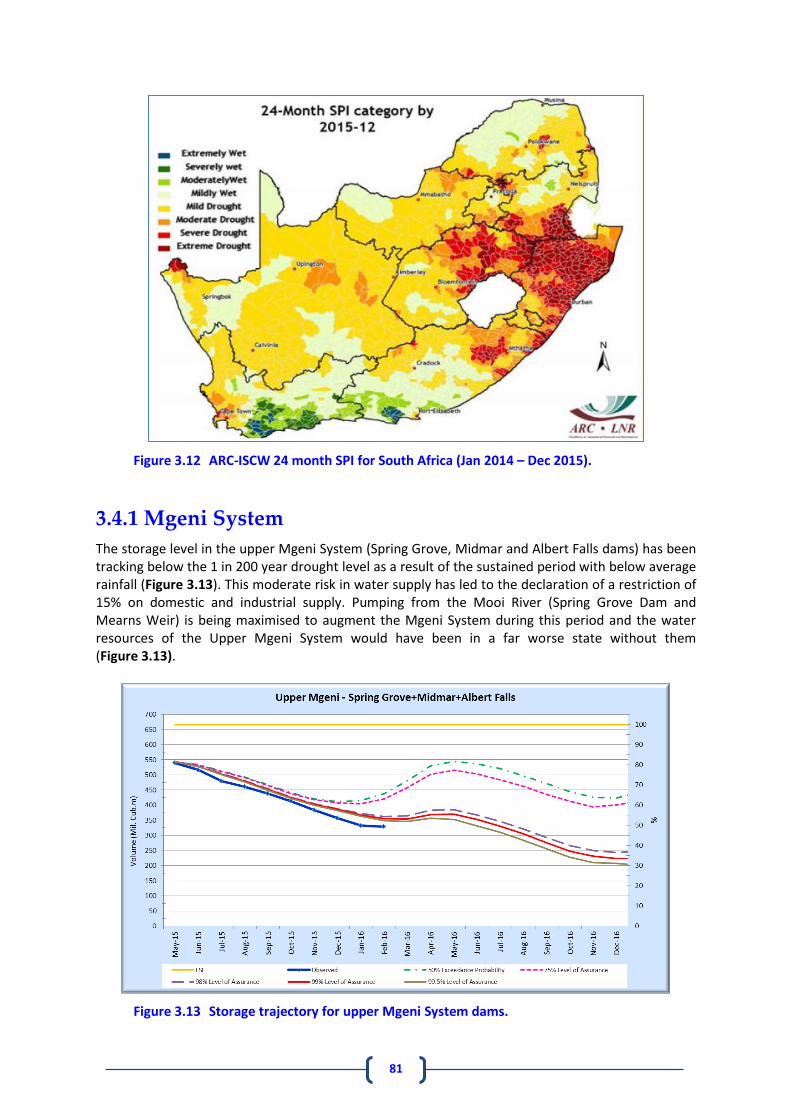
3.4 Impact of the 2014/15/16 Drought Large parts of KwaZulu-Natal have experienced an extended dry period as a result of the effects of El Niño. Some areas in the Umgeni Water Operational Area have experienced the lowest recorded total rainfall, over the last 24 months, when compared against previous 24 month periods. The current standardised precipitation index map (Figure 3.12) shows that severe to extreme drought conditions have occurred over the central parts of South Africa and KwaZulu-Natal over a 24 month time scale. The southern parts of the country (Southern Cape) show relatively wet conditions over the same time scales.
81
Figure 3.12 ARC-ISCW 24 month SPI for South Africa (Jan 2014 – Dec 2015).
3.4.1 Mgeni System
The storage level in the upper Mgeni System (Spring Grove, Midmar and Albert Falls dams) has been tracking below the 1 in 200 year drought level as a result of the sustained period with below average rainfall (Figure 3.13). This moderate risk in water supply has led to the declaration of a restriction of 15% on domestic and industrial supply. Pumping from the Mooi River (Spring Grove Dam and Mearns Weir) is being maximised to augment the Mgeni System during this period and the water resources of the Upper Mgeni System would have been in a far worse state without them (Figure 3.13).
Figure 3.13 Storage trajectory for upper Mgeni System dams.

82
The storage level in the Lower Mgeni System (Inanda Dam) is not expected to fall to concerning levels over the forthcoming months (Figure 3.14). Pumping from Inanda Dam to Durban Heights WTP is being maximised reduce the need from Albert Falls Dam. This pumping has recently been increased to 200Mℓ/d (January 2016). The current level at Inanda Dam indicates that the water resource situation is acceptable whilst the level of the upper Mgeni dams is concerning.
Figure 3.14 Storage trajectory for Inanda Dam.
Drought mitigation measures
The impact of pumping from Mooi River and Inanda Dam is depicted by Figure 3.15 and Figure 3.16. The benefit of pumping from the Mooi River during the 2014/15 to 2015/16 period is shown in Figure 3.15 where it is evident that the level of Midmar Dam would have been at approximately 15% had pumping not taken place.
Figure 3.15 Benefit of pumping from the Mearns Weir (Mooi River) to support Midmar Dam.
83
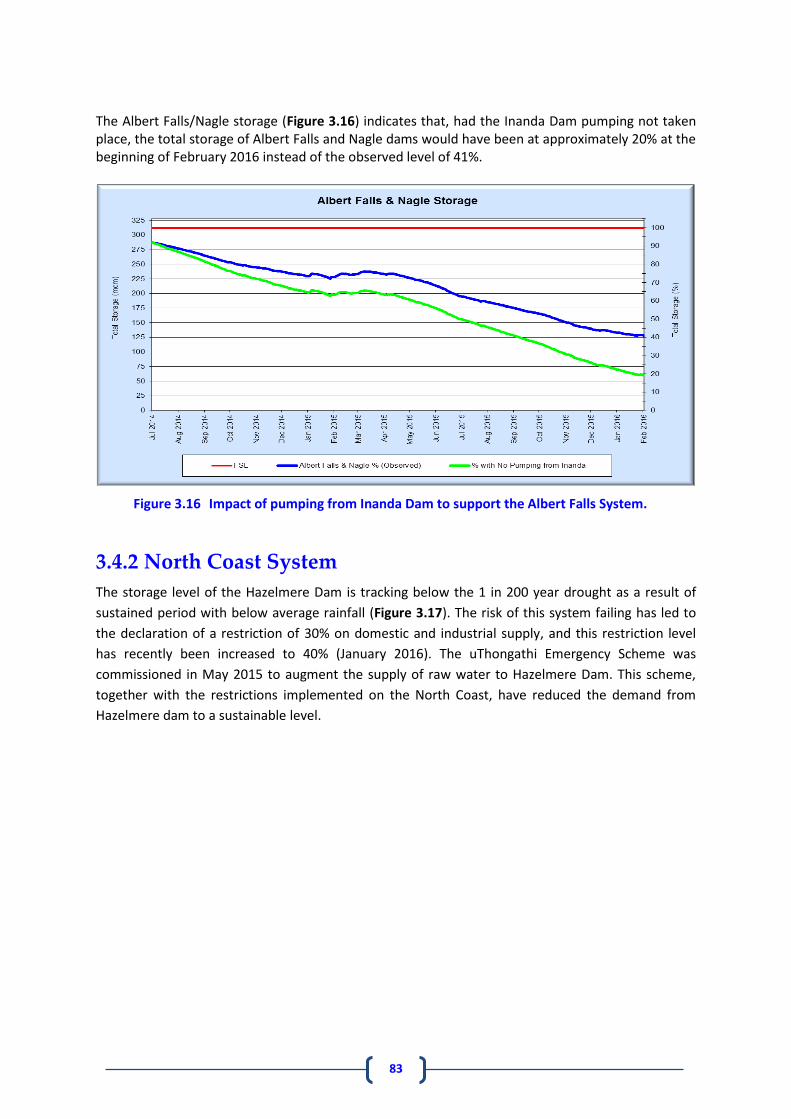
The Albert Falls/Nagle storage (Figure 3.16) indicates that, had the Inanda Dam pumping not taken place, the total storage of Albert Falls and Nagle dams would have been at approximately 20% at the beginning of February 2016 instead of the observed level of 41%.
Figure 3.16 Impact of pumping from Inanda Dam to support the Albert Falls System.
3.4.2 North Coast System
The storage level of the Hazelmere Dam is tracking below the 1 in 200 year drought as a result of
sustained period with below average rainfall (Figure 3.17). The risk of this system failing has led to
the declaration of a restriction of 30% on domestic and industrial supply, and this restriction level
has recently been increased to 40% (January 2016). The uThongathi Emergency Scheme was
commissioned in May 2015 to augment the supply of raw water to Hazelmere Dam. This scheme,
together with the restrictions implemented on the North Coast, have reduced the demand from
Hazelmere dam to a sustainable level.

84
Figure 3.17 Storage trajectory for current Hazelmere Dam with restrictions.
Drought mitigation measures
The benefit of pumping from the uThongathi River together with the implementation of mandatory restrictions is depicted in Figure 3.18. Had the pumping and restrictions not taken place, then the Hazelmere Dam level would have been below 15% at the beginning of February 2016 instead of at the observed level of 35% at the same time. Had restrictions alone taken place then the level of the dam would have been at approximately 27% at the beginning of February 2016. Had pumping alone taken place then the level of the dam would have been at approximately 23% at the beginning of February 2016. It is clear from Figure 3.18 that, had these two interventions not been implemented, then Hazelmere Dam would have reached dead storage (15%) in October 2015.
Figure 3.18 Benefit of both pumping from the uThongathi River and restrictions on Hazelmere Dam storage.

85
3.4.3 Middle South System
The storage level of the Middle South System (Umzinto and EJ Smith dams) improved in December 2015 and started tracking above the 1 in 50 year drought occurrence interval as a result of rains and pumping from Mpambanyoni Emergency Scheme (Figure 3.19). The improvement in storage has minimised the risk of non-supply of water in the area.
Figure 3.19 Storage trajectory for both Umzinto and EJ Smith dams.
Drought mitigation measures
The benefit of pumping from the Mpambanyoni River into EJ Smith Dam is shown in Figure 3.20. It shows the positive effect that it has had on the level of EJ Smith Dam. Had this pumping not taken place, then EJ Smith Dam would have failed in July and December 2015 and again in January 2016.
86
Figure 3.20 Impact of pumping from the Mpambanyoni River on EJ Smith Dam.
3.4.4 Ixopo System
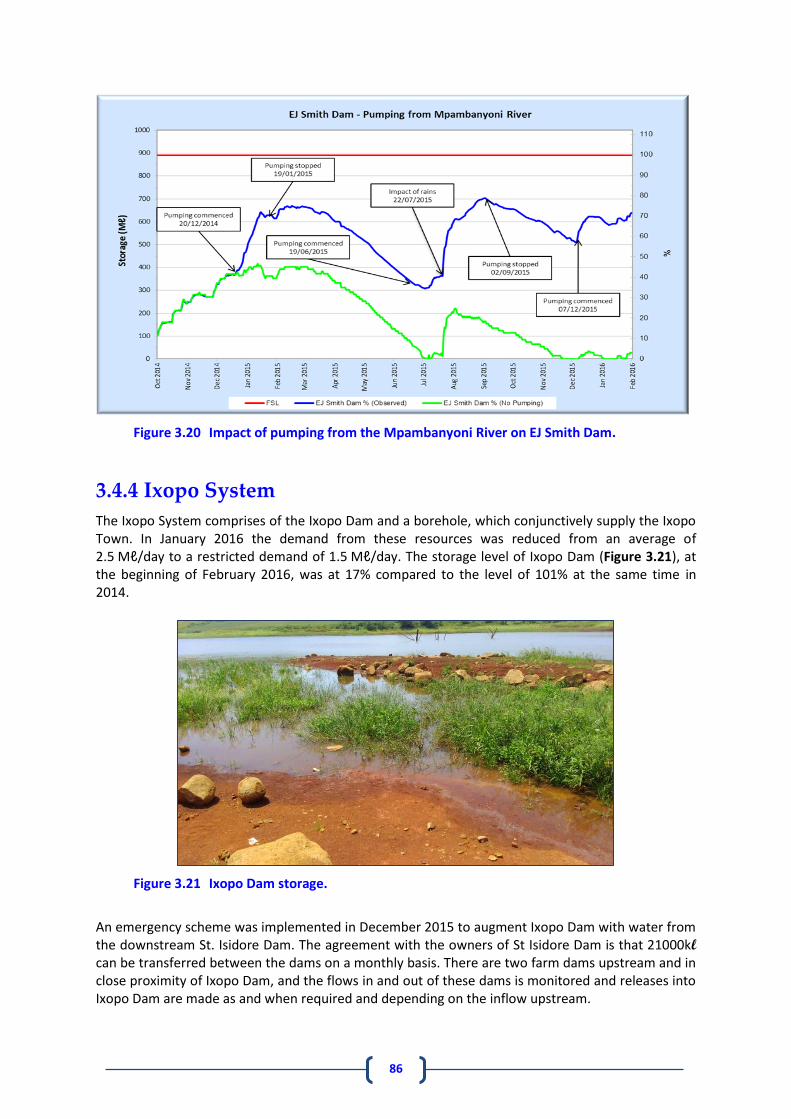
The Ixopo System comprises of the Ixopo Dam and a borehole, which conjunctively supply the Ixopo Town. In January 2016 the demand from these resources was reduced from an average of 2.5 Mℓ/day to a restricted demand of 1.5 Mℓ/day. The storage level of Ixopo Dam (Figure 3.21), at the beginning of February 2016, was at 17% compared to the level of 101% at the same time in 2014.
Figure 3.21 Ixopo Dam storage.
An emergency scheme was implemented in December 2015 to augment Ixopo Dam with water from the downstream St. Isidore Dam. The agreement with the owners of St Isidore Dam is that 21000kl can be transferred between the dams on a monthly basis. There are two farm dams upstream and in close proximity of Ixopo Dam, and the flows in and out of these dams is monitored and releases into Ixopo Dam are made as and when required and depending on the inflow upstream.

87
To ensure a more accurate flow reading upstream of the farmer’s dam, Umgeni Water, together with the Department of Water and Sanitation, is currently planning to construct a permanent concrete gauging weir upstream of the top farm dam.