aviation demand forecasts - johnson county kansas · of changes in uncertain factors affecting...
TRANSCRIPT

Chapter Two
2-1
Facility planning must begin with a definition of the demand that may reasonably be expected to occur at the facility over a specific period of time. For Johnson County Executive Airport (OJC), this involves forecasts of aviation activity indicators through the year 2025. In this master plan, forecasts of based aircraft, based aircraft fleet mix, annual aircraft operations, and operational peak periods will serve as the basis for facility development planning.
FAA Advisory Circular 150/5070-6A, Airport Master Plans, outlines six standard steps involved in the forecast process, as follows:
1)
2)
3)
4)
5)
6)
AVIATIONDEMAND FORECASTS
Obtain existing FAA and other related forecasts for the area served by the airport.
Determine if there have been significant local conditions or changes in the forecast factors.
Make and document any adjustments to the aviation activity forecasts.
Where applicable, consider the effects of changes in uncertain factors affecting demand for airport services.
Evaluate the potential for peak loads within the overall forecasts of aviation activity.
Monitor actual activity levels over time to determine if adjustments are necessary in the forecasts.

2-2
It is virtually impossible to predict withcertainty year-to year fluctuations ofactivity when looking twenty years intothe future. Because aviation activitycan be affected by many influences atthe local, regional, and national level, itis important to remember that forecastsare to serve only as guidelines andplanning must remain flexible enoughto respond to unforeseen facility needs.
The following forecast analysisexamines recent developments,historical information, and currentaviation trends to provide an updatedset of aviation-demand projections forOJC. The intent is to permit theJohnson County Airport Commission tomake planning adjustments asnecessary to ensure that the facilitymeets projected demands in an efficientand cost-effective manner.
FORECASTING APPROACH
The development of aviation forecastsproceeds through both analytical andjudgmental processes. A series ofmathematical relationships is tested toestablish statistical logic and rationalefor projected growth. However, thejudgement of the forecast analyst, basedupon professional experience,knowledge of the aviation industry, andassessment of the local situation, isimportant in the final determination ofthe preferred forecast.
The most reliable approach toestimating aviation demand is throughthe utilization of more than oneanalytical technique. Methodologiesfrequently considered include trend line
projections, correlation/regressionanalysis, and market share analysis.
Trend line projections are probablythe simplest and most familiar of theforecasting techniques. By fittinggrowth curves to historical demanddata, then extending them into thefuture, a basic trend line projection isproduced. A basic assumption of thistechnique is that outside factors willcontinue to affect aviation demand inmuch the same manner as in the past.As broad as this assumption may be,the trend line projection does serve as areliable benchmark for comparing otherprojections.
Correlation analysis provides ameasure of the direct relationshipbetween two separate sets of historicdata. Should there be a reasonablecorrelation between the data sets,further evaluation using regressionanalysis may be employed.
Regression analysis measures thestatistical relationship betweendependent and independent variablesyielding a “correlation coefficient.” Thecorrelation coefficient (Pearson’s “r”)measures the association betweenchanges in a dependent variable andindependent variable(s). If the r-squared (r2) value (coefficientdetermination) is greater than 0.90, itindicates good predictive reliability. Avalue below 0.90 may be used with theunderstanding that the predictivereliability is lower.
Market share analysis involves ahistorical comparison of airport activityas a percentage, or share, of a larger
2-3
regional, state, or national variable.These shares are then multiplied by theforecasts of the larger geographical areato produce a market share projection.This method has the same limitationsas trend line projections, but canprovide a useful check on the validity ofother forecasting techniques.
A number of additional sources foraviation forecasts were also consulted.The Mid-America Regional Council(MARC), which is the regionalMetropolitan Planning Organization(MPO), has developed a regionalaviation system plan. As JohnsonCounty Executive is within thejurisdiction of the MPO, it is included inthe system plan. The consulted plan isthe Airports System Plan 2010 aspublished in May 1991. The MPO iscurrently developing a revised systemplan. Should this information becomeavailable during the course of thismaster plan, it will be incorporated.
The FAA publishes the Terminal AreaForecast (TAF) which provides aviationforecasts for National Plan ofIntegrated Airport Systems (NPIAS)airports. This information is consultedand presented as a comparative forecastin the forecasts presented herein.
In 1988, a master plan was completedfor Johnson County Executive.Although the aviation industry hasexperienced unanticipated changes andevents since that plan, the forecasts arepresented as a point of comparison.
It is important to note that one shouldnot assume a high level of confidence inforecasts that extend beyond five years.
Facility and financial planning usuallyrequire at least a 10-year view, since itoften takes more than five years tocomplete a major facility developmentprogram. However, it is important touse forecasts which do not overestimaterevenue-generating capabilities orunderstate demand for facilities neededto meet public (user) needs.
A wide range of factors is known toinfluence the aviation industry and canhave significant impacts on the extentand nature of air service provided inboth the local and national markets.Technological advances in aviation havehistorically altered, and will continue tochange, the growth rates in aviationdemand over time. The most obviousexample is the impact of jet aircraft onthe aviation industry, which resulted ina growth rate that far exceededexpectations. Such changes aredifficult, if not impossible, to predict,and there is simply no mathematicalway to estimate their impacts. Using abroad spectrum of local, regional, andnational socioeconomic and aviationinformation, and analyzing the mostcurrent aviation trends, forecasts arepresented in the following sections.
NATIONAL AVIATIONTRENDS
Each year, the Federal AviationAdministration (FAA) publishes itsnational forecast. Included in thispublication are forecasts for large aircarriers, regional air carriers, generalaviation, along with FAA workloadmeasures. The forecasts are prepared

2-4
to meet budget and planning needs ofconstituent units of the FAA and toprovide information that can be used bystate and local authorities, the aviationindustry, and the general public. Thecurrent edition, when this chapter wasprepared, is FAA Aerospace Forecasts-Fiscal Years, 2005-2016. The forecastuses the economic performance of theUnited States as an indicator of futureaviation industry growth. Similareconomic analyses are applied to theoutlook for aviation growth ininternational markets.
In the seven years prior to the events of9/11, the U.S. civil aviation industryexperienced unprecedented growth indemand and profits. The impacts to theeconomy and aviation industry from theevents of 9/11 were immediate andsignificant. However, the economicclimate and aviation industry are bothexperiencing significant upturns. TheFAA expects the U.S. economy toexperience strong growth over the nextfew years, with moderate growththereafter. This will positivelyinfluence the aviation industry, leadingto passenger, air cargo, and generalaviation growth throughout the forecastperiod (assuming there will not be anynew successful terrorists’ incidentsagainst either U.S. or world aviation).
For the first time since 2000, thenumber of passenger enplanements onU.S. commercial carriers increased in2004. This is due, in large part, to theextremely strong growth of low-costcarriers such as Southwest Airlines andAirTran Airways, among others. A totalof 502.2 million passengers wereenplaned in 2004, up four percent from
2003, but still 10.6 percent below the2000 peak. Over the forecast period,enplanements are expected to grow 2.9percent annually.
Regional / commuter passengerenplanements are projected to increaseby 15.4 percent in 2005, 9.9 percent in2006, and 6.3 percent in 2007. Between2008 and 2016, enplanements areprojected to grow at an average rate of3.9 percent annually, reaching 245.5million by 2016. Over the entire 12-year forecast period, passengerenplanements are forecast to grow 5.5percent annually.
An additional measure of the health ofthe aviation system is the trend in aircargo as measured in revenue-ton-miles(RTM). The FAA projects air cargoRTMs to grow at 5.1 percent annually.
GENERAL AVIATION
In the 10 years since the passage of theGeneral Aviation Revitalization Act of1994 (federal legislation which limitsthe liability on general aviation aircraftto 18 years from the date ofmanufacture), it is clear that the Acthas successfully infused new life intothe general aviation industry. Thislegislation sparked an interest to renewthe manufacturing of general aviationaircraft due to the reduction in productliability, as well as renewed optimismfor the industry. Annual shipments ofnew aircraft rose every year between1994 and 2000.
The growth in the general aviationindustry slowed considerably from 2001

2-5
to 2003, having been negativelyimpacted by the events of 9/11.Thousands of general aviation aircraftwere grounded for weeks, due to “no-flyzone” restrictions imposed on operationsof aircraft in security-sensitive areas.Washington, D.C., continues toimplement these restrictions to thisday. This, in addition to the economicrecession taking place from 2001-03,had a negative impact on the generalaviation industry.
In 2004, the general aviation industryshowed a significant increase inactivity, returning to pre-9/11 levels formost indicators. The FAA forecastassumes that the regulatoryenvironment affecting general aviationwill not change dramatically. Theforecast also assumes that thefractional ownership market willcontinue to expand and bring newoperators and shareholders intobusiness aviation. It also assumes thatanother successful terrorist attack onaviation will not occur.
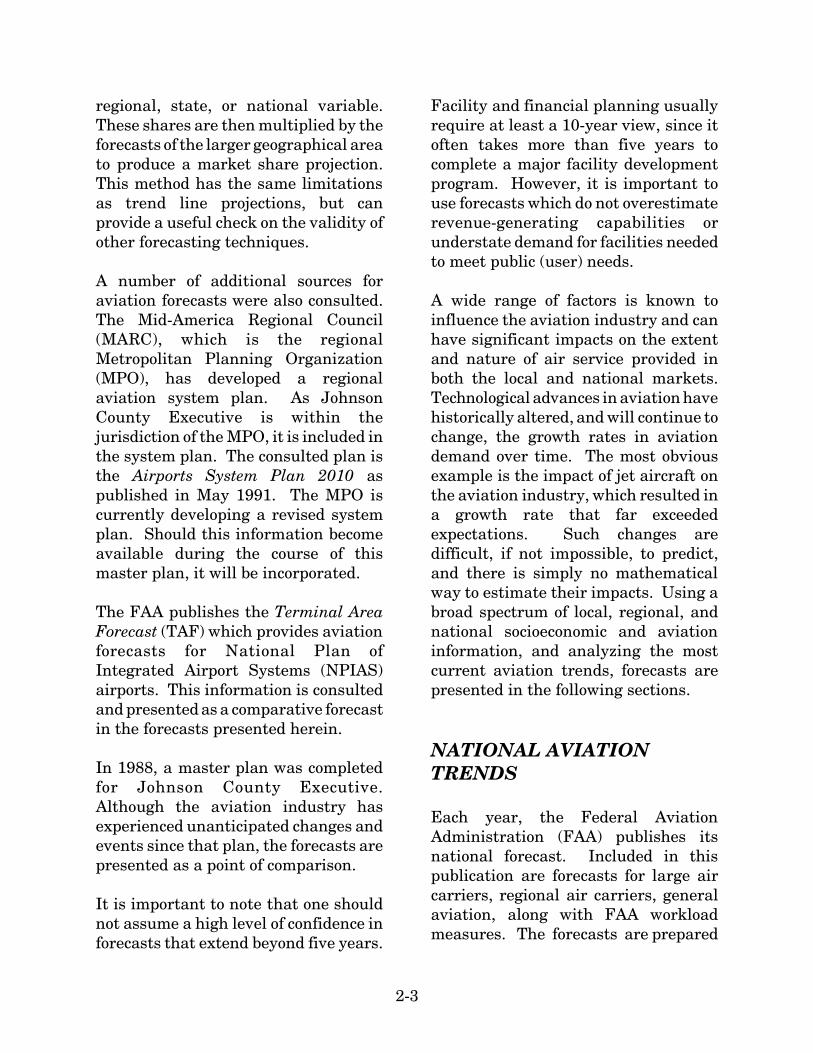
The active general aviation aircraftfleet is expected to increase at anaverage annual rate of 1.1 percent overthe 12-year forecast period, increasingfrom 210,600 in 2003, to 240,070 in2016. This growth includes the additionof a new aircraft category, light sportaircraft, which is expected to enter theactive fleet in 2005, and account for15,410 aircraft in 2016. Light sportaircraft include small fixed-wingairplanes, powered-parachutes, gyro-planes, ultra-lights, and others.
FAA forecasts identify two generalaviation economies that follow different
market patterns. The turbojet fleet isexpected to increase at an averageannual rate of 5.4 percent, increasingfrom 8,153 in 2003, to 15,900 in 2016.Factors leading to this substantialgrowth include expected strong U.S.and global economic growth; thecontinued success of fractionalownership programs; a continuation ofthe shift from commercial air travel tocorporate/business air travel bybusiness travelers and corporations. Inaddition, new micro jets will begin toenter the fleet in 2006 and grow to4,500 aircraft by 2016. These aircraftare expected to stimulate the market foron-demand air taxi service.
Exhibit 2A depicts the FAA forecast foractive general aviation aircraft in theUnited States. The number of singleengine piston aircraft is projected toreach 148,000 in 2015, which representsan average annual growth rate of 0.2percent. During this same time, thenumber of active multi-engine pistonaircraft in the fleet is expected todecline by 0.2 percent, resulting in atotal of 17,235 aircraft in 2016. Thenumber of turboprop aircraft is expectedto increase at an average annual rate of3.7 percent over the 12-year forecastperiod to 8,400 active aircraft. Therotorcraft fleet is forecast to grow 1.2percent annually through 2016, whilethe number of experimental aircraft isprojected to increase from 20,603 in2003, to 21,380 in 2010. Thereafter, thegrowth in experimental aircraft isexpected to flatten, primarily due to thegrowth in sport aircraft.
The declines in the aircraft utilizationrates experienced in 2000 (down 3.2

2-6
percent) and 2001 (down 7.2 percent)were due, in part, to higher fuel pricesand the 2001 U.S. economic recession.However, the restrictions placed ongeneral aviation in the aftermath of the9/11 events, contributed heavily to thedecline in utilization in 2001. A strongrecovery in the U.S. economy in 2004and 2005 has led to increasedutilization rates for most categories ofgeneral aviation aircraft.
The total pilot population is projected toincrease from an estimated 618,633 in2004, to 750,260 by 2016, whichrepresents an average annual growthrate of 1.6 percent. The student pilotpopulation increased 0.7 percent in2004, and is forecast to increase at anannual rate of 1.8 percent over the 12-year forecast period, reaching a total of108,800 in 2016. Growth rates for theother pilot categories over the forecastperiod are as follows: airline transportpilots, up 1.7 percent; recreationalpilots, up 1.6 percent; rotorcraft only, up1.2 percent; and glider only, up 0.2percent.
The General Aviation ManufacturersAssociation (GAMA) publishes a yearlyoutlook on the general aviationindustry. The most recent edition waspublished in early 2005. The year 2004was a year of strong recovery for thegeneral aviation industry. Totalbillings reached almost $12 billion,which is nearly a 20 percent growthover 2003. GAMA forecasts theindustry will continue a strong growthtrend.
Over the past several years, the generalaviation industry has launched a series
of programs and initiatives whose maingoals are to promote and assure futuregrowth within the industry. “No Plane,No Gain” is an advocacy programcreated in 1992 by the GAMA and theNational Business Aircraft Association(NBAA) to promote acceptance andincreased use of general aviation as anessential, cost-effective tool forbusinesses.
Other programs are intended topromote growth in new pilot starts andintroduce people to general aviation.“Project Pilot,” sponsored by theAircraft Owners and Pilots Association(AOPA), promotes the training of newpilots in order to increase and maintainthe size of the pilot population. The “Bea Pilot” program is jointly sponsoredand supported by more than 100industry organizations. The NBAAsponsors “AvKids,” a program designedto educate elementary school studentsabout the benefits of business aviationto the community, and careeropportunities available to them inbusiness aviation. Over the years,programs such as these have played animportant role in the success of generalaviation and will continue to be vital toits growth in the future.
AIRPORT SERVICE AREA
The initial step in determining thegeneral aviation demand for an airportis to define its generalized service area.The airport service area is determinedprimarily by evaluating the location ofcompeting airports, their capabilitiesand services, and their relativeattraction and convenience. With this
U.S. ACTIVE GENERAL AVIATION AIRCRAFT (in thousands)
2004(Est.)
2008
2012
2016
144.0
145.5
147.0
148.0
7.3
7.7
8.1
8.4
6.2
6.1
5.9
5..8
211.3
227.7
233.9
240.1
Year
20.8
21.3
21.4
21.4
FIXED WING
Source: FAA Aerospace Forecasts, Fiscal Years 2005-2016.
Notes: An active aircraft is one that has a current registration and was flown at least one hour during the calendar year.
8.4
10.5
13.3
15.9
17.7
17.5
17.4
17.2
PISTON ROTORCRAFT
2.2
2.4
2.5
2.6
4.7
4.9
5.1.
5.3
TURBINESingleEngine Turboprop Other
N/A
10.8
13.2
15.4
SportAircraft TotalExperimentalTurbojet
Multi-Engine Piston Turbine
U.S. ACTIVE GENERAL AVIATION AIRCRAFTACTUALACTUAL FORECASTFORECASTACTUAL FORECAST
125
150
175
200
225
AIR
CR
AFT
(in
th
ousa
nds)
1980 1985 1990 1995 2000 2005YEAR
2010
250
120
2015
Exhibit 2AU.S. ACTIVE GENERAL AVIATION
AIRCRAFT FORECASTS
OJC
-04M
P18
-2A
-4/1
1/05
2-7
information, a determination can bemade as to what volume of aviationdemand would likely be accommodatedby a specific airport. It should be notedthat aviation demand often crossesgeographical and political boundaries.
The airport service area is ageographical area where there is apotential market for airport services.Access to general aviation airports,commercial air service, andtransportation networks enter into theequation to determine the size of aservice area, as well as the quality ofaviation facilities, distance, and othersubjective criteria. In largemetropolitan areas, a typical airportservice area will extend up to 20 miles,primarily due to the location ofcompeting airports. Depending onservices available, airports within 30miles may have an influence on theservice area as well.
As in any business enterprise, the moreattractive services and capabilities of afacility, the more competitive it will bein the market. If an airport’sattractiveness increases in relation tonearby airports, so will the size of theservice area. If facilities are adequate,and rates and fees are competitive,some level of general aviation activitymight be attracted to the airport fromsurrounding areas.
In determining the aviation demand foran airport, it is necessary to identify therole of that airport. The primary role ofJohnson County Executive Airport is toserve the needs of general aviation inthe area. General aviation is a termused to describe a diverse range of
aviation activities which includes allsegments of the aviation industryexcept commercial air carriers andmilitary. This can range fromrecreational flying in single engineaircraft to corporate business jets.
REGIONAL AIRPORTS
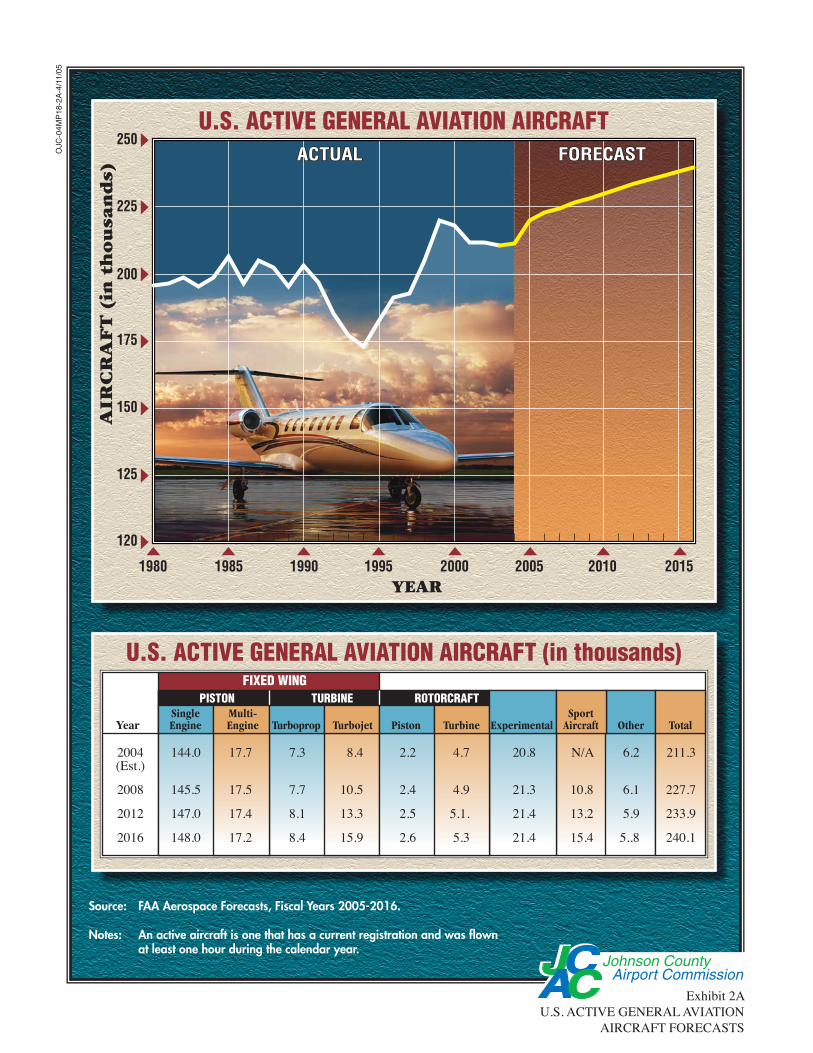
A review of public use airports within a20-nautical mile (nm) radius of JohnsonCounty Executive Airport was made toidentify and distinguish the types of airservice provided in the region. Theseairports are identified on Exhibit 2B.Information pertaining to each airportwas obtained from FAA Form 5010,Airport Master Record. Table 2A showsa summary of the regional public useairports.
New Century AirCenter (IXD) islocated seven nm to the west of JohnsonCounty Executive Airport and is alsoowned by Johnson County and operatedby the Johnson County AirportCommission. The airport has a two-runway system. Primary Runway 17-35, is 7,339 feet long by 190 feet wide,with a pavement strength rating of75,000 pounds single-wheel loading(SWL). SWL refers to the design ofcertain landing gear configurations thathave a single wheel on each mainlanding gear strut. Other landing gearconfigurations would include dual wheel(DWL), dual tandem wheel (DTL) anddouble dual tandem (DDTL). Each ofthese distributes more of the aircraftweight on runway and taxiway surfaces,and thus the surface itself can supporta greater total aircraft weight.

2-8
The runways are constructed of asphaltand are in good condition. The runwaysurfaces are scheduled to berehabilitated in Summer 2005.Crosswind Runway 4-22 is 5,130 feetlong by 100 feet wide. There areapproximately 195 based aircraft,including 12 Chinook militaryhelicopters, at the airport. The airportaverages approximately 75,000operations per year. The primaryrunway has five instrument approaches,including an instrument landing system(ILS) and GPS approach to Runway 35.New Century AirCenter is also adesignated reliever airport.
Gardner Municipal Airport (K34) islocated 10 nm to the west of JohnsonCounty Executive Airport and is ownedand operated by the City of Gardner.The airport has one asphalt runway andtwo turf runways. The paved runway,Runway 8-26, is 2,960 feet long by 39feet wide, is in good condition, with apavement strength rating of 6,000pounds SWL. The airport reportsapproximately 90 based aircraft andapproximately 51,000 annualoperations.
Charles B. Wheeler DowntownAirport (MKC) is located 18 nm to thenorth northeast of Johnson CountyExecutive Airport in downtown KansasCity, Missouri. The airport is ownedand operated by the City of Kansas Cityand is served by two runways. PrimaryRunway 1-19, is 7,002 feet long by 150feet wide. It is constructed of asphalt,grooved, in good condition, and has aSWL rating of 100,000 pounds.Crosswind Runway 3-21 is 5,050 feetlong by 150 feet wide. It is also
constructed of asphalt, grooved, and ingood condition. This runway has a SWLrating of 48,000 pounds. The airporthas approximately 300 based aircraftand experiences approximately 144,000operations per year. There are sixinstrument approach proceduresapproved for the airport including theILS approaches to Runway 19 andRunway 3.
Lee’s Summit Municipal Airport(LXT) is located 18 nm to the east ofOJC in Missouri. This airport is also areliever to Kansas City InternationalAirport. The airport is owned andoperated by the City of Lee’s Summit.It is served by Runway 18-36 andRunway 11-29. Primary Runway 18-36is 4,015 feet long by 75 feet wide,constructed of concrete, is in goodcondition, with a SWL rating of 30,000pounds. There are publishedinstrument approach procedures for allrunways except Runway 11, which is forvisual flight rules (VFR) only. There are170 based aircraft at the airport. Morethan 100,000 operations are estimatedannually at the airport.
Miami County Airport (K81) islocated 20 nm to the southwest ofJohnson County Executive Airport. Theairport is owned and operated by MiamiCounty, and is supported by an asphaltand a turf runway. The asphaltrunway, Runway 3-21, is 3,400 feet longby 60 feet wide and is in fair condition.There are 23 based aircraft at theairport and an estimated 6,500 annualoperations.
There are other public use airports thatare outside of the 20 nm radius. These

04M
P18
-2B
-12/
17/0
4
Exhibit 2BAIRPORT SERVICE AREA
R AYR AYR AY
C A S S
M I A M IM I A M I
F R A N K L I NF R A N K L I N
J O H N S O NJ O H N S O N
M I A M I
C L AYC L AYC L AY
J A C K S O NJ A C K S O NJ A C K S O N
P L AT T E
F R A N K L I N
D O U G L A SD O U G L A SD O U G L A S
J O H N S O N
L E AV E N W O R T HL E AV E N W O R T HL E AV E N W O R T H
W YA N D O T T EW YA N D O T T EW YA N D O T T E
Miami CountyMiami CountyMiami CountyOttawaOttawaMunicipalMunicipalOttawaMunicipal
New CenturyNew CenturyAirCenterAirCenterNew CenturyAirCenter
Lee's SummitLee's SummitMunicipalMunicipalLee's SummitMunicipal
Lawrence Smith MemorialLawrence Smith MemorialLawrence Smith Memorial
Johnson CountyJohnson CountyExecutiveExecutiveJohnson CountyExecutive
OttawaOttawaOttawa
GardnerGardnerGardner
LawrenceLawrenceLawrenceLenexaLenexaLenexa
ShawneeShawneeShawnee
Kansas CityKansas CityKansas CityIndependenceIndependenceIndependence
Lee's SummitLee's SummitLee's SummitOverland ParkOverland ParkOverland Park
GardnerGardnerMunicipalMunicipal
AirportAirport
GardnerMunicipal
Airport
LenexaLenexaLenexa
OlatheOlatheOlathe
ShawneeShawneeShawnee
GardnerGardnerGardner
Overland ParkOverland ParkOverland Park
35
35
7070
470435
29
Gardner MunicipalGardner MunicipalGardner Municipal
LawrenceLawrenceMunicipalMunicipalLawrenceMunicipal
Kansas CityKansas CityInternationalInternationalKansas CityInternational
Charles B. WheelerCharles B. WheelerDowntownDowntownCharles B. WheelerDowntown
35
435
New CenturyAir Center
Johnson CountyExecutive Airport
NORTH
NOT TO SCALE
Airports
County Boundary
State Boundary
Interstate Highway
Water
Airport Service Area
Counties
LEGEND
J O H N S O NJ O H N S O N
M I A M IM I A M I
J O H N S O N
M I A M I

2-9
airports may not directly compete formarket share with OJC, but by virtue oftheir location and services, they limitthe possibility of an expanded servicearea for Johnson County ExecutiveAirport.
Lawrence Smith Memorial Airport(LRY) is located in Harrisonville,Missouri, 23 nm to the east andprimarily serves Cass County. Thisairport has a single asphalt runwaywhich is oriented in a north-southmanner. Runway 17-35 is 4,000 feetlong by 75 feet wide. There are 58reported based aircraft and it isreported that the airport averages 33operations per day. This airport, alongwith Lee’s Summit, effectively limitsthe eastern portion of the service area.
To the northwest is LawrenceMunicipal Airport (LWC) which isserved by a dual runway system.Lawrence is home to the University ofKansas and is situated nearlyequidistant between Kansas City andTopeka, Kansas, the state capitol.Primary Runway 15-33 is 5,700 feetlong by 100 feet wide. Crosswind
Runway 1-19 is 3,901 feet long by 75feet wide. There are 62 reported basedaircraft and an estimated 91 dailyoperations at the airport. In addition,Lawrence has an ILS approach thatenables aircraft to utilize the airport inpoor weather conditions. This airport,along with New Century AirCenter andGardner Municipal Airport, limits theservice area to the west and northwest.
TABLE 2APublic Use Airports Within 20 nautical miles of Johnson County Executive AirportJohnson County Executive Airport
AirportFAA
ClassificationRelationalLocation
LongestRunway
BasedAircraft
AnnualOperations
New Century AirCenter Reliever 7 nm W 7,339' 195 74,000Gardner Municipal Airport GA 11 nm W 2,960' 92 51,000Charles B. Wheeler DowntownAirport Reliever 18 nm NNE 7,002' 300 144,000Lee's Summit Municipal Airport Reliever 18 nm E 4,015' 170 104,000Miami County Airport GA 20 nm SW 3,400' 23 6,500GA: General Aviationnm: nautical milesSource: FAA Form 5010
SERVICE AREA SUMMARY
The airport service area for JohnsonCounty Executive Airport will beinfluenced by several factors. First, thecompeting airports will influence thedistribution of the region’s aviationdemand. For small aircraft owners, thedecision to base at an airport willcontinue to be the result of an airport’s
available hangars, hangar lease rates,and, most importantly, the proximityfrom their residence. Thus, the servicearea for small aircraft will be limited tothe west by Gardner Municipal andNew Century AirCenter, to the south byMiami County Airport and to the eastby airports in Lee’s Summit andHarrisonville. To the north, the nearestgeneral aviation airport is Charles B.

2-10
Wheeler Downtown. This airport willserve as the northern service areaboundary.
Johnson County Executive Airport, byvirtue of its location between OverlandPark and Olathe, has a need to servelarger turboprop and business jetaircraft. Other airports are alsocompeting for this segment of aviationactivity. New Century AirCenter, andCharles B. Wheeler Downtown Airportboth have primary runways longer than7,000 feet. This enables them to servethe full range of corporate jets. Lee’sSummit Airport is consideringupgrading their primary runway from4,015 feet to 5,500 feet. This willenable them to serve most corporate jetaircraft. With a 4,100-foot-longrunway, OJC is unable to compete forthe large corporate jets. OJC is able tocompete for smaller business jetactivity. The runway can support mostof the Cessna Citations and Falconbusiness jets. However, the runway isunable to support the newer, largermodels such as the Cessna 650 and 750and the Falcon 900EX and F-Series.
The service area for Johnson CountyExecutive Airport will include all ofJohnson County and a portion of MiamiCounty in order to meet the needs ofthose airport users looking for a higherlevel of service, which Johnson CountyExecutive Airport can supply, ascompared to Miami County Airport.For all practical purposes, the servicearea for the larger business jets isseverely limited, first by the runwaylimitation and second, by the availablefacilities at nearby airports. Exhibit
2B depicts the generalized service areafor the airport.
SOCIOECONOMICPROJECTIONS
The socioeconomic conditions provide animportant baseline for preparingaviation demand forecasts. Localsocioeconomic variables such aspopulation, employment, and incomeare indicators for understanding thedynamics of the community and, inparticular, the trends in aviationgrowth. The following is a summary ofthe research and projections presentedin Chapter One.
POPULATION
Table 2B summarizes historical andforecast population estimates forJohnson County, the cities of Olatheand Overland Park, and the State ofKansas. The analysis of JohnsonCounty population indicates an averageannual growth rate of 2.42 percentbetween 1990 and 2000. This was byfar the highest county growth rate inthe state over the period. Olathe andOverland Park are two of the fastestgrowing communities in Kansas.Olathe is projected to grow by morethan two percent annually through theplanning period, while Overland Park isprojected to grow by more than threepercent on an average annual basis.
Population forecasts for JohnsonCounty and the two cities are also

2-11
presented. The population for JohnsonCounty is forecast to reach nearly700,000 by 2025. This projectionequates to an annual growth rate of1.76 percent and the addition of 246,000residents between 2000 and 2025. Theentire State of Kansas is projected to
add 420,000 persons. Thus, thepopulation projection for JohnsonCounty represents nearly 61 percent ofthe entire population growth expectedwithin the state over this 25-yearperiod.
TABLE 2BSocioeconomic Forecasts for the Airport Service AreaJohnson County Executive Airport
HISTORICAL FORECASTAnnual Growth
Rate
1990 2000 2010 2015 20251990 to
20002000 to
2025PopulationJohnsonCounty 355,021 451,086 550,904 595,893 697,193 2.42% 1.76%Olathe 63,832 93,757 127,200 131,665 154,277 3.92% 2.01%Overland Park 112,498 150,584 203,458 236,495 319,533 2.96% 3.06%Kansas 2,477,588 2,688,418 2,852,957 2,939,000 3,108,000 0.82% 0.58%EmploymentJohnsonCounty 241,291 364,721 487,210 536,235 617,542 2.51% 1.11%Kansas 1,383,650 1,675,358 1,872,460 1,986,104 2,237,995 1.93% 1.16%PCPIJohnsonCounty $31,448 $40,301 $44,961 $47,574 $53,146 4.22% 2.13%Kansas $21,227 $25,551 $29,442 $31,434 $35,804 1.87% 1.36%Sources: Mid-America Regional Council (MARC); Woods and Poole, CEDDS 2004. PCPI $1996.
EMPLOYMENT
Historical and forecast employmentdata for Johnson County is alsopresented in Table 2B. Between 1990and 2000, Johnson County grew inemployment by 4.22 percent annually.This growth accounted for nearly124,000 new jobs over the 10-yearperiod, more than 42 percent of theemployment growth for the entire state.
Johnson County is expected to showcontinued strong employment growthover the planning period, with anaverage annual growth rate of 2.13
percent between 2000 and 2025. At thisrate, Johnson County would add morethan 250,000 new jobs, representingnearly 45 percent of the employmentgrowth in the state. In addition,employment is forecast to outpacepopulation growth through the planningperiod.
PER CAPITA PERSONALINCOME (PCPI)
Table 2B also compares per capitapersonal income (adjusted to 1996dollars) for the county and the state.

2-12
Johnson County’s average adjustedPCPI for 2000 is $40,301 compared to$25,551 for the State of Kansas.Johnson County is not only an economicdriver for the state, it is also a fairlyaffluent county. Although the State ofKansas’ PCPI is projected to increase ata greater annual rate, Johnson CountyPCPI is forecast to be 32 percent higherthan the State’s PCPI by 2025.
GENERAL AVIATIONFORECASTS
To determine the types and sizes offacilities that should be planned toaccommodate general aviation activity,certain elements of this activity must beforecast. Indicators of general aviationdemand include:
• Based Aircraft• Based Aircraft Fleet Mix• General Aviation Operations• Peaking Operations• Annual Instrument Approaches
The remainder of this chapter willexamine historical trends with regard tothese areas of general aviation, andproject future demand for thesesegments of general aviation activity atthe airport.
JOHNSON COUNTYREGISTEREDAIRCRAFT FORECAST
The number of based aircraft is themost basic indicator of general aviationdemand at an airport. By firstdeveloping a forecast of based aircraft,
other demand segments can beprojected based upon this trend.
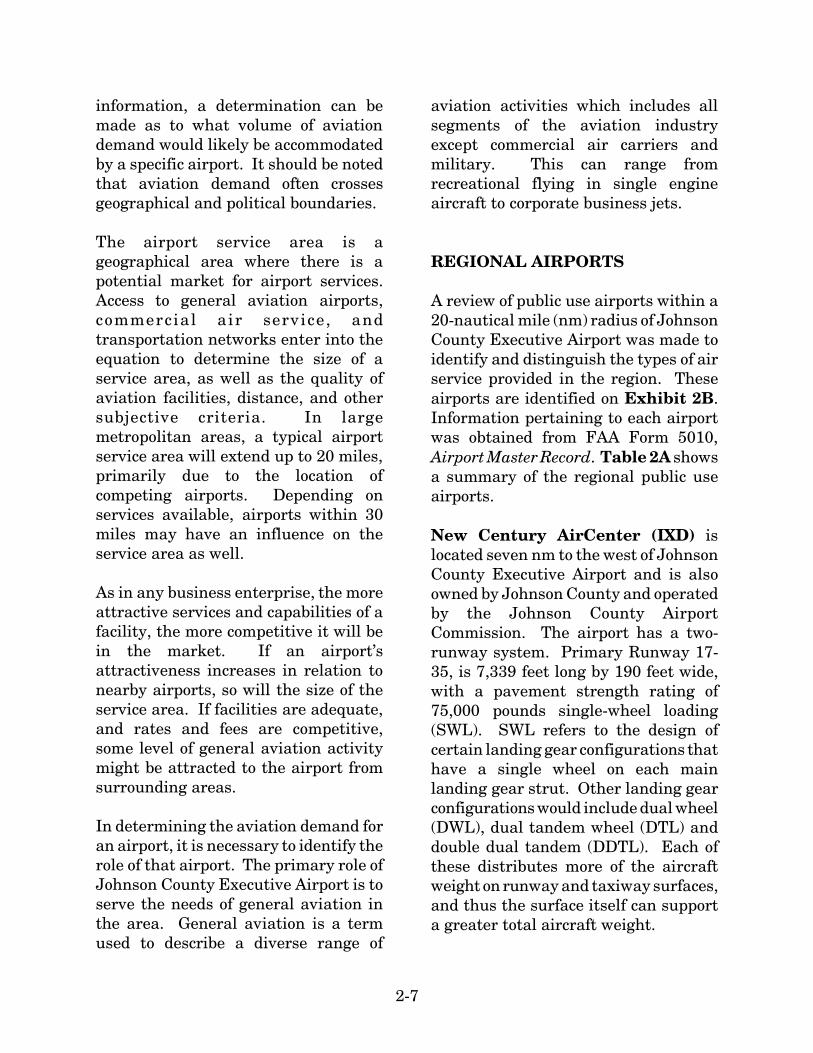
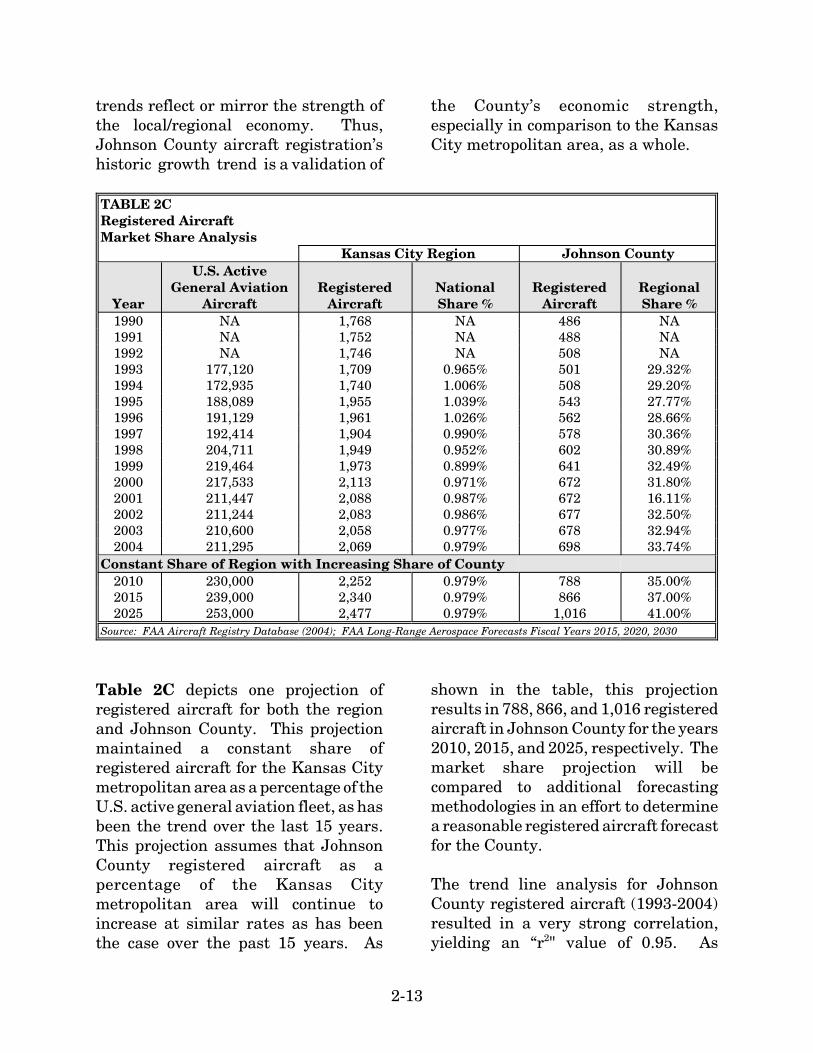
One method of forecasting basedaircraft is to first examine local aircraftownership by reviewing aircraftregistrations in the region. Table 2Cpresents the growth in registeredaircraft, not only in Johnson County,but also in the Kansas Citymetropolitan region as a point ofcomparison. The counties included inthe Kansas City region areLeavenworth, Wyandotte, and Johnsonin Kansas, and Platte, Clay, Jackson,Cass, and Ray in Missouri.
Registered aircraft in Johnson Countyhave steadily increased over the past 15years. Aircraft registrations for themetropolitan region have alsoincreased, but there have been twonoticeable periods when the totalregistrations declined. The first wasbetween 1990 and 1993 when theregion’s registered aircraft went from1,768 to 1,709. The second period ofdecline was between 2001 and 2003.The region’s 2004 registered aircraftnumbers appear to be back in line witha positive growth rate.
Over the last 15 years, Johnson Countyannual aircraft registrations havedeclined just once. In 1993, aircraftregistrations in the county decreased to501 from the previous year’s 508. Therehave been years of no-growth but thegeneral trend has been increasing.Even when the region’s aircraftregistrations declined, JohnsonCounty’s registered aircraft regularlyincreased. Often-times, an area’sgeneral aviation aircraft ownership
2-13
trends reflect or mirror the strength ofthe local/regional economy. Thus,Johnson County aircraft registration’shistoric growth trend is a validation of
the County’s economic strength,especially in comparison to the KansasCity metropolitan area, as a whole.
TABLE 2CRegistered AircraftMarket Share Analysis
Kansas City Region Johnson County
Year
U.S. ActiveGeneral Aviation
AircraftRegistered
AircraftNationalShare %
RegisteredAircraft
RegionalShare %
1990 NA 1,768 NA 486 NA1991 NA 1,752 NA 488 NA1992 NA 1,746 NA 508 NA1993 177,120 1,709 0.965% 501 29.32%1994 172,935 1,740 1.006% 508 29.20%1995 188,089 1,955 1.039% 543 27.77%1996 191,129 1,961 1.026% 562 28.66%1997 192,414 1,904 0.990% 578 30.36%1998 204,711 1,949 0.952% 602 30.89%1999 219,464 1,973 0.899% 641 32.49%2000 217,533 2,113 0.971% 672 31.80%2001 211,447 2,088 0.987% 672 16.11%2002 211,244 2,083 0.986% 677 32.50%2003 210,600 2,058 0.977% 678 32.94%2004 211,295 2,069 0.979% 698 33.74%
Constant Share of Region with Increasing Share of County2010 230,000 2,252 0.979% 788 35.00%2015 239,000 2,340 0.979% 866 37.00%2025 253,000 2,477 0.979% 1,016 41.00%
Source: FAA Aircraft Registry Database (2004); FAA Long-Range Aerospace Forecasts Fiscal Years 2015, 2020, 2030
Table 2C depicts one projection ofregistered aircraft for both the regionand Johnson County. This projectionmaintained a constant share ofregistered aircraft for the Kansas Citymetropolitan area as a percentage of theU.S. active general aviation fleet, as hasbeen the trend over the last 15 years.This projection assumes that JohnsonCounty registered aircraft as apercentage of the Kansas Citymetropolitan area will continue toincrease at similar rates as has beenthe case over the past 15 years. As
shown in the table, this projectionresults in 788, 866, and 1,016 registeredaircraft in Johnson County for the years2010, 2015, and 2025, respectively. Themarket share projection will becompared to additional forecastingmethodologies in an effort to determinea reasonable registered aircraft forecastfor the County.
The trend line analysis for JohnsonCounty registered aircraft (1993-2004)resulted in a very strong correlation,yielding an “r2" value of 0.95. As

2-14
presented in Table 2D, a number ofadditional regression analyses were alsoperformed including multipleregressions. In nearly every case, the“r2" values were above 0.90, indicatingstrong positive correlations.
The projections for Johnson Countyaircraft registrations are presented inTable 2D, with representative forecastsand the selected forecast depicted onExhibit 2C. Many of the regressions
show strong correlations and statisticalsignificance. The multiple regressionusing income (PCPI), population andthe U.S. active general aviation fleetresulted in an “r2" value of 0.99. Withsuch a strong correlation amongimportant variables, this forecast willserve as the Johnson County registeredaircraft projection. This forecast will beutilized as a variable when determininga reasonable based aircraft forecast inthe following subsection.
TABLE 2DRegistered Aircraft ProjectionsJohnson County Kansas
2010 2015 2025Regression AnalysisTrend Line (r2=0.95) 832 929 1,121vs. Population (r2=0.95) 808 886 1,062vs. PCPI (r2=0.98) 762 816 932vs. US Active Fleet (r2=0.88) 735 773 832vs. Pop. & PCPI (r2=0.97) 748 796 896vs. Pop. & US Active Fleet (r2=0.99) 801 871 1,019vs. PCPI & Pop. & US Active Fleet (r2=0.99) 785 849 980Market Share ProjectionsRegion Constant Share of U.S. with: Johnson County Increasing in Region 788 866 1,0161988 Master Plan (1990-586; 2000-698) 778 821* 916*Selected Forecast 785 849 985Source: Coffman Associates analysis; * Extrapolated
BASED AIRCRAFT FORECASTS
Determining the number of basedaircraft at an airport can be achallenging task because the number ofbased aircraft can change frequently.Many general aviation and relieverairports don’t maintain historic recordsof based aircraft. Fortunately, theJohnson County Airport Commissionhas kept records on based aircraft overthe past several years. These recordsserve as the basis for the historic basedaircraft numbers used in this analysis.
With a reasonable forecast of JohnsonCounty registered aircraft, a basedaircraft forecast can now be determined.As presented in Table 2E, basedaircraft at Johnson County ExecutiveAirport have fluctuated between 38 and48 percent of registered aircraft inJohnson County. Overall, basedaircraft have remained nearlyunchanged over the last ten years with259 aircraft in 1995 and 263 in 2004.
Two market share forecasts for basedaircraft were developed utilizing

OJC
-04M
P18
-2C
-5/5
/05
Exhibit 2CREGISTERED AIRCRAFT FORECASTS
600
20252015 202020102005200019951990
400
200
0
800
1,000
1,200R
EG
IST
ER
ED
AIR
CR
AFT
YEARS
HISTORICALHISTORICAL FORECASTSFORECASTS
Regression Analysis Trend Line (r2=0.95) vs. PCPI (r2=0.98) vs. Population & PCPI (r2=0.97) vs. PCPI, Population, & U.S. Active Fleet (r2=0.99)Market Share ProjectionsRegion Constant Share of U.S. with: Johnson County Increasing Share of RegionSelected Forecast
LEGEND

2-15
Johnson County registered aircraft. Thefirst assumes that OJC will account forapproximately 37.5 percent of JohnsonCounty registered aircraft over the next20 years, as has been the trend the pastfive years. This forecast results in 294,318 and 369 based aircraft for the years2010, 2015 and 2025 respectively.Considering the limited growthpotential at OJC this forecast isconsidered a high-end projection.
The second forecast considers adecreasing market share of registeredaircraft in Johnson County. Thisforecast projects that OJC will, over thenext 20 years, decrease from 38 percentto 35 percent, its capture of JohnsonCounty registered aircraft. Thisforecast yields 290 based aircraft in2010, 310 in 2010, and 345 in 2025.
TABLE 2EBased Aircraft vs. Johnson County Registered AircraftJohnson County Executive Airport
YearJohnson County Registered
AircraftBased
Aircraft% of County Registered
Aircraft 1995 543 259 47.7%1996 562 259 46.1%1997 578 260 45.0%1998 602 260 43.2%1999 641 250 39.0%2000 672 250 37.2%2001 672 247 36.8%2002 677 254 37.5%2003 678 257 37.9%2004 698 263 37.7%
Constant Market Share Projection2010 785 294 37.5%2015 849 318 37.5%2025 985 369 37.5%
Declining Market Share Projection2010 785 290 37.0%2015 849 310 36.5%2025 985 345 35.0%
Sources: 1995-2000 FAA TAF ('99 and '00 adjusted to 250 from 419); 2001-2004 Airport Records.
Comparison Forecasts
On an annual basis, the FAA performsan airport inspection and based aircraftis one of the items tracked for inclusionin the Airport Master Record (FAAForm 5010). In many cases, the Form5010 provides a good starting pointwhen analyzing based aircraft,however, the FAA numbers should be
validated with supporting data andanalysis. The Form 5010 data istypically in the FAA’s Terminal AreaForecast (TAF). The TAF is FAA’s toolfor forecasting aviation activity forairports across the country.
The FAA TAF report projects 313, 353,and 433 based aircraft for the years2010, 2015, and 2025 (extrapolated),

2-16
respectively. These are shown forcomparison purposes. TAF projectionsoften do not take into consideration theconstraints to development at theairport. In addition, the TAF doesn’ttake into account the level ofcompetition from nearby airports. Theprevious master plan, completed in1988, has a long term forecast of 375based aircraft for 2010.
Regression analysis was also conductedin order to determine if there has beena historical relationship betweenvariables and based aircraft. Historicalbased aircraft at Johnson CountyExecutive Airport were compared totime, population, U.S. active fleet, andPCPI. Multiple regression analysis wasconducted with PCPI and population ascompared to based aircraft. The resultsof all of these regressions yielded “r2"values below 0.5. Because there islimited reliability in the predictivevalue of “r2" values below 0.90, theregressions were not considered further.
Based Aircraft Conclusion
Johnson County Executive Airport isconstrained in its growth potential.
There is very little room left for hangardevelopment. This based aircraftforecast assumes that the airport willconstruct new facilities where they canas they are needed. It is anticipatedthat within the next 20 years, theairport will be at or near capacity forhangar development, and aircraftwishing to base at the airport will haveto go elsewhere. Should the airportchoose not to develop any new storagefacilities, the aircraft projected to baseat the airport would be forced to findfacilities at nearby airports.
Table 2F shows a summary of theforecasting methods analyzed for thebased aircraft projection. The selectedforecast closely resembles the decliningmarket share forecast. This forecast isbelieved to be the most realisticconsidering the constraints at theairport. The selected forecast for 2025shows slightly greater decline than themarket share forecast because it isassumed that by this time the airportwill be at development capacity.Exhibit 2D depicts the trend lines forthe forecast methods as well as theselected forecast.
TABLE 2FBased Aircraft ProjectionsJohnson County Executive Airport
2010 2015 2025Market Share of Johnson County Registered Aircraft Constant Share 294 318 369 Declining Share 290 310 345Comparison Forecasts FAA TAF 313 353 433 1988 Master Plan 375Selected Forecast 290 310 335

OJC
-04M
P18
-2D
-5/5
/05
Exhibit 2DBASED AIRCRAFT
100
2010 20152005200019951990 20252020
200
300
400
500
0
BA
SE
D A
IRC
RA
FT
YEARS
HISTORICAL FORECASTS
Market Share of Johnson CountyRegistered Aircraft Constant Share Declining Share
FAA TAF
Selected Forecast
LEGEND

2-17
The milestones are founded on thepotential of attracting additional basedaircraft to the airport and, moreimportantly, supporting those aircraftwith facilities. By providing a realisticbased aircraft forecast for JohnsonCounty Executive Airport and includingcomparisons to the other two JohnsonCounty airports, airport officials will beable to respond to unexpected changesin a timely manner. As a result, thesemilestones provide flexibility, whilepotentially extending this plan’s usefullife if aviation trends slow over theperiod.
The most important reason for utilizingmilestones is that they allow the airportto develop facilities according to needgenerated by actual demand levels. Thedemand-based schedule providesflexibility in development, asdevelopment schedules can be slowed orexpedited according to actual demand atany given time over the planningperiod. The resultant plan providesairport officials with a financially-responsible and need-based program.The planning horizons for based aircraftthat will be utilized for the remainder ofthis master plan are as follows:
• Short Term 290• Intermediate Term 310• Long Term 335
Registered Aircraft Distribution
There are three public airports inJohnson County, Kansas. Each of themaccounts for a portion of the registeredaircraft in the county, as presented inTable 2G. When determining thenumber of based aircraft for one airport,
it is important to cross-check and makesure that the cumulative total of allbased aircraft, as a percentage ofCounty registered aircraft, isreasonable.
Gardner Municipal Airport had amaster plan completed in 1998. In thatplan, based aircraft were anticipated togrow from 86 to 139 by 2017.Currently, Gardner has approximately92 based aircraft, which puts theirgrowth behind the projected numbers.In an effort to develop a reasonablebased aircraft distribution, Gardner’sbased aircraft forecast was adjusted to109, 129, and 139 representing theyears 2010, 2015, and 2025,respectively.
The New Century AirCenter masterplan is being completed concurrentlywith this one. Because of this, forecastsare allowed to be more fluid andadjusted based on each other. In theNew Century AirCenter master plancan be found detailed analysis andexplanation of the based aircraftforecast for that airport.
As shown in the Table 2G, the 2010forecast has 80.8 percent of JohnsonCounty registered aircraft basing at thethree county airports. This percentageincreases to 83.5 percent in 2015 anddrops slightly to 82.6 percent by 2025.The forecast aircraft distributionappears to be in line with thedistribution trend over the last tenyears.
Exhibit 2E graphically depicts theforecast aircraft distribution for thethree Johnson County airports.

2-18
TABLE 2GBased Aircraft DistributionPublic Johnson County Airports
Year
Johnson CountyRegistered
Aircraft Executive New Century Gardner Total% of Registered
Aircraft1990 486 271 155 72 498 102.5%1991 488 241 141 72 454 93.0%1992 508 290 128 66 484 95.3%1993 501 290 128 66 484 96.6%1994 508 262 145 66 473 93.1%1995 543 259 145 81 485 89.3%1996 562 259 145 86 490 87.2%1997 578 260 192 86 538 93.1%1998 602 260 192 86 538 89.4%1999 641 250 213 94 557 86.9%2000 672 250 213 94 557 82.9%2001 672 247 236 94 577 85.9%2002 677 254 219 93 566 83.6%2003 678 257 211 92 560 82.6%2004 698 263 195 92 550 78.8%
Forecast2010 785 290 235 109 634 80.8%2015 849 310 270 129 709 83.5%2025 985 335 340 139 814 82.6%
Note: 2001-2004 Airport Records. 1990-2000 FAA TAF.
BASED AIRCRAFTFLEET MIX PROJECTION
Knowing the aircraft fleet mix expectedto utilize the airport is necessary toproperly plan facilities that will bestserve the level of activity and the typeof activities occurring at the airport.The existing based aircraft fleet mix iscomprised of 203 single engine aircraft,32 multi-engine piston-powered aircraft,14 turboprop aircraft, nine jets and fivehelicopters. Understanding the fluidnature of based aircraft, these numbersare estimates based on airportdocumentation, staff interviews, andinterviews with the FBOs.
As detailed previously, the nationaltrend is toward a larger percentage ofsophisticated turboprop and jet aircraft
in the national fleet. Active multi-engine piston aircraft are expected to bethe only category of aircraft whichshows a decrease in annual growth.Growth within each based aircraftcategory at the airport has been deter-mined by comparison with nationalprojections (which reflect currentaircraft production) and consideration oflocal economic conditions.
The projected fleet mix of based aircraftat Johnson County Executive Airport isexpected to remain fairly constant. Theslight increase in single engine aircraftis the result of a combination of bothnatural growth and the introduction oflight sport aircraft. Along with nationaltrends, multi-engine piston aircraft areprojected to decline as a percentage.Both turboprop and jet aircraft are

OJC
-04M
P18
-2E
-5/1
6/05
Exhibit 2EAIRCRAFT DISTRIBUTION
0
202520152010200420001995
200
400
600
800
1,000
Aircraft Based at:
Johnson County Executive AirportNew Century Air CenterGardner Municipal AirportOther
LEGEND
8181
58589494
115115
145145
259259
213213
250250
9292
109109
290290
151151
139139
129129
340340
270270
335335310310
81
5894
115148148148
145
259
213
250
92235235235
109
290
151
140140140
171171171
139
129
340
270
335310
185185185
263263263

2-19
projected to remain constant or slightlyincrease as a percentage of the whole.The based aircraft fleet mix projection
for Johnson County Executive Airport issummarized in Table 2H.
TABLE 2HBased Aircraft Fleet Mix ProjectionsJohnson County Executive Airport
EXISTING FORECAST
Aircraft Type 2004 PercentShortTerm Percent
Inter.Term Percent
LongTerm Percent
Single Engine 203 77.19% 226 77.93% 243 78.39% 266 79.40%Multi-Engine 32 12.17% 31 10.69% 30 9.68% 28 8.36%Turbo-Prop 14 5.32% 16 5.52% 18 5.81% 20 5.97%Turbo-Jet 9 3.42% 10 3.45% 11 3.55% 12 3.58%Helicopters/Others 5 1.90% 7 2.41% 8 2.58% 9 2.69%Totals 263 100.00% 290 100.00% 310 100.00% 335 100.00%Source: Airport Commission; Coffman Associates analysis .
ANNUAL OPERATIONS
The airport traffic control tower(ATCT), located on the west side of theairport, collects information regardingaircraft operations (takeoffs orlandings). Aircraft operations arereported in four general categories: aircarrier, air taxi, general aviation, andmilitary. Air carrier operations arecertified under Federal AviationRegulations (F.A.R.) Part 121. Air taxioperations consist of the use of generalaviation aircraft for the “on-demand”commercial transport of persons andproperty in accordance with F.A.R. Part135. General aviation operationsinclude a wide range of activity frompersonal to business and corporate uses.Military operations include thoseoperations conducted by variousbranches of the U.S. military.
Aircraft operations are furtherclassified as local and itinerant. A localoperation is a takeoff or landingperformed by an aircraft that operates
within visual range of the airport, orwhich executes simulated approaches ortouch-and-go operations at the airport.Generally, local operations arecharacterized by training operations.Itinerant operations are thoseperformed by aircraft with a specificorigin or destination away from theairport. Typically, itinerant operationsincrease with business and commercialuse since business aircraft are usedprimarily to carry people from onelocation to another.
Table 2J summarizes historicaloperations at Johnson County ExecutiveAirport as tracked by the ATCT since1995. As is evident in the table, theairport’s total operations have variedfrom a low of 82,854 in 2003 to a high of105,296 in 1995, with an average of92,500 operations per year. In theprevious 10-year period, from 1985 to1994, there was an average of morethan 120,000 operations annually. Thisrepresents a 23 percent decline inoperations at the airport from one

2-20
period to the next. It should be notedthat the operational decreases appear to
be due in-part to decreasing localgeneral aviation operations.
TABLE 2JHistorical General Aviation OperationsJohnson County Executive Airport
Itinerant Operations Local OperationsPeriod Air Taxi GA Military Total GA Military Total Total
1995 36 45,649 26 45,711 59,500 85 59,585 105,2961996 39 45,555 188 45,782 40,202 290 40,492 86,2741997 85 45,213 115 45,413 48,277 211 48,488 93,9011998 169 45,248 114 45,531 44,169 126 44,295 89,8261999 195 46,751 153 47,099 53,676 147 53,823 100,9222000 215 43,584 121 43,920 49,122 89 49,211 93,1312001 223 45,349 118 45,690 43,377 209 43,586 89,2762002 386 47,723 100 48,209 48,067 26 48,093 96,3022003 384 46,456 229 47,069 35,753 32 35,785 82,8542004 336 50,421 261 51,018 36,477 109 36,586 87,604
Source: Airport Tower Records/TAF
Itinerant operations have remainedsteady over the past 10 years averagingapproximately 46,000 annually. Thelast two years have seen a slight upturnin itinerant operations, reaching 51,000in 2004. Local operations have shownfluctuation from nearly 60,000 in 1995,down to 37,000 in 2004. The last twoyears have represented the lowest localoperations counts in the last ten years.Overall, a trend has developed in whichitinerant operations are regularlyexceeding local operations. This trendis likely to continue.
GENERAL AVIATIONOPERATIONS
Distinguishing between local anditinerant general aviation operations isan important consideration for futurefacility planning. An airport with alarge percentage of local operations maybe in need of more aircraft storage units
or fuel facilities. A high level ofitinerant operations may be anindicator of a need for more transientapron parking, more overnight coveredstorage, or improved navigational aids.
There are a number of acceptedmethods for forecasting annualoperations at an airport. Perhaps themost common method is to take thenumber of forecast based aircraft andmultiply that number by industryaccepted operations totals based on thetype of airport. For a reliever airportwith flight schools, a planning standardof between 400 and 500 operations canbe expected. Thus, for the current year,one might expect 105,200 operations perbased aircraft (400 x 263). These trendshave not been realized for quite sometime. Because of this reality, multipleforecasts will be developed for bothitinerant and local general aviationoperations and then a reasonableforecast will be selected.

2-21
Itinerant Operations
Itinerant operations have beenrelatively steady since 1998, averagingapproximately 46,000 annually. Themarket share of itinerant operations forOJC, as a percentage of generalaviation itinerant operations at alltowered airports, has increasednoticeably, especially in 2004. In 1998,OJC’s market share was 0.2049 percentand in 2004 that percentage hadincreased to 0.2522 percent.
Utilizing historical operations records,three itinerant operations forecasts aredeveloped and presented in Table 2K.The first forecast maintains a constantshare (0.2522%) of itinerant operationsfor the airport. This results in 64,883annual itinerant operations by the longterm planning period. The secondforecast reflects an increasing share ofitinerant operations by the airport.This results in 57,100 itinerantoperations in the short term and 74,598operations by the long term.
TABLE 2KGeneral Aviation Itinerant Operations ForecastJohnson County Executive Airport
Year
OJC GAItinerant
OpsUS GA Itinerant
OpsMarket ShareItinerant Ops
BasedAircraft
Itinerant OpsPer BasedAircraft
1998 45,248 22,086,500 0.2049% 260 1741999 46,751 23,019,400 0.2031% 250 1872000 43,584 22,844,100 0.1908% 250 1742001 45,349 21,433,300 0.2116% 247 1842002 47,723 21,450,500 0.2225% 254 1882003 46,456 20,231,300 0.2296% 257 1812004 50,421 19,989,900 0.2522% 263 192
Constant Market Share of Total U.S. Itinerant Operations2010 55,394 21,961,600 0.2522% 290 1912015 59,323 23,519,000 0.2522% 310 1912025 64,883 25,723,600 0.2522% 335 194
Increase in Market Share of Total U.S. Itinerant GA Operations2010 57,100 21,961,600 0.2600% 290 1892015 63,501 23,519,000 0.2700% 310 1972025 74,598 25,723,600 0.2900% 335 215
Constant Itinerant GA Operations Per Based Aircraft2010 55,597 21,961,600 0.2532% 290 1922015 59,432 23,519,000 0.2527% 310 1922025 64,224 25,723,600 0.2497% 335 192
Selected Forecast2010 56,000 21,961,600 0.2550% 290 1932015 61,000 23,519,000 0.2594% 310 1972025 68,000 25,723,600 0.2643% 335 209
Source: FAA Aerospace Forecasts 2005-2016. Coffman Associates analysis.
The third forecast maintains thenumber of itinerant operations perbased aircraft (192) through theplanning period. This results in 55,597itinerant operations in the short term
and 64,224 annual itinerant operationsby the long term. The selected forecastrepresents a trend near the average ofeach of the forecasts.

2-22
Local Operations
Local operations averaged nearly48,000 annually between 1998 and2002. In 2003 and 2004, that numberhas dropped to approximately 36,000.Some of this decline can be attributed toan overall dip in national localoperations, but the rest is likelyrepresentative of the changing nature ofthe airport. More itinerant operationsand fewer local (training) flights arebeing performed.
Utilizing historical operations records,three local operations forecasts aredeveloped and presented in Table 2L.The first forecast maintains a constantshare (0.2440%) of all U.S. localoperations for the airport. This resultsin 46,335 annual itinerant operationsby the long term planning period. Thesecond forecast reflects a decreasingshare of U.S. local operations by theairport. This results in 36,954 localoperations in the short term and 37,977by the long term.
TABLE 2LGeneral Aviation Local Operations ForecastJohnson County Executive Airport
Year GA Local OpsUS GA Local
OpsMarket Share
Local OpsBased
AircraftLocal Ops PerBased Aircraft
1998 44,169 15,960,000 0.2767% 260 1701999 53,676 16,980,200 0.3161% 250 2152000 49,122 17,034,400 0.2884% 250 1962001 43,377 16,193,700 0.2679% 247 1762002 48,067 16,202,700 0.2967% 254 1892003 35,753 15,292,700 0.2338% 257 1392004 36,477 14,948,400 0.2440% 263 139
Constant Market Share of Total U.S. Local Operations2010 39,206 16,066,800 0.2440% 290 1352015 41,533 17,020,500 0.2440% 310 1342025 46,335 18,988,300 0.2440% 335 138
Decrease in Market Share of Total U.S. Local Operations2010 36,954 16,066,800 0.2300% 290 1272015 37,445 17,020,500 0.2200% 310 1212025 37,977 18,988,300 0.2000% 335 113
Constant Local Operations Per Based Aircraft2010 40,222 16,066,800 0.2503% 290 1392015 42,996 17,020,500 0.2526% 310 1392025 46,463 18,988,300 0.2447% 335 139
Selected Forecast2010 39,000 16,066,800 0.2427% 290 1342015 41,000 17,020,500 0.2409% 310 1322025 44,000 18,988,300 0.2317% 335 131
Source: FAA Aerospace Forecasts. Coffman Associates analysis.
The third forecast maintains thenumber of local operations per basedaircraft (139) through the planningperiod. This results in 40,222 localoperations in the short term and 46,463
local operations by the long term. Theselected forecast represents a trendnear the average of each of theforecasts.

2-23
A final consideration is the distributionbetween itinerant and local operationsat the airport. Typically, a relieverairport in a metropolitan area mayrealize a greater percentage of itinerantoperations. This trend has clearly beendeveloping over the past several yearsat Johnson County Executive Airport.In 1995, local operations accounted for56 percent of overall operations, whilein 2004, local operations only accountedfor 42 percent. With the selectedforecasts, in 2010 local operations willrepresent 41 percent of total annualoperations. By the long term planningperiod, local operations will representapproximately 39 percent. The generalaviation operations forecasts arepresented on Exhibit 2F.
AIR TAXI OPERATIONS
There was a significant increase in thenumber of operations in the air taxicategory in 1998. A large portion of thiscan be directly attributable to the startof operations by the life flight operatoron the airport. In 1997, there were 83operations and in 1998 there were 169,more than a 100 percent increase.Since 1998, the number of operationshas steadily increased. Othercontributing factors to the increase inair taxi operations are that fractionalownership operators and corporateflight departments have been utilizingthe airport with greater frequency. Inaddition, both FBOs operate charterservices. Summary operations Table2M includes a trend line projection forair taxi operations.
MILITARY OPERATIONS
Military operations account for a smallportion of operations at Johnson CountyExecutive Airport. There are no basedmilitary aircraft at the airport, butthere are a number of military aircraftbased at nearby New CenturyAirCenter. According to interviewswith airport staff, most of the militaryoperations are conducted by theChinook helicopters which are based atNew Century. These operations consistof minimal training exercises andrefueling. Because of the limitednumber of military operations from ahistorical perspective, a constant of 200itinerant and 100 local operations willbe included in the annual operationsforecast. This is also presented inTable 2M.
ANNUAL INSTRUMENTAPPROACHES (AIAs)
An instrument approach, as defined bythe FAA, is “an approach to an airportwith the intent to land an aircraft inaccordance with an Instrument FlightRule (IFR) flight plan, when visibility isless than three miles and/or when theceiling is at or below the minimuminitial approach altitude.” To qualify asan AIA, aircraft must land at theairport after following one of thepublished instrument approachprocedures during diminished weatherconditions. Forecasts of annualinstrument approaches (AIAs) provideguidance in determining an airport’srequirements for navigational aidfacilities. Practice or trainingapproaches do not count as annualAIAs.

2-24
TABLE 2MOperations Activity Forecast SummaryJohnson County Executive Airport
Actual Forecast2003 2004 2010 2015 2025
Annual Operations General Aviation Itinerant 46,456 50,421 56,000 61,000 68,000 Local 35,753 36,477 39,000 41,000 44,000Total General Aviation 82,209 86,898 95,000 102,000 112,000Air Taxi 384 350 650 850 1,250 Military Itinerant 229 261 200 200 200 Local 32 109 100 100 100TOTALOPERATIONS 82,854 87,618 95,950 103,150 113,550
Historical and forecast AIAs for theairport is summarized in Table 2N.Over the past seven years, AIAs havefluctuated between a high of 1,021 to alow of 484. The average has been 743yearly instrument approaches. Overthe same period, AIAs have averaged1.5 percent of itinerant operations. Thepast two years, totals have been abovethis average.
While AIAs can be partially attributedto weather, they may be expected toincrease as transient operations bymore sophisticated (and consequentlyproperly equipped aircraft) increasethrough the planning period. For thisreason, AIA projections consider anincreasing percentage of AIAs perannual itinerant operations reaching2.5 percent by 2025. The projectionsare also presented in Table 2N.
TABLE 2NAnnual Instrument Approach (AIAs) ProjectionsJohnson County Executive Airport
Year AIAsItinerant
Operations Ratio1998 1,021 45,248 2.26%1999 729 46,751 1.56%2000 484 43,584 1.11%2001 559 45,349 1.23%2002 527 47,723 1.10%2003 1,007 46,456 2.17%2004 827 50,421 1.64%
FORECASTSShort Term 980 56,000 1.75%Intermediate Term 1,220 61,000 2.00%Long Term 1,700 68,000 2.50%Source: FAA Terminal Area Forecast - Approach Operations

OJC
-04M
P18
-2F
-5/6
/05
Exhibit 2FLOCAL & ITINERANT
OPERATIONS FORECAST
0
20252015 20202010200520001995
20
40
60
80
100G
EN
ER
AL
AV
IAT
ION
OP
ER
AT
ION
S (x
1,0
00)
GE
NE
RA
L A
VIA
TIO
N O
PE
RA
TIO
NS
(x 1
,000
)
YEARSYEARS
HistoricalMarket Share of Total U.S. Itinerant Operations Constant Share Increasing ShareItinerant Operations Per Based Aircraft Constant ShareSelected Forecast
ITINERANT LEGEND
HISTORICALHISTORICALHISTORICAL FORECASTSFORECASTSFORECASTS
HistoricalMarket Share of Total U.S. Itinerant Operations Constant Share Decreasing ShareItinerant Operations Per Based Aircraft Constant ShareSelected Forecast
LOCAL LEGEND

2-25
SUMMARY
This chapter has provided demand-based forecasts of aviation activity atJohnson County Executive Airport overthe next 20 years. An attempt has beenmade to define the projections in termsof short, intermediate, and long termexpectations. Elements such as thelocal socioeconomic indicators,anticipated regional development, andhistorical aviation data, as well asnational aviation trends were all
considered when determining futureconditions.
The next step in the master planningprocess will be to assess the capacity ofexisting facilities, their ability to meetforecast demand, and to identifychanges to the airfield and/or landsidefacilities which will create a morefunctional aviation facility. A summaryof aviation forecasts is depicted onExhibit 2G.

OJC
-04M
P18
-2G
-5/5
/05
Exhibit 2GFORECAST SUMMARY
Single EngineMulti-EngineTurbo-PropTurbo-JetHelicopters/Others
Total Based Aircraft
2033214
95
263
226311610
7
290
2433018118
310
266282012
9
335
Peak MonthBusy DayDesign DayDesign Hour
BASED AIRCRAFT FORECASTSBASED AIRCRAFT FORECASTS
Itinerant Air Taxi General Aviation MilitaryTotal ItinerantLocal General Aviation MilitaryTotal Local
Total Operations
35050,421
26151,032
36,477109
36,586
87,618
65056,000
20056,850
39,000100
39,100
95,950
85061,000
20062,050
41,000100
41,100
103,150
1,25068,000
20071,450
44,000100
44,100
113,550
OPERATIONS FORECASTSOPERATIONS FORECASTS
9,800417316
54
10,804504360
63
11,615542387
68
12,786597426
75
PEAK OPERATIONSPEAK OPERATIONS
OPERATIONS FORECAST BASED AIRCRAFT FORECAST
AIA'sAIA's 827 980 1,220 1,700
Short Term Long Term2004CATEGORY IntermediateTerm
150150
120120
150
Long TermLong TermIntermediateIntermediateTermTerm
ShortShortTermTermShortTerm
20042004 LongLongTermTerm
ShortShortTermTermShortTerm
20042004
Op
erat
ion
s (x
1,0
00)
Op
erat
ion
s (x
1,0
00)
Long TermIntermediateTerm
2004 LongTerm
IntermediateIntermediateIntermediate2004
Op
erat
ion
s (x
1,0
00) 120
9090
6060
3030
0 0
5050
100100
150150
200200
250250
300300
350350
90
60
30
0 0
50
100
150
200
250
300
350
Bas
ed A
ircr
aft
Bas
ed A
ircr
aft
Bas
ed A
ircr
aft