2/22/2002richard zhu/logistics management1 benchmarking the supply chain
TRANSCRIPT
2/22/2002 Richard Zhu/Logistics Management 1
Benchmarking the Supply Chain
2/22/2002 Richard Zhu/Logistics Management 2
Outline
Benchmarking the supply chain Supply chain mapping and throughput efficiency Supplier and distributor benchmarking Supply-Chain Operations Reference Model Managing the supply chain of the future - the new
organizational paradigm The seven principles of supply chain management

2/22/2002 Richard Zhu/Logistics Management 3
What is Benchmarking?
Competitive Benchmarking isthe continuous measurement of the company’s products, services, processes and practices against the standards of best competitors and other companies who are recognized as leaders
Who are doing it?– Xerox started the practice in 1981, then became popular in all major
international companies, e.g. Motorola– There are international organizations specialized in this service, e.g.,
Global Benchmarking Council, American Productivity and Quality Center
– Asian Benchmarking Clearinghouse, Hong Kong Benchmarking Clearinghouse

2/22/2002 Richard Zhu/Logistics Management 4
Key Consideration Dimensions in Logistics Benchmarking
Logistics output, i.e., achieving customer service goals and customer’s perception of performance
Performance should be compared to the ‘best of the class’. Don’t limit your effort to players inside the industry only!
Logistics processes, i.e., not enough to just measure the output, processes which generate the output should also be measured!
Benefits of Benchmarking
Enable best practices from any industry to be creatively incorporated into the benchmarked process
Provide stimulation and motivation to professionals involved in implementing benchmarked findings
Breaks down ingrained reluctance to change (more receptive to ideas from another industry)
May identify technological breakthroughs from other industries (e.g. bar-coding)
2/22/2002 Richard Zhu/Logistics Management 6
Benchmarking Logistics Process
Key Steps Understand the structure of the process, i.e., process
mapping, process analysis, flow charts Identify the critical processing steps, i.e., process
bottlenecks, critical path Benchmark those critical processing steps against
‘best in class’ Measure performance at supplier/customer interface Derive the most effective processes and adopt the best
control and measurement tools

2/22/2002 Richard Zhu/Logistics Management 7
Understand the Process
CustomerOrder
Inventoryavailable
Creditchecking
Inventoryfile
Customerorder
status
Shippingcustomer
order
Processorder
Sales andmarketingfunction
Production
Accounting
InvoicingBackorder
Productionschedule
Materialprocurement
Shippingdocuments
Warehousewithdrawal
Transportscheduling

2/22/2002 Richard Zhu/Logistics Management 8
Identify Critical Points
Supplier Mgmt
Production Mgmt
Inventory Mgmt
Order fulfillment
Customer Service
CustomerOrder
Inventoryavailable
Creditchecking
Inventoryfile
Customerorder
status
Shippingcustomer
order
Processorder
Sales andmarketingfunction
Production
Accounting
InvoicingBackorder
Productionschedule
Materialprocurement
Shippingdocuments
Warehousewithdrawal
Transportscheduling

2/22/2002 Richard Zhu/Logistics Management 9
Benchmark against ‘Best in Class’
Supplier
Mgmt
Inventory
Mgmt
CustomerService
End user
Inventoryavailability
Perfect orderfulfillment
Consumersatisfaction
Productionplan vs actual
SupplierPerformance& Mat. Inv.
Service levelperformance
Prod.Mgmt
OrderFulfill

2/22/2002 Richard Zhu/Logistics Management 10
Practices Uncovered by Xerox via Non-competitive Benchmarking
Type of company Practice
Drug wholesalers Electronic ordering between store and distribution center
Appliance components Forklift handling of up to six appliances at once
Electrical components manufacturer
Automatic in-line weighing, bar code labeling, and scanning of packages
Photographic film manufacturer
Self-directed warehouse work teams
Catalogue fulfillment service bureau
Recording of item dimensions and weight to permit order-filling quality assurance based on calculated compared with actual weight

2/22/2002 Richard Zhu/Logistics Management 11
Supply Chain Mapping and Throughput Efficiency

2/22/2002 Richard Zhu/Logistics Management 12
Throughput Efficiency
Value-adding time is time spent doing something which creates a benefit for customer (i.e., the right product in the right place and at the right time)
Non-value-adding time is time spent on activities that can be eliminated with no reduction in benefit to the customer
Throughput efficiency is defined as:
Value-added time
End-to-end pipeline timeX 100

2/22/2002 Richard Zhu/Logistics Management 13
Value Added Through Time
2 106 14 18 22 26 30 34 38
10%
50%
100%
Sup
plie
r le
ad ti
me
Inbo
und
mat
eria
l
Pri
mar
y co
nver
sion
Sec
onda
ry c
onve
rsio
n
Pac
kagi
ng Shi
ppin
g
Dis
trib
utio
n ce
nter
pic
k
Shi
p to
cus
tom
er
Weeks in Supply Chain
% of Total Value AddedThroughput efficiency
is only around 25%!

2/22/2002 Richard Zhu/Logistics Management 14
Product Variety Through Time
2 106 14 18 22 26 30 34 38
5
25
50
Weeks in Supply Chain
No of Variety
Packaging
2nd Conversion

Supply Chain Map
A time-based representation of the processes and activities involved as the materials/products move through the supply chain.
Horizontal time – time spent in process (manufacturing, transit, assembly/packaging, etc.)– Time required for system to respond to increase in demand
Vertical time – time spent by product/WIP standing as inventory– (Horizontal + vertical time) = time required to ‘drain’ system of
inventory
Multi-component products – total pipeline determined by the slowest moving item

2/22/2002 Richard Zhu/Logistics Management 16
Pipeline Mapping
Commoditymarket
End user
Fiber store(20)
Spinning (15)
Yarn finishedstore (10)
Yarn store(5)
Knitting (10)
Grey stock(15)
(7)
Dyeing &finishing
(5) (5)
Raw material(10)
Finished fabric
Componentcutting (5)
Sewing (18)
Finished goodsstore (20)
DC (15)
Store (10)
(2)(2)
Spinning Fabric supplier Manufacturer Retailer
Length 60 days Volume 175 days
2/22/2002 Richard Zhu/Logistics Management 17
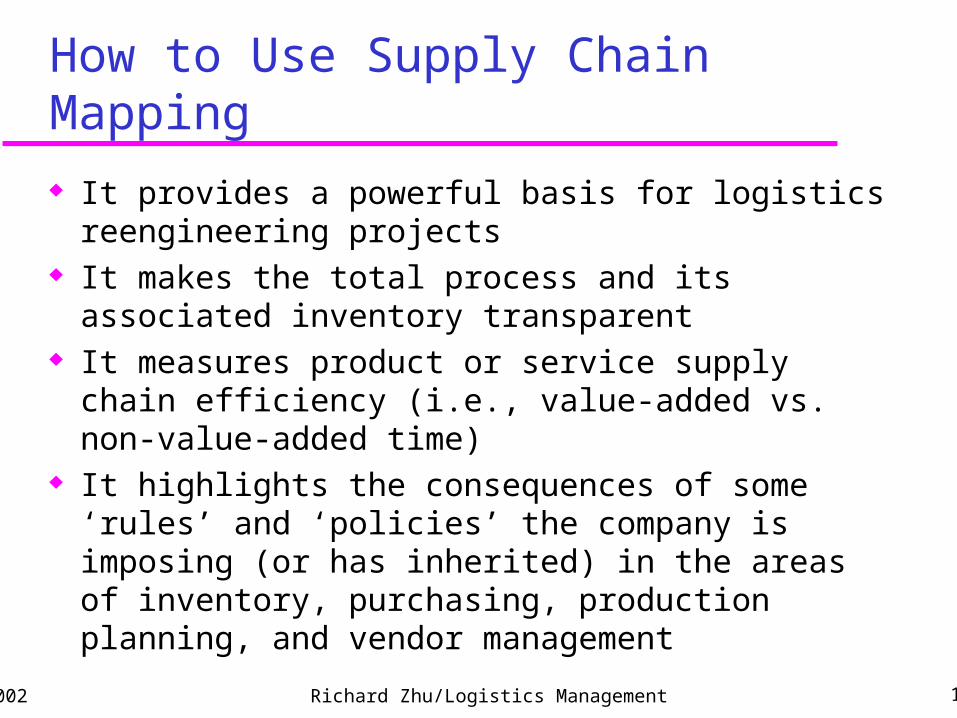
How to Use Supply Chain Mapping
It provides a powerful basis for logistics reengineering projects
It makes the total process and its associated inventory transparent
It measures product or service supply chain efficiency (i.e., value-added vs. non-value-added time)
It highlights the consequences of some ‘rules’ and ‘policies’ the company is imposing (or has inherited) in the areas of inventory, purchasing, production planning, and vendor management

2/22/2002 Richard Zhu/Logistics Management 18
Assignment?
Define the supply chains of the products or services for the company you are working for. And map out those supply chains suing the tools learnt in this class;
Calculate the supply chain efficiency of your company, and benchmark it against other players in the industry;
Identify issues in the supply chain and propose reengineering projects for the company.
2/22/2002 Richard Zhu/Logistics Management 19
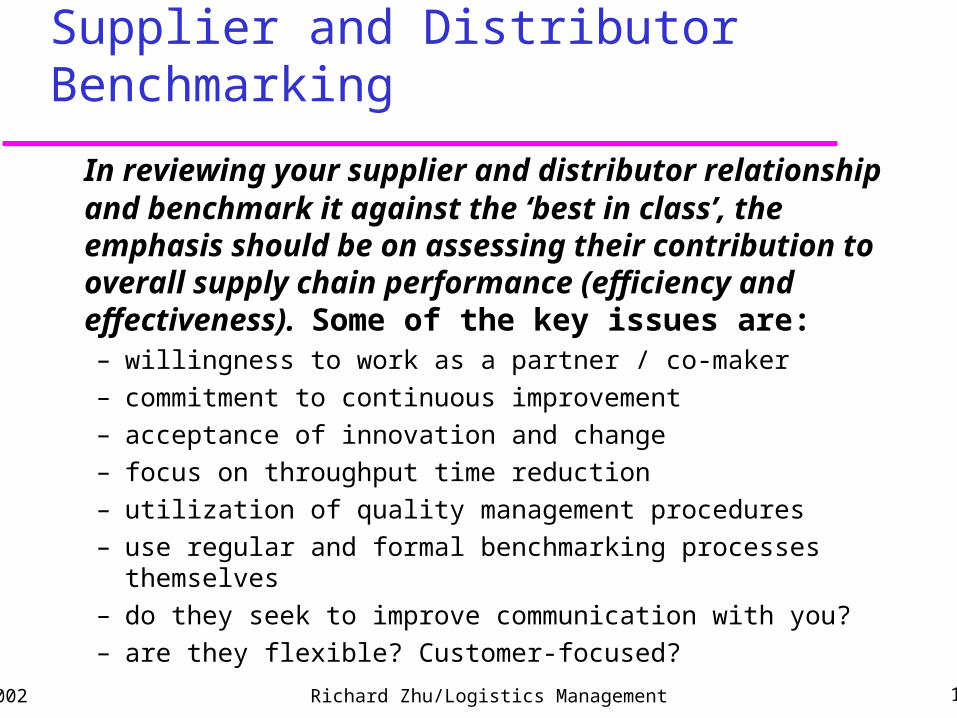
Supplier and Distributor Benchmarking
In reviewing your supplier and distributor relationship and benchmark it against the ‘best in class’, the emphasis should be on assessing their contribution to overall supply chain performance (efficiency and effectiveness). Some of the key issues are:– willingness to work as a partner / co-maker
– commitment to continuous improvement
– acceptance of innovation and change
– focus on throughput time reduction
– utilization of quality management procedures
– use regular and formal benchmarking processes themselves
– do they seek to improve communication with you?
– are they flexible? Customer-focused?
2/22/2002 Richard Zhu/Logistics Management 20
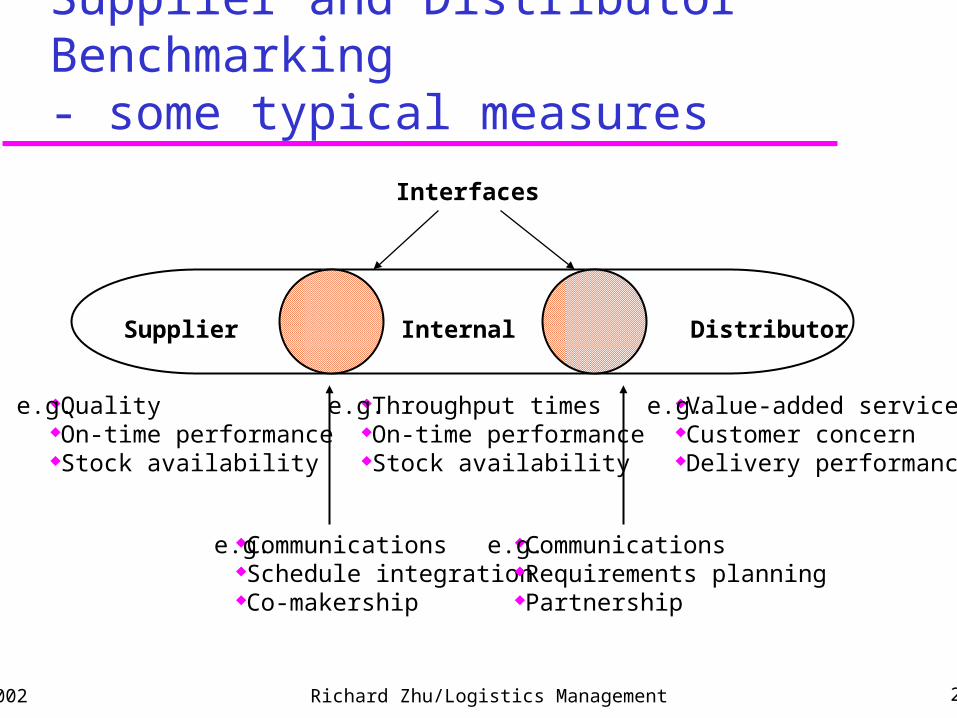
Supplier and Distributor Benchmarking - some typical measures
Supplier Internal Distributor
QualityOn-time performanceStock availability
CommunicationsSchedule integrationCo-makership
Throughput timesOn-time performanceStock availability
CommunicationsRequirements planningPartnership
Value-added servicesCustomer concernDelivery performance
e.g. e.g. e.g.
e.g. e.g.
Interfaces

2/22/2002 Richard Zhu/Logistics Management 21
Setting Benchmarking Priorities
Which processes and entities in the supply chain are of strategic importance
Which processes and entities have a high relative impact on the business economics (costs, revenue, asset performance, and human productivity)
Where there is a choice between ‘make’ and ‘buy’ (processes of high impact on performance /productivity and hard to source from suppliers)
Where there is internal readiness to change
2/22/2002 Richard Zhu/Logistics Management 22
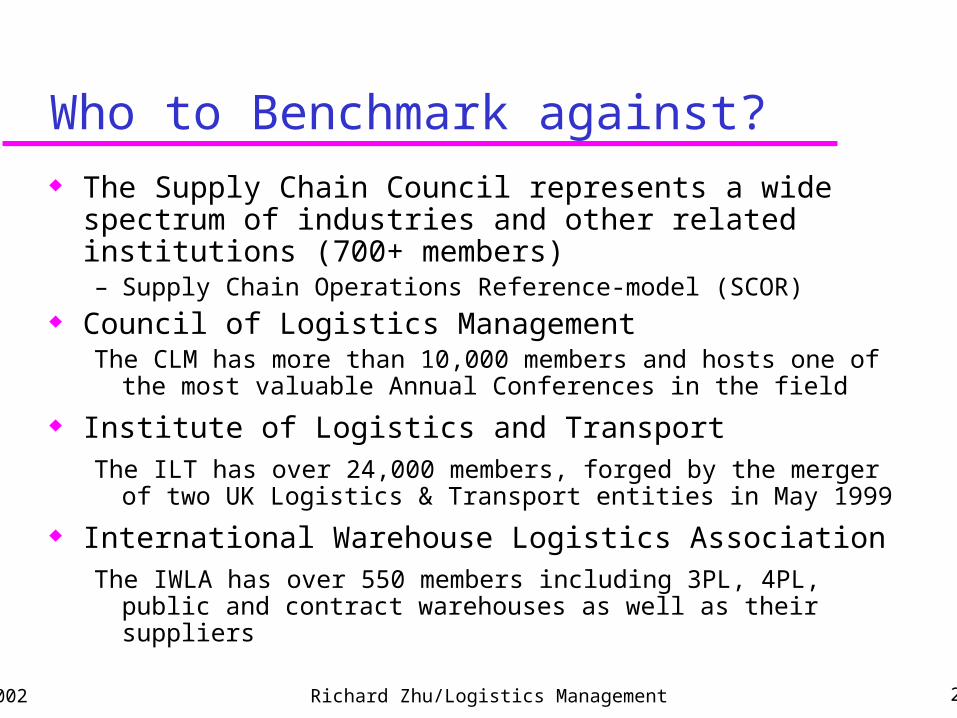
Who to Benchmark against? The Supply Chain Council represents a wide spectrum of
industries and other related institutions (700+ members)– Supply Chain Operations Reference-model (SCOR)
Council of Logistics ManagementThe CLM has more than 10,000 members and hosts one of the most
valuable Annual Conferences in the field
Institute of Logistics and TransportThe ILT has over 24,000 members, forged by the merger of two UK
Logistics & Transport entities in May 1999
International Warehouse Logistics AssociationThe IWLA has over 550 members including 3PL, 4PL, public and contract
warehouses as well as their suppliers

The Balance Scorecard
Identify key performance indicators for management to Identify key performance indicators for management to meet strategic goalsmeet strategic goals
1. Articulate logistics and supply chain strategy– To fit with overall corporate and marketing goals
2. What are the measurable outcomes of success?– ““Better, faster, cheaper”Better, faster, cheaper”
3. What are the processes that impact these outcomes?– Processes leading to better “order achievement”, shorter
pipelines, lower costs
4. What are the drivers of performance within these outcomes?
– Identify by “cause-and-effect” analysis, devise measurement indices

Supply Chain Operations Reference-model (SCOR)
Build around five major processes: Plan, Source, Make, Deliver and Return, as the cross-industry standard for supply chain management
Provides a standard way to measure supply chain performance and to use common metrics to benchmark against other organisations
– The model is regularly updated based on most recent study and research results. The latest version is V5.0.
– The Supply Chain Council provides regular workshop for its members to understand the model
– Website address: www.supply-chain.org

2/22/2002 Richard Zhu/Logistics Management 25
What is a Process Reference Model?
Process reference models integrate the well-known concepts of business process reengineering, benchmarking, and process measurement into a cross-functional framework. A Process Reference Model can:– Capture the "as-is" state of a process and derive the desired
"to-be" future state
– Quantify the operational performance of similar companies and establish internal targets based on "best-in-class" results
– Characterize the management practices and software solutions that result in "best-in-class" performance

2/22/2002 Richard Zhu/Logistics Management 26
What Does a Process Reference Model Contains?
Standard descriptions of management processes A framework of relationships among the standard
processes Standard metrics to measure process performance Management practices that produce best-in-class
performance Standard alignment to software features and
functionality

2/22/2002 Richard Zhu/Logistics Management 27
How Can a Process Reference Model be Used?
Once a Complex Management Process is captured in Standard Process Reference Model form, it can be:
Implemented purposefully to achieve competitive advantage
Described unambiguously and communicated Measured, managed, and controlled Tuned and re-tuned to a specific purpose
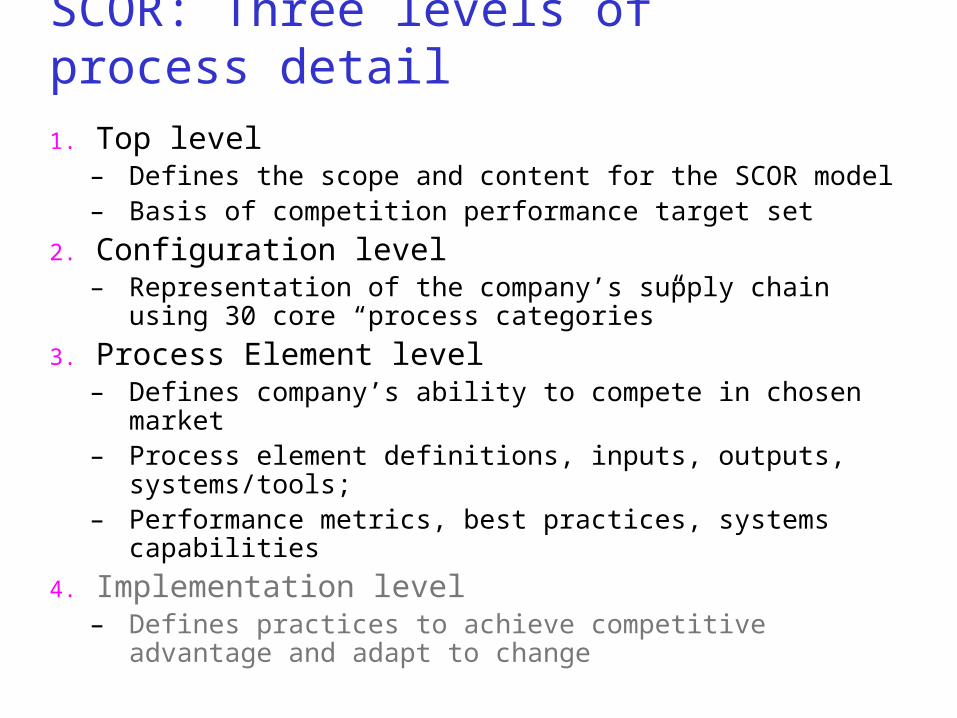
SCOR: Three levels of process detail
1. Top level– Defines the scope and content for the SCOR model– Basis of competition performance target set
2. Configuration level– Representation of the company’s supply chain using 30
core “process categories”
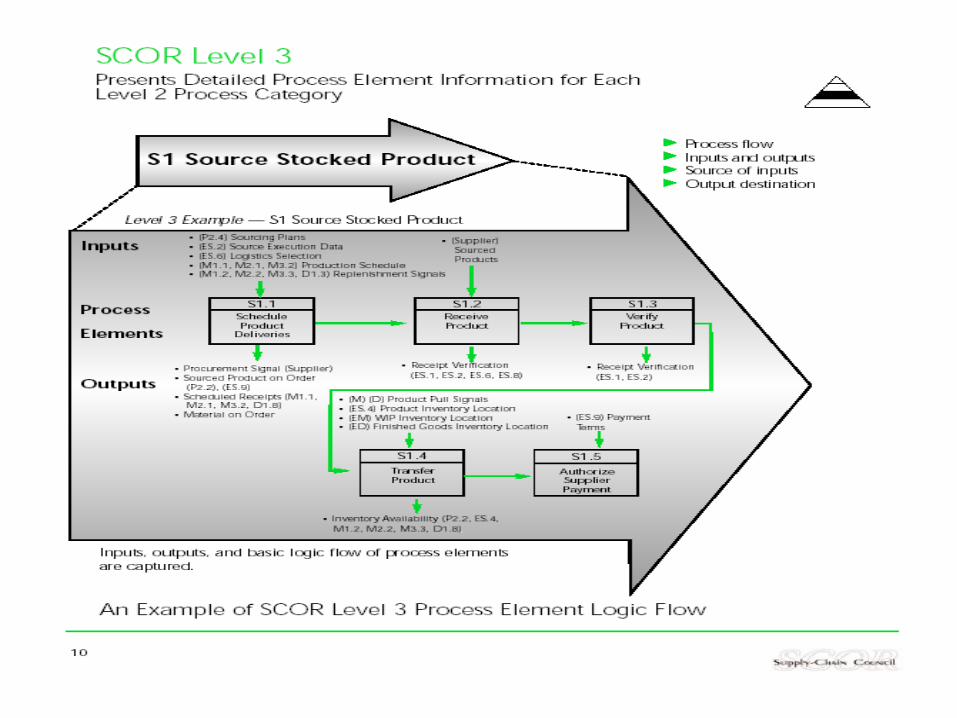
3. Process Element level– Defines company’s ability to compete in chosen market– Process element definitions, inputs, outputs, systems/tools;– Performance metrics, best practices, systems capabilities
4. Implementation level– Defines practices to achieve competitive advantage and
adapt to change

SCOR Level 1: Core Process Definitions
Plan– Processes that balance aggregate supply and demand to develop
strategies to best meet sourcing, production and delivery requirements Source
– Processes that procure goods and services to meet demand Make
– Processes that transform product to a finished state to meet planned or actual demand
Deliver– Processes that provide finished goods or services to meet demand (order
management, transportation, distribution) Return
– Processes associated with returning or receiving returned products; post-delivery customer support

SCOR Level 2:
Each SCOR process can be further described by process type: Planning
– Balance aggregated demand and supply– Occur at regular intervals, consistent planning horizon– Contribute to supply-chain response time
Execution– Scheduling/sequencing, transform product and/or moving product– Contribute to order fulfilment cycle time
Enable– Prepares, maintains, or manages information or relationships on which
planning and execution processes rely
““SCOR Configuration Toolkit” SCOR Configuration Toolkit” – 30 categories of process-type combinations


SCOR configurability
A supply-chain configuration is driven by: Plan levels of aggregation and information sources Source locations and products Make production sites and methods Deliver channels, inventory deployment and products Return locations and methodsSCOR must accurately reflect how a supply-chain’s configuration
impacts management processes and practices.
– Each intersection of two execution processes (Source-Make-Deliver) is a “link” in the supply chain
– Each process is a customer of the previous process and a supplier to the next
– Every link requires an occurrence of a plan process category

Configuring supply chain threads
Each thread can be used to describe, measure, and evaluate supply-chain configurations.
1. Select the business entity to be modelled (e.g. product set)2. Illustrate the physical locations of:
– Production facilities (Make)– Distribution activities (Deliver)– Sourcing activities (Source)
3. Illustrate primary point-to-point material flows using “solid line” arrows
4. Place the most appropriate Level 2 execution process categories to describe activities at each location
5. Describe each distinct supply-chain “thread” (the set of Source-Make-Deliver supply-chain processes) to understand common, and distinct, execution process categories
6. Place planning process categories (using dashed lines) to show links with execution processes

2/22/2002 Richard Zhu/Logistics Management 35
Summary of Supply Chain Operations Reference-model (SCOR)
Metric type Outcomes Diagnostics
CustomerSatisfaction / Quality
1. Perfect order fulfillment2. Customer satisfaction3. Product quality
9. Delivery to commit date10. Warranty costs, returns and
allowances11. Customer inquiry response
time
Time 4. Order fulfillment leadtime
12. Source/Make cycle time13. Supply chain response time14. Production plan
achievement
Costs 5. Total logistics costs 15. Value added productivity
Assets 6. Cash-to-cash cycle time7. Inventory days of supply8. Asset performance
16. Forecast accuracy17. Inventory obsolescence18. Capacity utilization

2/22/2002 Richard Zhu/Logistics Management 36
Managing the Supply Chain of the Future - the new organizational paradigm

2/22/2002 Richard Zhu/Logistics Management 37
CLM Study: How the Leading-edge Firms Manages Logistics?
Concerning organization structure, leading-edge firms:– Have had formal logistics organization longer
– Are more apt to have logistics headed by an officer-level executive
– Adopt a more fluid approach to logistics organization and encourage frequent re-org to take advantage of opportunities that arise
– Tend to favor centralized control
– Are more apt to execute boundary-spanning or externally-oriented logistics functions
2/22/2002 Richard Zhu/Logistics Management 38
CLM Study: How the Leading-edge Firms Manages Logistics?
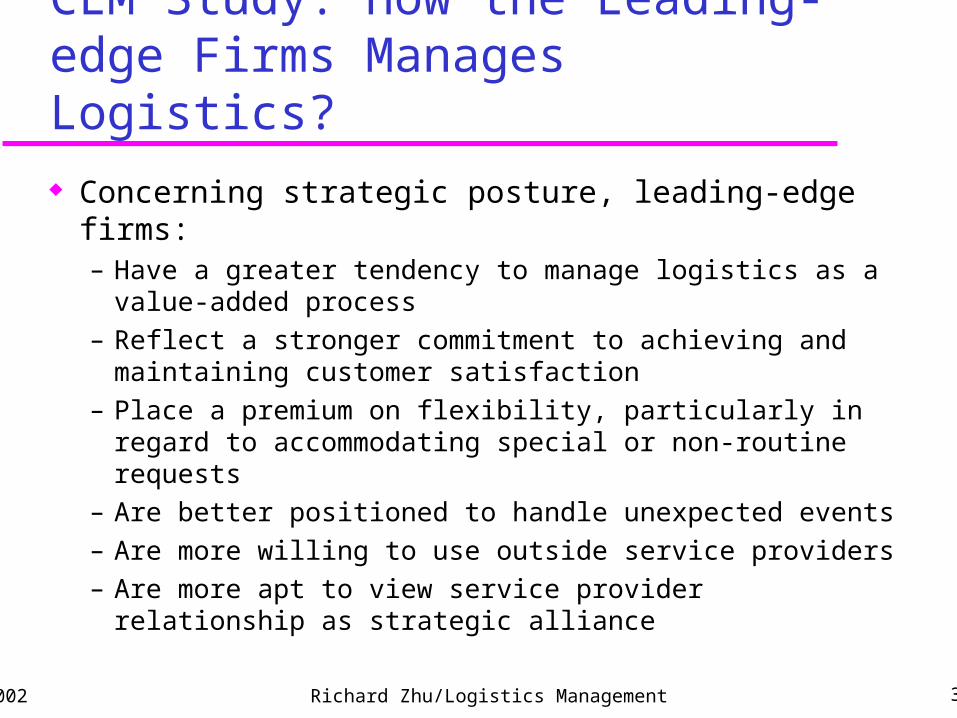
Concerning strategic posture, leading-edge firms:– Have a greater tendency to manage logistics as a value-
added process
– Reflect a stronger commitment to achieving and maintaining customer satisfaction
– Place a premium on flexibility, particularly in regard to accommodating special or non-routine requests
– Are better positioned to handle unexpected events
– Are more willing to use outside service providers
– Are more apt to view service provider relationship as strategic alliance
2/22/2002 Richard Zhu/Logistics Management 39
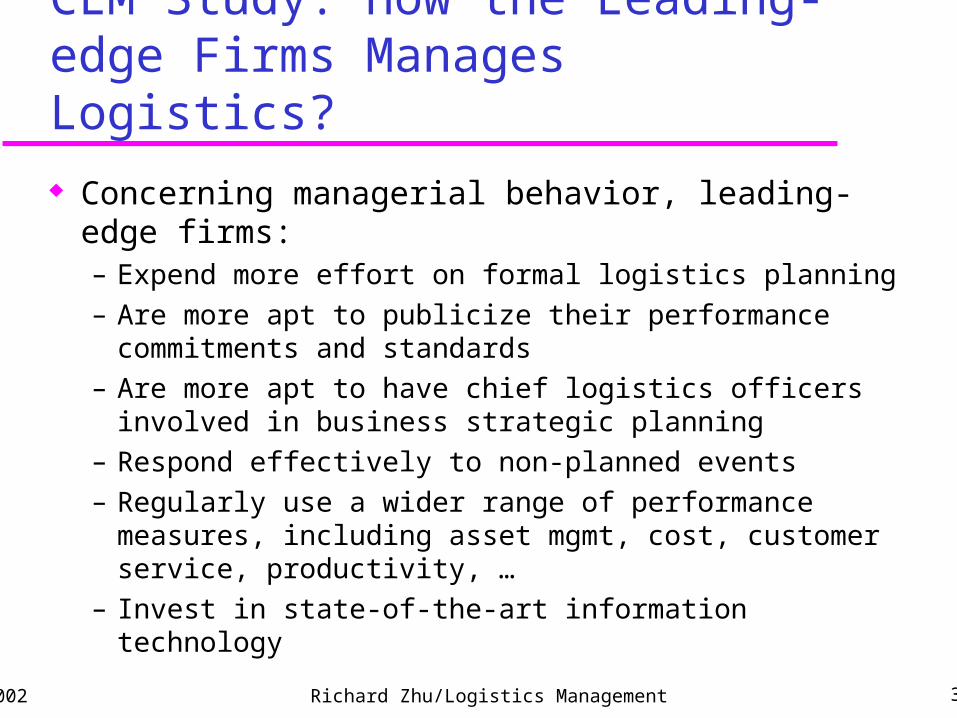
CLM Study: How the Leading-edge Firms Manages Logistics?
Concerning managerial behavior, leading-edge firms:– Expend more effort on formal logistics planning
– Are more apt to publicize their performance commitments and standards
– Are more apt to have chief logistics officers involved in business strategic planning
– Respond effectively to non-planned events
– Regularly use a wider range of performance measures, including asset mgmt, cost, customer service, productivity, …
– Invest in state-of-the-art information technology

2/22/2002 Richard Zhu/Logistics Management 40
New Logistics Organization Paradigm
From functions to processes From profit to performance From products to customers From inventory to information From transaction to relationship

2/22/2002 Richard Zhu/Logistics Management 41
What Does It Take to Manage the Supply Chain of the Future?Paradigm Shift Leading to Competence Required
From functions toprocesses
Integral management ofmaterials and goods flow
Cross-functional manage-mentand planning skills
From products tocustomers
Focus on markets and thecreation of customer value
Ability to define, measure andmanage service requirementsby market segment, i.e.,‘perfect order achievement’
From revenue toperformance
Focus on the keyperformance drivers ofprofit
Understanding of the ‘cost-to-serve’ and time-basedperformance indicators
From inventory toinformation
Demand-basedreplenishment and quickresponse systems
Information systems andtechnology
From transactions torelationships
Supply chain partnership Relationship management and‘win-win’ orientation

2/22/2002 Richard Zhu/Logistics Management 42
The Seven Principles of Supply Chain Management

2/22/2002 Richard Zhu/Logistics Management 43
Seven Principles of Supply Chain Management
Segment customers based on service needs Customize the logistics network Listen to signals of market demand and plan
accordingly Differentiate product closer to the customer Source strategically Develop a supply chain-wide technology strategy Adopt channel-spanning performance measures
2/22/2002 Richard Zhu/Logistics Management 44
Summary of Learning Objectives
Benchmarking the supply chain Supply chain mapping and throughput efficiency Supplier and distributor benchmarking SCOR Managing the supply chain of the future - the new
organizational paradigm The seven principles of supply chain management

References
Christopher, M., Logistics and Supply Chain Management, 2nd edition, FT-PrenticeHall, 1998.
Kaplan, R.S. and Norton, D.P., The Balanced Scorecard, Harvard Business School Press, 1996.
“Supply-Chain Operations Reference-model: Overview of SCOR Version 5.0”, Supply Chain Council, Inc., 2001.
Shapiro, B., V.K. Rangan and J.V. Sviokla, “Staple yourself to an order”, Harvard Business Review, July-August, 1992.