2016 oil & gas annual report - dpr.gov.ng · destination for bonny light and other nigerian...
TRANSCRIPT
1 | P a g e
2016 OIL & GAS ANNUAL REPORT

2 | P a g e
Table of Contents
1 REMARKS FROM DIRECTOR OF PETROLEUM RESOURCES ________________________________6
2 REGULATORY STRUCTURE OF THE NIGERIAN OIL AND GAS INDUSTRY______________________8
3 ADAPTATION OF NEW TECHNOLOGY IN THE OIL AND GAS INDUSTRY ______________________9
3.1 INTRODUCTION _________________________________________________________________ 9
3.1.1 Objective of Technology Qualification ______________________________________________________ 9
3.1.2 Scope of Technology Qualification _________________________________________________________ 9
3.2 TECHNOLOGY ADAPTATION PROCESS ______________________________________________ 10
3.2.1 Overview _____________________________________________________________________________ 10
3.2.2 Stages of Technology Qualification Process _________________________________________________ 12
4 STATISTICAL DATA _____________________________________________________________ 15
4.1 UPSTREAM ___________________________________________________________________ 15
4.1.1 Concessions __________________________________________________________________________ 15
4.1.2 Speculative Survey Data Status ___________________________________________________________ 25
4.1.3 Marginal Fields ________________________________________________________________________ 28
4.1.4 Reserves _____________________________________________________________________________ 29
4.1.5 Exploration ___________________________________________________________________________ 30
4.1.6 Rig Activities __________________________________________________________________________ 30
4.1.7 Drilling and Well completion _____________________________________________________________ 30
4.1.8 Production ___________________________________________________________________________ 31
4.1.9 Nigerian Crude / Condensate Export _______________________________________________________ 38
4.2 DOWNSTREAM ________________________________________________________________ 42
4.2.1 Refinery Activities _____________________________________________________________________ 42
4.2.2 Petroleum Product Importation __________________________________________________________ 46
4.2.3 Petroleum Products Importation / Local Production __________________________________________ 51
4.2.4 Petroleum Products Average Pricing _______________________________________________________ 52
4.2.5 Retail Outlets _________________________________________________________________________ 52
4.2.6 Petrochemicals ________________________________________________________________________ 56
4.2.7 Lubricant Blending Plants _______________________________________________________________ 56
4.3 GAS _________________________________________________________________________ 58
4.3.1 Domestic Gas Supply Obligation (DGSO) ____________________________________________________ 58
4.3.2 Gas Production And Utilization ___________________________________________________________ 60
4.3.3 In Pursuit Of Increased Domestic Utilization Of LPG In Nigeria __________________________________ 62
4.3.4 Gas Infrastructures _____________________________________________________________________ 66
4.3.5 Major Gas Projects _____________________________________________________________________ 70
4.3.6 Gas Pipelines _________________________________________________________________________ 72
4.4 HEALTH, SAFETY AND ENVIRONMENT ______________________________________________ 78
4.4.1 Accident Report _______________________________________________________________________ 78
4.4.2 Spill Incidence Report __________________________________________________________________ 81
4.5 REVENUE PERFORMANCE ________________________________________________________ 88
4.5.1 The Role of Value Monitoring & Benchmarking (VMB) of Oil & Gas Projects and Operations in Nigeria _ 88
5 Glossary of Terms _____________________________________________________________ 90

3 | P a g e
List Of Tables Table 1: Status of Oil Mining Leases (OMLs) ................................................................................................... 15
Table 2: Status of Oil Prospecting Licenses (OPLs) ........................................................................................ 19
Table 3: Summary Of Acreage Situation As At 31 December 2016 ................................................................. 24
Table 4: Multi-Client Data Projects Status as at December 2016 ................................................................... 25
Table 5: Contract Signed by Speculative Survey Companies in Nigeria ......................................................... 26
Table 6: List of Marginal Fields ........................................................................................................................ 28
Table 7: Oil and Gas Reserves .......................................................................................................................... 29
Table 8: Seismic Data Acquisition .................................................................................................................... 30
Table 9: Active Rig Trend by Terrain ................................................................................................................ 30
Table 10: Rig Disposition by Terrain from January to December 2016 .......................................................... 30
Table 11: Number of Wells drilled by Terrain ................................................................................................... 30
Table 12: Number of Wells drilled by Class ..................................................................................................... 31
Table 13: Wells Drilled by Contract and Class in 2016 ...................................................................................... 31
Table 14: 2016 Production Performance# ........................................................................................................ 31
Table 15: 2016 Monthly Production# ................................................................................................................ 32
Table 16: 2016 Petroleum Production by Contract* ........................................................................................ 33
Table 17: 2016 Fields Summary ......................................................................................................................... 34
Table 18: 2016 Summary of Production Deferments ...................................................................................... 35
Table 19 : 2016 Monthly Summary of Stabilized Crude / Condensates Volumes by Streams# ...................... 36
Table 20: Summary of Stabilized Crude / Condensates Volumes by Streams# .............................................. 37
Table 21: Summary of Crude / Condensate Export by Crude Stream 2016 .................................................... 38
Table 22: Summary of Crude / Condensate Export ......................................................................................... 40
Table 23: Average Price of Nigeria's Crude Streams as Quoted by Platts in USD# ....................................... 41
Table 24: Refinery Plants in Nigeria ................................................................................................................. 42
Table 25: Refinery Capacity Utilization ........................................................................................................... 42
Table 26: 2016 PMS Production Summary ....................................................................................................... 42
Table 27: PMS Production by Refineries ......................................................................................................... 43
Table 28: 2016 AGO Production Summary ....................................................................................................... 43
Table 29: AGO Production by Refineries ......................................................................................................... 43
Table 30: 2016 DPK Production Summary ....................................................................................................... 44
Table 31: DPK Production by Refineries .......................................................................................................... 44
Table 32: Disposition of Licensed Refining Companies in Nigeria ................................................................. 45
Table 33: Petroleum Products Volumes as per Import Permits Issued (Metric Tonnes) * ........................... 46
Table 34: 2016 Petroleum Products Volumes as per Import Permits Issued (Metric Tonnes) * .................. 47
Table 35: Petroleum Products Import Summary, Metric Tonnes ................................................................. 48
Table 36: 2016 Petroleum Products Import Summary, Metric Tonnes.......................................................... 48
Table 37: Summary of 2016 Petroleum Products Importation by Market Segment, Metric Tonnes ........... 49
Table 38: Summary of Petroleum Products Importation by Market Segment (2010 – 2016) ..................... 50
Table 39: Petroleum Products Average Consumer Price Range (Naira per Litre) ........................................ 52
Table 40: Retail Outlets Summary - Filling Stations Count ............................................................................. 52
Table 41: Storage Capacities of Retail Outlets by States ................................................................................ 54
Table 42: Petrochemical Plants ........................................................................................................................ 56
Table 43: List of Licensed Base Oil Marketers and Storage Capacities. ........................................................ 56
Table 44: Domestic Gas Supply Obligation Performance ............................................................................... 58

4 | P a g e
Table 45: Domestic Gas Supply Obligation From 2014-2017 for E&P Companies .......................................... 59
Table 46: Summary of 2016 Gas Production and Utilization .......................................................................... 60
Table 47: Summary of Gas Production and Utilization ................................................................................... 60
Table 48: Major Gas Facilities ........................................................................................................................... 66
Table 49: Gas Processing Plant Projects .......................................................................................................... 70
Table 50: 2016 Accident Report – Industry-wide ............................................................................................ 78
Table 51: 2016 Accident Report – Upstream ................................................................................................... 78
Table 52: 2016 Accident Report – Downstream .............................................................................................. 78
Table 53: Accident Report – Industry-wide ..................................................................................................... 79
Table 54: Accident Report – Upstream ........................................................................................................... 80
Table 55:Accident Report – Downstream ....................................................................................................... 80
Table 56: 2016 Spill Incidence Report .............................................................................................................. 81
Table 57: Spill Incidence Summary .................................................................................................................. 82
Table 58: Produced Water Volumes Generated.............................................................................................. 82
Table 59: 2016 Drilling Waste Volumes ............................................................................................................ 82
Table 60: 2016 Accredited Waste Managers ................................................................................................... 83
Table 61: Summary Of Waste Management Facilities .................................................................................... 84
Table 62: 2016 Oil Spill Contingency Plan Activation ...................................................................................... 84
Table 63: Number Of Petitions Received In 2016 ............................................................................................ 85
Table 64: Request For Approvals – Chemicals ................................................................................................ 85
Table 65: Summary of Accredited Laboratories ............................................................................................. 85
Table 66: 2016 Approved Production Chemicals Inventory ........................................................................... 85
Table 67: Summary of Drilling Chemicals ........................................................................................................ 85
Table 68: Applications For Environmental Restoration Services ................................................................... 86
Table 69: Environmental Studies# .................................................................................................................... 86
Table 70: Approved Safety And Medical Emergency Training Centres ......................................................... 86
Table 71: Offshore Safety Permit (OSP) Summary .......................................................................................... 87
Table 72: Revenue Performance Summary ..................................................................................................... 88
List of Figures
Figure 1: The Nigeria Oil and Gas Industry ......................................................................................................... 8
Figure 2: High-level Work Flow for Evaluating Novel Technologies in DPR .................................................. 11
Figure 3: Approved Criteria .............................................................................................................................. 11
Figure 4: Stage 1 Technology Appraisal ........................................................................................................... 12
Figure 5: Distribution of Nigeria Concession by Lease Contract Type ........................................................... 24
Figure 6: Concession Map showing Open Blocks & PGS 3D Seismic ............................................................. 27
Figure 7: Concession Map showing Open Blocks & Polarcus 2D Seismic Lines ............................................ 27
Figure 8: Concession Map showing Open Blocks & TGS-Petrodata 2D Seismic ............................................ 27
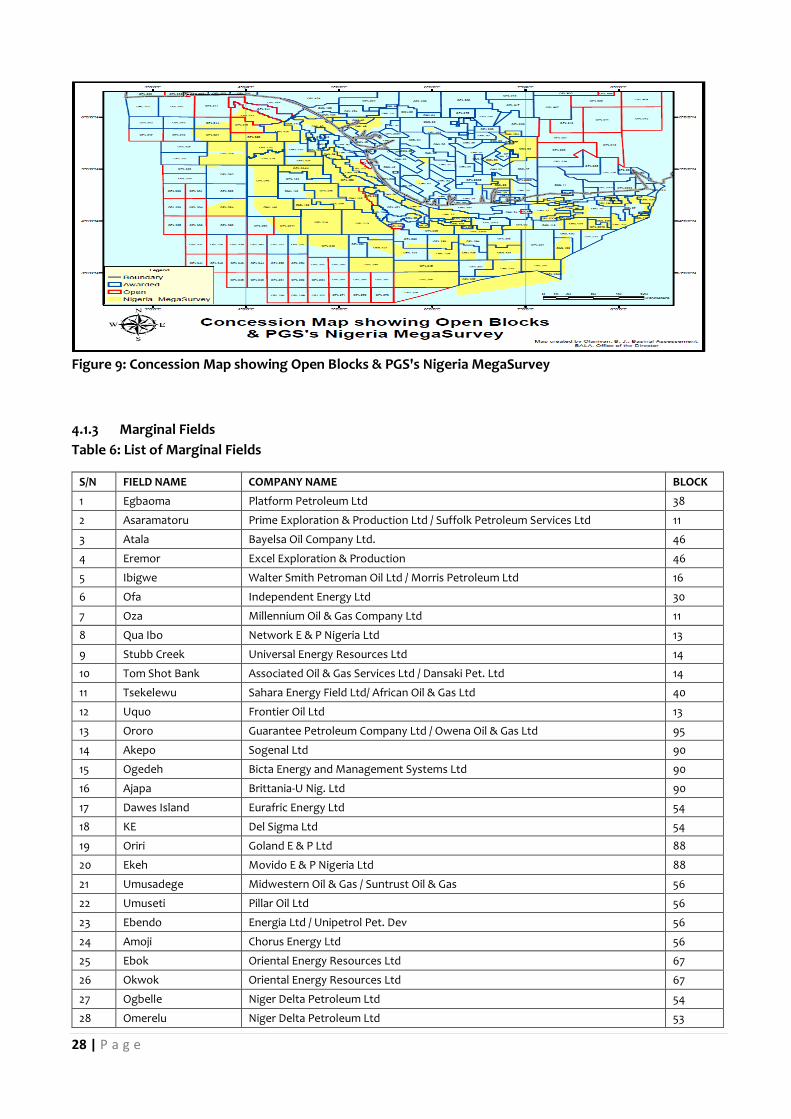
Figure 9: Concession Map showing Open Blocks & PGS's Nigeria MegaSurvey ........................................... 28
Figure 10: Marginal Fields Map, 2002 - 2004 ................................................................................................... 29
Figure 11: 2016 Average Monthly Production .................................................................................................. 33
Figure 12: 2016 Oil Production on Company Basis........................................................................................... 33
Figure 13:Percentage Distribution of Production (BOPD) .............................................................................. 34
Figure 14: Average Price of Nigeria’s Crude Streams as Quoted by Platts .................................................... 41

5 | P a g e
Figure 15: PMS Local Production vs Importation ............................................................................................ 51
Figure 16: AGO Local Production vs Importation ............................................................................................ 51
Figure 17: DPK Local Production vs Importation ............................................................................................ 51
Figure 18: Gas Utilized Versus Gas Flared ........................................................................................................ 61
Figure 19: Domestic Gas Sales Versus Sales to NLNG (Export) ...................................................................... 62
Figure 20: Gas Pipeline Map ............................................................................................................................. 72
Figure 21: NGTNC Schematic ............................................................................................................................ 73
Figure 22: Regulatory Framework ................................................................................................................... 74
Figure 23: Contractural Framework ................................................................................................................. 74
Figure 24: Commerical Operations .................................................................................................................. 75
Figure 25: Where We Are ................................................................................................................................. 77
Figure 26: Fatal Versus Non Fatal Incidents .................................................................................................... 79
Figure 27: Downstream Versus Upstream Incidents ...................................................................................... 80

6 | P a g e
1 REMARKS FROM DIRECTOR OF PETROLEUM RESOURCES
The global crude oil market has been relatively stable in the last few months but going by past
experience, the stability is not expected to be a permanent fixture. The Nigerian petroleum sector
has been especially affected by the disruption occasioned by the 2014 price crash. This is due
mainly to the mistaken assumption that the pre-2014 bullish market could hold much longer as
the world seemed to be in the threshold of post peak-oil era. Novel technology especially on
extraction of shale oil opened the fresh vistas for unconventional oil with significant destabilizing
effects on conventional producers like Nigeria.
Two major lessons are discernible from the surge in oil production from the unconventional
sources. First, although it is impossible to exactly forecast how technology would impact
producibility of the remaining global oil reserves, we are bound to witness more technological
surprises in the near future that would lead to the coming onstream of hitherto discovered but
unproducible reserves. Technology would also help to find and produce new reserves from tough
environments. The future of oil will therefore continually be influenced by access to new reserves
made possible by technological innovation. Second and important lesson is that renewable
energy will increasingly play bigger roles in the future global energy mix. The environmental
issues, often showcased by the polar bear on a melting Artic ice, will not go away. The depleting
Artic ice and concerns on the ozone layer will continue to put the green energy agenda in the
front burner of global energy politics challenging the dominance of oil in the energy market.
The new oil from unconventional frontiers and the rising profile of green energy are posing
considerable challenges and opportunities for Nigeria. More noticeably, increased access to
unconventional oil reserves in the shale sector and the lifting of the self-imposed US oil export
embargo have significantly shrunk demands for Nigerian oil in the United States, a former prime
destination for Bonny Light and other Nigerian crude blends. The US has since changed from
being a major market to a being major competitor for markets across the globe. Nigeria like other
conventional oil producers around the world is also grappling with the growing competition for
market space from the renewable energy sector.
Those market challenges also have ingrained in them new vistas of opportunities on oil and gas
activities in Nigeria. Particularly, the unfolding realities are dictating the need for more
institutional and operational efficiency to effectively compete in the shrinking market place and

7 | P a g e
for new investment opportunities to explore and develop new prospects. To this end the Senate
has recently passed the Petroleum Industry Governance Bill (PIGB) and is now awaiting passage
in the House of Representatives. Speedy promulgation of this law and the pending bills, including
on fiscal governance of the industry would situate the Nigerian oil and gas sector on better
pedestal to compete in the increasingly complex global energy terrain.
The Nigerian oil and gas sector is also renewing efforts to improve on efficiency to reduce
production costs across terrain. The industry has already established an impressive fabrication
and integration infrastructure in-country on the back of Egina, on which future deep water
projects could latch to reduce cost. The Value Monitoring and Benchmarking (VMB) of Oil and
Gas Projects and Operations in Nigeria is an initiative by the Department of Petroleum Resources
(DPR) that is aimed at strategically aligning technical and economic equations that govern
industry businesses and activities in line with extant laws. It introduces unique cost coding
indicators for empirical analysis of oil and gas projects and operations, launching an industry that
exude operational excellence and performance efficiencies with higher degree of costs
predictability. The overall effect of this will be the shrinking of the uncertainties usually associated
with project costs in the industry, which will cause a revisit to previously suspended projects.
Furthermore, the Department of Petroleum Resources, in a drive to improve regulatory efficiency
across the value-chain, has embarked on implementation of strategic programs, such as the
automation of all business processes and comprehensive upgrade of its standard operating
procedures to deliver prompt and quality service to the industry.
This annual activity report on the Nigerian Oil and Gas Industry is the 4th Edition since the initiative
resumed in 2013. It aims to provide critical information to the public on the activities of the
industry in the year under review. I recommend it to our numerous stakeholders.
M. D. B. Ladan
8 | P a g e
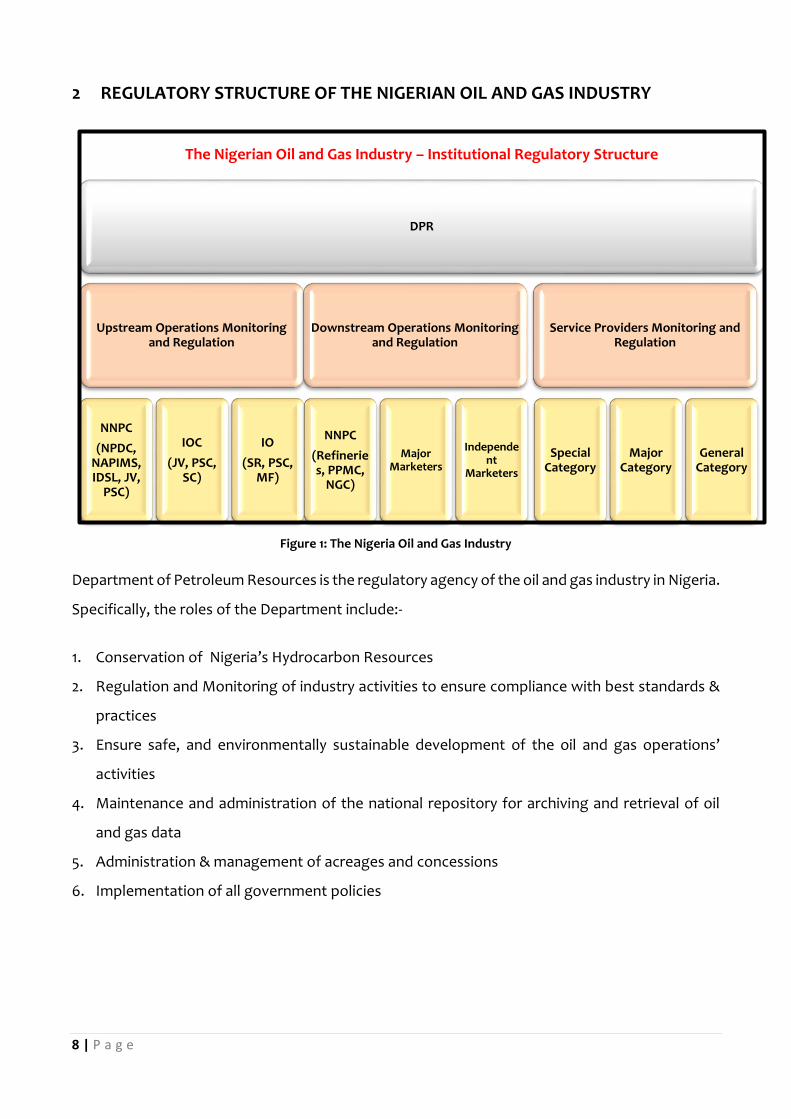
2 REGULATORY STRUCTURE OF THE NIGERIAN OIL AND GAS INDUSTRY
Figure 1: The Nigeria Oil and Gas Industry
Department of Petroleum Resources is the regulatory agency of the oil and gas industry in Nigeria.
Specifically, the roles of the Department include:-
1. Conservation of Nigeria’s Hydrocarbon Resources
2. Regulation and Monitoring of industry activities to ensure compliance with best standards &
practices
3. Ensure safe, and environmentally sustainable development of the oil and gas operations’
activities
4. Maintenance and administration of the national repository for archiving and retrieval of oil
and gas data
5. Administration & management of acreages and concessions
6. Implementation of all government policies
DPR
Upstream Operations Monitoring and Regulation
NNPC
(NPDC, NAPIMS, IDSL, JV,
PSC)
IOC
(JV, PSC, SC)
IO
(SR, PSC, MF)
Downstream Operations Monitoring and Regulation
NNPC
(Refineries, PPMC,
NGC)
Major Marketers
Independent
Marketers
Service Providers Monitoring and Regulation
Special Category
Major Category
General Category
The Nigerian Oil and Gas Industry – Institutional Regulatory Structure

9 | P a g e
3 ADAPTATION OF NEW TECHNOLOGY IN THE OIL AND GAS INDUSTRY
3.1 INTRODUCTION
Since the beginning of the modern age of the oil and gas industry, technology has played a
fundamental role in supporting the efficient production of hydrocarbons. Oil and gas technologies
are often destined for hostile, hard-to-reach environments such as deep offshore waters or in the
high subsurface temperatures and pressures. New technologies can streamline the production,
improve the recovery rate and provide economic benefits. The challenge is that new technology
may involve potential threats with high uncertainties which must be properly mitigated and
reduced to an acceptance level before the technology is implemented. New technology must
therefore be qualified by a systematic process where the required performance is assured by
identifying and managing these uncertainties.
DPR’s Technology Qualification (TQ) process provides the industry with a systematic approach to
the qualification of new technology. It is usually conducted by independent Testing, Inspection
and Certification (TIC) agencies and / or regulatory authorities to validate the system and verify
that it is fit for purpose and confirm its compliance with specifications.
3.1.1 Objective of Technology Qualification
The overall objective of the TQ is to provide a systematic approach on how the qualification should
be carried out, in order to provide traceable evidence that the technology meets specified
requirements for the intended use, within an acceptable level of confidence and that it is
sufficiently reliable and safe for the people and the environment.
3.1.2 Scope of Technology Qualification
• Individual components in a system might be proven, however, when they are assembled
in a novel way, the system as a whole may be considered a new technology with the
attendant uncertainties.
• Proven technology in a new environment is considered new technology.
• Technologies that are not new but are yet to be covered by normative standards
To qualify new technologies, several industry standards and governing documentations are
considered. These technical documents provide guidance, requirements, and input to the
process. The DPR TA requirements cover both regulatory-specific requirements and compliance
to industry standards.

10 | P a g e
3.1.2.1 Regulatory Specific Qualification Requirements
Proposals for new Technology Adaptation/Qualification must be accompanied by (a) DPR Oil
Industry Service Company Permit, (b) letter of Relationship with Original Equipment
Manufacturer(OEM) or Technology Provider and (c) evidence of Patents/ Intellectual Property
Rights, where applicable
The TQ requirements cover the following technical activities:
i. Technical Audit/Site Inspection of OEM and Nigerian Technology Partner
ii. Laboratory evaluation of novel technology and on-site visits to facilities where
technology has been deployed
iii. Pilot implementation of qualified technology
Compliance to Nigerian oil and gas Legislation and subsisting regulations:
Technology Providers are required to comply with all relevant Nigerian Oil and Gas Legislation,
Standards and Guidelines including but not limited to; (a) Petroleum Act 1969, (b) Petroleum
Refining Act, (c) Oil Pipeline Act, (d) Petroleum (Drilling & Production) Regulations 1967 and (e)
Mineral Oil (Safety) Regulation (MOSR) 1997
3.1.2.2 Compliance to Industry Standards
For any new technology to be accepted by DPR, it should demonstrate its compliance with
relevant current industry rules or regulations by a relevant and documented qualification process:
International Rules, Standards and Guidance notes like IMO SOLAS (International Maritime
Organization Safety of Life at Sea), BV (Bureau Veritas) rules, ISO (International Organization for
Standardization) and API (American Petroleum Institute) are a few of the applicable qualifications
guidelines, rules and regulations.
3.2 TECHNOLOGY ADAPTATION PROCESS
3.2.1 Overview
The Technology Adaptation process is a methodology developed with specific acceptance criteria
for technology under review. This is focused on, but not limited to the functionality, performance,
reliability / maintainability, availability and safety & environmental considerations.
11 | P a g e
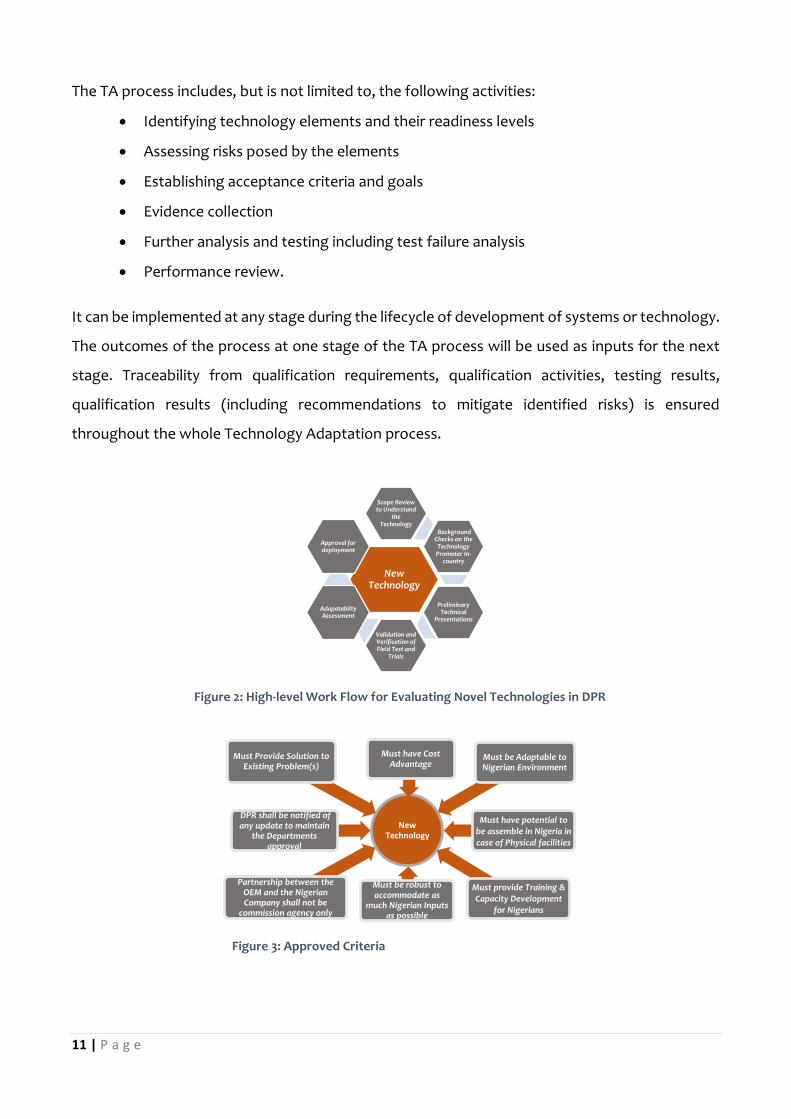
The TA process includes, but is not limited to, the following activities:
• Identifying technology elements and their readiness levels
• Assessing risks posed by the elements
• Establishing acceptance criteria and goals
• Evidence collection
• Further analysis and testing including test failure analysis
• Performance review.
It can be implemented at any stage during the lifecycle of development of systems or technology.
The outcomes of the process at one stage of the TA process will be used as inputs for the next
stage. Traceability from qualification requirements, qualification activities, testing results,
qualification results (including recommendations to mitigate identified risks) is ensured
throughout the whole Technology Adaptation process.
New Technology
Partnership between the OEM and the Nigerian Company shall not be
commission agency only
DPR shall be notified of any update to maintain
the Departments approval
Must Provide Solution to Existing Problem(s)
Must have Cost Advantage
Must be Adaptable to Nigerian Environment
Must have potential to be assemble in Nigeria in case of Physical facilities
Must provide Training & Capacity Development
for Nigerians
Must be robust to accommodate as
much Nigerian Inputs as possible
New Technology
Scope Review to Understand
the Technology
Background Checks on the
Technology Promoter In-
country
Preliminary Technical
Presentations
Validation and Verification of Field Test and
Trials
Adapatabilty Assessment
Approval for deployment
Figure 3: Approved Criteria
Figure 2: High-level Work Flow for Evaluating Novel Technologies in DPR

12 | P a g e
Yes
Technology Qualification Basis
Risk Assessment
Technology Assessment
Stage 1 : Technology Appraisal
Stage 2: Technology Qualification Plan &
Execution of Plan
Stage 3: Performance Assessment
Requirements?
Technology Qualified
Modification
No
3.2.2 Stages of Technology Qualification Process
The technology qualification process deals with a structured set of steps assembled in series and
connected to a modification stage. This ensures that uncertainties are reduced to an acceptable
level and documented prior to approval.
Figure 4: Stage 1 Technology Appraisal
The Technology Adaptation Process is described as follows:
1. Technology Qualification Basis: The first stage is where the qualification basis is established. It
defines the technology’s main objectives, where and how the technology is intended to be
used, as well as expectations, technical specifications, functional requirements,
environmental parameters, and acceptance criteria through the life cycle.
2. Technology Assessment: This step performs an assessment of the technology and determines
its degree of novelty where its key challenges and uncertainties are identified. The input to
the Technology Assessment includes but not limited to the following supporting documents,
which are to be submitted by the applicant:
• Equipment List
• Detailed drawings of the items to be qualified
• Drawings and description of control and safety systems
• Material specifications
• Outline fabrication, installation, inspection and maintenance procedures

13 | P a g e
• Existing evidence claimed to support qualification (e.g. test reports and
documentation of experience).
3. Risk Assessment: This identifies the failure modes of the technology, and corresponding failure
mechanisms as well as associated risk. The assessment process aims to ensure that all
reasonably foreseeable hazards associated with a particular technology are identified and
adequately controlled, such as hazards related to novel aspects of system integrity failure, and
control/isolation failure.
4. Technology Qualification Plan: This is used to provide necessary qualification evidence on how
to manage potential unacceptable failure modes. The plan provides for activities that shall
obtain reliable evidence and meet requirements stated in the technology qualification basis.
The activities shall first of all seek to reduce the failure modes with highest uncertainties. The
qualification method may be numerical or analytical analyses, experiments, testing,
empirically justified through previous experience or similar methods which are intended to
build confidence
In specifying qualification activities, the following are part of the aspects that are
considered:
• Analysis to assess the performance of individual elements or the system evaluated
• Detailed risk analyses where applicable
• Modelling and numerical simulation might be used to predict the potential
performance of the novel technology.
• Prototyping can be used to provide confidence that the technology can function
according to requirements
• Manufacturability
• Material (destructive or non-destructive) testing
• Function testing to demonstrate the performance of the technology
• Proof testing which will demonstrate the limits of the technology
• Audits (e.g. personnel, manufacturing facilities, software,)
5. Execution of the Plan: The planned activities are executed and qualification evidence obtained
through experience, numerical analysis and test.
The execution of the Technology Qualification Plan consists of the following key steps:

14 | P a g e
• Carrying out the activities in the Technology Qualification Plan.
• Collecting and documenting the data generated by the respective qualification
activities.
• Ensuring traceability of this data.
• Determining the performance margin for each failure mode
6. Performance Assessment: In this last step, the qualification evidence is assessed against the
technology qualification basis. This is to provide confidence and remove uncertainty from the
links between the evidence, failure modes and the requirements in the Technology
Qualification Basis. The outcome constitutes the deliverable of the Technology Qualification
Process and is the only measure of the confidence that has been established in the technology.
Finally, if the performance assessment concludes that some functional requirements of the
new technology are not met, risk control options (modifications to the new technology) and
further qualification activities are identified. This can include tightening of the operating
envelope for the new technology or enhanced inspection and maintenance and repair
strategies to meet the requirements based on the existing evidence. If none of these are
feasible, the Technology Qualification has failed. Otherwise, if all functional requirements are
met then the technology is qualified for deployment.
1. Guidance Notes for Technology Qualification, 2014. Lloyd’s Register, London, United Kingdom
2. Mehrdad Sabetzadeha,_, Davide Falessib, Lionel Briand , Stefano Di Alesi. Technology Qualification
Technologies: Foundations, Tool Support, and Industrial Validation, 2013. Reliability Engineering and System
Safety Journal.
3. Procedure for failure mode and effects analysis (FMEA). IEC 60812 (2006). International Electrotechnical
Commission, Geneva.
4. Qualification procedures for new technology. DNV-RP-A203, Det Norske Veritas Høvik, Norway (DNV), 2011.
Available at: http://exchange.dnv.com/publishing/Codes/download.asp?url=2011-07/rp-a203.pdf.
5. Risk Based Qualification of New Technology - Methodological Guidelines, NI 525 (2010), Seine Cedex – France
6. Technology Qualification Management and Verification Service Specification, DNVGL-SE-0160 (2015), Det
Norske Veritas, Høvik, Norway
7. Technology Qualification, WR 1622 (2009).. Statoli ASA, 5.05 edition

15 | P a g e
4 STATISTICAL DATA
4.1 UPSTREAM
4.1.1 Concessions
Table 1: Status of Oil Mining Leases (OMLs)
S/N CONCESSION HELD
TYPE OF GRANT
AREA (SQ.KM)
EQUITY DISTRIBUTION BASIN / TERRAIN OPERATOR DATE OF GRANT
DATE OF LEASE
EXPIRATION
REMARKS
1 OML 29 JVC 983 AITEO-45%, NNPC-55% Niger Delta (Onshore) AITEO EASTERN E&P CO. LTD (AITEO)
01.07.1989 30.06.2019 1. Aiteo acquired 45% interest from SPDC through divestment 2. Producing
2 OML 120 SR 910 ALLIED-97.5%, CAMAC-2.5%(ERIN ENERGY-100%)
Niger Delta (Deep Offshore)
ALLIED ENERGY RESOURCES NIG. LTD
27.02.2001 26.02.2021 Producing
3 OML 121 SR 885 ALLIED-97.5%, CAMAC-2.5%(ERIN ENERGY-100%)
27.02.2001 26.02.2021 Non-producing
4 OML 112 SR 438 AMNI-60%,ELF-40% Niger Delta (Cont. Shelf)
AMNI INTERNATIONAL PETROLEUM LTD
12.02.1998 12.02.2018 Producing
5 OML 117 SR 51 AMNI-60%,ELF-40% 06.08.1999 5.08.2019 Non-producing
6 OML 52 JVC 247 AMNI OML 52-40% NNPC-60% Niger Delta (Onshore) AMNI INT'L PETR. DEV. CO. LTD
14.06.1997 13.06.2027 1. Acquired 40% equity from Chevron through divestment 2. Non-producing
7 OML 109 SR 772 ATLAS-70%, SUMMIT OIL-30% Niger Delta (Continental Shelf) ATLAS PETROLEUM NIG. LTD
25.05.1996 24.05.2016 1. Producing 2. Renewal process ongoing
8 OML 55 JVC 849 BELEMAOIL-40% NNPC-60% Niger Delta (Onshore) BELEMA OIL PRODUCING LTD.
14.06.1997 13.06.2027 1. Acquired 40% equity from Chevron through divestment 2. Producing
9 OML 110 SR 966 CAVENDISH-100%(CAVENDISH-100%, NIKOIL-40%?)
Niger Delta (Cont. Shelf)
CAVENDISH PETROLEUM NIG. LTD
07.08.1996 6.08.2016 1. Non-producing 2. Applied for the lease renewal
10 OML 49 JVC 1707 NNPC-60%, CNL-40% Niger Delta (Onshore) CHEVRON NIG. LTD. 14.06.1997 13.06.2027 Producing
11 OML 51 JVC 145 NNPC-60%, CNL-40% Niger Delta (Onshore) CHEVRON NIG. LTD. 14.06.1997 13.06.2027 Non-producing
12 OML89 JVC 364 NNPC-60%, CNL-40% Niger Delta (Cont. Shelf)
CHEVRON NIG. LTD. 18.08.2014 17.08.2034 Non-producing
13 OML 91 JVC 157 NNPC-60%, CNL-40% Niger Delta (Continental Shelf) CHEVRON NIG. LTD. 18.08.2014 17.08.2034 Non-producing
14 OML 86 JVC 385 NNPC-60%, CNL-40% Niger Delta (Continental Shelf) CHEVRON NIG. LTD. 18.08.2014 17.08.2034 Producing
15 OML 88 JVC 773 NNPC-60%, CNL-40% Niger Delta (Continental Shelf) CHEVRON NIG. LTD. 18.08.2014 17.08.2034 Producing
16 OML 90 JVC 653 NNPC-60%, CNL-40% Niger Delta (Continental Shelf) CHEVRON NIG. LTD. 18.08.2014 17.08.2034 Producing
17 OML 95 JVC 1217 NNPC-60%, CNL-40% Niger Delta (Continental Shelf) CHEVRON NIG. LTD. 18.08.2014 17.08.2034 Producing
18 OML 132 PSC 804 CHEVRON-100% Niger Delta (Deep Offshore)
CHEVRON NIG. LTD. 20.12.2005 19.12.2025 Non-producing

16 | P a g e
S/N CONCESSION HELD
TYPE OF GRANT
AREA (SQ.KM)
EQUITY DISTRIBUTION BASIN / TERRAIN OPERATOR DATE OF GRANT
DATE OF LEASE
EXPIRATION
REMARKS
19 OML 131 PSC 1210 OANDO-52.5%,EXXON MOBIL-47.5% Niger Delta (Deep Offshore)
OANDO PLC 24.04.2005 23.04.2025 1. Acquired contractor's right from Conophillips through divestment 2. Non-Producing
20 OML 103 SR 914 CONOIL -100% Niger Delta (Onshore) CONOIL PRODUCING LTD 02.06.1993 01.06.2013 1. The lease renewal process ongoing 2. Producing
21 OML 136 SR 1295 CONOIL-60%,TOTAL-40% Niger Delta (Continental Shelf) 27.07.2006 26.07. 2026 Non-producing
22 OML 59 SR 836 CONOIL -100% Niger Delta Onshore CONTINENTAL OIL & GAS COMPANY LTD. (CONOG)
06.06.1998 05.06.2018 Producing
23 OML 150 PSC 428 CONOIL -100% Niger Delta Onshore 10.03.2016 09.03.2036 Non-producing
24 OML 96 SR 221 DUBRI -100% Niger Delta (Onshore) DUBRI OIL CO. (NIG.) LIMITED
02.05.2013 01.05.2033 Producing
25 OML 138 PSC 656 SINOPEC-20%,EXXON-30%,CNL-30%,NEXEN-20%
Niger Delta (Deep Offshore)
TOTAL EXP & PROD.NIG. LTD.
17.05.2007 16.05.2017 Producing
26 OML 139 PSC 656 TOTAL-100% Niger Delta (Deep Offshore)
17.05.2007 16.05.2017 Non-producing
27 OML 99 JVC 171 NNPC-60%, TOTAL-40% Niger Delta (Continental Shelf) TOTAL EXP & PROD.NIG. LTD.
02.05.2013 01.05.2033 Producing
28 OML100 JVC 179 NNPC-60%, TOTAL-40% Niger Delta (Continental Shelf) 02.05.2013 01.05.2033 Producing
29 OML 102 JVC 796 NNPC-60%, TOTAL-40% Niger Delta (Continental Shelf) 02.05.2013 01.05.2033 Producing
30 OML 58 JVC 518 NNPC-60%, TOTAL-40% Niger Delta (Onshore) 14.06.2007 13.06.2027 Producing
31 OML 141 SR 1295 EMERALD-53.9%, AMNI INTNL-44.1%, SUPERNOVA ENERGY (BLUEWATER GROUP)-2%
Niger Delta (Onshore) EMERALD ENERGY RES. LTD
08.11.2007 07.08.2027 Non-producing
32 OML 148 PSC 870 ENAGEED 100% Niger Delta (Onshore) ENAGEED RESOURCES LTD.
15.05.2015 14.05.2035 Non-producing
33 OML 18 JVC 1035 EROTON-45%, NNPC-55% Niger Delta (Onshore) EROTON E&P CO. (EROTON)
01.07.2009 30.06.2019 1. Acquired 45% through divetment from SPDC 2. Producing
34 OML 133 PSC 1100 EXXON -56.25%, SNEPCO-43.75% Niger Delta (Deep Offshore)
ESSO E & P. LTD 08.02.2006 07.02.2026 Producing
35 OML 145 PSC 1293 ESSO 20%, Svenska 20%, Phillips 20%, Chevron 20%, NPDC 15%, Sasol 5%
Niger Delta (Deep Offshore)
30.05.2014 29.05.2034 Producing
36 OML 108 SR 759 EXPRESS-57.5%, SHEBBAH-40%, CAMAC-2.5% Niger Delta (Continental Shelf) EXPRESS PETROLEUM & GAS CO. LTD
01.11.1995 31.10.2015 1. Renewal process ongoing 2. Producing
37 OML 83 JVC 109 FIRST E&P/DANGOTE-45%, NNPC-55% Niger Delta (Continental Shelf) FIRST E&P 18.08.2014 17.08.2034 1. Acquired 40% equity from Chevron through divestment 2. Non-producing
38 OML 85 JVC 515 FIRST E&P/DANGOTE-45%, NNPC-55% Niger Delta (Continental Shelf) 18.08.2014 17.08.2034
39 OML 71 JVC 730 WAEP/DANGOTE-45%, NNPC-55% Niger Delta (Continental Shelf) WEST AFRICAN E&P CO. LTD (WAEP)
18.12.2014 17.12.2034 1. Acquired 45% equity from SPDC through divestment 2. Non-producing
40 OML 72 JVC 1129 WAEP/DANGOTE-45%, NNPC-55% Niger Delta (Continental Shelf) 18.12.2014 17.12.2034 Producing
41 OML 149 PSC 941 NAOC - 48%, Global Energy 42%, BLJ Energy Ltd - 10%
Niger Delta (Onshore) GEC PETROLEUM DEVELOPMENT COMPANY LTD (GLOBAL ENERGY)
05.02.2015 04.02.2035 Non-producing
42 OML 151 PSC 171 GPDC 51%, NAE 49%, EMO 40% Niger Delta (Continental Shelf) 10.03.2016 09.03.2036 Non-producing

17 | P a g e
S/N CONCESSION HELD
TYPE OF GRANT
AREA (SQ.KM)
EQUITY DISTRIBUTION BASIN / TERRAIN OPERATOR DATE OF GRANT
DATE OF LEASE
EXPIRATION
REMARKS
43 OML 127 SR 1281 NNPC-50%, CNL-32%, FAMFA-10% PETROBRAS-8%
Niger Delta (Deep Offshore)
STAR DEEP WATER PETROLEUM LIMITED
25.11.2004 24.11.2024 Producing
44 OML104 JVC 675 NNPC-60%, MPN-40% Niger Delta (Continental Shelf) MOBIL PRODUCING NIG. UNLIMITED
14.01.1998 13.01.2018 Producing
45 OML 67 JVC 119 NNPC-60%, MPN-40% Niger Delta (Continental Shelf) 11.03.2011 10.03.2031 Producing
46 OML 68 JVC 119 NNPC-60%, MPN-40% Niger Delta (Continental Shelf) 11.03.2011 10.03.2031 Producing
47 OML 70 JVC 1250 NNPC-60%, MPN-40% Niger Delta (Continental Shelf) 11.03.2011 10.03.2031 Producing
48 OML 114 SR 464 MONIPULO-60%, CAMAC-40% Niger Delta (Continental Shelf) MONI PULO LTD. 03. 01.1999 02.o1.2019 Producing
49 OML 24 JVC 162 NEWCROSS E&P-45%, NNPC-55% Niger Delta (Onshore) NEWCROSS E & P 01.07.2009 30.06.2019 1. Acquired 45% equity interest through divestment from SPDC. 2.Producing
50 OML 134 PSC 1131 ENI-85%, OANDO-15% Niger Delta (Deep Offshore)
NIGERIA AGIP EXPLORATION (NAE)
31.05.2006 30.05.2026 Non-producing
51 OML 125 PSC 1219 ENI-85%, OANDO-15% Niger Delta (Deep Offshore)
02.01.2003 01.01.2023 Producing
52 OML 60 JVC 358 OML 60 Niger Delta (Onshore) NIGERIA AGIP OIL CO. LTD. 14.06.1997 13.06.2027 Producing
53 OML 61 JVC 1500 NNPC-60%, NAOC-20%,OANDO-20% Niger Delta (Onshore) 14.06.1997 13.06.2027 Producing
54 OML 62 JVC 1211 NNPC-60%, NAOC-20%,OANDO-20% Niger Delta (Onshore) 14.06.1997 13.06.2027 Producing
55 OML 63 JVC 2246 NNPC-60%, NAOC-20%,OANDO-20% Niger Delta (Onshore) 14.06.1997 13.06.2027 Producing
56 OML 116 SC 360 ENI-100% Niger Delta (Continental Shelf) AGIP ENERGY AND NATURAL RESOURCES (AENR)
06.08.1979 05.08.2019 Producing
57 OML 126 PSC 705 ADDAX-100% Niger Delta (Continental Shelf) ADDAX PETROLEUM (ADDAX)
25.11.2004 24.11.2024 Producing
58 OML 137 PSC 849 ADDAX-100% Niger Delta (Continental Shelf) 23.04.2007 22.04.2027 Producing
59 OML 123 PSC 401 ADDAX-100% Niger Delta (Continental Shelf) 14.08.2002 13.04.2022 Producing
60 OML 124 PSC 300 ADDAX-100% Niger Delta (Onshore) 14.08.2002 13.04.2022 Producing
61 OML 40 JVC 498 NPDC-55%,ELCREST-45% Niger Delta (Onshore) NPDC 01.07.1989 30.06.2019 Producing
62 OML 42 JVC 814 SINOPEC-20%,EXXON-30%,CNL-30%,NEXEN-20%
Niger Delta (Onshore) NPDC 01.07.1989 30.06.2019 Producing
63 OML 26 JVC 165 FIRST HYDROCARBON-45%, NPDC-55% Niger Delta (Onshore) NPDC 01.07.1989 30.06.2019 Producing
64 OML 34 JVC 950 NPDC-55%, ND WESTERN-45% Niger Delta (Onshore) NPDC 01.07.1989 30.06.2019 Producing
65 OML 119 SR 715 NPDC-55%, ND WESTERN-45% Niger Delta (Continental Shelf) NIGERIA PET. DEV. CO. (NPDC)
31.10.2000 30.10.2020 Producing
66 OML 111 SR 461 NPDC-100% Niger Delta (Onshore) 1996 2016 Producing
67 OML 64 SR 278 NPDC-100% Niger Delta (Onshore) .09.1989 9.2019 Producing
68 OML 65 SR 1019 NPDC-100% Niger Delta (Onshore) .09.1989 9.2019 Producing
69 OML 66 SR 204 NPDC-100% Niger Delta (Onshore) 07.09.1989 06.09.2019 Producing
70 OML 30 JVC 1097 NPDC-55%, SHORELINE NAT RESOURCES-45%
Niger Delta (Onshore) NPDC 01.07.89 30.06.2019 Producing
71 OML 140 SR 1220 PSA Partner:Oil&Gas 10%, Star Ultra Deep 40%; PSC Partner: NNPC 50%
Niger Delta (Deep Offshore)
OIL AND GAS NIG. LTD. 18.07.07 17.07.27 Non-producing
72 OML 115 SR 310 ORIENTAL-60%, AFREN-40% Niger Delta (Continental Shelf) ORIENTAL ENERGY RESOURCES LTD
20.5.1999 19.5.2019 Non-producing
73 OML 98 JVC 523 NNPC-60%, PANOCEAN-40% Niger Delta (Onshore) NNPC/PAN OCEAN OIL CORPORATION
.06.1976 7.7.2018 Producing

18 | P a g e
S/N CONCESSION HELD
TYPE OF GRANT
AREA (SQ.KM)
EQUITY DISTRIBUTION BASIN / TERRAIN OPERATOR DATE OF GRANT
DATE OF LEASE
EXPIRATION
REMARKS
74 OML 147 PSC 544 PANOCEAN 100% Niger Delta (Onshore) PAN OCEAN /ANIOMA 23.10.2014 22.10.2034 Non-producing
75 OML 122 SR 1295 PEAK-(95 OIL/88 GAS), OANDO(5 OIL/12 GAS)
Niger Delta (Continental Shelf) PEAK PETROLEUM INDUSTRIES NIG. LTD
17.05.2001 16.05.2021 Non-producing
76 OML 4 JVC 267 SEPLAT-45%, NPDC-55% Niger Delta (Onshore) SEPLAT 01.07.1989 30.06.2019 Producing
77 OML 38 JVC 2152 SEPLAT-45%, NPDC-55% Niger Delta (Onshore) 01.07.1989 30.06.2019 Producing
78 OML 41 JVC 291 SEPLAT-45%, NPDC-55% Niger Delta (Onshore) 01.07.1989 30.06.2019 Producing
79 OML 53 JVC 1562 SEPLAT-45%, NPDC-55% Niger Delta (Onshore) 14.06.1997 13.06.2027 1. Acquired 40% equity from Chevron through divestment 2. Producing
80 OML 11 JVC 3097 Niger Delta (Onshore) SHELL PETROLEUM DEVELOPMENT COMPANY (SPDC)
01.07.1989 30.06.2019 Producing
81 OML 17 JVC 1301 SEPLAT-45%, NPDC-55% Niger Delta (Onshore) 01.07.1989 30.06.2019 Producing
82 OML 20 JVC 405 NNPC-55%, SPDC-30%, ELF-10%, AGIP-5% Niger Delta (Onshore) 01.07.1989 30.06.2019 Producing
83 OML 21 JVC 372 NNPC-55%, SPDC-30%, ELF-10%, AGIP-5% Niger Delta (Onshore) 01.07.1989 30.06.2019 Producing
84 OML 22 JVC 722 NNPC-55%, SPDC-30%, ELF-10%, AGIP-5% Niger Delta (Onshore) 01.07.1989 30.06.2019 Producing
85 OML 23 JVC 483 NNPC-55%, SPDC-30%, ELF-10%, AGIP-5% Niger Delta (Onshore) 01.07.1989 30.06.2019 Producing
86 OML 25 JVC 429 NNPC-55%, SPDC-30%, ELF-10%, AGIP-5% Niger Delta (Onshore) 01.07.1989 30.06.2019 Producing
87 OML 27 JVC 165 NNPC-55%, SPDC-30%, ELF-10%, AGIP-5% Niger Delta (Onshore) 01.07.1989 30.06.2019 Producing
88 OML 28 JVC 936 NNPC-55%, SPDC-30%, ELF-10%, AGIP-5% Niger Delta (Onshore) 01.07.1989 30.06.2019 Producing
89 OML 31 JVC 1097 NNPC-55%, SPDC-30%, ELF-10%, AGIP-5% Niger Delta (Onshore) 01.07.1989 30.06.2019 Non-producing
90 OML 32 JVC 565 NNPC-55%, SPDC-30%, ELF-10%, AGIP-5% Niger Delta (Onshore) 01.07.1989 30.06.2019 Producing
91 OML 33 JVC 336 NNPC-55%, SPDC-30%, ELF-10%, AGIP-5% Niger Delta (Onshore) 01.07.1989 30.06.2019 Non-producing
92 OML 35 JVC 1144 NNPC-55%, SPDC-30%, ELF-10%, AGIP-5% Niger Delta (Onshore) 01.07.1989 30.06.2019 Producing
93 OML 36 JVC 338 NNPC-55%, SPDC-30%, ELF-10%, AGIP-5% Niger Delta (Onshore) 01.07.1989 30.06.2019 Producing
94 OML43 JVC 767 NNPC-55%, SPDC-30%, ELF-10%, AGIP-5% Niger Delta (Onshore) NNPC/SHELL PETROLEUM DEVELOPMENT COMPANY (SPDC)
01.07.1989 30.06.2019 Producing
95 OML 45 JVC 76 NNPC-55%, SPDC-30%, ELF-10%, AGIP-5% Niger Delta (Onshore) 01.07.1989 30.06.2019 Producing
96 OML 46 JVC 1080 NNPC-55%, SPDC-30%, ELF-10%, AGIP-5% Niger Delta (Onshore) 01.07.1989 30.06.2019 Producing
97 OML 74 JVC 1324 NNPC-55%, SPDC-30%, ELF-10%, AGIP-5% Niger Delta (Continental Shelf) 18.12.2014 17.12.2034 Non-producing
98 OML 77 JVC 962 NNPC-55%, SPDC-30%, ELF-10%, AGIP-5% Niger Delta (Continental Shelf) 18.12.2014 17.12.2034 Non-producing
99 OML 79 JVC 970 NNPC-55%, SPDC-30%, ELF-10%, AGIP-5% Niger Delta (Continental Shelf) 18.12.2014 17.12.2034 Producing
100 OML 118 PSC 1167 SNEPCO-55%, EXXON-20%,ENI-12.5%, ELF-12.5%
Niger Delta (Deep Offshore)
SHELL NIG.EXP & PROD. CO. LTD
28.11.2005 27.11.2025 Producing
101 OML 135 PSC 926 SNEPCO-55%, EXXON-20%,ENI-12.5%, ELF-12.5%
Niger Delta (Deep Offshore)
03.07.2006 02.07.2026 Non-producing
102 OML 130 SR 1295 CNOOC-45%, SOUTH ATL.-15%, PETROBRAS-16%, TOTAL-24%
Niger Delta (Deep Offshore)
SOUTH ATLANTIC PET. LTD.
25.04.2005 24.04.2025 Producing
103 OML 128 PSC 1198 STATOIL-53.85%, CNL-46.15% Niger Delta (Deep Offshore)
STATOIL (NIGERIA) LIMITED
28.12.2004 27.12.2024 Producing
104 OML 129 PSC 1023 STATOIL-53.85%, CNL-46.15% Niger Delta (Deep Offshore)
28.12.2004 27.12.2024 Non-producing
105 OML 142 SR 1295 SUMMIT-30%, SUNTERA-70% Anambra Basin (Onshore) SUMMIT OIL INTERNATIONAL
12.06.2009 11.06.2029 Non-producing
106 OML 144 SR 96 SUNLINK-60%,SHELL-40% Niger Delta (Continental Shelf) SUNLINK PETROLEUM LIMITED
02.05.2013 01.05.2033 Non-producing
19 | P a g e
S/N CONCESSION HELD
TYPE OF GRANT
AREA (SQ.KM)
EQUITY DISTRIBUTION BASIN / TERRAIN OPERATOR DATE OF GRANT
DATE OF LEASE
EXPIRATION
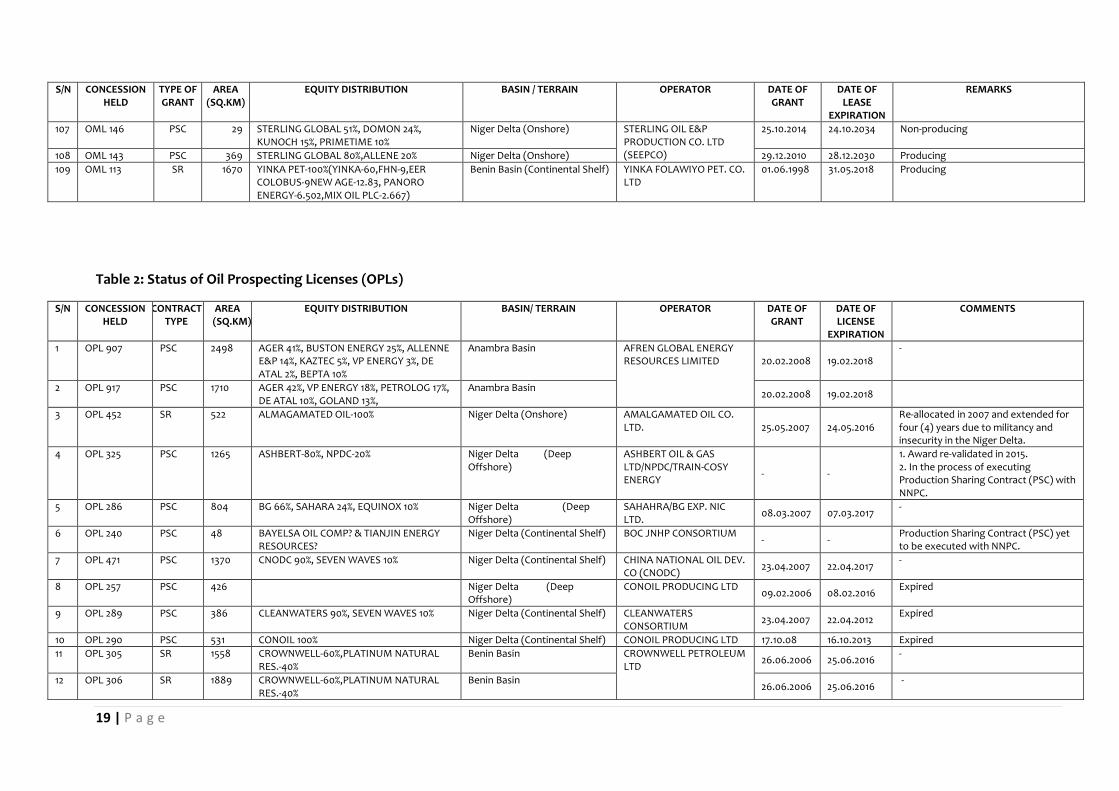
REMARKS
107 OML 146 PSC 29 STERLING GLOBAL 51%, DOMON 24%, KUNOCH 15%, PRIMETIME 10%
Niger Delta (Onshore) STERLING OIL E&P PRODUCTION CO. LTD (SEEPCO)
25.10.2014 24.10.2034 Non-producing
108 OML 143 PSC 369 STERLING GLOBAL 80%,ALLENE 20% Niger Delta (Onshore) 29.12.2010 28.12.2030 Producing
109 OML 113 SR 1670 YINKA PET-100%(YINKA-60,FHN-9,EER COLOBUS-9NEW AGE-12.83, PANORO ENERGY-6.502,MIX OIL PLC-2.667)
Benin Basin (Continental Shelf) YINKA FOLAWIYO PET. CO. LTD
01.06.1998 31.05.2018 Producing
Table 2: Status of Oil Prospecting Licenses (OPLs)
S/N CONCESSION HELD
CONTRACT TYPE
AREA (SQ.KM)
EQUITY DISTRIBUTION BASIN/ TERRAIN OPERATOR DATE OF GRANT
DATE OF LICENSE
EXPIRATION
COMMENTS
1 OPL 907 PSC 2498 AGER 41%, BUSTON ENERGY 25%, ALLENNE E&P 14%, KAZTEC 5%, VP ENERGY 3%, DE ATAL 2%, BEPTA 10%
Anambra Basin AFREN GLOBAL ENERGY RESOURCES LIMITED 20.02.2008 19.02.2018
-
2 OPL 917 PSC 1710 AGER 42%, VP ENERGY 18%, PETROLOG 17%, DE ATAL 10%, GOLAND 13%,
Anambra Basin 20.02.2008 19.02.2018
3 OPL 452 SR 522 ALMAGAMATED OIL-100% Niger Delta (Onshore) AMALGAMATED OIL CO. LTD. 25.05.2007 24.05.2016
Re-allocated in 2007 and extended for four (4) years due to militancy and insecurity in the Niger Delta.
4 OPL 325 PSC 1265 ASHBERT-80%, NPDC-20% Niger Delta (Deep Offshore)
ASHBERT OIL & GAS LTD/NPDC/TRAIN-COSY ENERGY
- -
1. Award re-validated in 2015. 2. In the process of executing Production Sharing Contract (PSC) with NNPC.
5 OPL 286 PSC 804 BG 66%, SAHARA 24%, EQUINOX 10% Niger Delta (Deep Offshore)
SAHAHRA/BG EXP. NIC LTD.
08.03.2007 07.03.2017 -
6 OPL 240 PSC 48 BAYELSA OIL COMP? & TIANJIN ENERGY RESOURCES?
Niger Delta (Continental Shelf) BOC JNHP CONSORTIUM - -
Production Sharing Contract (PSC) yet to be executed with NNPC.
7 OPL 471 PSC 1370 CNODC 90%, SEVEN WAVES 10% Niger Delta (Continental Shelf) CHINA NATIONAL OIL DEV. CO (CNODC)
23.04.2007 22.04.2017 -
8 OPL 257 PSC 426 Niger Delta (Deep Offshore)
CONOIL PRODUCING LTD 09.02.2006 08.02.2016
Expired
9 OPL 289 PSC 386 CLEANWATERS 90%, SEVEN WAVES 10% Niger Delta (Continental Shelf) CLEANWATERS CONSORTIUM
23.04.2007 22.04.2012 Expired
10 OPL 290 PSC 531 CONOIL 100% Niger Delta (Continental Shelf) CONOIL PRODUCING LTD 17.10.08 16.10.2013 Expired
11 OPL 305 SR 1558 CROWNWELL-60%,PLATINUM NATURAL RES.-40%
Benin Basin CROWNWELL PETROLEUM LTD
26.06.2006 25.06.2016 -
12 OPL 306 SR 1889 CROWNWELL-60%,PLATINUM NATURAL RES.-40%
Benin Basin 26.06.2006 25.06.2016
-

20 | P a g e
S/N CONCESSION HELD
CONTRACT TYPE
AREA (SQ.KM)
EQUITY DISTRIBUTION BASIN/ TERRAIN OPERATOR DATE OF GRANT
DATE OF LICENSE
EXPIRATION
COMMENTS
13 OPL 322 SR 1789 PSA: DAJO-10%, SNEPCo-40% Niger Delta (Deep Offshore)
DAJO OIL LIMITED 30.03.2004 26-02 2019
1. Discovery made in the block. 2. Block expired in March 2014 and was granted 4 year extension effective 27.02.2015 to enable the company fully execute the work programme and convert the block to an OML
14 OPL 204 SR 1670 AFRICOIL-100% Niger Delta (Onshore) AFRICOIL & MARKETING CO. LTD.
09.07.2005 08.07.2010 Expired
15 OPL 251 PSC 940 DSV-100% Niger Delta (Deep Offshore)
DSV PETROLEUM LIMITED
- -
Signature bonus of $50.5 million not paid. Approval sought to request company to pay within 90 days failure to which block will be withdrawn.
16 OPL 221 PSC 2286 TEPNG 60%, Chevron 40% Niger Delta (Deep Offshore)
TOTAL EXP. & PROD. NIG. LTD.
19.11.2003 18.11.2013 Expired
17 OPL 227 SR 974 EXPRESS-39%, ADDAX-40%,PPI-15%,NIGER DELTA E&P-6%
Niger Delta (Continental Shelf) EXPRESS PETROLEUM & GAS CO. LTD/PETROLEUM PROSPECTS INT'L LIMITED
30.04.2008 29.04.2013
1. Granted 2 years extension on 02.05.2013 2. Expired in 01.05.2015 3. Technical Partner (Addax) pulled out 4. Applied for another two year extension
18 OPL 226 PSC 1257 Essar 100% Niger Delta (Continental Shelf) ESSAR E&P LIMITED 10.03.2010 18.08.2015
1. Expired 2. Company has requested for extension of exploration phase of PSC.
19 OPL 223 PSC 920 ESSO 20%, Svenska 20%, Philips 20%, Chevron 20%, NPDC 15%, Sasol 5%
Niger Delta (Deep Offshore)
ESSO E & P LTD. 19.07.2005 18.07.2015
Conversion process yet to be completed
20 OPL 235 SR 1480 FIRST ARIES(OP) 60% MAJESTIC INT. 40%
Niger Delta (Onshore) FIRST ARIES PETROLEUM LTD.
- - Under litigation
21 OPL 905 PSC 2600 GTPL-1005 Anambra GAS TRANSMISSION & POWER LIMITED
23.04.2007 22.04.2017 -
22 OPL 2010 PSC 179 GPDC 100% Niger Delta (Continental Shelf) GEC PETROLEUM DEVELOPMENT COMPANY LTD (GLOBAL ENERGY)
16.12.2008 29.12.2015 1. Expired on 15.12.2013 2. Granted extension for 18 months effective from 30 June 2014
23 OPL 2012 PSC 849 SIGMUND-94% GRASSO & CONSORTIUM-6%
Niger Delta (Continental Shelf) GRASSO NIG. LTD./SIGMUND OIL FIELDS LTD.
18.06.2014 17.06.2019 -
24 OPL 247 SR 1165 CNDWE 48.6%, Total 36%, Heritage 10%, Sasol 5.4%
Niger Delta (Deep Offshore)
HERITAGE OIL & GAS CO. LTD. 06.04.2004 05.04.2019
1. Expired on 05.04.14 2. Granted 5 year extension 3. The block is under litigation
25 OPL 2002 PSC 817 HI-REV-100% Niger Delta (Onshore) HI REV E&P LTD - -
1. Granted based on Out-of-Court Settlement Agreement. 2. Award process yet to be completed.
26 OPL 252 PSC 814 INC-100% Niger Delta (Deep Offshore)
INC NATURAL RESOURCES - -
1. Paid US$20million at the bidding conference

21 | P a g e
S/N CONCESSION HELD
CONTRACT TYPE
AREA (SQ.KM)
EQUITY DISTRIBUTION BASIN/ TERRAIN OPERATOR DATE OF GRANT
DATE OF LICENSE
EXPIRATION
COMMENTS
27 OPL 292 PSC 1195 INC-100% Niger Delta (Deep Offshore)
- -
2. Required to: a) Pay US$48million at signing of PSC signing b) Invest the remaining US$32 million in Downstream Strategic Project (Ethanol project)
28 OPL 2001 PSC 372 JAHCON-100% Niger Delta (Onshore) JAHCON INTERNATIONAL LIMITED - -
1. Granted based on Out-of-Court Settlement Agreement. 2. Award process yet to be completed.
29 OPL 321 PSC 1166 KNOC 60%, EQUATOR 30%, TULIP 10% Niger Delta (Deep Offshore)
KOREAN NATIONAL OIL CO. (KNOC) NIG.
10.03.2006 09.03.2016 Under litigation
30 OPL 323 PSC 993 NNPC 50%, KNOC 60%, EQUATOR 30%, NJ EXPL 10%
Niger Delta (Deep Offshore)
10.03.2006 09.03.2016 Under litigation
31 OPL 234 PSC 1214 MONIPULO 100% Niger Delta (Onshore) MONI PULO LTD. 16.12.2008 15.12.2013 1. Expired. 2. Request for extension is being evalauted
32 OPL 239 PSC 65 MONIPULO 100% Niger Delta (Continental Shelf) 16.12.2008 15.12.2013
33 OPL 231 PSC 244 MONIPULO 100% Niger Delta (Onshore) 17.05.2011 16.05.2016 -
34 OPL 276 PSC 472 NEW CROSS- 60%, ALBRIGHT WAVES PET. DEV.-40%
Niger Delta (Onshore) NEWCROSS PETROLEUM LTD.
21.01.2012 20.01.2017 -
35 OPL 283 PSC 990 NEWCROSS PET-90%, RAYFLOSH PET.-10% Niger Delta (Onshore)
16.02.06 15.02.2015
1. Expired on 15.02.2011 2. In 2011, Newcross obtained a four (4) years extension to the Work Progamme execution 3. Applied for conversion to OML
36 OPL 733 PSC 2611 NNDC-100% Chad Basin NEW NIGERIA DEVELOPMENT COMPANY LIMITED
08.08.2006 07.08.2016 -
37 OPL 809 PSC 2581 NNDC-100% Benue Trough 08.08.2006 07.08.2016
38 OPL 810 PSC 2584 NNDC-100% Benue Trough 08.08.2006 07.08.2016
39 OPL 722 PSC 2540 NNDC-100% Chad Basin 08.08.2006 07.08.2016
40 OPL 244 PSC 1700 NAE 60%, Svenska 30%, NPDC 10% Niger Delta (Deep Offshore)
NIGERIA AGIP EXPLORATION
20.12.2001 19.12.2011 Expired
41 OPL 282 PSC 695 NAOC 90%, Alliance 10% (OANDO-4%,ARC OIL AND GAS-6%)
Niger Delta (Continental Shelf) NIGERIA AGIP OIL CO. LTD. 08.08.2006 07.09.2015
Expired
42 OPL 291 PSC 1287 APENL 72.5%, STARCREST 27.5% Niger Delta (Deep Offshore)
STARCREST LIMITED 16.10.2006 15.10.2016
-
43 OPL 702 SR 2574 NNPC/FES-100% Chad Basin NNPC/FES
.06.1967
Not applicable due to section 20 of NNPC Act Cap 320 of LFN 1990
NNPC blocks
44 OPL 703 SR 2772 NNPC/FES-100% Chad Basin .06.1967
45 OPL 705 SR 2547 NNPC/FES-100% Chad Basin .06.1967
46 OPL 707 SR 2582 NNPC/FES-100% Chad Basin .06.1967

22 | P a g e
S/N CONCESSION HELD
CONTRACT TYPE
AREA (SQ.KM)
EQUITY DISTRIBUTION BASIN/ TERRAIN OPERATOR DATE OF GRANT
DATE OF LICENSE
EXPIRATION
COMMENTS
47 OPL 242 PSC 1789 NPDC-50% , STARCREST-35%, CROSS RIVER-10%, OBEKPA-5%
Niger Delta (Deep Offshore)
NIGERIA PET. DEV. CO. (NPDC)
- - Re-allocated to NPDC-50%, Starcrest-35%,Cross River-10%, Obekpa-5%.
48 OPL 233 PSC 126 Nig. Del 100% (NIDGEL-60,EQUITY,ENERY RES-20,SACOIL-20)
Niger Delta (Continental Shelf)
NIG-DEL UNITED LTD. .05.2007 29.06.2016
Extension granted for 24 months effective 30 June 2014
49 OPL 215 SR 2586 NOREAST-60%, TOTAL E & P-40% Niger Delta (Deep Offshore)
NOREAST PET. NIG. LTD. 31.03.2005 20.04.2020
Granted 5 year extension effectve 21 April 2015
50 OPL 326 SR 1652 NORTHSOUTH PET-100% Niger Delta (Deep Offshore)
NORTHSOUTH PETROLEUM LTD - -
1. Re-awarded based on Out-of-Court Settlement Agreement. 2. Signature Bonus yet to be paid.
51 OPL 236 PSC 1652 OANDO-95%, RFO VENTURES-5% Niger Delta (Onshore) OANDO PLC 08.09.2006 07.09.2011 Expired
52 OPL 278 PSC 92 OANDO 100% (OANDO-60,CAMAC-15,ALLIED-15,.FIRST AXIS-10)
Niger Delta (Onshore) 19.01.2006 07.09.2015
Expired
53 OPL 241 PSC 1257 OILWORLD-20%, OWENA OIL AND GAS LTD-80%
Niger Delta (Continental Shelf)
OILWORLD LIMITED 10.03.2010 09.03.2020
Under litigation
54 OPL 2003 PSC 789 OISL-100% Niger Delta (Onshore) OIL AND INDUSTRIAL SERVICES LTD - -
1. Granted based on Out-of-Court Settlement Agreement. 2. Award process yet to be completed.
55 OPL 285 PSC 1167 OMEL 45.5%, TUPNI 14.5%, EMO 40% Niger Delta (Deep Offshore)
EMO E&P/TOTAL E&P LTD 23.02.2007 22.02.2017
-
56 OPL 279-N PSC 1103 OMEL 45.5%, TUPNI 14.5%, EMO 40% Niger Delta (Deep Offshore)
23.02.2007 22.02.2017 -
57 OPL 297 PSC 1290 ? Niger Delta (Deep Offshore)
ONGC - MITTAL ENERGY NIGERIA LTD (OMEL)
- -
1. Paid US$25,000,000 paid on OPL 297. 2. Under litigation. 3. Requested for refund of the amount paid due to prolonged litigation. 4. Request forwarded to the President
58 OPL 310 SR 1935 OPTIMUM-60%, “Yet to be Assigned -22.86%, MAYFAIR ASSETS & TRUST LTD-17.14%
Benin Basin OPTIMUM PETROLEUM DEVELOPMENT LIMITED 10.06.2008 09.06.2018
Afren is in Administration
59 OPL 915 SR 1195 ORIENT PETROLEUM-100% Anambra Basin ORIENT PET. REFINERY LTD.
31.01.2005 29.01.2015 1. Applied for conversion of the two OPLs. 2. Application was not accompanied by the statutory application fee. Hence, the application was not processed.
60 OPL 916 963 ORIENT PETROLEUM-100%
61 OPL 320 PSC 1789 ORANTO 32%, PIONEER 51%, ORANDI 17% Niger Delta (Deep Offshore)
ORANTO PETROLEUM LTD.
20.02.2002 20.02.2012
1. Block has expired. 2. Applied for extension to compensate for time period to militancy and insecurity. 3. Request forwarded to the Minister
62 OPL 293 PSC 1023 ORANTO-100% Niger Delta (Deep Offshore)
- -
1. Re-instated to Oranto Petroleum Limited at offered Signature Bonus of US$55 million. 2. Signature bonus to be paid in three tranches: 1st - US$15 million, 2nd - US$

23 | P a g e
S/N CONCESSION HELD
CONTRACT TYPE
AREA (SQ.KM)
EQUITY DISTRIBUTION BASIN/ TERRAIN OPERATOR DATE OF GRANT
DATE OF LICENSE
EXPIRATION
COMMENTS
20 million to be paid at converion and 3rd - US$20 million to be paid first oil.
63 OPL 284 PSC 1131 SAHARA 45%, BG 45%, LOTUS 10% Niger Delta (Deep Offshore)
SAHARA ENERGY E&P 07.07.2007 06.07.2017
-
64 OPL 228 PSC 1915 SAHARA ENERGY FIELD-100% Niger Delta (Onshore) - - PSC yet to be signed
65 OPL 245 SR 1958 PSA: SNEPCo 50%, NAE 50% Niger Delta (Deep Offshore)
NIGERIA AGIP EXPL. LTD (NAE)/SHELL NIG.ULTRA DEEP LTD.
11.05.2011 10.05.2021 -
66 OPL 206 SR 2020 Anambra Basin SUMMIT OIL INTERNATIONAL
20.01.2004 19.01.2014 Expired.
67 OPL 2005 PSC 662 STERLING -100% Niger Delta (Onshore) STERLING EXPLORATION LTD (SEL)
30.04.2014 29.04.2019 -
68 OPL 2006 PSC 662 STERLING -100% Niger Delta (Onshore)
69 OPL 2004 JVC 103 STERLING -100% Niger Delta (Onshore) - -
1. Granted based on Out-of-Court Settlement Agreement. 2. Award process yet to be completed.
70 OPL 2008 PSC 41 TENOIL-100% Niger Delta (Continental Shelf) TENOIL PET. & ENERGY SERVICES LTD/CLAYFORD
26.05.2011 25.05.2016 -
71 OPL 281 PSC 122 TRANSCORP-100% Niger Delta (Onshore)
TRANSNATIONAL CORPORATION
.05.2014 .05.2019 -
72 OPL 258 PSC 234 YORKSHIRE-100% Niger Delta (Deep Offshore)
YORKSHIRE ENERGY WORLD LTD
- - 1. Yorkshire posted the winning Signature Bonus of US$60m and US$105m for the OPLs 258 and 295 respectively. 2. Submitted two personal cheques for the sum of 30m and 55m Euros representing 50% of the offered signature bonus on OPLs 258 and 295 respectively instead of bank drafts in US Dollars. 3. The blocks were withdrawn along with other blocks based on the recommendation of Committee set up by then President to review 2006 – 2007 Bid rounds activities. The withdrawal was later upturned. 4.The company has been appealing for re-award of the two blocks in order to make payment.
73 OPL 295 PSC 1218 YORKSHIRE-100% Niger Delta (Deep Offshore)
- -
74 OPL 248 PSC 2448 NNPC-50%, CONOCO-28.8%, ESSO-11.2%, ZEBRA-10%
Niger Delta (Deep Offshore)
ZEBBRA ENERGY LIMITED 06.04.2014 .06.2019
-

24 | P a g e
Figure 5: Distribution of Nigeria Concession by Lease Contract Type
Table 3: Summary Of Acreage Situation As At 31 December 2016
NAME OF BASIN NO. OF BLOCKS ALLOCATED NO OF OPEN BLOCKS TOTAL NO. OF BLOCKS
OPL OML
ANAMBRA 6 1 12 19
BENIN 9 3 36 48
BENUE 2 0 41 43
BIDA 0 0 17 17
CHAD 6 0 40 46
NIGER DELTA 53 105 34 192
SOKOTO 0 0 28 28
TOTAL 76 109 208 393
42%
23%
34%
1%
Distribution of Nigerian Concessions by Lease Contract Type
PSC SOLE RISK JOINT VENTURE SERVICE CONTRACT

25 | P a g e
4.1.2 Speculative Survey Data Status
Table 4: Multi-Client Data Projects Status as at December 2016
S/No Company Effective Date of
Multi-Client Agreement
Area of Survey / Block Type of Survey/Project Quantum of Survey Year of Survey /
Project Agreement Status
1 Mabon Limited/TGSI 1991 AR2 2D Seismic & Geochemistry 24,400.00km Regional/Infill 1992 Expired but yet to be renewed
2 Mabon Limited/TGSI 1993 AR3 Shelf Survey 2D Seismic & Interpretation Biostrat
6,990.40km Seismic / 6,990.40 Interp/Biostrat
1994 Expired but yet to be renewed
3 Mabon Limited/TGSI 1993 NDRDC Niger Delta Regional Date Compilation / Well loging
7,600.3km / 216 wells 1996 Expired but yet to be renewed
4 Mabon Limited/TGSI 1993 AR3 (ABCD) 2D Seismic & Gravity Mag. 6,373.3km Seismic / 20,260 Sq. km
Grav. Mag. 1994 Expired but yet to be renewed
5 Mabon Limited/TGSI 1993 AR3 Infill / AR3F 2D Seismic 10,899.50km Seismic 1997 Expired but yet to be renewed
6 Mabon Limited/TGSI 1999 Phase AR6 Very Deep Off-shore
2D Seismic Very Deep Off-shore 7,012.70km Seismic 2005 Expired but yet to be renewed
7 Mabon / GXT 2005 Nigeria Span I 2D Seismic Regional Survey 4,844.0km Seismic Data 2006 Good standing
8 Mabon / GXT 2014 Nigeria Span II 2D Seismic Regional Survey 7,350km Seismic Data 2011 Good standing
9 TGS-Petrodata JV Offshore Services Ltd
2016 Nigeria Offshore 2D Seismic 17,000km 2000 Good standing
10 TGS-Petrodata JV Offshore Services Ltd
2016 OPLs, 257,227, 471, OMLs 79, 83,85, 86, 88,
2D Seismic 2,000 Km 2001
11 PGS Geophysical Nigeria Limited 2014 OPL 214/213 3D Siesmic 2814km2 2003 Good standing
12 PGS Geophysical Nigeria Limited 2014 OPL 244 3D Siesmic 1700km2 2002 Good standing
13 PGS Geophysical Nigeria Limited 2014 OPL 245 3D Siesmic 2247km2 2002 Good standing
14 PGS Geophysical Nigeria Limited 2014 OPL 248 3D Siesmic 1940km2 1999 Good standing
15 PGS Geophysical Nigeria Limited 2014 OPL 249 3D Siesmic 1954km2 1999 Good standing
16 PGS Geophysical Nigeria Limited 2014 OPL 250 3D Siesmic 1265km2 1999 Good standing
17 PGS Geophysical Nigeria Limited 2014 OPL 256 3D Siesmic 2655km2 2003 Good standing
18 PGS Geophysical Nigeria Limited 2014 OPL 257 3D Siesmic 538km2 2003 Good standing
19 PGS Geophysical Nigeria Limited 2014 OPL 314 3D Siesmic 1252km2 2004 Good standing
20 PGS Geophysical Nigeria Limited 2014 OPL 315 3D Siesmic 1718km2 2004 Good standing
21 PGS Geophysical Nigeria Limited 2009 OPLs 312, 313, 314 3D Siesmic 2,845 km2 2010 Good standing
22 PGS Geophysical Nigeria Limited 2008 Offshore Niger Delta 3D Mega Survey 17,000km / 75,000 km2 ongoing Good standing
23 Sonar / Ikon Science 2009 Onshore & Offshore Niger Delta
Geo-pressure survey Report 2014 Good standing

26 | P a g e
S/No Company Effective Date of
Multi-Client Agreement
Area of Survey / Block Type of Survey/Project Quantum of Survey Year of Survey /
Project Agreement Status
24 TDI-Brooks 2005 Offshore Niger Delta Surface Geochemical Exploration and Heat Flow Study
Report 2005 Expired but yet to be renewed
25 Acorn Geophysical 2005 Offshore Niger Delta CSEM Imaging OPL 351, 323, 321, 325, 327 & 257 2005 Expired but yet to be renewed
26 Polarcus/ Ashbert Limited 2011 VERNG-99, VERNG-02, VERNG-03, VERNG-04
3D Siesmic 9,308km2 1999-2004 Expired but yet to be renewed
27 Bilview Energy Services 2016 Offshore Niger Delta
Wells Log scanning, digitizing and marketing
Over 6,000 Digitized Well logs 2015 Good standing
Table 5: Contract Signed by Speculative Survey Companies in Nigeria
Company Blocks Quantum Date of Contract Signing
TGS OPLs 221, 223, 227, 233, 239, 471 Approx 5,000km of 2D and 2,000 of 3D
19th Dec, 2001
PGS OPLs 242, 243, 244, 247, 248, 249, 250, 313, 314, 315, 245, 312
7463km2 of 3D 7th Jan, 1999
VEIRTAS 17,000 km acquired btw 1998 & 2000
18th Aug, 1998
MABON Phase AR-2 (Brokerage), Phase AR-3 (Shelf-Survey), Phase AR-3 (ABCD), Phase AR-3 (Infill & 3Fill), Phase AR-6 (Survey)
Total of 56,773.3km & 15 Well Ties
1993, 1994 and 1999

27 | P a g e
Figure 6: Concession Map showing Open Blocks & PGS 3D Seismic
Figure 7: Concession Map showing Open Blocks & Polarcus 2D Seismic Lines
Figure 8: Concession Map showing Open Blocks & TGS-Petrodata 2D Seismic
28 | P a g e
Figure 9: Concession Map showing Open Blocks & PGS's Nigeria MegaSurvey
4.1.3 Marginal Fields
Table 6: List of Marginal Fields
S/N FIELD NAME COMPANY NAME BLOCK
1 Egbaoma Platform Petroleum Ltd 38
2 Asaramatoru Prime Exploration & Production Ltd / Suffolk Petroleum Services Ltd 11
3 Atala Bayelsa Oil Company Ltd. 46
4 Eremor Excel Exploration & Production 46
5 Ibigwe Walter Smith Petroman Oil Ltd / Morris Petroleum Ltd 16
6 Ofa Independent Energy Ltd 30
7 Oza Millennium Oil & Gas Company Ltd 11
8 Qua Ibo Network E & P Nigeria Ltd 13
9 Stubb Creek Universal Energy Resources Ltd 14
10 Tom Shot Bank Associated Oil & Gas Services Ltd / Dansaki Pet. Ltd 14
11 Tsekelewu Sahara Energy Field Ltd/ African Oil & Gas Ltd 40
12 Uquo Frontier Oil Ltd 13
13 Ororo Guarantee Petroleum Company Ltd / Owena Oil & Gas Ltd 95
14 Akepo Sogenal Ltd 90
15 Ogedeh Bicta Energy and Management Systems Ltd 90
16 Ajapa Brittania-U Nig. Ltd 90
17 Dawes Island Eurafric Energy Ltd 54
18 KE Del Sigma Ltd 54
19 Oriri Goland E & P Ltd 88
20 Ekeh Movido E & P Nigeria Ltd 88
21 Umusadege Midwestern Oil & Gas / Suntrust Oil & Gas 56
22 Umuseti Pillar Oil Ltd 56
23 Ebendo Energia Ltd / Unipetrol Pet. Dev 56
24 Amoji Chorus Energy Ltd 56
25 Ebok Oriental Energy Resources Ltd 67
26 Okwok Oriental Energy Resources Ltd 67
27 Ogbelle Niger Delta Petroleum Ltd 54
28 Omerelu Niger Delta Petroleum Ltd 53

29 | P a g e
S/N FIELD NAME COMPANY NAME BLOCK
29 Ubima All Grace Energy 17
30 Otakikpo Green Energy International 11
Figure 10: Marginal Fields Map, 2002 - 2004
4.1.4 Reserves
Table 7: Oil and Gas Reserves
* All Reserves above are as at 31st December of the reported year
Oil Reserves,
MMbbls
Condensate
Reserves, MMbbls
Total (Oil + Condensates),
MMbbls
Natural Gas Reserves (TCF)
Associated Gas,
AG
Non Associated
Gas, NAG Total Gas
2010 31,219.00 5,313.97 36,532.97 92.945 89.872 182.817
2011 31,169.60 5,077.81 36,247.41 92.904 90.530 183.434
2012 32,233.24 4,905.86 37,139.10 89.729 92.529 182.258
2013 31,813.51 5,257.32 37,070.83 89.652 92.298 181.950
2014 31,870.00 5,578.24 37,448.24 90.094 97.904 187.998
2015 31,643.91 5,418.15 37,062.06 97.208 94.857 192.065
2016 31,271.77 5,467.41 36,739.18 97.253 101.485 198.738

30 | P a g e
4.1.5 Exploration
Table 8: Seismic Data Acquisition
YEAR TYPE LAND OFFSHORE DEEP OFFSHORE TOTAL
2010 3-D, SQ.KM 1,300.94 841.28 2,672.79 4,815.01
2011 3-D, SQ.KM 638.27 1,127.59 - 1,765.86
2-D, KM - 278.43 - 278.43
2012 3-D, SQ.KM 1,913.00 568.24 1,742.29 4,223.53
2013 3-D, SQ.KM 1,588.08 1,690.24 961.81 4,240.13
2014 3-D, SQ.KM 804.35 2,833.03 572 4,209.38
2015 3-D, SQ.KM 675.7987 775.497 455.505 1,906.80
2016 3-D, SQ.KM 138.5 156 - 294.5
4.1.6 Rig Activities
Table 9: Active Rig Trend by Terrain
YEAR LAND SWAMP SHALLOW
OFFSHORE DEEP OFFSHORE TOTAL
2010 14 2 8 6 30
2011 13 3 11 6 33
2012 20 5 10 7 42
2013 20 6 13 7 46
2014 14 3 4 8 29
2015 15 3 3 8 29
2016 5 2 2 3 12
Table 10: Rig Disposition by Terrain from January to December 2016
TERRAIN JAN FEB MAR APR MAY JUN JUL AUG SEP OCT NOV DEC
Land 12 14 13 15 7 7 5 6 6 6 1 4
Swamp 2 3 3 2 1 1 2 2 2 2 2 2
Shallow Offshore 1 1 0 0 3 3 3 3 2 3 3 3
Deep Offshore 7 6 6 6 1 3 3 3 3 3 2 3
Total 22 24 22 23 12 14 13 14 13 14 8 12
4.1.7 Drilling and Well completion
Table 11: Number of Wells drilled by Terrain
YEAR ONSHORE OFFSHORE DEEP OFFSHORE TOTAL
2010 30 62 15 107
2011 44 64 12 120
2012 74 65 15 154
2013 59 61 30 150
2014 49 50 43 142
2015 41 27 45 113
2016 39 15 23 77

31 | P a g e
Table 12: Number of Wells drilled by Class
YEAR EXPLORATORY APPRAISAL (1ST & 2ND) ORDINARY APPRAISAL DEVELOPMENT TOTAL
2010 4 4 9 90 107
2011 4 3 7 106 120
2012 2 8 15 129 154
2013 3 9 26 112 150
2014 4 8 10 120 142
2015 4 4 5 100 113
2016 1 5 2 69 77
Table 13: Wells Drilled by Contract and Class in 2016
TYPE OF CONTRACT
EXPLORATORY APPRAISAL (1ST & 2ND) ORDINARY APPRAISAL
DEVELOPMENT TOTAL
JVC 0 0 1 26 27
PSC 0 4 5 31 40
SR 1 1 0 0 2
MF 0 0 0 14 14
Total 1 5 6 71 83
4.1.8 Production
A total of 718,612,967 barrels of oil (and field condensate) was produced at an estimated average
daily production of 1.96 million barrels of oil per day. There was a 9.6% decline over the average
production rate for 2015. This volume was produced by forty-four (44) oil producing companies as
shown in the table below:
Table 14: 2016 Production Performance#
S/No COMPANY CONTRACT TERRAIN (Onshore, Offshore, Deep Offshore)
ANNUAL PRODUCTION (BBLS)
AVERAGE DAILY(BOPD)
PERCENTAGE PRODUCTION
1 ALLIED ENERGY SR Deep Offshore 1,981,816 5,415 0.28
2 AMNI SR Offshore 4,038,448 11,034 0.56
3 ATLAS SR Offshore 233,113 637 0.03
4 CONSOLIDATED SR Offshore 456,173 1,246 0.06
5 CONTINENTAL SR Offshore 3,118,985 8,522 0.43
6 DUBRI SR Offshore 94,368 258 0.01
7 EXPRESS SR Offshore 18,070 49 0
8 NPDC SR Onshore/Onshore 32,546,950 88,926 4.53
9 MONI PULO SR Offshore 1,061,640 2,901 0.15
10 YINKA SR Offshore/Deep 497,057 1,358 0.07
11 STAR DEEP PSC Deep Offshore 83,664,822 228,592 11.64
12 TOTAL UPSTREAM PSC Deep Offshore 50,578,558 138,193 7.04
13 ADDAX PSC Onshore/Offshore 16,565,849 45,262 2.31
14 AENR PSC Offshore 2,206,918 6,030 0.31
15 ESSO ERHA Deep Offshore 7,608,938 20,789 1.06
16 ESSO USAN PSC Deep Offshore 76,511,221 209,047 10.65
17 NAE PSC Deep Offshore 7,591,113 20,741 1.06
18 SNEPCO PSC Deep Offshore 74,376,914 203,216 10.35
19 SEEPCO PSC Onshore 10,651,451 29,102 1.48
20 BRITTANIA-U MARGINAL Offshore 457,744 1,251 0.06
21 ENERGIA MARGINAL Onshore 727,504 1,988 0.1
22 FRONTIER MARGINAL Onshore 285,138 779 0.04

32 | P a g e
S/No COMPANY CONTRACT TERRAIN (Onshore, Offshore, Deep Offshore)
ANNUAL PRODUCTION (BBLS)
AVERAGE DAILY(BOPD)
PERCENTAGE PRODUCTION
23 ORIENTAL MARGINAL Offshore 8,126,735 22,204 1.13
24 PLATFORM MARGINAL Onshore 752,809 2,057 0.1
25 MIDWESTERN MARGINAL Onshore 2,611,169 7,134 0.36
26 NDPR MARGINAL Onshore 1,652,743 4,516 0.23
27 PILLAR MARGINAL Onshore 600,970 1,642 0.08
28 WALTERSMITH MARGINAL Onshore 1,042,874 2,849 0.15
29 UNIVERSAL MARGINAL Onshore 470,388 1,285 0.07
30 NETWORK MARGINAL Onshore 587,908 1,606 0.08
31 PRIME MARGINAL Onshore 0 0 0
32 EXCEL MARGINAL Onshore 18,886 205 0
33 CHEVRON JV Onshore/offshore 62,218,133 169,995 8.66
34 TOTAL E&P JV Onshore/Offshore 34,043,748 93,016 4.74
35 MOBIL JV Onshore/Offshore 104,125,527 284,496 14.49
36 NAOC JV Onshore/Onshore 29,345,308 80,178 4.08
37 PAN OCEAN JV Onshore 844,928 2,309 0.12
38 SPDC JV Onshore/Offshore 45,476,608 124,253 6.33
39 AITEO JV Onshore 21,789,803 59,535 3.03
40 NEWCROSS JV Onshore 8,960,984 24,484 1.25
41 EROTON JV Onshore 12,292,771 33,587 1.71
42 SEPLAT JV Onshore 6,005,208 16,408 0.84
43 NECONDE JV Onshore 1,000,856 2,735 0.14
44 BELEMA JV Onshore 1,371,822 3,748 0.19
TOTAL 718,612,968 1,963,578 100
#All volumes are provisional figures
Table 15: 2016 Monthly Production#
MONTH PRODUCTION (BBLS) AVERAGE DAILY
PRODUCTION (BOPD) JANUARY 68,487,210 2,209,265
FEBRUARY 62,675,911 2,161,238
MARCH 68,414,161 2,206,908
APRIL 65,793,698 2,193,123
MAY 57,956,580 1,869,567
JUNE 58,207,166 1,940,239
JULY 57,227,309 1,846,042
AUGUST 50,228,864 1,620,286
SEPTEMBER 52,820,585 1,760,686
OCTOBER 59,248,446 1,911,240
NOVEMBER 61,921,308 2,064,044
DECEMBER 55,631,728 1,794,572
Total Annual Production (bbls) 718,612,967
Average Annual Daily Production
(bopd)
1,963,577
#All volumes are provisional figures

33 | P a g e
Figure 11: 2016 Average Monthly Production
Figure 12: 2016 Oil Production on Company Basis
Table 16: 2016 Petroleum Production by Contract*
CONTRACT TYPE PRODUCTION (BBLS) AVERAGE PRODUCTION
(BOPD)
PRODUCTION
PERCENTAGE (%)
JOINT VENTURE, JV 327,475,696 894,742 45.57
PRODUCTION SHARING CONTRACT (PSC) 329,755,783 900,972 45.88
SOLE RISK, SR 44,046,619 120,346 6.13
MARGINAL FIELD OPERATORS 17,334,868 47,517 2.42
#All volumes are provisional figures

34 | P a g e
Figure 13:Percentage Distribution of Production (BOPD)
4.1.8.1 Number of Fields
The total number of fields (producing and shut-in) as at the end of December, 2016 stands at two
hundred and eighty five (285) for the forty four (44) oil producing companies. The table below
presents a summary of producing and non-producing fields as at December 2016.
Table 17: 2016 Fields Summary
COMPANY FIELDS
PRODUCING FIELDS SHUT-IN FIELDS REMARKS ON SHUT-IN FIELDS
ADDAX 14 8 Contractual Reasons and operational
issues
AENR 1 0
ALLIED ENERGY 1 0
AMNI 2 0
AITEO 3 1
ATLAS 1 0
BRITTANIA-U 1 0
CAVENDISH 0 1 Operational reasons
CHEVRON 28 6 Operational Reasons
STARDEEP 1 0
CONSOLIDATED 2 0
CONTINENTAL 1 0
DUBRI 1 0
TOTAL E & P 10 8 Operational reasons and sabotage
TOTAL UPSTREAM 1 0
ENERGIA 1 0
EXPRESS 1 0
ESSO 2 0
MIDWESTERN 1 0
MOBIL 20 15 QIT 48” Trunk Line was down
MONI PULO 1 0
NAE 1 0
NAOC 25 13 Facilities sabotage

35 | P a g e
COMPANY FIELDS
PRODUCING FIELDS SHUT-IN FIELDS REMARKS ON SHUT-IN FIELDS
NDPR 1 0
NPDC 10 14 TFP leak & Operational issues
ORIENTAL 1 0
PAN OCEAN 1 7
PLATFORM 1 0
PILLAR 1 0
PRIME 0 1
SEPLAT 4 0
SPDC 35 25 TFP & TNP down
SEEPCO 2 0
EROTON 5 2
SNEPCO 1 0
WALTERSMITH 1 0
NETWORK 1 0
UNIVERSAL 1 0
TOTAL 184 101
285
4.1.8.2 Major Production Deferments
The average production deferment for 2016 was 741,495 bopd. Deferments are attributed to shut
down arising mainly from pipeline vandalism and some operational issues. The table below shows
the summary of monthly deferments from all producing companies in 2016.
Table 18: 2016 Summary of Production Deferments
MONTH
DEFERMENTS
Average Daily Deferment, BOPD Monthly Deferred Volume,
Barrels
January 424,076 13,146,365
February 389,546 11,296,831
March 394,516 12,230,002
April 494,839 14,845,185
May 764,926 23,712,705
June 711,189 21,335,660
July 799,077 24,771,393
August 1,091,072 33,823,232
September 986,087 29,582,598
October 961,807 29,816,024
November 787,724 23,631,709
December 1,070,816 33,195,300
Total Deferment (BBLS) 271,387,005
Average Deferment (BOPD) 741,495

36 | P a g e
4.1.8.3 Stabilized Crude / Condensates Volumes by Streams
Table 19 : 2016 Monthly Summary of Stabilized Crude / Condensates Volumes by Streams#
STREAM
NAME
JANUARY FEBRUARY MARCH APRIL MAY JUNE JULY AUGUST SEPTEMBER OCTOBER NOVEMBER DECEMBER TOTAL
Abo 710,611 636,987 640,633 600,658 594,595 559,106 558,669 595,721 573,559 562,128 501,089 506,279 7,040,035
Agbami 7,123,031 6,887,013 7,512,143 7,405,840 7,539,564 7,271,660 7,322,391 7,649,459 7,423,725 7,618,356 7,322,496 2,759,790 83,835,468
Ajapa 0 0 0 0 0 0 47,332 0 0 21,626 34,084 32,038 135,080
Aje 0 0 0 0 127,224 139,942 182,131 160,978 115,440 99,605 92,608 70,878 988,806
Akpo 4,410,471 3,063,899 3,604,293 4,361,153 4,154,820 4,301,827 4,541,295 4,533,059 4,339,078 4,258,580 4,126,139 4,152,415 49,847,029
Antan 1,318,438 1,018,399 1,076,504 985,856 1,025,152 959,457 968,809 912,219 865,147 861,857 881,660 937,254 11,810,752
Bonga 6,335,735 5,502,444 6,012,411 6,167,361 5,577,493 6,266,249 6,640,856 6,359,179 6,456,882 6,488,727 6,254,229 6,391,196 74,452,762
Bonny 6,063,326 7,575,954 7,891,581 8,103,458 4,000,179 4,332,799 5,390,384 3,899,967 6,569,560 4,347,654 6,310,239 5,043,755 69,528,856
Brass 2,786,356 2,869,790 2,942,655 2,803,772 2,756,554 2,157,096 2,699,605 2,730,049 2,631,659 2,507,001 2,543,768 2,621,142 32,049,447
Ebok* 734,064 716,903 786,621 740,866 733,838 668,572 667,263 650,569 643,797 632,388 591,667 374,230 7,940,778
Escravos 4,964,398 4,709,406 5,173,157 4,819,335 3,668,397 4,374,907 4,605,578 4,780,378 4,929,270 4,566,651 4,893,935 5,150,201 56,635,613
Ekanga 280,178 274,253 293,167 283,710 280,178 258,930 280,178 267,561 258,930 280,178 246,720 254,944 3,258,927
Erha 3,751,292 3,507,118 3,688,108 3,428,707 3,828,429 3,806,913 3,879,793 4,352,355 4,170,265 4,332,995 3,717,932 3,293,768 45,757,675
Forcados 7,113,382 3,080,531 200,233 304,345 678,972 803,824 1,118,840 697,719 641,197 1,852,787 1,840,241 824,830 19,156,901
Ima 22,287 26,401 23,815 17,493 31,180 32,592 34,258 34,795 32,498 31,219 32,961 48,365 367,864
Asaramatoru 48,943 66,189 63,415 59,697 38,880 0 2,258 5,855 0 0 0 0 285,237
Odudu 2,399,539 1,776,988 1,706,392 2,060,195 2,419,066 2,480,574 2,645,563 2,624,195 2,357,926 2,636,081 2,444,638 2,566,612 28,117,769
Okono 745,623 673,330 874,040 816,063 760,596 763,666 176,956 594,224 757,367 769,155 688,056 731,883 8,350,959
Okoro 302,184 239,207 117,547 150,867 238,251 229,994 279,015 377,921 355,367 394,491 416,653 372,834 3,474,331
Okwori 326,026 413,499 449,265 402,847 432,267 403,191 432,390 402,151 383,743 360,478 344,024 332,159 4,682,040
Okwuibome 972,620 764,464 938,219 1,052,753 617,492 996,007 415,360 736,241 526,085 885,823 712,022 940,690 9,557,776
Oyo 71,646 58,586 55,078 47,768 255,441 259,637 221,381 213,738 204,423 203,843 192,720 208,666 1,992,927
Pennington 434,486 426,192 484,582 499,206 494,030 468,315 247,744 425,523 444040 449,173 508,006 550,928 5,432,225
Qua Iboe 10,789,182 9,498,247 10,324,515 9,117,287 6,588,585 7,311,571 4,317,683 61,630 349,490 5,825,343 8,421,460 6,600,815 79,205,809
Sea Eagle 384,872 1,013,234 964,415 935,264 1,010,696 985,828 1,006,296 1,026,970 946,904 934,166 921,431 818,329 10,948,405
Ukpokiti 73,535 47,245 76,186 56,172 52,055 37,479 66,469 18,922 18,471 41,587 53,105 50,777 592,003
Usan 3,534,341 3,419,780 3,492,567 3,250,208 3,380,935 2,592,763 2,520,073 3,454,152 2,784,676 3,152,812 3,255,304 2,547,833 37,385,444
Yoho 1,005,725 1,456,740 1,479,994 1,388,154 1,462,238 1,372,873 1,327,440 1,442,986 1,346,844 1,406,863 1,214,669 945,051 15,849,577
Grand Total 66,702,291 59,722,799 60,871,536 59,859,035 52,747,107 53,835,772 52,596,010 49,008,516 50,126,,343 55,521,567 58,561,856 49,127,662 668,680,495
# All volumes are in barrel
* Ebok volumes are unreconciled

37 | P a g e
Table 20: Summary of Stabilized Crude / Condensates Volumes by Streams#
# Al l volumes are in barrels.
*Crude and Condensate comingled at OIT (2012 & 2013). 1 Ebok commenced operations in 2011. 2 Okwuibome commenced operations in 2011 3 Usan commenced operations in 2012 4 Ebok 2016 volumes are subject to reconciliation
STREAM NAME 2010 2011 2012 2013 2014 2015 2016
Bonny 92,219,866 98,033,224 85,516,915 64,667,075 77,754,786 68,599,842 69,528,856
Brass 45,917,620 45,771,536 38,431,094 31,339,249 36,494,930 39,120,881 32,049,447
Odudu 40,976,556 39,354,196 36,765,688 29,478,224 26,197,317 25,029,537 28,117,769
Qua Iboe 134,913,318 132,436,168 128,852,443 130,762,200 134,956,728 126,774,069 79,205,809
Ima 486,712 531,261 246,582 259,429 312,053 295,976 367,864
Antan 19,033,162 14,506,639 18,664,426 19,800,170 17,722,618 15,368,208 11,810,752
Okono 17,704,675 17,383,748 16,348,665 14,904,197 12,794,563 8,459,169 8,350,959
Yoho 32,845,220 30,324,058 27,685,727 25,141,246 19,315,490 17,345,249 15,849,577
Okwori 14,528,987 12,841,416 12,094,784 9,532,752 8,204,342 6,521,371 4,682,040
Okoro 5,917,922 5,767,803 6,170,120 6,601,054 6,011,655 3,474,331
Ebok1,4 N/A 2,655,667 11,143,721 12,881,551 10,159,963 10,254,615 7,940,778
Abo 11,000,680 10,381,433 8,489,519 8,022,897 8,010,447 8,062,126 7,040,035
Oyo 2,137,871 1,350,839 1,009,845 812,467 421,171 1,777,052 1,992,927
Escravos 95,768,747 90,240,005 82,992,947 75,172,726 70,697,665 62,999,068 56,635,613
Forcados 67,569,603 74,039,471 72,439,137 71,000,791 67,932,791 68,752,656 19,156,901
Pennington 10,468,651 10,545,422 9,102,862 7,357,435 5,505,439 4,719,541 5,432,225
Sea Eagle 29,524,473 23,082,127 21,075,517 15,626,909 7,199,842 14,013,061 10,948,405
Ukpokiti 464,078 276,419 842,252 684,048 565,887 341,189 592,003
Okwuibome2 N/A 1,326,212 1,555,612 3,204,478 4,762,983 6,815,676 9,557,776
Bonga 65,023,519 52,336,416 64,067,957 50,904,162 58,238,730 70,030,598 74,452,762
Agbami 87,169,398 88,304,428 85,041,559 84,871,128 87,280,118 85,339,585 83,835,468
Erha 60,722,082 53,045,402 45,680,658 37,657,596 36,159,774 33,469,916 45,757,675
Akpo 58,444,734 55,628,907 56,650,647 60,851,269 55,311,051 55,503,303 49,847,029
Usan3 0 0 29,409,511 39,191,504 44,520,502 39,387,436 37,385,444
Asaramatoru 0 0 0 0 560,856 516,972 285,237
Ekanga (Zaffiro) 0 0 0 0 4,073,185 3,700,353 3,258,927
Ajapa 0 0 0 0 0 0 135,080
Aje 0 0 0 0 0 0 988,806
Rapele 0 0 0 0 20,431,405 0 0
Addax Cluster 0 0 0 0 2,217,176 0 0
Platform Cluster 0 0 0 0 4,661,090 0 0
Midwestern 0 0 0 0 341,557 0 0
Grand Total 892,837,874 860,162,797 860,278,188 800,724,557 828,816,114 777,492,152 668,680,495

38 | P a g e
4.1.9 Nigerian Crude / Condensate Export
Table 21: Summary of Crude / Condensate Export by Crude Stream 2016
STREAM NAME JANUARY FEBRUARY MARCH APRIL MAY JUNE JULY AUGUST SEPTEMBER OCTOBER NOVEMBER DECEMBER TOTAL
Abo 699,313 - 698,712 699,154 681,552 699,964 699,384 698,332 0 698,113 525,674 880,948 6981146
Agbami 7,775,155 6,770,999 7,797,371 6,776,147 7,793,730 6,940,655 7,791,557 7,795,843 6,865,907 7,733,898 7,750,009 2,919,709 84,710,980
Ajapa 0 0 0 0 0 0 0 0 0 0 0 128,874 128,874
Aje 0 0 0 0 0 0 0 0 618,240 0 0 304,463 922703
Akpo 4,943,815 2,950,607 3,948,812 3,949,147 4,858,085 3,862,434 3,997,891 5,048,097 4,002,236 3,998,935 5,043,522 4,035,673 50,639,254
Antan 2,351,397 948,354 947,340 995,246 996,283 798,776 949,049 448,858 946,167 995,906 1,597,006 399,227 12,373,609
Asaramatoru- Prime 0 0 0 301,120 0 0 0 0 0 0 0 0 301,120
Bonga 6,572,149 5,691,744 6,135,298 6,147,890 5,875,308 5,832,313 5,929,002 6,529,065 6,854,383 5,637,622 6,632,887 7,135,485 74,973,146
Bonny 5,660,064 7,057,785 7,387,852 5,592,239 3,298,896 2,895,715 3,555,251 3,537,015 4,868,375 3,933,272 4,987,690 3,207,174 55,981,328
Brass 3,440,461 2,742,221 3,094,392 2,761,736 3,144,278 1,408,765 3375238 2,373,672 2,054,092 2,276,429 3,628,045 2,849,094 33,148,423
Ebok1 849,639 569,474 1,181,207 589,072 586,799 590,641 609,453 579,814 1,206,327 621,198 605,565 0 7,989,189
Ekanga 906,705 0 951,802 0 0 0 0 978,605 0 0 995,785 0 3,832,897
Erha 3,953,192 3,942,791 2,996,130 3,942,708 4,008,385 3,106,204 4,003,877 4,857,811 3,927,107 4,170,270 3,995,986 2,931,933 45,836,394
Escravos 4,877,149 3,787,494 3,769,693 3,779,427 3,794,793 4,474,592 3,783,302 3,787,203 3,756,575 2,840,676 3,793,206 4,709,205 47,153,315
Forcados 6,316,303 2,816,270 0 0 389028 281923 488680 395602 287392 1,628,772 2,333,840 590444 15,528,254
Ima 0 0 0 0 122,141 0 0 0 0 0 0 120,010 242,151
Odudu 2,948,142 1,906,638 949,364 1,947,930 2,926,094 1,997,514 1,899,250 3,995,008 1,997,914 3,001,310 1,899,378 2,946,237 28,414,779
Okono 0 899,768 901,168 899,821 900,206 299,543 0 897,155 899,672 899,904 397,132 699,720 7,694,089
Okoro 0 0 996,563 0 0 0 0 824,254 0 950,210 0 0 2,771,027
Okwori 0 648,215 647,683 0 651,980 671,984 0 672,842 0 647,845 647,879 0 4,588,428
Okwuibome2 - 924,477 907,189 988,356 922,937 949,452 - 905,385 790,537 -
1,237,304 1,000,718 8,626,355
Oyo 0 183,430 0 158,709 0 418,454 0 431,046 231,698 0 400,822 121,443 1,945,602
Pennington 0 969,412 0 972,576 0 975,086 0 0 967,243 0 966,547 971,587 5,822,451
Qua Iboe 11,400,152 9,688,693 9,500,288 9,458,157 7,600,433 7,597,579 1,899,596 0 951,577 6,650,811 8,550,764 6,651,004 79,949,054
Sea Eagle 946,906 948,852 948,517 948,105 995,586 947,443 995,154 946,623 949,282 947,369 499,770 995,347 11,068,954

39 | P a g e
STREAM NAME JANUARY FEBRUARY MARCH APRIL MAY JUNE JULY AUGUST SEPTEMBER OCTOBER NOVEMBER DECEMBER TOTAL
Ukpokiti 0 0 0 0 0 0 0 0 195,247 0 0 207,599 402,846
Usan3 2,948,240 3,996,499 3,044,745 3,994,489 3,146,665 2,077,800 2,998,075 3,047,052 3,047,931 2,998,090 3,998,410 1,999,115 37,297,111
Yoho 950,344 1,898,664 948,887 1,943,993 1,218,082 996,862 1,901,845 1,578,603 949,024 1,263,425 1,264,354 1,263,267 16,177,350
Grand Total 67,539,126 59,342,387 57,753,013 56,846,022 53,911,261 47,823,699 44,876,604 50,327,885 46,271,759 51,894,055 61,751,575 47,068,276 645,500,829
# All volumes are in barrels 1 Ebok commenced operations in 2011. 2 Okwuibome commenced operations in 2011 3 Usan commenced operations in 2012

40 | P a g e
Table 22: Summary of Crude / Condensate Export
STREAM NAME 2010 2011 2012 2013 2014 2015 2016
Ajapa 0 0 0 0 0 0 128,874
Aje 0 0 0 0 0 0 922,703
Abo 11,122,508 10,435,925 8,318,864 7,973,515 8,298,092 8,184,624 6,981,146
Agbami 86,914,891 88,318,131 85,216,347 84,752,375 86,171,532 85,628,159 84,710,980
Akpo 60,310,968 56,874,365 57,429,881 60,787,043 51,618,224 55,354,492 50,639,254
Antan 19,161,225 14,201,969 18,551,764 19,936,820 18,112,986 14,396,706 12,373,609
Asaramatoru 0 0 0 0 544,421 422,934 301,120
Bonga 65,062,445 51,637,104 64,283,129 50,858,029 58,282,931 69,715,081 74,973,146
Bonny 84,732,535 85,632,150 74,644,120 56,983,360 67,745,358 65,601,732 55,981,328
Brass 46,807,579 46,321,912 38,935,783 30,866,918 36,400,244 38,946,913 33,148,423
Ebok* 0 2,632,888 11,083,168 13,118,644 9,772,103 10,274,484 7,989,189
Ekanga Zaffiro 0 0 0 0 3,763,224 3,710,955 3,832,897
Erha 61,312,426 52,491,417 46,411,568 37,031,702 35,959,867 33,431,160 45,836,394
Escravos 67,842,754 64,008,180 60,861,373 49,395,756 59,259,056 59,054,243 47,153,315
Forcados 66,334,530 74,836,802 69,586,326 66,228,558 66,442,803 69,510,040 15,528,254
Ima 587,031 443,148 360,694 209,822 231,712 448,182 242,151
Odudu 40,678,097 39,129,520 37,841,145 28,080,832 26,478,183 25,321,991 28,414,779
Okono 18,051,652 17,051,254 16,630,272 14,831,286 12,053,749 9,296,812 7,694,089
Okoro 5,948,727 5,375,374 6,358,125 6,431,941 5,608,008 4,840,795 2,771,027
Okwori 14,455,280 12,913,267 11,767,917 9,057,835 8,460,061 6,859,162 4,588,428
Oso Condensate1 4,604,786 5,384,790 0 0 0 0 0
Oyo 3,612,118 1,350,055 1,015,747 671,221 5,455,256 1,646,071 1,945,602
Pennington 10,845,935 10,766,479 8,792,567 6,891,180 5,834,616 4,939,155 5,822,451
Qua Iboe 127,265,111 127,473,827 129,434,223 130,387,983 134,322,114 125,618,831 79,949,054
Sea Eagle 29,852,439 22,449,218 20,830,329 16,175,525 7,028,594 13,629,727 11,068,954
Okwuibome2 0 587,591 2,132,939 2,957,822 4,202,870 7,422,126 8,626,355
Ukpokiti 326,047 295,409 804,835 982,136 546,255 0 402,846
Usan3 0 0 28,942,683 38,357,661 44,518,002 39,729,126 37,297,111
Yoho 33,188,540 30,675,473 27,699,067 24,969,999 18,971,337 17,461,456 16,177,350
Grand Total 859,017,624 821,286,248 827,932,866 757,937,963 776,081,598 771,444,957 645,500,829
# All volumes are in barrels
*Ebok commenced operations in 2011.
1Crude and Condensate comingled at QIT since 2012
2Okwuibome commenced operations in 2011
3Usan commenced operations in 2012

41 | P a g e
Table 23: Average Price of Nigeria's Crude Streams as Quoted by Platts in USD#
YEAR ESCRAVOS BRASS AGBAMI FORCADOS BONNY QUA IBOE AKPO BONGA
2011 111.9434 112.0184 110.4980 112.9252 111.9684 112.1366 * *
2012 113.1028 112.8231 110.7121 114.2121 112.8378 113.2087 * *
2013 111.2222 110.2312 108.9569 111.9453 110.4733 110.8774 110.4490 112.8663
2014 100.6580 99.8366 99.3597 101.3490 100.7018 100.8022 99.3726 101.1330
2015 53.8629 53.1415 52.6413 54.4807 54.1593 54.2862 52.6848 54.1808
2016 44.8551 44.8379 44.4953 44.5397 45.2293 45.4899 44.4833 45.0547
# Source: Platts
* Price assessment not available
Figure 14: Average Price of Nigeria’s Crude Streams as Quoted by Platts
30
40
50
60
70
80
90
100
110
120
2011 2012 2013 2014 2015 2016
Ave
rage
Pri
ce, U
S$
Year
Average Price of Nigeria's Crude Streams as Quoted by Platts
ESCRAVOS BRASS AGBAMI BONNY QUA IBOE AKPO BONGA FORCADOS

42 | P a g e
4.2 DOWNSTREAM
4.2.1 Refinery Activities
Table 24: Refinery Plants in Nigeria
S/N REFINERY OWNERSHIP CONFIGURATION FEEDSTOCK PRODUCTS
1 Old PHRC, Rivers State NNPC Hydroskimming Bonny light Fuels
2 New PHRC, Rivers State NNPC Conversion Bonny light Fuels
3 WRPC, Delta State NNPC Conversion i. Escravos ii. Ughelli blend.
a. Fuels b. Petrochemicals (Polypropylene & Carbon black)
4 KRPC, Kaduna State NNPC Conversion
i. Escravos ii. Ughelli blend iii. Basra iv. Urals
a. Fuels b. Petrochemicals c. Base Oil
5 NDPR, Rivers State NDPR Topping Ogbelle Diesel
Table 25: Refinery Capacity Utilization
KRPC WRPC New PHRC Old* PHRC NDPR# Total Capacity
Utilization, %
Designed Capacity, BPSD
110,000.00 125,000.00 150,000.00 60,000.00 1,000.00 446,000.00
Crude Oil Processed,
BPSD
2010 21,986.72 53,345.20 19,345.38 - - 94,677.30 21.23%
2011 20896.79 49,731.41 31,853.02 - 222.03 102,703.25 23.03%
2012 31,981.86 34,868.71 24,530.97 - 557.45 91,938.99 20.61%
2013 32,452.43 20,925.04 44,937.47 - 185.18 98,500.12 22.09%
2014 12,160.39 24,049.59 23,557.15 - 503.71 60,270.84 13.51%
2015 3,297.36 8,337.64 9,274.21 - 714.66 21,623.87 4.85%
2016 10,310.69 14,746.13 32,669.98 - 605.43 58,332.23 13.08%
* The Old Port Harcourt Refinery (Old PHRC) was down during the period being reported. # NDPR commenced AGO production in May 2011.
Table 26: 2016 PMS Production Summary
YEARS PMS 2016 REFINERY PRODUCTION IN MT Total, Litres
KRPC New PHRC WRPC Total
January 21,707.00 49,568.00 31,663.69 102,938.70 138,040,796.70
February 0.00 48,134.00 2,808.72 50,942.72 68,314,187.52
March 0.00 27,568.00 6,393.55 33,961.55 45,542,438.55
April 3,086.00 10,481.00 15,830.15 29,397.15 39,421,578.15
May 12,798.00 11,303.00 20,943.26 45,044.26 60,404,352.66
June 13,670.00 33,876.00 22,293.65 69,839.65 93,654,970.65
July 4,256.00 2 22,502.21 26,760.21 35,885,441.61
August 14,683.00 17,798.00 28,815.64 61,296.64 82,198,794.24
September 29,386.00 24,425.00 11,182.45 64,993.45 87,156,216.45
October 15,603.00 11,507.00 13,432.66 40,542.66 54,367,707.06
November 5,020.00 8,113.00 19,553.79 32,686.79 43,832,985.39
December 0.00 24,026.00 14,216.74 38,242.74 51,283,514.34
Total 120,209.00 266,801.00 209,636.50 596,646.50 800,102,983.32
* Old PHRC was not operational during the period under review.

43 | P a g e
Table 27: PMS Production by Refineries
YEARS PMS PRODUCTION, Metric Tonnes
KRPC New PHRC WRPC Total Total, Litres
2010 178,036.37 199,611.02 479,027.07 856,674.46 1,148,800,451.54
2011 305,657.11 393,919.52 501,974.35 1,201,550.98 1,611,279,865.13
2012 309,449.02 226,217.10 330,212.60 865,878.72 1,161,143,364.20
2013 399,536.00 258,326.82 357,720.45 1,015,583.27 1,361,897,160.51
2014 139,350.99 65,110.14 298,876.36 503,337.49 674,975,574.49
2015 40,663.68 56,379.57 84,758.39 281,801.64 377,896,000.22
2016 120,209.00 266,801.00 209,636.51 596,646.50 800,102,983.32
Table 28: 2016 AGO Production Summary
YEARS AGO 2016 REFINERY PRODUCTION in Metric Tonnes Total, Litres
KRPC New PHRC NDPR WRPC Total
January 11,973.00 43,515.00 1,113.96 0.00 56,601.96 65,884,677.00
February 9,648.00 454.00 1,918.38 0.00 12,020.38 13,991,724.00
March 845.00 27,087.00 1,936.55 33,254.00 63,122.55 73,474,647.00
April 2,494.00 40,262.00 190.28 8,037.93 50,984.21 59,345,619.19
May 9,453.00 88,743.00 985.01 18,025.09 117,206.10 136,427,897.76
June 7,622.00 52,621.00 1,562.82 28,999.33 90,805.15 105,697,191.12
July 9,541.00 31,898.00 1,216.95 0.00 42,655.95 49,651,527.00
August 10,889.00 66,532.00 1,858.69 23,746.02 103,025.70 119,921,924.28
September 30,952.00 97,457.00 1,778.78 24,055.98 154,243.80 179,539,734.72
October 9,835.00 25,154.00 1,126.80 28,128.26 64,244.06 74,780,081.64
November 6,066.00 70,424.00 1,692.45 0.00 78,182.45 91,004,370.00
December 394.00 28,588.00 1,306.83 0.00 30,288.83 35,256,201.00
Total 109,712.00 572,735.00 16,687.49 164,246.60 863,381.10 1,004,975,594.71
Table 29: AGO Production by Refineries
YEARS AGO PRODUCTION, Metric Tonnes Total, Litres
KRPC NEW PHRC NDPR* WRPC Total
2010 259,389.13 191,363.89 - 665,285.40 1,116,038.42 1,299,068,721.38
2011 224,750.40 354,710.79 4,325.82 637,286.77 1,221,073.78 1,421,329,877.73
2012 295,094.99 290,817.56 13,299.31 420,117.96 1,019,329.82 1,186,499,913.09
2013 308,460.00 175,646.88 4,579.31 542,428.49 1,031,114.68 1,200,217,487.14
2014 137,831.00 573,017.61 13,479.89 283,063.14 1,007,391.64 1,172,603,874.45
2015 24,055.84 120,184.71 19,167.42 92,874.57 256,282.54 298,312,876.99
2016 109,712.00 572,735.00 16,687.49 164,246.60 863,381.09 1,004,975,588.76
* NDPR commenced AGO production in May 2011.

44 | P a g e
Table 30: 2016 DPK Production Summary
YEARS DPK 2016 REFINERY PRODUCTION in Metric Tonnes
Total, Litres KRPC NEW PHRC WRPC Total
January 6,902 13,054 0 19,956 24,585,792
February 3,262 3,782 0 7,044 8,678,208
March 1,315 12,665 20,936 34,916 43,016,795
April 4,319 30,153 5,189 39,662 48,863,190
May 4,955 30,078 11,817 46,850 57,719,582
June 0 28,034 20,491 48,525 59,783,330
July 4,030 20,754 0 24,784 30,533,888
August 8,225 18,808 16,624 43,657 53,785,461
September 14,340 29,203 17,643 61,186 75,381,312
October 10,469 6,236 26,307 43,012 52,991,252
November 0 28,161 0 28,161 34,694,352
December 0 21,345 0 21,345 26,297,040
Total 57,817 242,273 119,009 419,099 516,330,202
Table 31: DPK Production by Refineries
YEARS DPK PRODUCTION, Metric Tonnes
Total, Litres KRPC New PHRC WRPC Total
2010 120,740.93 148,250.59 403,943.34 672,934.86 829,055,748.07
2011 119,243.93 237,189.30 385,651.46 742,084.69 914,248,338.68
2012 162,269.01 158,058.35 276,130.76 596,458.12 734,836,404.33
2013 200,361.99 138,622.59 381,348.00 720,332.58 887,449,739.15
2014 89,083.95 182,192.37 196,719.64 467,995.96 576,571,023.10
2015 20,603.90 68,732.95 74,272.73 163,609.58 201,567,000.13
2016 57,817.00 242,273.00 119,009.20 419,099.20 516,330,202.08
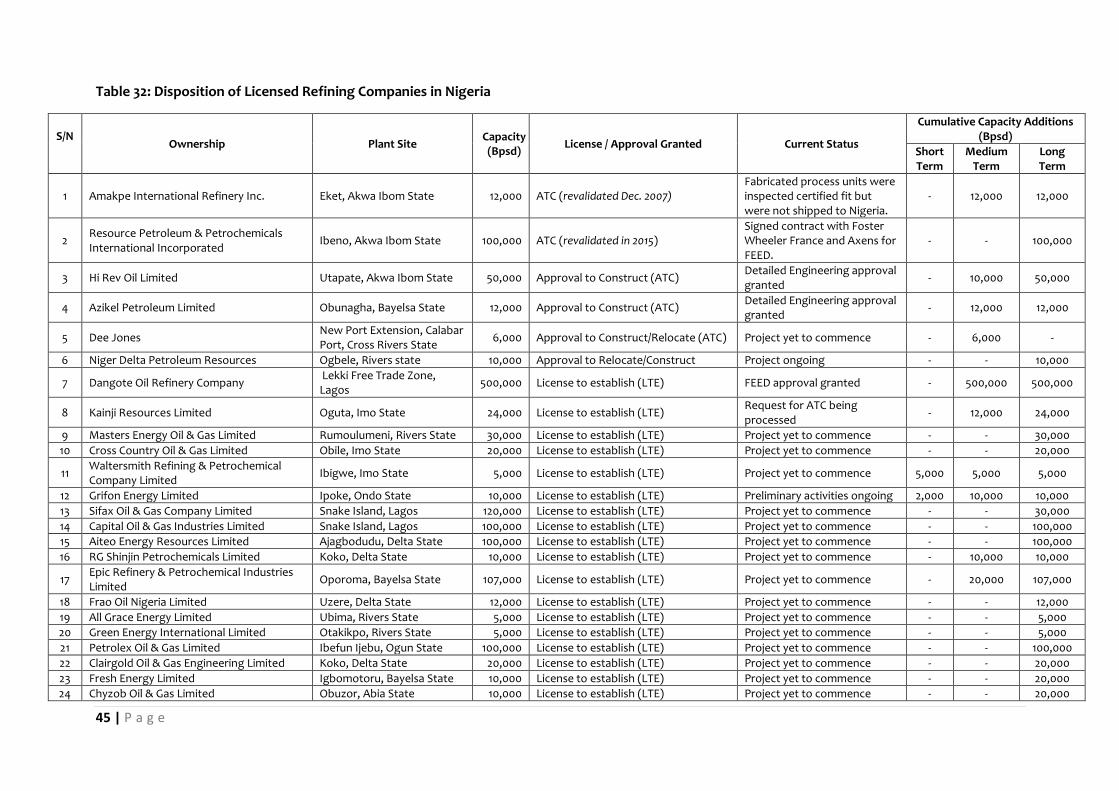
45 | P a g e
Table 32: Disposition of Licensed Refining Companies in Nigeria
S/N Ownership Plant Site
Capacity (Bpsd)
License / Approval Granted Current Status
Cumulative Capacity Additions (Bpsd)
Short Term
Medium Term
Long Term
1 Amakpe International Refinery Inc. Eket, Akwa Ibom State 12,000 ATC (revalidated Dec. 2007) Fabricated process units were inspected certified fit but were not shipped to Nigeria.
- 12,000 12,000
2 Resource Petroleum & Petrochemicals International Incorporated
Ibeno, Akwa Ibom State 100,000 ATC (revalidated in 2015) Signed contract with Foster Wheeler France and Axens for FEED.
- - 100,000
3 Hi Rev Oil Limited Utapate, Akwa Ibom State 50,000 Approval to Construct (ATC) Detailed Engineering approval granted
- 10,000 50,000
4 Azikel Petroleum Limited Obunagha, Bayelsa State 12,000 Approval to Construct (ATC) Detailed Engineering approval granted
- 12,000 12,000
5 Dee Jones New Port Extension, Calabar Port, Cross Rivers State
6,000 Approval to Construct/Relocate (ATC) Project yet to commence - 6,000 -
6 Niger Delta Petroleum Resources Ogbele, Rivers state 10,000 Approval to Relocate/Construct Project ongoing - - 10,000
7 Dangote Oil Refinery Company Lekki Free Trade Zone, Lagos
500,000 License to establish (LTE) FEED approval granted - 500,000 500,000
8 Kainji Resources Limited Oguta, Imo State 24,000 License to establish (LTE) Request for ATC being processed
- 12,000 24,000
9 Masters Energy Oil & Gas Limited Rumoulumeni, Rivers State 30,000 License to establish (LTE) Project yet to commence - - 30,000
10 Cross Country Oil & Gas Limited Obile, Imo State 20,000 License to establish (LTE) Project yet to commence - - 20,000
11 Waltersmith Refining & Petrochemical Company Limited
Ibigwe, Imo State 5,000 License to establish (LTE) Project yet to commence 5,000 5,000 5,000
12 Grifon Energy Limited Ipoke, Ondo State 10,000 License to establish (LTE) Preliminary activities ongoing 2,000 10,000 10,000
13 Sifax Oil & Gas Company Limited Snake Island, Lagos 120,000 License to establish (LTE) Project yet to commence - - 30,000
14 Capital Oil & Gas Industries Limited Snake Island, Lagos 100,000 License to establish (LTE) Project yet to commence - - 100,000
15 Aiteo Energy Resources Limited Ajagbodudu, Delta State 100,000 License to establish (LTE) Project yet to commence - - 100,000
16 RG Shinjin Petrochemicals Limited Koko, Delta State 10,000 License to establish (LTE) Project yet to commence - 10,000 10,000
17 Epic Refinery & Petrochemical Industries Limited
Oporoma, Bayelsa State 107,000 License to establish (LTE) Project yet to commence - 20,000 107,000
18 Frao Oil Nigeria Limited Uzere, Delta State 12,000 License to establish (LTE) Project yet to commence - - 12,000
19 All Grace Energy Limited Ubima, Rivers State 5,000 License to establish (LTE) Project yet to commence - - 5,000
20 Green Energy International Limited Otakikpo, Rivers State 5,000 License to establish (LTE) Project yet to commence - - 5,000
21 Petrolex Oil & Gas Limited Ibefun Ijebu, Ogun State 100,000 License to establish (LTE) Project yet to commence - - 100,000
22 Clairgold Oil & Gas Engineering Limited Koko, Delta State 20,000 License to establish (LTE) Project yet to commence - - 20,000
23 Fresh Energy Limited Igbomotoru, Bayelsa State 10,000 License to establish (LTE) Project yet to commence - - 20,000
24 Chyzob Oil & Gas Limited Obuzor, Abia State 10,000 License to establish (LTE) Project yet to commence - - 20,000

46 | P a g e
S/N Ownership Plant Site
Capacity (Bpsd)
License / Approval Granted Current Status
Cumulative Capacity Additions (Bpsd)
Short Term
Medium Term
Long Term
25 Eko Petrochem & Refining Company Ltd. Tomaro Island, Lagos State 20,000 License to Establish (LTE) Project yet to commence - 20,000 20,000
26 Associated Worldwide Company Limited Eket, Akwa Ibom State 20,000 License to Establish (LTE) Project yet to commence - - 20,000
27 Energia Limited Kwale, Delta State 20,000 License to Establish (LTE) Project yet to commence - - 20,000
28 Shepha Petroleum & Petrochemicals Co. Ltd
Ovrode, Delta State 30,000 License to Establish (LTE) Project yet to commence - 30000 -
29 Conodit Refinery Nigeria Limited Umukwata, Delta State 20,000 License to Establish (LTE) Project yet to commence - 20000 -
30 Don Mac Ltd. Oben, Edo State 10,000 License to Establish (LTE) Project yet to commence - 10000 -
31 Ikwe-Onna Refinery Ltd Ikwe, Akwa Ibom State 5,000 License to Establish (LTE) Project yet to commence - 5000 -
32 Southfield Petrochemical & Refinery Ltd. Owanoba, Edo State 20,000 License to Establish (LTE) Project yet to commence - 20000 -
33 Mondonat Nigeria Ltd. Okpaka, Delta State 20,000 License to Establish (LTE) Project yet to commence - 20000 -
34 Kingdom Global Trading Petroleum & Gas Nig. Ltd.
Okwagbe, Ughelli south L.G.A., Delta state
12,000 License to Establish (LTE) Project yet to commence - 12000 -
35 Platinum Hydrocarbon Resources Ltd. Ikwewu-Amukpe, Sapele, L.G.A. Delts state
10,000 License to Establish (LTE) Project yet to commence - 10000 -
Anticipated Capacity Additions 7,000 744,000 1,362,000
4.2.2 Petroleum Product Importation
Table 33: Petroleum Products Volumes as per Import Permits Issued (Metric Tonnes) *
YEARS PMS AGO DPK ATK LPFO BASE OIL CHEMICALS BITUMEN ADDITIVES
2014 10,665,337 14,356,908 705,000 2,623,500 1,640,000 1,327,400 90,000 1,105,500 120,000
2015 10,104,300 14,981,597 1,312,000 3,884,500 2,340,800 1,602,680 - 952,300 -
2016 14,052,500 20,116,000 3,708,500 3,733,000 1,853,000 1,616,450 - 665,250 -
*This excludes importation by NNPC

47 | P a g e
Table 34: 2016 Petroleum Products Volumes as per Import Permits Issued (Metric Tonnes) *
MONTHS PMS (MT) AGO (MT) HHK (MT) ATK (MT) FUEL OIL (MT) BASE OIL (MT) BITUMEN (MT)
JANUARY 620,000 4,124,000 300,000 420,000 205,000 166,000 120,000
FEBRUARY 485,000 1,370,000 190,000 510,000 215,000 225,900 30,000
MARCH 1,705,000 1,839,000 280,000 200,000 70,000 145,000 30,000
APRIL 1,340,000 1,821,000 252,500 565,000 330,000 207,000 130,000
MAY 325,000 712,000 10,000 155,000 190,000 57,000 30,000
JUNE 1,045,000 2,623,500 420,000 198,000 70,000 178,050 60,000
JULY 1,630,000 1,670,000 445,000 365,000 145,000 117,000 95,000
AUGUST 1,613,000 1,546,000 390,000 333,000 295,000 200,500 15,000
SEPTEMBER 1,080,000 1,181,000 316,000 215,000 133,000 58,500 3,700
OCTOBER 1,480,500 1,048,000 400,000 132,000 15,000 43,500 30,000
NOVEMBER 2,145,000 1,624,000 570,000 525,000 175,000 163,000 90,000
DECEMBER 584,000 557,500 135,000 115,000 10,000 55,000 31,550
TOTAL 14,052,500 20,116,000 3,708,500 3,733,000 1,853,000 1,616,450 665,250
*This excludes importation by NNPC

48 | P a g e
Table 35: Petroleum Products Import Summary, Metric Tonnes
Table 36: 2016 Petroleum Products Import Summary, Metric Tonnes
PMS AGO DPK ATK LPG LPFO Base Oil Bitumen
January 1,219,683.45 327,546.73 64,438.98 0.00 - 23,016.85 24,063.12 5,678.55
February 900,506.84 443,485.52 128,809.52 43,122.58 - 16,926.01 19,925.29 17,236.48
March 1,111,013.11 400,704.57 67,059.22 38,116.72 - 24,174.90 19,880.82 23,500.82
April 1,146,933.64 373,466.84 23,982.25 55,323.10 - 56,376.10 12,364.97 12,076.52
May 1,496,059.75 335,126.51 72,532.94 66,752.53 - 29,650.42 16,461.25 10,414.64
June 1,092,924.14 287,113.15 14,507.49 41,859.26 - 34,532.49 7,000.00 11,603.82
July 1,044,943.52 432,589.08 54,772.72 79,795.95 - 59,952.94 25,576.97 2,614.40
August 1,151,409.62 475,481.27 29,100.74 35,686.01 - 21,555.19 27,184.20 11,563.94
September 930,942.54 195,528.81 17,836.61 89,820.30 - 10,018.94 51,946.07 10,105.87
October 1,083,422.49 126,113.22 0.00 19,185.62 - 13,519.88 33,141.45 5,457.36
November 1,150,163.49 199728.09 10,304.93 22,460.97 - 6,939.39 - 11,604.37
December 1,229,229.23 236,432.50 0.00 46,715.90 - - - 20,332.54 22,909.15
Total 13,557,231.82 3,833,316.28 483,345.40 538,838.94 - 296,663.12 257,876.67 144,765.90
YEARS PMS AGO DPK ATK LPG LPFO BASE OIL BITUMEN
2008 8,633,472.14 2,198,744.97 1,496,246.81
2009 10,476,266.37 3,292,612.00 1,403,004.77
2010 11,902,519.70 2,605,288.11 1,512,236.07
2011 15,278,901.22 2,055,338.23 1,471,863.10
2012 11,349,633.48 1,803,929.68 1,753,309.69
2013 12,390,826.30 2,143,910.22 2,136,631.32
2014 13,505,465.72 3,253,232.85 2,316,190.02 344,110.39 - 153,423.34 205,861.86 350,215.47
2015 13,393,574.20 3,776,495.79 1,530,164.48 418,243.20 8,158.52 58,028.41 211,529.12 109,601.28
2016 13,557,231.82 3,833,316.28 483,345.40 538,838.94 - 296,663.12 257,876.67 144,765.90

49 | P a g e
Table 37: Summary of 2016 Petroleum Products Importation by Market Segment, Metric Tonnes
MARKET SEGMENT /
PRODUCT JANUARY FEBRUARY MARCH APRIL MAY JUNE JULY AUGUST SEPTEMBER OCTOBER NOVEMBER DECEMBER TOTAL TOTAL, Litres
PPMC
PMS 584,802.36 703,596.55 667,169.69 719,159.05 895,439.86 711,437.14 649,231.74 518,065.73 248,771.17 574,459.81 607,732.07 424,203.47 7,304,068.64 9,794,756,046.24
AGO 0
0
0
0
0
0
0
9,888.76 0
0
19,580.90 0
29,469.66 34,302,684.24
DPK 49,423.51 59,615.62 38,438.98 9,913.92 38,877.93 0
0
0
0
0
0
0
196,269.96 241,804,590.72
ATK 0
0
0
0
0
0
0
0
55,821.94 0
0
32,264.90 88,086.84 108,522,986.88
LPFO 0
0
0
0
0
0
0
0
0
0
0
0
0
0
BASE OIL 0
0
0
0
0
0
0
0
0
0
0
0
0
0
BITUMEN 0
0
0
0
0
0
0
0
0
0
0
0
0
0
MAJOR MARKETERS
PMS 222,414.83 37,318.82 215,273.39 89,355.92 278,968.14 220,664.12 94,067.37 185,601.29 108,934.29 86,719.16 168,546.21 129,759.07 1,837,622.61 2,464,251,920.01
AGO 32,783.72 6,373.75 0
20,101.10 14,981.22 35,136.06 14,994.40 42,678.65 15,867.72 37,764.40 5,019.04 5 62,412.85 283,093.86 329,521,253.04
DPK 0
0
0
0
0
0
0
0
0
0
0
0
0
0
ATK 23,131.71 38,402.90 31,427.17 26,640.20 27,217.83 12,737.39 10,893.00 14,451.00 184,901.20 227,798,274.70
LPFO 0
0
0
0
0
0
0
0
0
0
0
0
0
0
BASE OIL 8,907.00 8,334.90 3,895.06 0
3,880.22 0
10,954.00 12,300.27 3,980.38 3,873.50 0
4,196.91 60,322.24 64,363,830.08
BITUMEN 0
0
0
0
0
0
0
0
0
0
0
0
0
0
INDEPENDENT MARKETERS
PMS 412,466.26 159,591.47 228,570.03 338,418.67 321,651.75 160,822.88 301,644.41 447,742.60 573,237.08 422,243.52 373,885.21 675,266.68 4,415,540.56 5,921,239,890.96
AGO 294,763.01 437,111.77 400,704.57 353,365.74 320,145.29 251,977.09 417,594.68 422,913.86 179,661.09 88,348.82 175,128.14 174,019.65 3,515,733.71 4,092,314,038.44
DPK 15,015.47 69,193.90 28,620.24 14,068.33 33,655.01 14,507.49 54,772.72 29,100.74 17,836.61 0
10,304.93 0
287,075.44 353,676,942.08
ATK 0 19,990.87 38,116.72 16,920.20 35,325.36 15,219.06 52,578.12 22,948.63 23,105.36 19,185.62 22,460.97
0 265,850.91 327,528,317.42
LPFO 23,016.85 16,926.01 24,174.90 56,376.10 29,650.42 34,532.49 59,952.94 21,555.19 10,018.94 13,519.88 6,939.39 0
296,663.12 0
BASE OIL 15,156.12 11,590.39 15,985.76 12,364.97 12,581.03 7,000.00 14,622.97 14,883.93 47,965.69 29,267.95 0
16,135.63 197,554.43 210,790,578.94
BITUMEN 5,678.55 17,236.48 23,500.82 12,076.52 10,414.64 11,603.82 2,614.40 11,563.94 10,105.87 5,457.36 11,604.37 22,909.15 144,765.90 139,264,676.40
# All volumes are in Metric tonnes

50 | P a g e
Table 38: Summary of Petroleum Products Importation by Market Segment (2010 – 2016)
MARKET SEGMENT / PRODUCT 2010 2011 2012 2013 2014 2015 2016 TOTAL Total, Litres
PPMC
PMS 6,375,558.77 5,419,528.90 5,368,476.91 4,873,097.95 4,893,264.66 5,289,031.18 7,304,068.64 39,523,027.01 53,000,379,220.41
AGO 301,543.91 513,474.51 29,146.94 31,470.15 96,777.60 13,034.75 29,469.66 1,014,917.52 1,181,363,993.28
DPK 1,275,822.65 1,244,513.78 1,310,101.18 1,341,844.70 1,348,224.50 888,733.01 196,269.96 7,605,509.78 9,369,988,048.96
ATK 0 0 0 0 0 0 88,086.84 88,086.84 108,522,986.88
LPFO 10,005.86 0 0 0 0 0 0 10,005.86 10,506,153.00
BASE OIL 0 0 0 0 0 0 0 0 0
BITUMEN 0 0 0 0 0 0 0 0 0
MAJOR MARKETERS
PMS 1,799,245.07 2,902,728.13 1,759,150.28 1,930,515.51 2,228,000.82 1,831,560.30 1,837,622.61 14,288,822.72 19,161,311,267.52
AGO 269,274.93 321,129.72 363,802.16 435,171.93 368,267.47 230,854.77 283,093.86 2,271,594.84 2,644,136,393.76
DPK 34,742.79 4,688.54 4,998.35 14,912.59 9,871.29 4,987.36 0 74,200.92 91,415,533.44
ATK 332,152.00 409,190.11 412,145.93 342,319.63 279,138.00 189,477.17 184,901.20 2,149,324.04 2,647,967,213.58
LPFO 11,471.05 37,188.47 61,365.05 0 6,698 9,609.00 0 126,331.57 132,648,148.50
BASE OIL 0 0 0 0 0 0 60,322.24 60,322.24 64,363,830.08
BITUMEN 0 0 0 0 0 0 0 0 0
INDEPENDENT MARKETERS
PMS 3,727,715.85 6,956,644.19 4,222,006.28 5,587,212.84 6,384,200.25 6,396,124.53 4,415,540.56 37,689,444.50 50,541,545,074.50
AGO 2,034,469.27 1,220,734.00 1,410,980.58 1,677,268.13 2,788,187.78 3,537,364.10 3,515,733.71 16,184,737.57 18,839,034,531.48
DPK 201,670.63 222,660.78 438,210.16 779,874.03 958,094.23 636,444.11 287,075.44 3,524,029.38 4,341,604,196.16
ATK 122,125.29 70,150.55 112,930.98 70,662.48 64,972.39 251,212.03 265,850.91 957,904.63 1,180,138,500.46
LPFO 149,049.79 66,613.02 27,067.05 14,953.80 146,725.34 53,931.19 296,663.12 755,003.31 792,753,479.70
BASE OIL 0 0 0 0 0 0 197,554.43 197,554.43 210,790,578.94
BITUMEN 0 0 0 0 0 0 144,765.90 144,765.90 139,264,676.40

51 | P a g e
4.2.3 Petroleum Products Importation / Local Production
Figure 15: PMS Local Production vs Importation
Figure 16: AGO Local Production vs Importation
Figure 17: DPK Local Production vs Importation
0
5,000,000
10,000,000
15,000,000
20,000,000
2010 2011 2012 2013 2014 2015 2016
Vo
lum
e, M
etr
ic T
on
ne
s
Year
PMS Local Production vs Import
PMS Import PMS Local Production
0
1,000,000
2,000,000
3,000,000
4,000,000
5,000,000
2010 2011 2012 2013 2014 2015 2016
Vo
lum
e, M
etr
ic T
on
ne
s
Year
AGO Local Production vs Import
AGO Import AGO Local Production
0
500,000
1,000,000
1,500,000
2,000,000
2,500,000
3,000,000
2010 2011 2012 2013 2014 2015 2016
Vo
lum
e, M
etr
ic T
on
ne
s
Year
DPK Local Production vs Import
DPK Import DPK Local Production

52 | P a g e
4.2.4 Petroleum Products Average Pricing
Table 39: Petroleum Products Average Consumer Price Range (Naira per Litre)
PMS AGO DPK
2010
Major 64-65 100-117 50-70
Independent Marketers 65-70 100-130 50-85
NNPC 65 106 50
2011
Major 64-65 115-170 50-70
Independent Marketers 65-70 120-180 100-160
NNPC 65 110-115 50
2012
Major 97 145-170 50
Independent Marketers 97-120 150-180 110-140
NNPC 97 145 50
2013
Major 97 150-170 135-140
Independent Marketers 97-130 140-170 135-140
NNPC 97 160 50
2014
Major 97 145-170 50
Independent Marketers 97-100 150-180 100-150
NNPC 97 150-175 50
2015
Major 86.50-97 150-170 50
Independent Marketers 86.50-180 130-175 50-150
NNPC 86.50-97 150-155 50
2016
Major
Independent Marketers
NNPC
4.2.5 Retail Outlets
Table 40: Retail Outlets Summary - Filling Stations Count
STATE MAJOR MAKETERS INDEPENDENT MAKETERS TOTAL
Abia 778 77 855
Adamawa 251 129 380
Akwa-Ibom 467 110 577
Anambra 1650 35 1685
Bauchi 698 51 749
Bayelsa 326 61 387
Benue 112 8 120
Borno 437 95 532
Cross River 1072 86 1158
Delta 312 62 374
Ebonyi 834 94 928
Edo 167 20 187
Ekiti 422 63 485
Enugu 160 30 190
FCT 540 80 620
Gombe 246 71 317
Imo 1007 111 1118
Jigawa 399 54 453
Kaduna 1239 230 1469
Kano 1322 263 1585
Katsina 667 65 732
Kebbi 759 99 858
Kogi 574 57 631
Kwara 1128 165 1293
Lagos 1516 943 2459
Nasarawa 438 70 508

53 | P a g e
STATE MAJOR MAKETERS INDEPENDENT MAKETERS TOTAL
Niger 681 105 786
Ogun 2093 304 2397
Ondo 612 109 721
Osun 894 125 1019
Oyo 1613 278 1891
Plateau 437 133 570
Rivers 940 239 1179
Sokoto 560 85 645
Taraba 535 98 633
Yobe 388 59 447
Zamfara 236 46 282
Total 26510 4710 31220

54 | P a g e
Table 41: Storage Capacities of Retail Outlets by States
S/N STATES MAJORS INDEPENDENT NNPC TOTAL
PMS(ltrs) AGO (ltrs) DPK (ltrs) PMS (ltrs) AGO (ltrs) DPK (ltrs) PMS AGO DPK PMS (ltrs) AGO (ltrs) DPK (ltrs)
1 Abia 65,190,259 30,453,646 26,503,875 5,839,060 2,395,780 2,021,420 200,000 100,000 100,000 71,229,319 32,949,426 28,625,295
2 Adamawa 29,258,509 11,372,800 9,376,770 16,536,100 5,400,050 4,690,950 200,000 100,000 100,000 45,994,609 16,872,850 14,167,720
3 Akwa-Ibom
31,676,800 17,049,200 16,528,700 8,073,500 3,877,300 3,760,700 200,000 100,000 100,000 39,950,300 21,026,500 20,389,400
4 Anambra 53,346,273 25,808,934 25,061,915 2,329,260 911,480 831,860 200,000 100,000 100,000 55,875,533 26,820,414 25,993,775
5 Bauchi 58,266,800 27,321,170 22,701,480 3,930,660 1,638,080 1,349,520 200,000 100,000 100,000 62,397,460 29,059,250 24,151,000
6 Bayelsa 23,643,560 12,056,212 11,141,210 5,266,680 2,219,200 1,968,140 200,000 100,000 100,000 29,110,240 14,375,412 13,209,350
7 Benue 10,026,500 4,194,000 4,216,000 10,026,500 4,194,000 4,216,000 200,000 100,000 100,000 20,253,000 8,488,000 8,532,000
8 Borno 33,128,660 16,936,250 15,202,180 7,097,800 3,367,860 2,901,580 200,000 100,000 100,000 40,426,460 20,404,110 18,203,760
9 Cross River
73,986,500 39,877,300 36,304,300 73,986,500 39,877,300 36,304,300 200,000 100,000 100,000 148,173,000 79,854,600 72,708,600
10 Delta 24,643,100 11,619,370 10,690,410 4,412,160 1,801,480 1,884,980 200,000 100,000 100,000 29,255,260 13,520,850 12,675,390
11 Ebonyi 58,998,220 31,217,500 27,511,020 6,740,600 3,224,940 2,694,980 200,000 100,000 100,000 65,938,820 34,542,440 30,306,000
12 Edo 10,720,158 5,994,140 5,118,850 772,690 635,560 426,860 200,000 100,000 100,000 11,692,848 6,729,700 5,645,710
13 Ekiti 28,767,965 17,133,500 13,640,580 4,350,415 1,975,960 1,581,200 200,000 100,000 100,000 33,318,380 19,209,460 15,321,780
14 Enugu 9,679,650 5,017,710 4,704,540 1,972,910 673,240 753,120 200,000 100,000 100,000 11,852,560 5,790,950 5,557,660
15 FCT 40,026,135 21,345,158 17,612,097 5,262,964 1,971,560 1,660,180 200,000 100,000 100,000 45,489,099 23,416,718 19,372,277
16 Gombe 18,887,400 9,120,600 8,832,890 4,916,900 2,468,920 2,217,260 200,000 100,000 100,000 24,004,300 11,689,520 11,150,150
17 Imo 80,528,693 38,015,085 33,282,780 7,130,630 3,451,840 3,017,260 200,000 100,000 100,000 87,859,323 41,566,925 36,400,040
18 Jigawa 24,292,500 13,715,000 12,771,000 3,314,940 1,877,000 1,574,660 200,000 100,000 100,000 27,807,440 15,692,000 14,445,660
19 Kaduna 78,442,128 44,835,880 41,039,780 19,619,260 7,773,160 7,054,030 200,000 100,000 100,000 98,261,388 52,709,040 48,193,810
20 Kano 109,242,314 50,337,294 43,976,980 109,242,314 50,337,294 43,976,980 200,000 100,000 100,000 218,684,628 100,774,588 88,053,960
21 Katsina 49,080,588 24,064,400 22,395,170 5,117,460 2,235,960 2,020,400 200,000 100,000 100,000 54,398,048 26,400,360 24,515,570
22 Kebbi 50,390,000 25,812,500 25,191,500 50,390,000 25,812,500 25,191,500 200,000 100,000 100,000 100,980,000 51,725,000 50,483,000
23 Kogi 39,293,790 20,331,440 18,662,520 3,402,700 1,709,460 1,692,280 200,000 100,000 100,000 42,896,490 22,140,900 20,454,800
24 Kwara 68,052,760 38,320,680 34,816,132 3,402,700 1,709,460 1,692,280 200,000 100,000 100,000 71,655,460 40,130,140 36,608,412
25 Lagos 145,415,360 66,323,160 57,580,780 98,035,399 34,759,600 30,794,380 200,000 100,000 100,000 243,650,759 101,182,760 88,475,160
26 Nasarawa 33,042,160 16,790,440 15,062,280 5,059,170 2,633,000 2,333,000 200,000 100,000 100,000 38,301,330 19,523,440 17,495,280
27 Niger 44,658,960 24,885,089 22,720,610 8,551,000 3,863,860 3,544,470 200,000 100,000 100,000 53,409,960 28,848,949 26,365,080
28 Ogun 150,338,550 84,269,080 75,793,760 23,802,920 10,774,780 9,288,300 200,000 100,000 100,000 174,341,470 95,143,860 85,182,060
29 Ondo 35,123,510 16,875,350 17,309,450 7,018,650 23,291,840 2,961,260 200,000 100,000 100,000 42,342,160 40,267,190 20,370,710
30 Osun 53,623,220 29,035,790 28,281,140 7,553,660 2,960,000 3,086,680 200,000 100,000 100,000 61,376,880 32,095,790 31,467,820
31 Oyo 101,417,480 54,526,770 50,662,880 18,632,700 7,056,580 6,833,560 200,000 100,000 100,000 120,250,180 61,683,350 57,596,440
32 Plateau 30,620,495 15,794,671 14,189,540 11,040,956 5,213,980 4,009,540 200,000 100,000 100,000 41,861,451 21,108,651 18,299,080
33 Rivers 82,069,609 38,954,866 35,496,328 20,887,730 8,430,796 7,927,392 200,000 100,000 100,000 103,157,339 47,485,662 43,523,720
34 Sokoto 42,683,000 20,436,000 19,236,300 6,032,000 3,248,000 2,939,000 200,000 100,000 100,000 48,915,000 23,784,000 22,275,300

55 | P a g e
S/N STATES MAJORS INDEPENDENT NNPC TOTAL
PMS(ltrs) AGO (ltrs) DPK (ltrs) PMS (ltrs) AGO (ltrs) DPK (ltrs) PMS AGO DPK PMS (ltrs) AGO (ltrs) DPK (ltrs)
35 Taraba 38,578,900 20,940,500 18,945,100 6,158,814 3,895,112 3,331,400 200,000 100,000 100,000 44,937,714 24,935,612 22,376,500
36 Yobe 24,130,900 14,305,500 13,116,800 4,406,200 2,194,200 2,006,000 200,000 100,000 100,000 28,737,100 16,599,700 15,222,800
37 Zamfara 17,266,000 8,043,000 7,800,810 2,999,910 1,467,000 1,345,510 200,000 100,000 100,000 20,465,910 9,610,000 9,246,320
Total 1,868,537,406 953,129,985 863,478,457 583,313,812 281,328,132 235,882,932 7,400,000 3,700,000 3,700,000 2,459,251,218 1,238,158,117 1,103,061,389

56 | P a g e
4.2.6 Petrochemicals
Table 42: Petrochemical Plants
S/N PLANT
LOCATION OWNERSHIP
PROCESSING PLANT & CAPACITY FEEDSTOCK PRODUCTS
TYPE MTPA
1 Warri, Delta State
NNPC Polypropylene (PP) 35,000 Propylene-rich Feed (PRF)
Polypropylene (PP)
Carbon Black (CB) 18,000 Decant oil Carbon Black (CB)
2 Kaduna, Kaduna State
NNPC Linear Alkyl Benzene (LAB)
30,000 i. Raw kerosene i. Linear Alkyl Benzene (LAB)
ii. Reformate ii. Heavy 2
iii. Kero solvent
3 Eleme, Rivers State
i. Indorama Polypropylene (PP) 120,000 i. Propylene-rich Feed (PRF)
i. Polypropylene Homo-polymer (PPHP)
ii. Federal Govt.
ii. Natural Gas Liquid (NGL)
ii. Polypropylene Co-polymer (PPCP)
iii.Rivers State Govt.
Polyethylene (PE) 360,000
i. High Density Polyethylene (HDPE)
ii. Linear Low Density Polyethylene (LLDPE)
Olefin 440,000 Olefin
4.2.7 Lubricant Blending Plants
Table 43: List of Licensed Base Oil Marketers and Storage Capacities.
S/N MARKETER CATEGORY
NAME OF COMPANY LOCATION BASE OIL STORAGE CAPACITY (LITERS)
1
Majors
Total Nigeria Plc Apapa, Lagos 9,825,400
2 MRS Oil Nigeria Plc Apapa, Lagos 11,000,000
3 Conoil Plc Apapa, Lagos 9,075,130
4 Mobil Oil Nig. Plc Apapa, Lagos 7,080,000
5 Forte Oil Plc (Forte) Apapa, Lagos 8,000,000
6 Total Nigeria Plc Koko, Delta 10,050,000
7 Total Nig Plc Kudenda, Kaduna South 1,300,000
8 Oando Plc II Chikun, Kaduna. 7,200,000
9 Oando Plc I Rido Chikun, Kaduna 8,067,170
10 Oando Marketing Plc Apapa, Lagos 9350000
Subtotal 80,947,700
11
Independent
Grand Petroleum & Chemicals Ltd. Amuwo-Odofin, Lagos 10,000,000
12 Bestlub International Nig.Ltd. Apapa Lagos 360,000
13 Fudia Petrochemical Ltd. Isolo Lagos 540,000
14 Honeywell Oil & Gas Ltd. Ilupeju, Lagos 165,000
15 Highlight Oil and Gas Limited Agbodi Village, Ogun 375,000
16 Eterna Industries Plc. Sagamu, Ogun 935,000
17 Ascon Oil Company Ltd Magboro, Ifo, Ogun 335,000
18 Moye Oil & Chemical Limited Osogbo, Osun 926,179
19 Lubcon Limited Ilorin west, Kwara 5,000,000
20 Equatorial Pet. Coastal & Process Ltd. Ilorin, Kwara 2,000,000
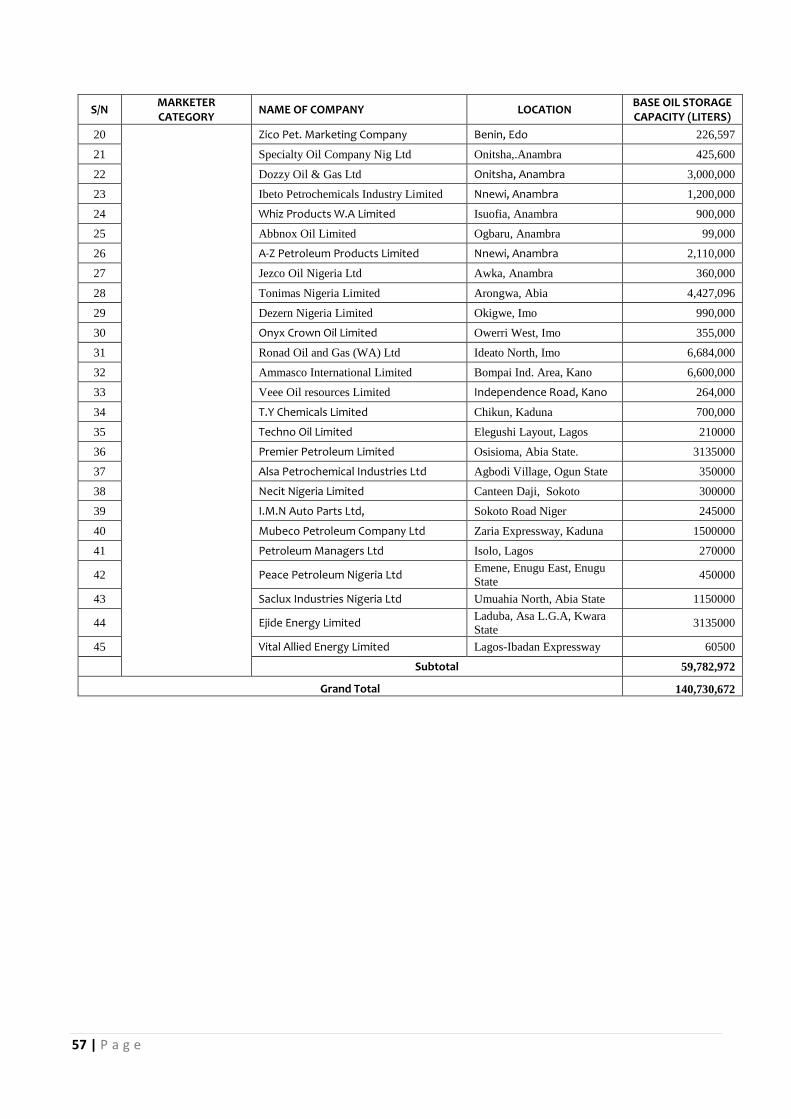
57 | P a g e
S/N MARKETER CATEGORY
NAME OF COMPANY LOCATION BASE OIL STORAGE CAPACITY (LITERS)
20 Zico Pet. Marketing Company Benin, Edo 226,597
21 Specialty Oil Company Nig Ltd Onitsha,.Anambra 425,600
22 Dozzy Oil & Gas Ltd Onitsha, Anambra 3,000,000
23 Ibeto Petrochemicals Industry Limited Nnewi, Anambra 1,200,000
24 Whiz Products W.A Limited Isuofia, Anambra 900,000
25 Abbnox Oil Limited Ogbaru, Anambra 99,000
26 A-Z Petroleum Products Limited Nnewi, Anambra 2,110,000
27 Jezco Oil Nigeria Ltd Awka, Anambra 360,000
28 Tonimas Nigeria Limited Arongwa, Abia 4,427,096
29 Dezern Nigeria Limited Okigwe, Imo 990,000
30 Onyx Crown Oil Limited Owerri West, Imo 355,000
31 Ronad Oil and Gas (WA) Ltd Ideato North, Imo 6,684,000
32 Ammasco International Limited Bompai Ind. Area, Kano 6,600,000
33 Veee Oil resources Limited Independence Road, Kano 264,000
34 T.Y Chemicals Limited Chikun, Kaduna 700,000
35 Techno Oil Limited Elegushi Layout, Lagos 210000
36 Premier Petroleum Limited Osisioma, Abia State. 3135000
37 Alsa Petrochemical Industries Ltd Agbodi Village, Ogun State 350000
38 Necit Nigeria Limited Canteen Daji, Sokoto 300000
39 I.M.N Auto Parts Ltd, Sokoto Road Niger 245000
40 Mubeco Petroleum Company Ltd Zaria Expressway, Kaduna 1500000
41 Petroleum Managers Ltd Isolo, Lagos 270000
42 Peace Petroleum Nigeria Ltd Emene, Enugu East, Enugu
State 450000
43 Saclux Industries Nigeria Ltd Umuahia North, Abia State 1150000
44 Ejide Energy Limited Laduba, Asa L.G.A, Kwara
State 3135000
45 Vital Allied Energy Limited Lagos-Ibadan Expressway 60500
Subtotal 59,782,972
Grand Total 140,730,672

58 | P a g e
4.3 GAS
4.3.1 Domestic Gas Supply Obligation (DGSO)
Table 44: Domestic Gas Supply Obligation Performance
YEARS PERFORMANCE
SPDC CNL EXXON MOBIL NAOC TOTAL/ EPNL NPDC ADDAX/ NNPC PSC PAN OCEAN SEPLAT MONIPULO NIGER DELTA PLATFORM FRONTIER Universal AMNI CONOIL CONOG Brittania U Dubr
i NNPC PSC Total
2008
Obligation 849 351 459 245 217 45 0 65 0 2231
Supply 355 185 0 176 0 0 0 0 0 716
% Perf 41.81 52.71 0 71.84 0 0 N/A 0 N/A 32.09
2009
Obligation 1100 455 517 328 270 120 140 65 0 2995
Supply 379 185 0 188 0 0 0 0 0 752
% Perf 34.45 40.66 0 57.32 0 0 0 0 N/A 25.11
2010
Obligation 1364 564 640 415 327 120 140 65 0 3635
Supply 530 168 0 97 0 0 0 0 0 795
% Perf. 38.86 29.79 0 23.37 0 0 0 0 N/A 21.87
2011
Obligation 1559 644 732 479 368 120 140 65 0 4107
Supply 553 268 0 101 0 0 0 44.4 0 966.4
% Perf. 35.47 41.61 0 21.09 0 0 0 68.31 N/A 23.53
2012
Obligation 1753 725 823 544 410 120 144 65 0 4584
Supply 538 358 0 120 0 65 0 36 0 1117
% Perf. 30.69 49.38 0 22.06 0 54.17 0 55.38 N/A 24.37
2013
Obligation 1948 805 915 608 452 120 160 65 0 5073
Supply 156.69
318.28 0 87.29 0 321 0 17.39 130 1030.65
% Perf. 8.04 39.54 0 14.36 0 267.5 0 26.75 0 20.32
2014
Obligation 550 500 400 300 250 700 0 20 150 11 5 20 7.5 5 8 5 5 1 3 1000 3940.5
Supply 209.4 494 0 95 0 344 0 12.86 125 0 0 0 19.01 0 0 0 0 0 0 0 1299.27
% Perf. 38.07 98.8 0 31.67 0 49.14 N/A 64.3 83.33 0 0 0 253.47 0 0 0 0 0 0 0 32.97
2015
Obligation 750 500 400 350 280 800 0 20 210 13 7 23 9 7 8 6 5 1 40 1000 4429
Supply 128.35
436 0 101.93 0 450 0 28.58 172.5 0 0 0 81.49 0 0 0 0 0 0 0 1398.85
% Perf. 17.11 87.2 0 29.12 0 56.25 N/A 142.9 82.14 0 0 0 905.44 0 0 0 0 0 0 0 31.58
2016
Obligation 400
270 (+200 EGTL)
250 300 180 300 0 20 130 10 7 20 15 5 10 7 6 0.7 4 350 2567.7
Supply 73.856
197.856 0 149.373
0 280.065
0 5.128 203.398
0 0 0 70.63 0 0 0 0 0 0 0 980
% Perf. 18.464
98.928 0 49.791 0 93.355 0 25.64 156.46 0 0 470.867
0 0 0 0 0 0 0 38.18
* All values are in MMSCF/D
* DSO was allocated to the NNPC PSC in 2014

59 | P a g e
Table 45: Domestic Gas Supply Obligation From 2014-2017 for E&P Companies
GAS PRODUCERS
2014 DGSO, MMSCF/day
2015 DGSO, MMSCF/day
2016 DGSO, MMSCF/day
2017 DGSO, MMSCF/day
Chevron JV 500 500 470 440
SPDC JV 550 750 400 390
NAOC JV 300 350 300 280
Exxon Mobil JV 400 400 250 230
TEPNL JV 250 280 180 160
NPDC 700 800 300 300
Pan Ocean 20 20 20 8
SEPLAT 150 210 130 120
Monipulo 11 13 10 8
Niger Delta 5 7 7 6
Platform 20 23 20 18
Frontier 7.5 9 15 13
Universal 5 7 5 4
AMNI 8 8 10 8
Consolidated 5 6 7 2
Continental 5 5 0 3
Brittania-U 1 1 0.7 0.5
Dubri 3 4 4 3.5
NNPC PSC 1000 1000 350 450
AITEO 0 0 25 25
Eroton 0 0 34 32
Energia 0 0 20 18
Newcross 0 0 10 8
Atlas 0 0 0 5
Midwestern Allied \energy
0 0 0 5
Allied Energy 0 0 0 5
Pillar oil 0 0 0 5
Network E & P Prime Energy
0 0 0 5
Prime Energy
0 0 0 5
Waltersmith 0 0 0 5
Phillips/Oando 0 0 0 5
Gec Petroleum Dev Company
0 0 0 5
Statoil 0 0 0 5
WAEP/Dangote 0 0 0 5
Sunlink 0 0 0 5
Yinka Folawiyo 0 0 0 5
Millenium 0 0 0 5
Total 3940.5 4393 2567.7 2597

60 | P a g e
4.3.2 Gas Production And Utilization
Table 46: Summary of 2016 Gas Production and Utilization
YEARS
GAS PRODUCTION FUEL GAS
GAS LIFT
RE-INJECTION
(NGL/LPG)
SALES TOTAL GAS
UTILIZED
% UTILIZED
TOTAL GAS FLARED
% FLARED AG NAG TOTAL
Gas to NIPP
Local (Others)
NLNG (Export)
January 143,839,534 116,827,346 260,666,880 13,085,428 5,992,697 64,492,833 5,997,256 1,624,832 40,895,427 99,295,809 230,629,471 88% 26,844,654 10%
February 125,840,012 102,503,568 228,343,580 12,012,243 5,378,070 57,798,542 4,871,286 4,690,315 31,340,557 83,735,768 199,267,047 87% 24,970,588 11%
March 136,239,612 93,786,950 230,026,562 13,040,006 6,086,254 66,969,485 6,149,589 4,864,982 28,910,704 77,226,984 202,573,822 88% 24,986,027 11%
April 136,705,305 100,230,405 236,935,710 12,521,772 5,044,595 67,340,877 5,604,702 2,007,748 31,048,958 89,537,101 212,483,831 90% 21,566,759 9%
May 127,204,575 107,816,949 235,021,523 12,220,194 4,785,851 63,897,857 4,919,664 2,930,276 23,919,809 100,883,959 212,770,057 91% 18,986,538 8%
June 129,415,486 94,399,060 223,814,546 11,913,749 4,630,659 67,616,709 5,821,137 3,049,691 19,429,917 91,074,822 202,811,731 91% 18,364,776 8%
July 121,297,233 98,828,702 220,125,935 11,140,382 4,954,083 55,992,348 3,675,874 2,102,324 25,059,883 90,173,742 192,214,906 87% 25,761,644 12%
August 107,025,232 72,917,446 179,942,678 9,761,643 4,014,674 45,577,692 1,717,505 1,019,510 29,597,051 63,067,250 153,883,717 86% 24,973,495 12%
September 112,965,811 99,405,738 212,371,549 10,743,942 5,347,090 49,558,448 2,706,723 1,334,182 31,449,465 90,078,216 190,326,002 90% 24,763,021 12%
October 129,786,109 97,821,046 227,607,155 11,797,126 5,893,864 58,648,422 4,559,796 1,235,623 34,029,088 85,945,534 201,206,465 88% 26,510,982 12%
November 130,741,532 105,546,379 236,287,911 12,055,450 8,061,941 57,233,216 4,390,557 2,505,481 28,010,187 98,359,300 209,900,140 89% 27,504,448 12%
December 116,606,975 104,052,033 220,659,007 11,312,688 5,344,671 47,731,907 3,972,334 4,309,018 26,861,951 97,366,484 196,063,574 89% 23,649,362 11%
Total 1,517,667,415 1,194,135,621 2,711,803,036 141,604,622 65,534,450 702,858,337 54,386,423 31,673,983 350,552,997 1,066,744,968 2,404,130,764 89% 288,882,293 11%
# All volumes are in MMSCF
Table 47: Summary of Gas Production and Utilization
YEARS
GAS PRODUCTION
FUEL GAS GAS LIFT RE-
INJECTION (NGL/LPG)
SALES TOTAL GAS
UTILIZED % UTILIZED
TOTAL GAS FLARED
% FLARED AG NAG Total
Domestic Sales
NLNG (Export)
2001 1,551,912,250 391,683,723 1,943,595,973 80,269,287 26,142,438 336,523,011 52,033,317 141,067,615 306,812,223 942,847,891 48.51 1,000,748,082 51.49
2002 1,340,591,744 410,542,712 1,751,134,456 75,008,164 28,948,137 306,475,680 27,435,764 111,435,703 280,903,198 830,206,646 47.41 920,927,810 52.59
2003 1,387,104,460 516,223,961 1,903,328,421 71,590,002 28,973,434 272,481,721 36,648,692 214,182,219 477,983,042 1,101,859,110 57.89 801,469,311 42.11
2004 1,584,922,039 525,256,005 2,110,178,044 83,627,321 26,611,460 398,179,304 43,181,065 262,897,801 444,033,291 1,258,530,242 59.64 851,647,802 40.36
2005 1,626,444,779 508,893,962 2,135,338,741 88,786,060 43,781,302 402,390,225 57,345,709 234,780,140 502,737,873 1,329,821,309 62.28 805,517,432 37.72
2006 1,542,136,671 747,754,914 2,289,891,585 89,025,509 59,662,180 391,968,180 44,295,798 326,264,627 558,246,752 1,469,463,046 64.17 820,428,539 35.83
2007 1,599,190,078 1,007,675,245 2,606,865,323 99,705,731 49,204,125 485,642,132 31,751,276 279,970,609 843,948,502 1,790,222,375 68.67 816,642,948 31.33
2008 1,593,835,503 986,561,109 2,580,396,612 100,058,117 64,822,893 507,947,176 35,720,163 232,164,155 968,898,071 1,909,610,576 74.00 670,786,036 26.00
2009 1,582,137,295 645,978,947 2,228,116,241 108,676,564 58,655,769 599,618,597 46,874,213 237,287,426 640,635,350 1,691,747,917 75.93 536,368,324 24.07
2010 1,865,159,719 954,522,126 2,819,681,845 133,431,927 65,128,415 751,705,008 46,591,153 285,802,520 992,293,989 2,274,953,012 80.68 544,728,832 19.32
2011 1,839,230,068 1,127,423,119 2,966,653,187 139,425,042 91,970,753 703,579,860 68,391,658 344,481,029 1,114,860,569 2,462,708,911 83.01 503,944,277 16.99
2012 1,872,875,894 1,123,160,177 2,996,036,072 146,168,448 88,839,035 724,648,283 67,756,862 372,044,969 1,131,321,835 2,530,779,433 84.47 465,256,639 15.53
2013 1,786,603,702 1,025,377,681 2,811,981,383 152,134,470 54,264,412 758,079,412 63,286,195 391,435,743 964,809,782 2,384,010,015 84.78 427,971,368 15.22

61 | P a g e
YEARS GAS PRODUCTION
FUEL GAS GAS LIFT RE-
INJECTION (NGL/LPG)
SALES TOTAL GAS
UTILIZED % UTILIZED
TOTAL GAS FLARED
% FLARED AG NAG Total
Domestic Sales
NLNG (Export)
2014 1,880,374,658 1,168,171,828 3,048,546,486 154,037,918 87,130,036 808,503,665 56,785,229 424,738,371 1,123,511,431 2,654,706,650 87.08 393,839,836 12.92
2015 1,740,550,000 1,262,629,000 3,003,179,000 152,799,000 84,396,000 743,029,000 85,912,000 445,260,000 1,157,835,000 2,672,247,000 88.98 330,933,000 11.02
2016 1,517,667,415 1,194,135,621 2,711,803,036 141,604,622 65,499,545 702,858,337 54,386,423 382,226,980 1,066,744,968 2,404,095,859 88.65 288,917,198 10.65
# All volumes are in MSCF
Figure 18: Gas Utilized Versus Gas Flared
0
500,000,000
1,000,000,000
1,500,000,000
2,000,000,000
2,500,000,000
3,000,000,000
YEARS2001 2002 2003 2004 2005 2006 2007 2008 2009 2010 2011 2012 2013 2014 2015 2016
Gas
Vo
lum
e, M
SC
F
Year
Gas Utilized vs Gas Flared
TOTAL GAS UTILIZED TOTAL GAS FLARED

62 | P a g e
Figure 19: Domestic Gas Sales Versus Sales to NLNG (Export)
4.3.3 IN PURSUIT OF INCREASED DOMESTIC UTILIZATION OF LPG IN NIGERIA
No doubt, the last one decade had witnessed significant developments in the LPG Sector in
Nigeria. Annual consumption nationwide had grown to 400,000 Metric tonnes (MT) in 2016 from
around 70,000 MT in 2007, which represents almost 600% increase in consumption within the
period under review at an average of 20% annual growth.
For nearly 15 years since the early-90s, LPG supply and consumption had been stuck at around
70,000 MT or less due to supply constraints and infrastructural bottlenecks. The NNPC refineries,
which were hitherto planned as the main source of LPG in the country, became unable to supply
the market due to low capacity utilisation arising from turnaround maintenance constraints. The
NNPC Butanisation programme of the 80s that installed 8 LPG inland Depots (1000 MT capacity
each) and 2 Coastal Depots (1000 MT in Calabar and 4,000 MT in Apapa, Lagos) could not drive
distribution and consumption nationwide as envisaged due to paucity of supply from its refineries
and inadequate distribution infrastructure.
There was absence of bulk storage facilities at the port areas to receive LPG imports. Also, there
are inadequate/regional imbalance in LPG distribution infrastructure like bottling plants and
resellers’ outlets. In addition, there is insufficient LPG cylinders in circulation. There are only about
one million cylinders in circulation in-country and most of these cylinders are worn-out and
0
200,000,000
400,000,000
600,000,000
800,000,000
1,000,000,000
1,200,000,000
1,400,000,000
2001 2002 2003 2004 2005 2006 2007 2008 2009 2010 2011 2012 2013 2014 2015 2016
Gas
Vo
lum
e, M
SCF
Year
Domestic Gas Sales Versus Sales to NLNG
Domestic Sales NLNG (Export)

63 | P a g e
unsuitable for use. Cylinder manufacturing plants closed down due to unfriendly business
environment among other factors, and the cost of importation of LPG cylinders and other
equipment are prohibitive due to high duty tariffs of about 35%. Other factors that contributed to
low LPG consumption in Nigeria include the preference for biomass fuels (firewood- In 2015,
Nigeria burned 96 million tonnes of firewood) and the heavily subsidised kerosene for domestic
cooking (In 2016 about 1.5 billion litres of kerosene was used). Also, there is a negative sentiment
against LPG usage in Nigeria, where most people believe the use of LPG is dangerous.
As a result of the above scenario, Nigeria has one of the lowest per-capita LPG consumption in
Africa, despite producing over 2 million metric tonnes of LPG per annum today by the existing gas
processing facilities. Nigeria’s per capita consumption in 2016 is about 2 kg, while our next- door
neighbour Ghana has 9.5Kg. South Africa is at around 7.5kg, Egypt has 56.45 Kg and Morocco has
the highest per-capita consumption of 66.27. A further analysis show consumption in Ghana and
South Africa is about the same level with Nigeria, however our high population makes our per-
capita figures very low.
In 2008, the Federal Government and the Nigeria LNG Ltd (NLNG) intervened decisively on the
supply side in order to encourage and deepen the LPG Market amongst other measures. The
NLNG guaranteed a supply of 150, 000 MT, which was increased to 250,000 MT in 2012 and now
stands at 350,000 MT from January 2017. This supply therapy triggered a significant increase in
activities in the LPG sector. 2 Additional coastal storage depots with combined capacity of 12,500
MT were established in Apapa, Lagos, with an upgrade project of additional 8,000 MT for the two
depots ongoing. More LPG depots are at various stages of construction and completion in
Calabar, Port Harcourt and Lagos coastal areas. The NNPC/PPMC is also reactivating their inland
LPG depot network to key into the expanding LPG market.
Subsequently, importation of LPG both from the sea ports and land boarders (From the Refinery
in Zinder, Niger Republic) complimented the NLNG supply. As of 2016, LPG imports accounted for
over 40% of annual national consumption. Apart from the impressive growth in bulk storage
facilities, there is also a more than doubling of operational LPG refilling plants from about 300 in
2009 to more than 600 in 2016 and still growing. On the average, over 60 approvals to construct
new LPG filling plants are granted by DPR since 2012. This increase in the refilling plants will further
make it easier to distribute the LPG product across the country.

64 | P a g e
However, there is a noticeable regional imbalance in the distribution of LPG facilities. More than
65% of all LPG facilities and consumption are in the southern part of the country, and mostly
concentrated closer to the coastal areas. Ironically, the northern areas that have more challenges
of desertification; less biomass resources, are among the least LPG consuming parts of the
country, thereby accelerating the negative impact on the environment due to increasing firewood
consumption for cooking.
The advantages of LPG consumption are numerous and well known. LPG is a cleaner fuel
therefore environmentally friendly. It is an efficient fuel in comparison to other alternatives and
it can create and sustain many jobs across the value chain- a whole new industry can emerge from
an enhanced LPG consumption in Nigeria with a huge potential for growth. And the promotion of
the use of LPG on a wider scale can save government the billions spent on subsidising kerosene,
thereby making the funds available for other more critical sectors of the economy.
In recent years, the government has taken a number of measures in collaboration with various
stakeholder in order to address the perennial challenges in deepening the LPG market. These
steps taken include:
1. Local LPG Cylinder Manufacturing Initiative - led by The Nigerian Content
Development & Monitoring Board (NCDMB)
2. Kerosene/ Firewood to LPG Switch in Nigeria Initiative – led by NNPC (PPMC)
3. Inter-Ministerial Committee on Kerosene to LPG Initiative – led by The National
Planning Commission (NPC)
4. Deforestation initiative – led by The Ministry of Environment, and
5. LPG Market Development Initiative – led by The Ministry of Petroleum
Resources (MPR)
6. Inter-ministerial committee on the Expansion of Domestic LPG in Nigeria
(Chaired by the Vice President of Nigeria and supported by a Programme
Management Office)
The Expansion of Domestic LPG in Nigeria Initiative was flagged off in November 2016 with a
growth aspiration mandate to convert an initial 4million households to use LPG as cooking fuel
within 2 years, 10 million households in over 5 Years and setting up the framework for conversion

65 | P a g e
of additional 21 million household & facilitation of other commercial & industrial uses of LPG by
addressing the 4 As of market penetration- Affordability, Availability, Accessibility and
Acceptability. This aggressive plan will see demand grow to 1.6 million MT in 5 years and 2.9 MT in
10 years, which will translate to a growth of 700% from the current consumption level. This
initiative is the most high-level intervention in LPG sector. The initiative is poised to provide a level
playing field for all market participants across the value chain, leverage on private sector drive to
grow the sector and create an enabling environment through adequate policies, regulation and
strategic intervention to guarantee supply and encourage demand.
The LPG landscape in Nigeria is changing for the better both as result of sustained government
interest and private sector participation. And the future prospects appear promising. However,
there are still very serious bottlenecks that need to be cleared to maintain the momentum of
growth in the sector. The current economic recession and scarcity of forex is already hampering
importation of LPG. The declining purchasing power of Nigerians as a result of the recession is
impacting negatively on LPG demand as more people switch back to dirtier fuels like firewood
and kerosene for cooking. The infrastructural bottlenecks at the ports where LPG-laden vessels
spend between two weeks to one month waiting for berthing space at the only two port Jetties
that can receive LPG is contributing to supply disruptions and spike in prices of the product (Only
one LPG Depot at Apapa has a dedicated Jetty, the other 4 LPG Depots share one loading Jetty
with other petroleum products like PMS, DPK, Diesel and aviation fuel).
There is a real possibility that LPG consumption growth may remain flat or increase marginally in
the near to medium term, unless all the identified bottlenecks are addressed by keeping a clear
and unwavering focus on the goals and aspirations of deepening and widening LPG consumption
in Nigeria. However, there is an increasing optimism within LPG industry stakeholders that the
renewed and reinvigorated government interest in promoting the use of LPG will provide the
much impetus for realising the growth aspirations in the sector.

66 | P a g e
4.3.4 Gas Infrastructures
Table 48: Major Gas Facilities
S/N FACILITY FACILITY TYPE LOCATION DESIGN
CAPACITY (MMSCF/D)
OPERATING CAPACITY
(MMSCF/D)
FACILITY DESIGN
LIFE
DATE OF COMMISSIONING
STATUS LICENCE / PERMIT STATUS
1 SPDC Afiesere 8 0 25yrs 1977 Non Operational
2 Afiesere Gas Lift Compressor Station
Compressor Station Afiesere 21 8 25yrs NGC On Standby
3 Agbada AGG Plant AGG Plant Agbada 58 58 25yrs 2002 Operational
4 Agbada 1 FS Booster Compressor Station
Compressor Station Agbada 12 12 25yrs 2002 Operational NO
5 Alakiri NAG Plant NAG Plant Alakiri 120 120 25yrs 1987 Operational NO
6 Awoba AGG Plant AGG Plant Awoba 50 0 25yrs 2004 Down
7 Batan FS Booster Compressor Station
Compressor Station Batan 10 0 25yrs 2002 Down
8 Belema FS Booster Compressor Station
Compressor Station Belema 12 12 25yrs 2002 On Standby
9 Belema AGG Plant AGG Plant Belema 55 55 25yrs 2002 On Standby
10 Bonny NAG Plant NAG Plant Bonny 450 450 25yrs 2002 Operational NO
11 Cawthorne Channel AGG Plant
AGG Plant Cawthorne Channel
150 150 25yrs 2005 Operational NO
12 EGWA 1 FS Booster Compressor Station
Compressor Station EGWA 10 0 25yrs 2002 Down
13 EGWA 2 FS Booster Compressor Station
Compressor Station EGWA 10 0 25yrs 2002 Down
14 Ekulama 1 FS Booster Compressor Station
Compressor Station Ekulama 12 12 25yrs 2002 On Standby
15 Ekulama 2 FS Booster Compressor Station
Compressor Station Ekulama 12 12 25yrs 2002 On Standby
16 Eriemu NGC Compressor Station
Compressor Station Eriemu 10 0 25yrs 2002 Down
17 Escravos Beach FS NGC Compressor Station
NGC Compressor Station
Escravos Beach 18 0 25yrs NGC Down
18 Imo River 2 FS Booster Compressor Station
Compressor Station Imo River 12 12 25yrs 2002 Operational NO
19 Imo River 3 FS Booster Compressor Station
Compressor Station Imo River 12 12 25yrs 2002 Operational NO
20 Imo River AGG Plant AGG Plant Imo River 1 65 65 25yrs 2002 Operational NO

67 | P a g e
S/N FACILITY FACILITY TYPE LOCATION DESIGN
CAPACITY (MMSCF/D)
OPERATING CAPACITY
(MMSCF/D)
FACILITY DESIGN
LIFE
DATE OF COMMISSIONING
STATUS LICENCE / PERMIT STATUS
21 Jones Creek NGC Compression Station
Compressor Station Jones Creek 18 0 25yrs NGC Down
22 Kokori NGC Compressor Station
Compressor Station Kokori 8 0 25yrs NGC Down
23 Krakama FS Booster Compressor Station
AGG Plant Krakama 5 0 25yrs Not Commissoned
On Standby
24 Nembe Creek 1 FS Booster Compressor Station
Compressor Station Nembe Creek 10 4 25yrs 2001 On Standby
25 Nembe Creek 2 FS Booster Compressor Station
Compressor Station Nembe Creek 10 4 25yrs 2001 On Standby
26 Nembe Creek 3 FS Booster Compressor Station
Compressor Station Nembe Creek 5 4 25yrs 2001 On Standby
27 Nembe Creek 4 FS Booster Compressor Station
Compressor Station Nembe Creek 5 4 25yrs 2001 On Standby
28 Nkali FS Booster Compressor Station
Compressor Station Nkali 12 12 25yrs 2003 Operational NO
29 Oben NAG Plant NAG Plant Oben 240 240 25yrs 1982/Expanded 2015
Operational SEPLAT
31 Oben NGC Compressor Station
Compressor Station Oben 16 16 25yrs NGC On Standby
32 Oben AG Compressor Station
Compressor Station Oben 30 30 25yrs 2015 Operational NO
33 Obigbo North AGG Plant AGG Plant Obigbo North 54 54 25yrs 1989 Operational NO
34 Obigbo North NAG Plant NAG Plant Obigbo North 90 45 25yrs 1984 On Standby
35 Odeama Creek FS Booster Compressor Station
Compressor Station Odeama Creek 5 0 25yrs Not Commissioned
Not Commissioned
36 Odidi AGG Plant AGG Plant Odidi 80 0 25yrs 2001 Down NPDC
37 Odidi NGC Compressor Station
Compressor Station Odidi 18 0 25yrs NGC Down
38 Oguta Gas Injection Plant Gas Injection Plant Oguta 40 13 25yrs 2004*¹ Operational
39 Okoloma NAG Plant NAG Plant Okoloma 240 240 25yrs 2008 Operational NO
40 Olomoro-Oleh NGC Compressor Station
Compressor Station Olomoro-Oleh 3.3 0 25yrs NGC Down
41 Oweh NGC Compressor Station
Compressor Station Oweh 5.5 0 25yrs NGC Down
42 Santa Barbara FS Booster Compressor Station
Compressor Station Santa Barbara 8 8 25yrs 2001 On Standby
43 Sapele NAG Plant NAG Plant Sapele 120 120 25yrs 1978 Operational SEPLAT

68 | P a g e
S/N FACILITY FACILITY TYPE LOCATION DESIGN
CAPACITY (MMSCF/D)
OPERATING CAPACITY
(MMSCF/D)
FACILITY DESIGN
LIFE
DATE OF COMMISSIONING
STATUS LICENCE / PERMIT STATUS
44 Sapele NGC Compressor Station
Compressor Station Sapele 24 24 25yrs 2003 Standby
45 Soku FS Booster Compressor Station
Compressor Station Soku 5 5 25yrs 2002 On Standby
46 Soku LNG Gas Supply Plant AG/NAG Plant Soku 1100 1100 25yrs 1999 Operational NO
47 Ughelli East NAG Plant NAG Plant Ughelli East 150 90 25yrs 1966 Operational NPDC
48 Utorogu NAG Plant NAG Plant Utorogu 270*² 300*² 25yrs 1988 Operational NPDC
49 Utorogu NGC Compressor Station
Compressor Station Utorogu 7 7 25yrs 2004 Operational
50 Uzere West NGC Compressor Station
Compressor Station Uzere West 10 0 25yrs NGC Down
51 CNL Agbami FPSO FPSO Agbami – Deep Offshore
415
Operational NO
52 Escravos Gas Plant Gas Plant Escravos Island 680
Operational YES
53 Meren Gas Gathering Compression Station
Compressor Station Meren-Offshore
24
Not Operational NO
54 Okan Gas Gathering Compression Station
Compressor Station Okan-Offshore 140
Operational YES
55 Meji Gas Gathering Compressor Station
Compressor Station Meji-Offshore 70
Operational YES
56 Abiteye Gas Compression Plant
Gas Compression Plant Abiteye 29
Operational YES
57 Olero Creek Compression Station
Compressor Station Olero 52
Operational YES
58 Dibi Compression Station Compressor Station Dibi 52
Operational YES
59 Escravos Gas To Liquid Plant GTL Plant Escravos Island 328/340
25 Operational YES
60 MPNU Erha FPSO FPSO Erha-Deep Offshore
340 360 March – 2006 Operational NO
61 OSO -RX (Offshore) Offshore 600
Operational NO
62 BRT LPG Fractionating Plant Fractionation Plant Bonny Island 85MBPD
Operational NO
63 BRT LPG Fractionating Plant Fractionation Plant Bonny Island
Operational NO
64 EAP - GX (Offshore) Fractio-nation Plant Offshore 950
Operational NO
65 TEPNG & TUPNI Obite AG Plant AG Plant Obite-Obaagi 334.1
Operational NO
66 Amenam Kpono AG Plant – Offshore
AG Plant Amenam/ Kpono
441.5
Operational NO
67 Akpo FPSO Gas Export/Injection Akpo Offshore 215
Operational
68 NAOC & NAE Okpai Gas Plant Kwale
Operational NO

69 | P a g e
S/N FACILITY FACILITY TYPE LOCATION DESIGN
CAPACITY (MMSCF/D)
OPERATING CAPACITY
(MMSCF/D)
FACILITY DESIGN
LIFE
DATE OF COMMISSIONING
STATUS LICENCE / PERMIT STATUS
69 Irri Isoko Condensate Flow Station
Flow Station Isoko
Operational NO
70 ABO FPSO FPSO Offshore
Operational NO
71 OB/OB AG Plant AG Plant Obaifo/ Obrikom
654 654 Operational NO
72 Kwale Gas Compression Station
Compressor Station 375 252 On Standby
73 ADDAX Izombe Gas Injection Plant Injection Plant Imo/Izombe 48 @ 3500 PSI
32 @ 3500 PSI
Operational NO
74 Izombe Flare Down Gas Compression Plant
Compression Plant Imo/Izombe 16.78 @ 3500 PSI
13.52 @ 3500 PSI
Operational NO
75 NLNG LNG Plant NAG Plant Bonny 680 596.12 20 EGP1/2 (1997) EGP3 (2010)
Operational YES
76 POOCN Ogharefe Gas Plant Ogharefe
under Construction
77 NPDC Early Production Facility Ogharefe
Under Construction
78 Gas Handling Facility AG Plant Ogharefe
Under Construction
79 Global Gas & Refining Limited
BOT FPSO Gas Processing Plant Bonny River
Down
80 SEPLAT Oben Gas Plant NAG Plant Oben 240 240 25yrs 1982 Operational YES
81 Sapele Gas plant NAG Plant Sapele 120 120 25yrs 1978 Operational YES
82 Jisike AG Plant Compressor Station Jisike-Offshore
Operational -
83 ENERGIA/XENERGI Nedo Gas Plant AG Plant Ebendo 25
2011 Operational YES
84 NPDC Odidi
NO
85 Ughelli East 2836.5
NO
86 Utorogu 6807.6
NO
87 PAN OCEAN Ovade-Ogharefe GPP 130
NO
88 NAOC Obiafu/Obrikom 654
NO
89 Kwale Gas Compression Station
Compression Station 375
On Standby
90 PLATFORM Egbaoma Gas Processing Plant
Gas Processing Plant Egbaoma 30
25 Commissioned NO
91 Egbaoma Wet Gas Met Syst Metering System Egbaoma 40
92 FRONTIER Uquo Gas Processing Facility Gas Processing Facility 200 200 NO

70 | P a g e
4.3.5 Major Gas Projects
Table 49: Gas Processing Plant Projects
S/N PROJECT TITLE COMPANY NAME PROJECT OBJECTIVE(S) INSTALLED CAPACITY LOCATION
1 Egbgema West NAG Project NDPC Construction of NAG processing facility to deliver NAG to Niger Delta Holding Company
50mmscfd Egbema field, Rivers State
2 Egbgema West AG Solutions Project
Gather and compress 8mmscfd LP & HP gas from existing flow station, treat to sales gas spec and deliver to EIPP pipeline
8mmscfd Egbema field, Rivers State
3 Gas Processing Plant Project PNG Gas Process associated gas from Asuokpo/Umutu/Egaboma flow station 30mmscfd Umutu, Egbaoma Rivers State
4 Gas Processing & Gathering Plant Project
Giga Gas Process and transport produced gas from the SPDC offshore gas gathering to the ELPS
140mmscfd Forcados, Delta State
5 Liquefied Natural Gas Plant Greenville Two trains of liquefaction units, storage and distribution terminal 80mmscfd Rivers State
6 Urea Fertilizer Plant Dangote Process 210mmscfd of natural gas to Urea fertilizer 2.5 MTPA Urea Lekki Free Trade zone
7 Oben AG Compressor Project SEPLAT Gather and compress 30 MMSCFD gas from existing flow station, treat and deliver to the Oben Gas Plant for further processing
30mmscfd Oben
8 Oben AG Compressor Expansion Gather and compress additional 20 MMSCFD gas from existing flow station, treat and deliver to the Oben Gas Plant for further processing
20mmscfd Oben
9 Oben Export Sale Gas Pipeline and Metering Sysytem Project
Proceurement and Installation of 20" Export Sale Gas Pipeline and its Metering Assembly from Oben Gas Plant to NGC Pipeline
Additional Evacuation Capacity from Oben to
ELPS
Oben
10 Urea Fertilizer Plant Indorama 2300mtpd Ammonia plant; 4000 mtpd urea and granulation plant 1.4m mtpa Urea fertilizer
Eleme, PHC
11 Methanol Plant Quantum Methanol plant 3000 mtpd methanol Ibeno, AKS
12 Kwale Flare Down Project NAOC Flares-out initiative in Kwale Field 10 mmscfd Kwale
13 Oshi Flare Down Project Flares-out initiative in Oshi Field 10-15 mmscfd Oshi
14 Northern Option Pipeline Project
TOTAL 24"X52Km pipeline takes gas from OUR pipeline tie-in at Rumuji to Imo River and then tie in to NGCnode for onward transmission to Alaoji Power Plant
Owaza & Rumuji
15 OML 58 Upgrade Project Increase the capacity of Obite Gas Plant from 350 to 530mmscfd to supply the eastern gas market
180mmscfd (Additional capacity)
16 Obite-Ubeta-Rumuji (OUR) Pipeline Project
Obite-Ubeta-Rumuji pipeline- 42"X45Km pipeline takes gas from Obite gas plant to Rumuji tie-in to the Northern Option Pipeline (NOPL)
17 Forcados Yokri Integrated Project
SPDC Complete 2006 abandoned works: AGG; CPF and hook up of 12 wells already drilled
45mmscfd + 30mmscfd, 80 -
95mbpd, 233mmboe
Forkados Yokri
Complete New Scope: NAG well of 45 mmscfd and export (45mmscfd+30mmscfd AG) to DOMGAS; Replace Estuary Clusters/Bulklines
Enable further development of 233MMboe viz Forcados West, Forcados Water Injection and Further Oil Dev.
FYIP + FD projects to infill production 80 - 95 Mboe for the next 10 yrs
18 Adibawa AGS project SPDC Gas Flare Out Adibawa

71 | P a g e
S/N PROJECT TITLE COMPANY NAME PROJECT OBJECTIVE(S) INSTALLED CAPACITY LOCATION
19 Afam F5Project SPDC Additional gas supply to Afam Power Plant 40mmscfd / 4mbod Afam
20 Agbada NAG Project SPDC Additional gas supply to the Eastern DOMGAS network 80mmscfd Agbada
21 Alakiri NAG Project SPDC / EROTON Drill 2 new wells, hookup and increase compression capacity for additional gas supply for export
120mmscfd Alakiri
22 Southern Swamp Associated Gas Gathering Project
SPDC Provide ca. 100MMscfd to DOMGAS market 100mmscfd Tunu
Eliminate routine flaring of AG thus protecting Oil Production
Enable growth/Additional reserves
23 Gbaran Infill Project SPDC Develop 1.3Tscf of NAG and 13MMbbls of condensate from the Gbaran, Koroama and Epu fields to susteain production to the Gbaran CPF for sales to NLNG T1-6
Ullage filler for Gbaran CPF
Gbaran, Koroama, Epu
24 Kolo Creek to Soku (2B) SPDC Develop 1.5Tscf of NAG and 52mmstb of condensate from the Kolo Creek F1 and the F2 reservoir to sustain gas supplies to the Soku gas plant and meet SPDC JV gas supply commitments to NLNG Trains 1 to 6.
Ullage filler for Soku Gas Plant
Soku
25 Soku NAG Compression Project SPDC Produce 1Tscf of Gas and 13mmstb of condensate at the rate of 200mmscf/d, locked in Soku due to declining reser voir pressure.
200mmscfd (Compression
capacity)
Soku
26 Asa North - Ohaji South (ANOS) Project
SPDC SPDC is the operator of the unitized asset and the project relies on the completion of the OB3 pipeline.
250mmscfd Ohaji
27 Gbaran 3A Enwhe SPDC Support SPDC's gas supply obligation of 2Bscfd to NLNG; and also grow oil production
Ullage filler for Gbaran CPF
Gbaran area
28 Gbaraan 3A Abasere SPDC Support SPDC's gas supply obligation of 2bscfd to NLNG; and also grow oil production.
Ullage filler for Gbaran CPF
Gbaran area
29 Otumara AGS Project SPDC Gather flared AG in Otumara & Saghara fields for supply into the DOMGAS system; eliminate flares & protect NFA oil production.
30mmscfd Otumara
30 Escravos Gas Project Phase 3B Stage 2 - Meren GGCP, Pipelines & PPMods
Chevron Nig. Ltd Support Chevron's gas supply obligation to the DomGas, WAGP and EGTLof NLNG; and also grow oil production.
120mmscfd Meren (Offshore)
31 Sonam Field Development Sonam NWP / Sonam Field Development Pipelines
Chevron Nig. Ltd Support Chevron's gas supply obligation to the DomGas, WAGP and EGTLof NLNG; and also grow oil production.
300mmscfd Sonam (Offshore)
32 Makaraba Gas Project Chevron Nig. Ltd Support Chevron's gas supply obligation to the DomGas, WAGP and EGTLof NLNG; and also grow oil production.
100mmscfd Makaraba
33 Abiteye NAG Development Project
Chevron Nig. Ltd Modifications to Abiteye flow station (Ugrdrade & debottlenecking of the gas conditioning systems).
Abiteye
34 Okan NAG Development Project - Stage 2
Chevron Nig. Ltd Exploit identified NAG reserves in the Okan area and deliver the reservoir's well fluids (natural gas & condensate) to the existing Escravos Gas Plant
300mmscfd (Ullage filler for EGP)
EGP
Greenville LNG Liquefied Natural Gas - 2 trains of 0.25 MTPA LGN liquefaction units, storage and distribution terminal
80 (2 x 40) mmscfd Rumuji, Emuoha, Rivers state

72 | P a g e
4.3.6 Gas Pipelines
Figure 20: Gas Pipeline Map

73 | P a g e
4.3.6.1 The Nigerian Gas Transportation Network Code (NGTNC)
The Network Code is a set of rules and protocol for the transportation and transmission of natural
gas within the pipeline distribution network. The code essentially governs the operations of the
network players who are Suppliers, Operator(s), Transporter(s), Shippers and Agents. The network
is a collection of pipeline systems. The operations here are in the instance of gas transportation &
transmission.
The Nigerian Gas Transportation Network Code (NGTNC) is conceived as an intervention tool to
specifically govern the Escravos-Lagos Pipeline System (ELPS) and other major trunk lines that may
come on-stream. This is patterned after the United Kingdom’s Uniform Code (UNC).
Figure 21: NGTNC Schematic
There are three tranches of rules and protocols as follows:
• Statutory Licences
• Ancillary Agreements
• Business Process Documents
Regulatory Framework
It is particularly important that the Network Code should also be complemented by progress with
the broader regulatory framework, adopting the general requirements of transparency, consistency
and predictability. In particular, the key principles for pipeline revenue and tariff determination are
required, in order to underpin the continuous and sustainable investment in gas transportation
infrastructure needed to support the gas supply and demand threshold envisaged in the Nigerian
Gas Master Plan (NGMP), and to promote further expansion of the Nigerian gas industry.

74 | P a g e
Figure 22: Regulatory Framework
The broad model anticipated for Nigeria is that gas transmission should be unbundled from gas
supply, and offer non-discriminatory open access in order to allow competition for wholesale
supplies. Meanwhile it is expected that gas distribution will remain an integrated activity operating
under monopoly franchises of sufficient duration to encourage investment, subject to appropriate
regulatory oversight.
Contractual framework
The Network Code is intended to provide a common “level playing field” for all users of the
transportation system, whereby new shippers sign an accession agreement which commits them to
the terms of the Network Code as may be amended from time to time.
Figure 23: Contractural Framework

75 | P a g e
However, it is anticipated that there may be some pre-existing “legacy” transportation contracts
that will be operated alongside the Network Code, and will need to be accommodated by
appropriate Code provisions.
It is anticipated that there will be a transparent and efficient process for developing the Network
Code via a set of Modification Rules – this would avoid the need for all parties to agree to
amendments, but should be subject to due process including adequate industry consultation,
equitable governance and regulatory oversight.
The Code would also be complemented by various ancillary agreements generally made between
the network operator and the operators of other connected facilities at entry and exit points to the
transmission network. These will address issues such as measurement, gas quality and pressure, and
other interface requirements at the boundary points.
Main features of the Code
The Network Code establishes the rules by which the shipper may introduce gas to, and offtake gas
from, the transportation system, and the manner in which the network operator will manage the
system, including how:
Figure 24: Commerical Operations
• shippers book capacity for the right to access the system;

76 | P a g e
• information is exchanged between shippers and network operator as regards intended
flows of gas;
• the operator monitors and manages the aggregate balance of shipper supplies and
demands;
• shippers are individually incentivised to maintain their own balance of gas inputs and
offtakes;
• shipper “ownership” of customer supply points is kept up to date;
• gas flows in and out of the system are measured and allocated between shippers;
• invoices are prepared requiring shippers to pay for capacity, gas throughput and any
balancing charges; and
• liabilities are established in the event of performance failure by the operator or shippers
One of the key features of the proposed Network Code is the adoption of an entry/exit capacity
structure, by which shippers may book separately their requirement to introduce gas into (entry) or
offtake gas from (exit) the system.
Users of The Code:
• Network Regulator (DPR) – Licences and regulates the NGTNC
• Suppliers (Gas Producers) – Enter into gas supply contracts with shippers
• Transporter/Operator (NGPTC) – Owns and maintains the trunk line and transports gas for a
fee
• Shippers (Customer/End-User) – Buys gas from Suppliers and engages the Transporter to
deliver the purchased gas to its destination
• Agents – carries out or ring-fences process and operational activities along the value chain
for the Suppliers, Transporter, and Shipper
Where We Were:
• Alleged Non-Transparency
• Monopolistic Supply (Commodity & Capacity)
• Selective Target Market
• Pipeline Infrastructure Inadequacy

77 | P a g e
• Limited Access
At The Moment:
Figure 25: Where We Are
Where We Aspire To Be
• Virtual Hub (Spot Market)
• Open Access
• Unbundled System
• Free Market (Matured Market, WBWS)
• Professionalism in Gas Trading
Conclusion
NGTNC as a big impact player;
• Would ensure transparency in the gas industry
• Would guarantee fair and non-discriminatory access to the gas transportation network
• Would attract foreign investors
• Is key to the growth and development of the Nigerian gas industry
• Is A Gas Market Liberalization Enabler
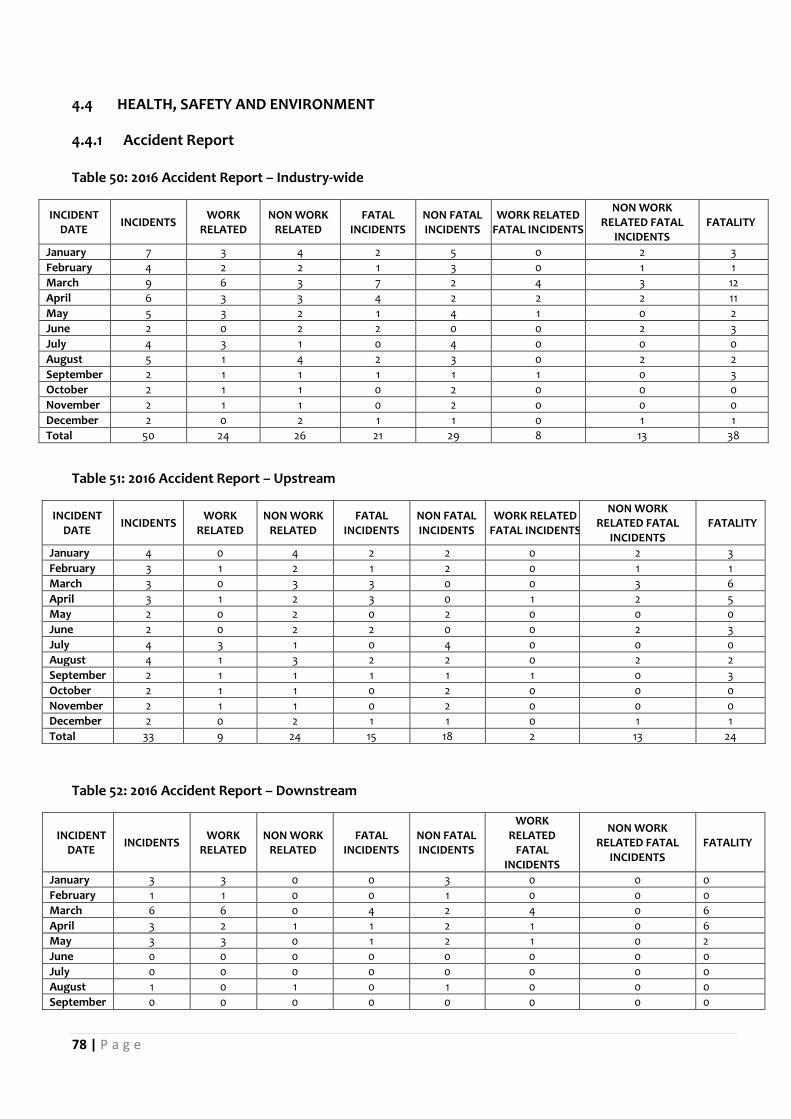
78 | P a g e
4.4 HEALTH, SAFETY AND ENVIRONMENT
4.4.1 Accident Report
Table 50: 2016 Accident Report – Industry-wide
INCIDENT DATE
INCIDENTS WORK
RELATED NON WORK
RELATED FATAL
INCIDENTS NON FATAL INCIDENTS
WORK RELATED FATAL INCIDENTS
NON WORK RELATED FATAL
INCIDENTS FATALITY
January 7 3 4 2 5 0 2 3
February 4 2 2 1 3 0 1 1
March 9 6 3 7 2 4 3 12
April 6 3 3 4 2 2 2 11
May 5 3 2 1 4 1 0 2
June 2 0 2 2 0 0 2 3
July 4 3 1 0 4 0 0 0
August 5 1 4 2 3 0 2 2
September 2 1 1 1 1 1 0 3
October 2 1 1 0 2 0 0 0
November 2 1 1 0 2 0 0 0
December 2 0 2 1 1 0 1 1
Total 50 24 26 21 29 8 13 38
Table 51: 2016 Accident Report – Upstream
INCIDENT DATE
INCIDENTS WORK
RELATED NON WORK
RELATED FATAL
INCIDENTS NON FATAL INCIDENTS
WORK RELATED FATAL INCIDENTS
NON WORK RELATED FATAL
INCIDENTS FATALITY
January 4 0 4 2 2 0 2 3
February 3 1 2 1 2 0 1 1
March 3 0 3 3 0 0 3 6
April 3 1 2 3 0 1 2 5
May 2 0 2 0 2 0 0 0
June 2 0 2 2 0 0 2 3
July 4 3 1 0 4 0 0 0
August 4 1 3 2 2 0 2 2
September 2 1 1 1 1 1 0 3
October 2 1 1 0 2 0 0 0
November 2 1 1 0 2 0 0 0
December 2 0 2 1 1 0 1 1
Total 33 9 24 15 18 2 13 24
Table 52: 2016 Accident Report – Downstream
INCIDENT DATE
INCIDENTS WORK
RELATED NON WORK
RELATED FATAL
INCIDENTS NON FATAL INCIDENTS
WORK RELATED
FATAL INCIDENTS
NON WORK RELATED FATAL
INCIDENTS FATALITY
January 3 3 0 0 3 0 0 0
February 1 1 0 0 1 0 0 0
March 6 6 0 4 2 4 0 6
April 3 2 1 1 2 1 0 6
May 3 3 0 1 2 1 0 2
June 0 0 0 0 0 0 0 0
July 0 0 0 0 0 0 0 0
August 1 0 1 0 1 0 0 0
September 0 0 0 0 0 0 0 0

79 | P a g e
INCIDENT DATE
INCIDENTS WORK
RELATED NON WORK
RELATED FATAL
INCIDENTS NON FATAL INCIDENTS
WORK RELATED
FATAL INCIDENTS
NON WORK RELATED FATAL
INCIDENTS FATALITY
October 0 0 0 0 0 0 0 0
November 0 0 0 0 0 0 0 0
December 0 0 0 0 0 0 0 0
Total 17 15 2 6 11 6 0 14
**Work related incidents in this context, refer to incidents that occur in the course of direct work; slips, trips and falls that occur whilst working are common examples. **Non work related incidents include road traffic accidents (conveying workers) and natural causes. 1 Petroleum tanker road accidents are not included in the reports.
Table 53: Accident Report – Industry-wide
INCIDENT DATE
INCIDENTS WORK RELATED
NON WORK
RELATED
FATAL INCIDENTS
NON FATAL INCIDENTS
WORK RELATED FATAL INCIDENTS
NON WORK RELATED FATAL
INCIDENTS
FATALITY
2010 50 24 26 21 29 6 15 25
2011 53 29 24 19 34 6 13 19
2012 49 27 22 27 22 12 15 35
2013 57 29 28 18 39 7 11 30
2014 40 15 25 15 25 1 14 22
2015 49 24 25 32 17 14 18 86
2016 50 24 26 21 29 8 13 38
0
5
10
15
20
25
30
35
40
45
2010 2011 2012 2013 2014 2015 2016
Nu
mb
er o
f In
cid
ents
Year
Fatal Versus Non Fatal Incidents
Fatal Incidents Non Fatal Incidents
Figure 26: Fatal Versus Non Fatal Incidents

80 | P a g e
Table 54: Accident Report – Upstream
INCIDENT DATE
INCIDENTS WORK RELATED
NON-WORK RELATED
FATAL INCIDENTS
NON-FATAL INCIDENTS
WORK RELATED FATAL INCIDENTS
NON-WORK RELATED FATAL INCIDENTS
FATALITY
2010 41 18 23 17 24 3 14 18
2011 44 21 23 17 27 5 12 17
2012 48 26 22 26 22 11 15 34
2013 45 17 28 16 29 5 11 28
2014 32 8 24 13 19 0 13 14
2015 35 11 24 23 12 6 17 50
2016 33 9 24 15 18 2 13 24
Table 55:Accident Report – Downstream
INCIDENT DATE
INCIDENTS WORK RELATED
NON WORK RELATED
FATAL INCIDENTS
NON-FATAL INCIDENTS
WORK RELATED FATAL INCIDENTS
NON-WORK RELATED FATAL INCIDENTS
FATALITY
2010 9 6 3 4 5 3 1 7
2011 9 8 1 2 7 1 1 2
2012 1 1 0 1 0 1 0 1
2013 12 12 0 2 10 2 0 2
2014 8 7 1 2 6 1 1 8
2015 14 13 1 9 5 8 1 36
2016 17 15 2 6 11 6 0 14
9 9
1
128
1417
4144
4845
3235 33
0
10
20
30
40
50
60
2010 2011 2012 2013 2014 2015 2016
nu
mb
er o
f in
cid
ents
Year
Downstream versus Upstream Incidents
Downstream Incidents Upstream Incidents
Figure 27: Downstream Versus Upstream Incidents

81 | P a g e
4.4.2 Spill Incidence Report
Table 56: 2016 Spill Incidence Report
Spill Incidents Total number of
Spills Volume
spilled(BBLs) Month Natural
Accident1 Corrosion2
Equipment Failure3
Sabotage4 Human Error5
YTBD6 Mystery6 Erosion /
Wave / Sand Operational / Maintenance
Sunken Barge
January
1 2 15 1 16 2 1 1 1 40 25.60937
February
2 4 5
6 1 2 0
20 0.15252
March
1 3 11
5 4 4 4
26 5.31251
April
2 7 7
0 1
31 27.58
May
1 5 13
10 3 0 1
33 674.2961
June
0 2 16
6 2 0 0
26 61.73231
July 2 2 4 19
10
0 4
41 46.947
August
1 5 24
14 4 0 0
48 106.4848
September
1 3 23
16 5 1 0
50 53.03967
October
3 19
8 11
4
45 87.5607
November
5 5 31 1 5 2 0 0
49 271.4222
December
2 3 11
4 5 0 0
25 258.8453
Total 2 18 46 194 1 100 39 8 15 1 434 1618.9825
1 Spills caused by natural disasters/events such as flooding, extreme weather conditions etc.
2 Spills caused by corrosion of pipelines, vessels, tanks and other crude oil handling installations.
3 Spills caused by preventable failure of oil and gas installations/equipment
4 Spills caused by third party intervention. This also includes cases of vandalism and crude oil theft that may not have resulted to hydrocarbon release to the environment.
5 Spills caused by operational errors involving a human interface.
6 This means “Yet-to-be-determined”. The cause(s) of the spill(s) were not reported in the submitted oil spill reporting forms. Usually indicative that the Form B was not submitted, or the Joint Investigation Visit (JIV) was either not carried out or was inconclusive. Often, the quantity spilled for this category of spills may also not have been reported.
7 Spills identified or reported by operators who assert that the spill did not originate from their facilities. The origin of the spill is thus said to be inconclusive. Usually the operator is expected to take reasonable steps to respond to the spill in addition to the reporting of same.

82 | P a g e
Table 57: Spill Incidence Summary
Table 58: Produced Water Volumes Generated
COMPANY FACILITY WATER DEPTH DISTANCE FROM SHORE VOLUME/day (bbl)
ADDAX Knock Adoon 140ft 37.04 km 35000
ORIENTAL FSO Virini 140ft 40km 30000
CHEVRON Funiwa PP 35.1ft 8.54km 14535
CHEVRON Delta PP 15ft 4.6km 10000
CHEVRON Parabe PP 48.2ft 12.75km 20600
CHEVRON Okan PP 30ft 10km 58000
CHEVRON Meren1 42.65ft 15km 26000
TEPNG Amenam/Kpono 134.5ft 34km 19869
POOC 98 & 275 Land Land 8500
MONI PULO Agbani Barge 6ft 4.4km 10000
SPDC Sea Eagle FPSO 87ft 15km 70000
SPDC SPDC 12.5ft 5km 110517
SPDC 3rd Party 12.5ft 5km 87320
SPDC SPDC 11.5ft 7.5km 70686
SPDC 3rd Party 11.5ft 7.5km 14966
NAOC Brass O.T Swamp Swamp 110000
MOBIL QIT 40ft 8.5km 150410
CON OIL Antie Julie 75ft 4.3km 22000
MOBIL PROD. OSO 51ft 15.5km 3292
AMNI INT. Armada Perkasa FPSO 131ft 15km 15000
MIDWESTERN UMUSADEGE Land Land 4399
NETWORK Qua Iboe Land Land 58.66
FRONTIER UQOU Land Land 0
ATLAS EJULEBE Land Land 18500
ENERGIA EBENDO Land Land 65
Table 59: 2016 Drilling Waste Volumes
Months Sum of WBMC (MT) Sum of OBMC (MT) Sum of SPENT WBM (MT) Sum of Spent OBM (MT)
Jan 7,087.69 7,035 27,542 7,945
Feb 1,818 3,134 50,300 30,800
Mar 603.8 1,029 826.4 1,624
Apr 2,450 - 3,636 -
May 634 342 3,957 975
Jun 1,154 1,385 1,878 4,938
Jul 6,800 1,297 22,684 3,864
Aug 52,325 7,622.03 220 800
YEARS NUMBER OF SPILLS QUANTITY SPILLED (BARRELS)
2010 537 17,658.10
2011 673 66,906.84
2012 844 17,526.37
2013 522 4,066.20
2014 1087 10,302.16
2015 753 32,756.87
2016 434 1,658.98

83 | P a g e
Months Sum of WBMC (MT) Sum of OBMC (MT) Sum of SPENT WBM (MT) Sum of Spent OBM (MT)
Sep 744 469 900 658
Oct 5,003 - 317 -
Nov 1,146 - 2,288 -
Dec 2,290 2,549.6 1,565 7,400
Grand Total 82,055.5 24,862.6 116,113 59,004
Table 60: 2016 Accredited Waste Managers
COMPANY NAME TYPE OF FACILITY LOCATION
AREA
OPERATIONAL
STATUS
Specialty Drilling Fluids Ltd TDU: 1 unit
WBM: 1 unit Rivers State Operational
Nubian Nigeria Ltd TDU:1 LTDU (Rotomil Low Temperature) Rivers State Operational
Delta Waste Management
Company Limited (DEL)
TDU: 3 LTDU, 1 Medium
INCINERATOR: 1 High Temp Hazardous Waste
Incinerator
Rivers State Operational
ITS Drilling Services INCINERATOR: 2 Trash Incinerators CA1000 & RD700
(Models) Rivers State Operational
Paschal Technical Services Ltd INCINERATOR: 1 Macroburn V500C Incinerator Rivers State Operational
Golden Years Ltd INCINERATOR: 2 Incinerators Rivers State Operational
Allman Global INCINERATOR: 1 Incinerator - Non-operational
WBM: Mobile Water based Treatment Plant Rivers State Operational
The Initiates TDU: 1 Indirect Fire Soil Remediation Unit Rivers State Operational
Nautilus Engineering and
Construction Company (NECC) TDU: 1 Mobile TDU Rivers State Operational
Seric Impianti TDU: 1 Unit Rivers State Operational
Boskel Engineering Services
INCINERATOR:1 High Temp. Rotary Kiln incinerator, 1
High Temp. Liquid incinerator.
TDU: 1 unit
Rivers State Operational
Halden Nigeria Limited INCINERATOR: 1 unit Dual Chamber Incinerator Rivers State Operational
Frigate Investment Ltd TDU :1 unit LTDU
WBM: 1 unit Rivers State Operational
FIBOW INCINERATOR:1-unit High Temp Horizontal flow
Multi-Chambered Incinerator Rivers State Operational
EPCC Ltd INCINERATOR: 1 unit Sludge Incinerator Rivers State Operational
SPDC
INCINERATOR: 1 Medical Incinerator
• Recycling Waste Depot
• Sewage Treatment Plant
• Eneka Dump Site
Rivers State Operational
Titan Project Nigeria Ltd TDU: 1 unit Rivers State Operational
MPNU
INCINERATOR (3):
• 1 Gencorp Beverly Type Waste Incinerator (for
general waste)
• 1 Howden Pyrolitic Gasification System (medical
incinerator)
• 1 Municipal Waste (Trash) incinerator
Rivers State Operational
Comprehensive Remediation
Technologies (CRT)
TDU: 1 unit
INCINERATOR: 1 unit Rivers State Operational
Mosab Marine and Engineering
Services Limited TDU: 1unit Vulcan TDU Rivers State Operational
Amotoi Global Services Limited INCINERATOR: 1 unit Rivers State Operational
Franco Intl Energy Services TDU: 1 unit Bayelsa State Operational
Prime Sources Ltd INCINERATOR: 1 unit Rivers State Operational

84 | P a g e
COMPANY NAME TYPE OF FACILITY LOCATION
AREA
OPERATIONAL
STATUS
Petro-Scan Ltd TDU: 1 unit Rivers State Operational
Fidella Oil and Gas Services Ltd TDU: 1 unit Vulcan TDU Rivers State Operational
Olutee Engineering Services
INCINERATOR (3): • 1 Gencorp Beverly
Type Waste Incinerator (for general waste)
• 1 Howden Pyrolitic Gasification System (medical
incinerator)
• 1 Municipal Waste (Trash) incinerator
Delta State Operational
Mawe Services Limited TDU: 1 unit Delta State Operational
Titan Projects Nigeria Limited TDU: 1 unit Delta State Operational
Ebenco Global Resources Limited Incinerator Delta State Operational
Vmart Company Limited Incinerator Delta State Operational
Silver Star Environmental Nigeria
Limited TDU: 4 units Delta State Operational
ITS Drilling Services Nigeria Limited TDU: 1 UNIT Abia State Operational
Table 61: Summary Of Waste Management Facilities
S/N TYPE OF FACILITY OPERATIONAL PERMIT
1 TDU 19
2 INCINERATOR 13
3 TANK CLEANING 6
4 WBM HANDLING 8
5 SLOP/PRODUCED WATER 0
6 SLOP OIL 1
7 SLUDGE SEPARATION/RECOVERY 0
8 INTEGRATED WASTE MGT FACILITY 1
9 HAZARDOUS WASTE TRANSPORTATION 1
10 LUBE/TYRE RECYCLING 0
11 WASTE WATER TREATMENT 1
12 SECONDARY WASTE/SOLIDIFICATION 3
TOTAL 53
Table 62: 2016 Oil Spill Contingency Plan Activation
S/N LOCATION Nos of Companies for OSCP/FI Actual Nos of Companies audited
1 Lagos (Depots) 68 47
2 Niger (Depot) 1 1
3 Enugu (Depot) 1 1
4 Zamfara (Depot) 1 1
5 Kaduna (Depot/Refinery) 1 1
6 Port Harcourt (Refinery, Plants, Installations) 20 14
7 Warri (Refinery, Plants, Installations) 20 14
8 Deep Offshore 7 7
9 Owerri 3 2
10 Abia (Depot) 1 1
11 Ilorin 1 0
TOTAL 124 89

85 | P a g e
Table 63: Number Of Petitions Received In 2016
CATEGORY CSR POLLUTION COMPENSATION OTHERS (DISPUTES, CONTRACTUAL ISSUES,
RECOGNITION AS HOST COMMUNITY)
COUNT 9 13 7 8
Table 64: Request For Approvals – Chemicals
Table 65: Summary of Accredited Laboratories
Laboratory Service Number
Total Lagos Zone Port Harcourt Zone Warri Zone
Environmental Quality Monitoring 13 22 12 47
Bio-Monitoring 11 10 2 23
Petroleum Product monitoring 13 7 5 25
Geological 6 10 0 16
Material Safety Investigation 1 5 0 6
Total 44 54 19 117
Table 66: 2016 Approved Production Chemicals Inventory
S/N PRODUCTION CHEMICALS NUMBERS
1 BIOCIDE 55
2 CORROSION INHIBITORS 65
3 OXYGEN SCAVENGER 21
4 EMULSION BREAKERS 47
5 BIOREMEDIATION 13
6 ANTIFOAM 26
7 SCALE INHIBITOR 39
8 OTHERS 28
Total 294
Table 67: Summary of Drilling Chemicals
S/N DRILLING FLUID TYPE NUMBERS
1 WATER BASE MUD 43
2 SYNTHETIC BASE MUD 33
3 BASE FLUID 15
4 OIL BASE MUD 9
5 ADDITIVES 10
6 OTHERS 55
TOTAL 158
No. of Applications Received Approved Disapproved Pending
29 25 (Biocides- 7; Scale Inhibitors- 5; H2S Scavenger- 5; Bioremediation Products- 2; Floculant- 1; Scale Dissolver- 1; Drilling fluid- 3; Cleaning Agent- 1; Antifoam- 1; Surfactant- 1; Corrosion Inhibitor- 3)
4 0

86 | P a g e
Table 68: Applications For Environmental Restoration Services
SERVICE APPROVAL STATUS APPROVAL TYPE
TOTAL NEW RENEWAL
SOIL REMEDIATION
APPROVED 3 1 4
UNDER PROCESSING 12 2 14
DISAPPROVED 11 1 12
OIL SPILL CONTAINMENT / CLEANUP
APPROVED 65 23 88
UNDER PROCESSING 4 0 4
DISAPPROVED 13 1 14
PIT BACKFILLING / LAND RECLAMATION
APPROVED 0 1 1
UNDER PROCESSING 1 0 1
DISAPPROVED 0 1 1
TOTAL 109 30 139
Table 69: Environmental Studies#
1A = Approved 2UR = Update required #At the end of 2016, 250 Consultants turned in applications to render Environmental Services as Environmental Studies consultant;
197 were accredited / approved (116 renewals and 81 new entrants); 43 were disapproved.
Table 70: Approved Safety And Medical Emergency Training Centres
Month ESR TOR/SOW PAIR EIA EER/EES EMP BIO MON PIA PDSS
TOTAL A1 UR2 A UR A UR A UR A UR A UR A UR A UR A UR
January 2 2 2 2 2 6 2 4 1 23
February 3 2 1 1 3 3 1 1 15
March 4 4 3 2 2 15
April 1 8 2 1 2 3 1 1 1 1 21
May 2 1 1 2 1 1 8
June 3 6 1 1 2 1 14
July 1 1 1 3 2 8
August 1 4 2 5 2 14
September 8 2 1 4 15
October 5 2 1 7 15
November 1 1
December 2 2
TOTAL 2 39 24 7 6 12 18 8 24 4 1 1 1 2 2 151
S/No Company Facility Location Address Approved Courses
1 Tolmann Allied Services Company Limited
Plot 7b Trans Amadi Industrial Layout, Mothercat Junction (Opp. Anadrill), Port Harcourt
Basic Firefighting; Breathing Apparatus Course; Basic First Aid; Helicopter Landing Officer; Advanced First Aid; Helideck Team Member; Basic Offshore Safety Induction and Emergency Training; Emergency Response Course; Helicopter Underwater Escape Training; Confined Space Entry; Further Offshore Emergency Training; Swing Rope Transfer
2 Charkins Maritime Safety Training Center
KM 4, East West Road, Ozuoba, Port Harcourt
Basic Firefighting; Further Offshore Emergency Training; Advanced Firefighting; Travel Safely by Boat; Basic First Aid; Helicopter Landing Officer; Advanced First Aid; Helideck Team Member; Basic Offshore Safety Induction and Emergency Training; Well Control & Intervention; Helicopter Underwater Escape Training; Rigging & Slinging
3 Opeans Nigeria Limited 32 Jenny & Jessy Road, Off Peter Odili Road, Port Harcourt, Rivers State
Tropical Helicopter Underwater Escape Training; Breathing Apparatus Course; Tropical Basic Offshore Safety Induction and Emergency Training; Confined Space Entry; Basic Firefighting; Swing Rope/Basket Transfer; Basic First Aid; Advanced First Aid; Lifeguard/Offshore Rescue and Survival Techniques
34 Opete Road, Off Okokutu Junction, Warri, Delta State
Helicopter Underwater Escape Training

87 | P a g e
* Please note that the list may be withdrawn, modified or updated without notice.
Table 71: Offshore Safety Permit (OSP) Summary
PERSONNEL REGISTERED PERSONNEL CAPTURED PERMITS ISSUED
34,816 27,766 27,598
4 Safety Center International Ltd
Opposite Port Harcourt Int’l Airport Hotel, Port Harcourt, Rivers State
Basic Firefighting; Basic First Aid; Advanced Firefighting; Breathing Apparatus Course; Confined Space Entry; Health & Safety in Welding
5 JC International Limited
Plot 5 JC Street, Off Peter Odili Road, Port Harcourt, Rivers State
Rope Access; Lifting Operations Course; Drilling & Well Intervention; Confined Space Entry
6 Falck Prime Atlantic Training Centre
KM 60, Off Old Lagos-Ibadan Road, Ipara, Ogun State
Basic Firefighting; Travel Safely by Boat; Advanced Firefighting; Travel Safely by Boat Further Training; Basic First Aid; Helicopter Landing Officer; Advanced First Aid Helideck Assistant/Team Member; Helicopter Underwater Escape Training; Emergency Response Courses; Basic Offshore Safety Induction and Emergency Training; Rigging & Slinging; Further Offshore Emergency Training; Working at Heights; Confined Space Course (Entry/Exit & Search/Rescue); Breathing Apparatus Course
7 Blisston Nigeria Limited
Block B, Plot 7, Eleko Beach Road, Lekki, Lagos State
Basic Firefighting; Tropical Further Offshore Emergency Training; Advanced Firefighting; Helicopter Landing Officer; Helicopter Underwater Escape; Training Emergency Response Courses; Tropical Basic Offshore Safety Induction and Emergency Training; Swing Rope Transfer
8 Lym Consults Km 10 Sapele-Warri Express Road, Otomewo Community, Near Warri, Delta State
Basic Offshore Safety Induction and Emergency Training; Basic Firefighting; Basic First Aid; Helicopter Underwater Escape Training (HUET); Survival at Sea (SAS)
9 Emergency Response Services Ltd
Off 394, Ikwere Road, Rumuokwuta, Port Harcourt, Rivers State
Basic Life Support (BLS), Advanced Cardiovascular Life Support (ACLS), Pediatric Advanced Life Support (PALS), Basic Emergency Response Training (Medical), Rig Medic

88 | P a g e
4.5 REVENUE PERFORMANCE
Table 72: Revenue Performance Summary
YEARS OIL ROYALTY GAS ROYALTY
GAS FLARED PENALTY
CONCESSION RENTALS
MISCELLANEOUS OIL REVENUE
TOTAL REVENUE
₦ ₦ ₦ ₦ ₦ ₦ 2010 694,352,412,710.14 0.00 2,388,572,351.20 728,308,923.82 951,380,744.23 698,420,674,729.39
2011 1,066,836,980,909.87 14,613,812,392.68 3,482,627,975.15 388,502,293.27 2,077,222,926.87 1,087,399,146,497.84
2012 1,052,043,067,383.93 22,242,285,752.85 3,849,873,091.61 444,535,531.69 1,370,171,171.68 1,079,949,932,931.76
2013 960,540,365,106.84 23,235,123,088.28 3,120,786,665.13 178,630,934.47 3,981,983,109.64 991,056,888,904.36
2014 986,343,364,217.80 21,110,923,948.24 2,930,215,304.51 413,496,723.26 5,983,027,290.84 1,016,781,027,484.650
2015 545,061,446,369.23 22,292,228,906.41 2,590,365,296.82 201,275,922.56 17,489,298,348.58 587,634,614,843.60
2016 437,356,879,889.83 16,298,590,492.52 2,333,879,050.11 342,495,121.25 6,408,509,381.58 462,740,353,935.29
Total 5,742,534,516,587.64 119,792,964,580.98 20,696,319,734.53 2,697,245,450.32 38,261,592,973.42 5,923,982,639,326.89
4.5.1 The Role of Value Monitoring & Benchmarking (VMB) of Oil & Gas Projects and Operations
in Nigeria
The collapse of oil prices and growing uncertainties of oil and gas business have necessitated the
need for standardization of regulatory processes as a panacea for value optimization and improved
performance of the Nigeria’s oil and gas industry. The reform of oil and gas industry regulatory
processes critically underscore the sustainability of maximum revenue realization for government
and profitability for the investors.
The Value Monitoring and Benchmarking (VMB) of Oil and Gas Projects and Operations in Nigeria is
an initiative by the Department of Petroleum Resources (DPR) that is aimed at strategically aligning
technical and economic equations that govern industry businesses and activities in line with extant
laws. The framework establishes mechanism to standardize processes and measures by which
industry value performances are underscored as well as monitor and benchmark technical cost
elements. It introduces unique cost coding indicators for empirical analysis of oil and gas projects
and operations, launch an industry that exude operational excellence and performance efficiencies
with higher degree of costs predictability.
Significantly, VMB has gained industrywide acceptance at its current level of implementation and
has been described as emergence of a new era of a transparent, verifiable performance metrics. The
contributions of this innovation engender structural basis for performance measurement indicators
and benchmarks, and offers technical and economic data solutions for investors and other
stakeholders including policy experts, and international institutions.

89 | P a g e
Norway earned global reputations in Petroleum Resources Management from their regulatory
standards in operational and cost monitoring strategies adopted by the regulator, Norwegian
Petroleum Department (NPD). The NPD collects and analyses data from the operating companies
on the shelf and compares this with its own data and forecasts. The companies also report their field
data and forecasts for production, costs, emissions and discharges to the environment.
Similarly, Nigeria petroleum laws mandate that DPR monitor technical and economic aspects of
Conservation and project appraisal in line with section 9 of the Petroleum Act 1969 as amended,
sections 56 and 57 of the Petroleum (Drilling and Production) Regulations 1969 as amended, and
General E of the Manual of Procedure Guide for Petroleum Inspectorate, where the roles of value
monitoring and benchmarking was established.
VMB architecture provides for elaborate viewpoints of cost analyses outcomes and value
performance efficiencies across the petroleum industry. Fundamental cost drivers, diverse contract
forms, terrains and fiscal terms definitions are tracked, captured and subjected to various critical
evaluations. The results are underscored based on the basic industry Key Performance
Indicators(KPIs)
The basic KPIs identified as measure of industry value performance and the degree of efficiency
include: Unit Technical Cost (UTC), Unit Exploration Cost (UEC), Unit Development Cost (UDC), Unit
Operating Cost (UOC), Long-Run Marginal Cost (LRMC), Short-Run Marginal Cost (SRMC), Reserves
Replacement Ratio (RRR) index, Reserves Production Ratio (RPR) Ratio, Fiscal Terms Impact (FTI),
Cost of Regulation index, CAPEX Risk Diversification (CRD) index, Investment Capital index, Ultimate
Recovery index and Reserves and Production index.

90 | P a g e
5 Glossary of Terms
AG - Associated Gas
AGO - Automated Gas Oil
AR2 - African Regional Line
ATC-Approval to Construct
BPSD – Barrel per Stream Day
CB - Carbon Black
DGSO - Domestic Gas Supply Obligation
DPK - Dual Purpose Kerosene
DPR - Department of Petroleum Resources
EGP – Escravos Gas Plant
EOR - Enhanced Oil Recovery
FCT - Federal Capital Territory
FPSO - Floating Production Storage and Offloading
IDSL –Integrated Data Services Limited
IO – Indigenous Operator
IOC- International Oil Company
JV - Joint Venture
KM - Kilometer
KRPC - Kaduna Refinery & Petrochemical Company
LAB - Linear Alkyl Benzene
LLDPE - Linear Low Density Polyethylene
MF - Marginal Field
MMbbls - Million barrels
MMSCFD - Million Standard Cubic Feet per Day
MT – Metric Tonnes
NAG – Non-Associated Gas
NAOC - Nigerian Agip Oil Company
NAPIMS - National Petroleum Investment Management Services
NDPR - Niger Delta Petroleum Resources

91 | P a g e
NDRC - Niger Delta Regional Data Compilation
NGC – Nigerian Gas Company
NGL - Natural Gas Liquid
NNPC - Nigerian National Petroleum Corporation
NPDC - Nigerian Petroleum Development Company
OBLG - Obligation
OML - Oil Mining Lease
OPEC – Organization of the Petroleum Exporting Countries
OPL - Oil Prospecting License
PE - Polyethylene
PERF - performance
PHRC - Port Harcourt Refining Company
PMS - Petroleum Motor Spirit
PP - Polypropylene
PPHP - Polypropylene Homo-Polymer
PPMC - Petroleum Product Marketing Company, a subsidiary of NNPC
PPT - Petroleum Profit Tax
PRF - Propylene-Rich Feed
PSC - Production Sharing Contract
SC - Service Contract
SPDC - Shell Petroleum Development Company
SQ KM - Square Kilometer
SR - Sole Risk
TA – Technology Adaptation
TCF – Trillion Cubic Feet
TQ – Technology Qualification
WRPC - Warri Refining & Petrochemical Company
The data and information published in this report are subject to ongoing review by DPR based on
continuous reconciliation with various stakeholders. Therefore, reliance on data contained herein
should be based on final confirmation by DPR.