2013 global aerospace and defense sector financial ... · global aerospace & defense industry...
TRANSCRIPT
June 2013
Global Aerospace & Defense Industry Financial Performance StudySoaring revenue increases of US$38.4 billion in 2012 from commercial aerospace lifts the industry while defense continues to decline

Title of publication Focus area of publication 2
Contents
2 Contents 3 Summary discussion 6 Summary of key financial measures 8 Study scope 11 2012 Global A&D Industry performance in detail 24 U.S. versus European companies 27 Commercial versus Defense segment performance 29 Subsector performance 31 Summary Industry performance tables 36 Study methodology 42 Contact

Global Aerospace & Defense Industry Financial Performance Study, June 2013 3
Commercial aerospace drives sector growth and more – The global aerospace and defense (A&D) Industry’s revenue grew overall by 5.9 percent in 2012,1 all due to record production of commercial aerospace, and even made up for global defense industry revenue declines. Boeing Commercial Airplanes and Airbus Commercial topped their previous year’s combined production with the delivery of 1,189 aircraft in 2012, the highest production level achieved in commercial aircraft history.2,3 According to Deloitte’s analysis of the leading global A&D companies, the commercial aircraft segment’s revenue increased 16.2% or US$38.4 billion in 2012.4 Boeing Commercial and Airbus Commercial generated over half of the increase in commercial aircraft revenues, as combined revenue increased by 27.2 percent, or approximately $20.5 billion in 2012.5,6 To give a perspective on how large this is, if this were a company, it would rank as the 10th largest global A&D firm.
Over the next 20 years, passenger travel demand growth is expected to continue to increase, especially in Asia and the Middle East markets. Growth is also being driven by demand from airline operators as they retire obsolete, less fuel efficient airplanes.7 Boeing forecasts 35,280 new aircraft will be produced from 2013 through 2032.8 With 7 years of backlog, production increases are expected to continue and record levels of commercial aircraft production may be expected again in 2013.9
1 Deloitte LLP Global Aerospace & Defense Industry Financial Performance Study, June 2013. See methodology section for further information and definitions of financial metrics. 2 Boeing Orders & Deliveries, http://active.boeing.com/commercial/orders/index.cfm (accessed February 14, 2013)3 Airbus Orders & Delivers, http://www.airbus.com/no_cache/company/market/orders-deliveries/ (accessed February 14, 2013)4 Deloitte LLP Global Aerospace & Defense Industry Financial Performance Study, June 2013. See the methodology section for further information and definitions of financial metrics related to the commercial versus defense calculations. Refer to Figure 18 in the report.5 Boeing, 2012 10-K, 11 February 2013.6 EADS, 2012 Financial statements, http://www.eads.com/dms/eads/int/en/investor-relations/documents/2013/AGM/EADS-Financial-Statements-2012/EADS%20Financial%20statements%202012.pdf (accessed 6 May 2013).7 Boeing Current Market Outlook 2013-2032; Deloitte Analysis8. Boeing Current Market Outlook 2013-2032, http://www.boeing.com/assets/pdf/commercial/cmo/pdf/Boeing_Current_Market_Outlook_2013.pdf (accessed June 11, 2013)9. http://www.airbus.com/company/market/orders-deliveries/; Boeing, 2012 10-K, 11 February 2013. (accessed 6 May 2013).
Defense continues to shrink, due to cessation of major armed conflicts and sovereign affordability challenges – Global defense revenues fell 1.3 percent in 2012,10 principally due to decreases in U.S. defense budgets, where 39.1 percent of global defense is spent, as well as European defense budget declines.11 This is the second consecutive year of global defense revenue declines with 2011 revenues decreasing 1.9 percent. The U.S. defense sector continues to be impacted by budget reductions of US$487 billion over 10 years, established under the Budget Control Act of 2011,12 as well as the additional $42 billion annual budget reduction associated with the automatic “sequester” that took effect on March 1, 2013.13 However, sales by global defense companies to non-domestic markets offer some upside potential as certain geographies face increasing national security threats, although this is not expected to fill the revenue gap completely.
Overall industry financial performance improved in 2012 – Despite declines in defense spending, the key financial performance metrics for the global Industry improved in 2012, as commercial aerospace’s growth more than offset declining revenue in defense. Reported operating earnings, a key financial metric, increased 8.4 percent and operating margin improved 2.3 percent. In addition, free cash flow (FCF) increased 2.8 percent, and reported operating earnings per employee increased 7.5 percent.14 Of the key financial metrics we measured, only the book to bill (BTB) ratio declined in 2012, primarily due to a 49.7 percent decline in EADS’ very high 2011 BTB ratio. Although the company’s BTB ratio decreased to 1.45x, it still ranks in the top quartile of A&D companies
10 Deloitte LLP Global Aerospace & Defense Industry Financial Performance Study, June 2013. See the methodology section for further information and definitions of financial metrics related to the commercial versus defense calculations. Refer to Figure 18 in the report.11 Stockholm International Peace Research Institute (SIPRI), SIPRI Military Expenditure Database - http://milexdata.sipri.org/files/?file=SIPRI+military+expenditure+database+1988-2012.xlsx (accessed May 28, 2013).12 Aerospace Industries Association, “The Real Defense Budget Challenges Lie Ahead,” 26 January 2012.13 “Automatic Reductions in Government Spending — aka Sequestration”; Wendy Edelberg - CBO Assistant Director for Macroeconomic Analysis. http://www.cbo.gov/publication/43961 (accessed 17 May 2013).14 Deloitte LLP Global Aerospace & Defense Industry Financial Performance Study, June 2013. See methodology section for further information and definitions of financial metrics
Summary discussion
4
in 2012. Although the Industry’s overall BTB ratio had a marked decline in 2012, if the impact of Boeing and EADS’ contributions are excluded, the BTB ratio actually increased 3.3 percent to 1.08x, mainly due to the order strength of commercial aerospace suppliers.
Overall financial performance is expected to increase in 2013 as additional revenue volume from commercial aerospace provides economies of scale, which may result in higher margins, absent additional one-time charges to earnings. Additional cost cutting in anticipation of further defense budget cuts is also expected to contribute to this positive trend.
Commercial aerospace is becoming more dominant, approaching parity with defense – During the past several years, the defense segment comprised nearly two-thirds of the entire A&D industry, but over the past two years, the commercial aerospace segment has been increasing its share of the global A&D industry with 45.9 percent of the total revenues posted in 2012.15 With defense expected to continue declining, and the robust commercial aerospace segment expected to continue record revenue performance, in a few years we may see parity between these 2 segments of the global A&D industry.
The heavy weighting and predominance of the defense segment was due to the long-term nature of the military buildup and sustainment to support 2 large-scale and long- term military conflicts in the Middle East during the first decade of the new century. This was also in combination with slower growth experienced in commercial aerospace starting with the 2002 recession and continuing with the great recession starting in 2008. Barring a black swan event in commercial air transport operations or increased instability in the key geographies of the South China Seas, North Korea, Syria, Iran, or flare-ups in non-secure border regions, this trend towards parity and beyond is likely to continue for several years.
15 Deloitte LLP Global Aerospace & Defense Industry Financial Performance Study, June 2013. See the methodology section for further information and definitions of financial metrics related to the commercial versus defense calculations. Refer to Figure 18 in the report.
One-time charges return, though not because of program execution challenges – Non-recurring exceptions, or one-time charges, increased to US$5.6 billion in 2012, compared to US$4.4 billion in 2011, and US$2.4 billion in 2010.16 One-time related charges increased 26.0 percent primarily due to charges from a small set of companies – General Dynamics, Finmeccanica, and Engility – comprising 78.3 percent of the US$5.6 of non-recurring A&D-related charges.17 The big charges in 2012 are partly attributable to goodwill impairments associated with the evaluation of certain businesses in light of the defense spending environment, as well as the impact on the company’s valuation as a standalone company. Most of the remaining charges were attributable to corporate repositioning and restructuring charges.
Excluding these charges, core18 operating earnings for the Industry grew 9.7 percent, while operating margins advanced to 9.4 percent from 9.1 percent in 2011.19 This compares to 2009 when one-time write-offs were concentrated in a set of companies experiencing program execution challenges, which was not the case in 2012.
16 Ibid; and Deloitte Development LLC, “2010 Global Aerospace & Defense Industry Performance Wrap-up,” 7 July 2011.17 General Dynamics, 2012 10-K, 8 February 2013; and Finmeccanica, Consolidated financial statements, http://www.finmeccanica.com/EN/Common/files/Corporate/Bilanci_Presentazioni/Bilanci_2013/BILANCIO_SPA_2012_ENG_finale.pdf (accessed 3 May 2013); Engility, 2012 10-K, 21 March 2013.18 Comparison of 2012 to 2011 core earnings is frequently referred to in this report to reflect realistic operating performance, which adjusts for the effect of non-recurring A&D related company charges year to year. One-time A&D related company charges refers to program write-offs (such as cancellations, terminations), restructuring charges, asset impairment charges, acquisition-related expenses, loss on disposal of businesses, and litigation charges.19 Deloitte LLP Global Aerospace & Defense Industry Financial Performance Study, June 2013. See methodology section for further information and definitions of financial metrics.
Global Aerospace & Defense Industry Financial Performance Study, June 2013 5
European financial performance recovers and their improvements outpace the U.S. on most metrics – Following two years of underperformance, European A&D companies’ performance, across a majority of the financial measures, outpaced the U.S. A&D Industry’s growth metrics. Europe’s A&D Industry revenue increased 7.9 percent compared to the U.S. Industry growth of 5.1 percent. Reported operating earnings jumped 49.7 percent in Europe, while in the U.S. operating earnings decreased 1.4 percent, as operating margins increased 38.8 percent and decreased 6.2 percent, respectively. FCF declined 0.2 percent in the U.S., while it grew 19.3 percent in Europe. While the European A&D Industry maintained a higher BTB ratio at 1.23x, the U.S. A&D Industry BTB ratio growth increased 3.1 percent compared to a 28.3 percent decline in Europe. A&D companies in Europe saw a sharp upturn in the important efficiency metric of operating profit per employee, as employee productivity increased 48.2 percent, compared to a 1.7 percent decrease in the U.S. A&D Industry. However, on an absolute basis, U.S. A&D firms still post higher margins, and employee productivity metrics, and have for some time.
Supplier financial performance continues to outpace original equipment manufacturers (OEMs) – Suppliers reported revenue growth that exceeded OEMs: Tier one (14.4 percent); Tier two (10.6 percent); Tier three (14.4 percent); Aerostructures (8.9 percent), and Propulsion (10.5 percent).20 In 2012, OEMs revenue increased 5.9 percent, as commercial aerospace growth more than helped offset declines at defense companies. From an operating earnings perspective, OEMs profitability increased 4.9 percent, compared to strong earnings growth among the Tier one and two suppliers, which reported growth of 10.9 and 13.1 percent, respectively. Propulsion manufacturers experienced the biggest improvement as operating earnings increased 15.2 percent, as the segments profitability rose with historic commercial aerospace production. In addition, Tier one and two suppliers operating margins of 12.8 percent and 16.2 percent, respectively, provide another glimpse into how these suppliers are benefiting from the rising commercial aerospace market.
20 Ibid.
6
• Revenues: The global A&D Industry’s revenue grew to US$692 billion in 2012, posting a gain of 5.9 percent, compared to a revenue growth of 1.6 percent in 2011 and 1.1 percent in 2010.21
– In 2012, U.S. A&D companies’ revenues increased 5.1 percent, as compared to 7.9 percent for European companies, as European A&D companies reversed a two-year trend with faster revenue expansion. Industry revenue growth was largely driven by higher commercial aircraft deliveries and a stronger aftermarket business.22
– The OEM subsector’s revenue grew 5.9 percent, as commercial aircraft production drove parallel production across the supplier supply chain.
• Earnings: Reported Industry operating earnings increased 8.4 percent to US$59.5 billion, as strong profit growth especially among commercial aircraft manufacturers and propulsion equipment manufacturers more than offset the combined non-recurring A&D-related company charges of US$5.6 billion in 2012. Similar to previous reports, we are presenting earnings-related metrics in two ways: reported earnings and core earnings, to eliminate the impact of one-time write-offs on financial performance.
– U.S. companies’ reported operating earnings decreased 1.4 percent compared to an increase of 49.7 percent for European companies in 2012, as the impact of US$5.6 billion in non-recurring A&D-related charges were greater in the United States than Europe.
– The OEM subsector’s operating earnings increased 4.9 percent in 2012, due to the impact of declining defense sales and approximately US$4.3 billion in non-recurring charges. Propulsion manufacturers’ operating earnings increased 15.2 percent in 2012, lifted by rising volume.
21 Ibid22 Ibid
Core operating earnings:
– Excluding the impact of one-time charges, the Industry’s core operating earnings increased 9.7 percent to US$65.0 billion from US$59.3 billion in 2011.
– Three companies accounted for 78.3 percent of the global A&D Industry’s US$5.6 billion non-recurring A&D-related charges in 2012: General Dynamics, Finmeccanica, and Engility.
– From a geographic perspective, U.S. companies’ core operating earnings increased 2.7 percent, and the European companies’ core operating earnings rose by 32.6 percent.
– Excluding charges, the OEM subsector’s core operating earnings increased 10.6 percent in 2012.
• Margins: Reported Industry operating margin increased 20 basis points (bps) to 8.6 percent in 2012, as strong profit growth especially among commercial aircraft and propulsion equipment manufacturers more than offset the combined non-recurring A&D-related company charges.
– U.S. A&D companies reported a 10.0 percent operating margin in 2012, compared to 6.5 percent for European A&D companies.
Core operating margins:
– Core operating margin increased marginally by 32 bps to 9.4 percent in 2012.23
– When excluding the impact of one-time charges, core operating margin for U.S. companies outperformed the European companies, 10.9 percent versus 7.4 percent, respectively.24
23 Ibid24 Ibid
Summary of key financial measures
Global Aerospace & Defense Industry Financial Performance Study, June 2013 7
• Return on invested capital (ROIC): Reported Industry 2012 ROIC was 18.2 percent, a 134 bps increase compared to 2011, while core ROIC rose 122 bps to 18.9 percent in 2012. More than 9 out of 10 companies in the study generated positive ROIC during 2012.
• Free cash flow (FCF): Industry FCF increased 2.8 percent to US$48.6 billion in 2012, as A&D companies’ revenue and operating cash flow growth, especially in the commercial aerospace area, more than offset slowdowns in government defense spending or redeployment of cash for acquisitions and non-operating areas, such as higher pension contributions.
• Free cash margin (FCM): The Industry’s FCM increased 52 bps to 5.5 percent in 2012 from 4.9 percent in 2011, largely due to the 19.3 percent increase in FCF among the European A&D companies. In 2012, 36 percent of the companies in the study recorded FCM of more than 6 percent, while 14 percent posted FCM in excess of 10 percent.
• Book–to–bill ratio: The Industry’s book-to-bill (BTB) ratio25 fell to 1.17x in 2012 from 1.29x in 2011, or by 9.3 percent, largely due to a 49.7 percent decline in EADS’ BTB ratio, which even after this decrease, was one of the highest BTB metrics of any company in 2012. Excluding EADS’ 1.45x and Boeing’s 1.43x BTB performance, the Industry’s BTB actually only increased to 1.08x, a 3.3 percent increase compared to 2011.26
– Tier one suppliers produced the highest BTB ratio of 1.44x, in contrast to the weakest performing Tier three suppliers’ BTB of 0.96x.
25 Book-to-bill ratio: See methodology section for further information and definitions of financial metrics.26 Deloitte LLP Global Aerospace & Defense Industry Financial Performance Study, June 2013.
– Defense companies’ revenue outlook remains less optimistic compared to commercial aerospace, based on BTB ratios calculated for this segment. Although the top five defense companies’ revenue-weighted BTB ratio improved modestly to 1.02x, it still trails the 1.44x average revenue-weighted BTB ratio of Boeing and EADS.
• Employment: The A&D Industry’s total global employment increased 0.8 percent to approximately 2.1 million employees in 2012,27 as compared to the 3.4 percent growth in employment for the larger S&P 500 index group.28
• Productivity: The rate at which employees can drive higher profits is one important measure of industrial productivity, which is unaffected by the outsourcing schemes, that tend to skew revenue per employee analysis, thus this report’s focus is earnings per employee. Reported operating earnings per employee in 2012 increased 7.5 percent in 2012 to US$28,671, as the Industry’s total operating earnings rose 8.4 percent compared to an increase in employees of 0.8 percent. Core operating earnings per employee grew 8.8 percent, to US$31,351 from US$28,812.
A more detailed analysis of the financial metrics is given in the upcoming sections of this report.
27 Ibid28 CapitalIQ
8
Deloitte LLP’s Global Aerospace and Defense Industry Financial Performance Study analyzes 105 A&D companies or segments of industrial conglomerates with A&D businesses that reported revenue of more than US$500 million in 2012, with financial statements filed by December 31, 2012, unless otherwise specified. The study, however, does not include A&D organizations, such as government-controlled entities, private companies that do not release public filings, or public companies that do not report A&D segment information. In addition, certain companies from the previous year’s study were excluded due to conformance with study criteria, i.e., lower threshold of US$500 million in revenues, companies that were acquired, and companies going private.
The study of the 2012 financial performance of the Industry was conducted by assessing key nominal and growth metrics, including revenue, operating earnings, operating margin, return on invested capital (ROIC), free cash flow (FCF), free cash margin (FCM), book-to-bill (BTB) ratio, employee productivity, and equity market performance. All financial metrics in the study are based on a constant currency conversion method (unless otherwise stated as “differential method”) to eliminate the impact
of foreign exchange fluctuations on companies’ or the Industry’s performance. For more information on the conversion method, refer to the methodology section of this report.
The global A&D Industry is highly concentrated. Revenues for the top 10 companies comprised 54.8 percent of the overall Industry revenue in 2012.29 Thus, the combined performance of the top 10 companies significantly impacted the performance of the Industry as a whole.
Figure 1 includes the 105 companies and divisions that were analyzed in this study. These companies together, accounted for approximately 91.4 percent of the overall global revenue generated by the A&D Industry in 2012 according to our estimate. The remainder, an estimated 130 organizations, comprising close to US$63 billion in revenue, were excluded from the study, for the reasons described above.
29 Deloitte LLP Global Manufacturing Industry group observation based on the analysis of the companies in Figure 1.
Study scope
Global Aerospace & Defense Industry Financial Performance Study, June 2013 9
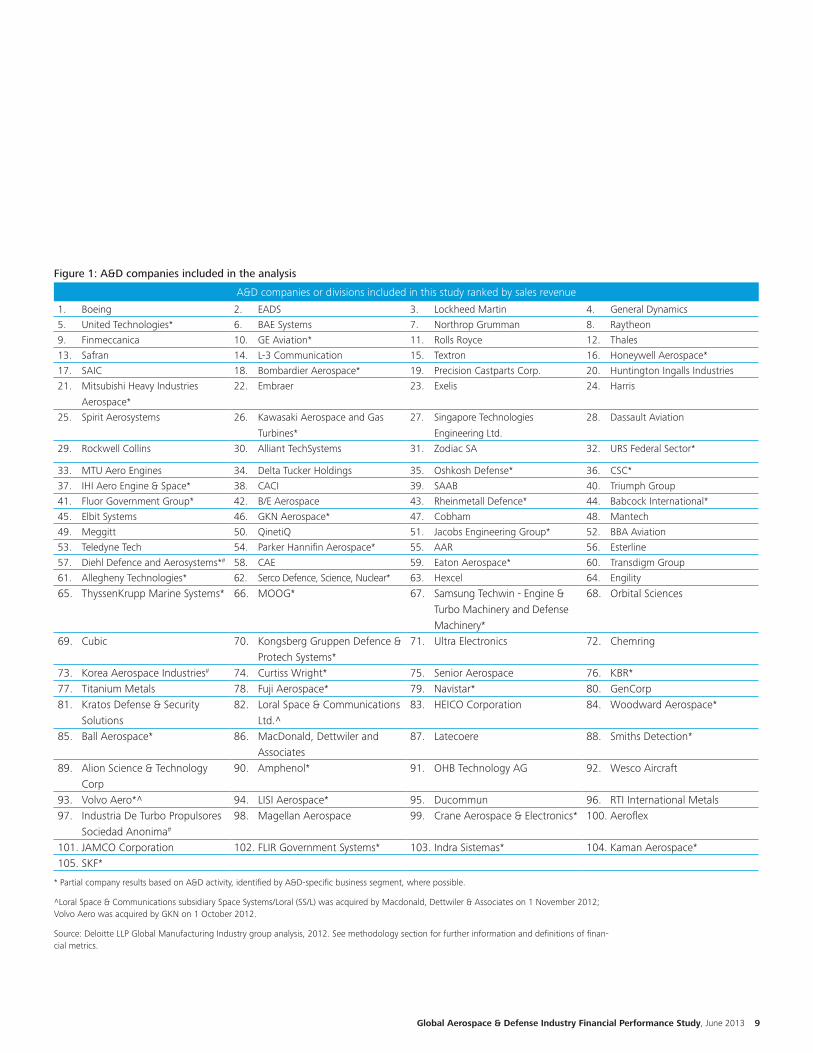
Figure 1: A&D companies included in the analysis
A&D companies or divisions included in this study ranked by sales revenue
1. Boeing 2. EADS 3. Lockheed Martin 4. General Dynamics
5. United Technologies* 6. BAE Systems 7. Northrop Grumman 8. Raytheon
9. Finmeccanica 10. GE Aviation* 11. Rolls Royce 12. Thales
13. Safran 14. L-3 Communication 15. Textron 16. Honeywell Aerospace*
17. SAIC 18. Bombardier Aerospace* 19. Precision Castparts Corp. 20. Huntington Ingalls Industries
21. Mitsubishi Heavy Industries
Aerospace*
22. Embraer 23. Exelis 24. Harris
25. Spirit Aerosystems 26. Kawasaki Aerospace and Gas
Turbines*
27. Singapore Technologies
Engineering Ltd.
28. Dassault Aviation
29. Rockwell Collins 30. Alliant TechSystems 31. Zodiac SA 32. URS Federal Sector*
33. MTU Aero Engines 34. Delta Tucker Holdings 35. Oshkosh Defense* 36. CSC*
37. IHI Aero Engine & Space* 38. CACI 39. SAAB 40. Triumph Group
41. Fluor Government Group* 42. B/E Aerospace 43. Rheinmetall Defence* 44. Babcock International*
45. Elbit Systems 46. GKN Aerospace* 47. Cobham 48. Mantech
49. Meggitt 50. QinetiQ 51. Jacobs Engineering Group* 52. BBA Aviation
53. Teledyne Tech 54. Parker Hannifin Aerospace* 55. AAR 56. Esterline
57. Diehl Defence and Aerosystems*# 58. CAE 59. Eaton Aerospace* 60. Transdigm Group
61. Allegheny Technologies* 62. Serco Defence, Science, Nuclear* 63. Hexcel 64. Engility
65. ThyssenKrupp Marine Systems* 66. MOOG* 67. Samsung Techwin - Engine & Turbo Machinery and Defense Machinery*
68. Orbital Sciences
69. Cubic 70. Kongsberg Gruppen Defence & Protech Systems*
71. Ultra Electronics 72. Chemring
73. Korea Aerospace Industries# 74. Curtiss Wright* 75. Senior Aerospace 76. KBR*77. Titanium Metals 78. Fuji Aerospace* 79. Navistar* 80. GenCorp81. Kratos Defense & Security
Solutions82. Loral Space & Communications
Ltd.^83. HEICO Corporation 84. Woodward Aerospace*
85. Ball Aerospace* 86. MacDonald, Dettwiler and Associates
87. Latecoere 88. Smiths Detection*
89. Alion Science & Technology Corp
90. Amphenol* 91. OHB Technology AG 92. Wesco Aircraft
93. Volvo Aero*^ 94. LISI Aerospace* 95. Ducommun 96. RTI International Metals97. Industria De Turbo Propulsores
Sociedad Anonima#
98. Magellan Aerospace 99. Crane Aerospace & Electronics* 100. Aeroflex
101. JAMCO Corporation 102. FLIR Government Systems* 103. Indra Sistemas* 104. Kaman Aerospace*105. SKF*
* Partial company results based on A&D activity, identified by A&D-specific business segment, where possible.
^Loral Space & Communications subsidiary Space Systems/Loral (SS/L) was acquired by Macdonald, Dettwiler & Associates on 1 November 2012; Volvo Aero was acquired by GKN on 1 October 2012.
Source: Deloitte LLP Global Manufacturing Industry group analysis, 2012. See methodology section for further information and definitions of finan-cial metrics.
10
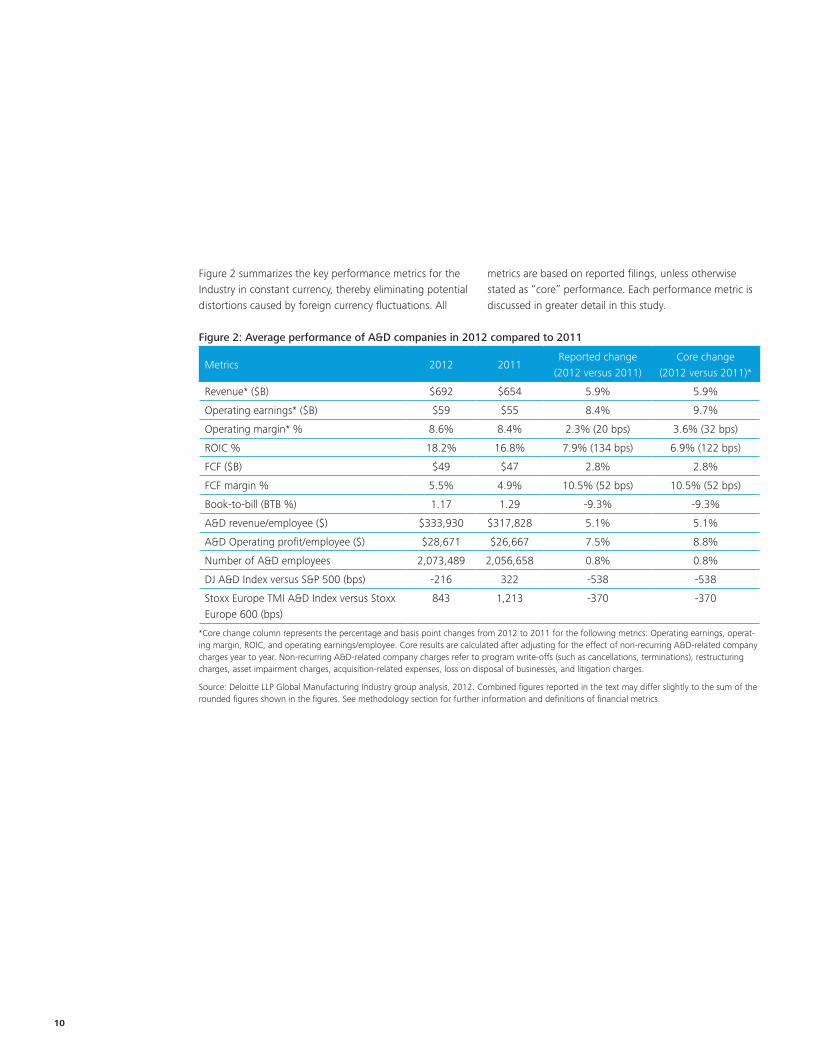
Figure 2 summarizes the key performance metrics for the Industry in constant currency, thereby eliminating potential distortions caused by foreign currency fluctuations. All
metrics are based on reported filings, unless otherwise stated as “core” performance. Each performance metric is discussed in greater detail in this study.
Figure 2: Average performance of A&D companies in 2012 compared to 2011
Metrics 2012 2011Reported change
(2012 versus 2011)Core change
(2012 versus 2011)*
Revenue* ($B) $692 $654 5.9% 5.9%
Operating earnings* ($B) $59 $55 8.4% 9.7%
Operating margin* % 8.6% 8.4% 2.3% (20 bps) 3.6% (32 bps)
ROIC % 18.2% 16.8% 7.9% (134 bps) 6.9% (122 bps)
FCF ($B) $49 $47 2.8% 2.8%
FCF margin % 5.5% 4.9% 10.5% (52 bps) 10.5% (52 bps)
Book-to-bill (BTB %) 1.17 1.29 -9.3% -9.3%
A&D revenue/employee ($) $333,930 $317,828 5.1% 5.1%
A&D Operating profit/employee ($) $28,671 $26,667 7.5% 8.8%
Number of A&D employees 2,073,489 2,056,658 0.8% 0.8%
DJ A&D Index versus S&P 500 (bps) -216 322 -538 -538
Stoxx Europe TMI A&D Index versus Stoxx Europe 600 (bps)
843 1,213 -370 -370
*Core change column represents the percentage and basis point changes from 2012 to 2011 for the following metrics: Operating earnings, operat-ing margin, ROIC, and operating earnings/employee. Core results are calculated after adjusting for the effect of non-recurring A&D-related company charges year to year. Non-recurring A&D-related company charges refer to program write-offs (such as cancellations, terminations), restructuring charges, asset impairment charges, acquisition-related expenses, loss on disposal of businesses, and litigation charges.
Source: Deloitte LLP Global Manufacturing Industry group analysis, 2012. Combined figures reported in the text may differ slightly to the sum of the rounded figures shown in the figures. See methodology section for further information and definitions of financial metrics.
Global Aerospace & Defense Industry Financial Performance Study, June 2013 11
The following sections discuss the 2012 financial performance of the Industry based on the type of company, geography, as well as on a consolidated basis:
• 2012 Industry performance details
• U.S. versus European comparisons
• Commercial aerospace versus defense segment comparisons
• Subsector performance comparisons
Revenue: Revenue for the Industry grew at a rate of 5.9 percent to US$692 billion in 2012, from US$654 billion in 2011. A year of record setting commercial aircraft production primarily drove Industry growth resulting in strong revenue growth for Boeing and EADS.30,31 Globally, Boeing and Airbus delivered 1,189 aircraft in 2012, the highest production level achieved in commercial aircraft history.32,33 The continued increase in production is driving parallel revenue growth for the Tier one and two suppliers and the aerostructure and propulsion subsectors. 10 of the top 20 A&D companies by revenue growth percentage were suppliers to the aircraft OEMs.
In Figure 3, Boeing, the overall A&D revenue leader and largest global A&D company, grew revenue 18.9 percent in 2012 to US$81.7 billion, primarily due to higher new airplane deliveries in its commercial airplanes group.34 Boeing Commercial Airplanes’ (BCA) revenue increased 35.8 percent to US$49.1 billion due to higher airplane deliveries across all programs. In 2012, Boeing delivered 601 commercial airplanes, up from 477 in 2011, as the company delivered 46 Dreamliner 787 aircraft compared to three deliveries in 2011.35 EADS’ revenue increased 15.0 percent to US$72.6 billion, supported by strong volume at
30 Boeing, 2012 10-K, 11 February 2013.31 EADS, Annual results presentation, http://www.eads.com/eads/int/en/investor-relations/key-financial-information/Financial-Statements-and-Presentations/2012.html, 27 February 2013. 32 Boeing Orders & Deliveries, http://active.boeing.com/commercial/orders/index.cfm (accessed February 14, 2013)33 Airbus Orders & Delivers, http://www.airbus.com/no_cache/company/market/orders-deliveries/ (accessed February 14, 2013)34 Boeing, 2012 10-K, 11 February 2013.35 Ibid.
Airbus Commercial, which delivered 588 aircraft in 2012 compared to 534 in 2011.36 The company also benefitted from increased commercial activity at Eurocopter and Astrium, as the integration of Vector Aerospace and Vizada drove its services businesses and contributed US$1.9 billion to 2012 revenue, or 45.8 percent of revenue growth.37 In 2012, Lockheed Martin’s revenue increased 1.5 percent to US$47.2 billion supported by higher F-35 low rate initial production (LRIP) contracts and F-16 deliveries in its Aeronautics segment, higher volumes for air and missile defense programs, and strong sales growth in the Space Systems segment due to increased commercial satellite deliveries.38
The revenue performances of these top 3 companies accounted for 29.1 percent of the total Industry revenue, and thus have a disproportionate impact on performance of the overall industry. Indeed the revenues of the top 20 firms represent 73.1 percent of the industry’s total revenue, illustrating how concentrated the Industry has become.
In Figure 4, LISI Aerospace, the top company by 2012 revenue growth, increased revenue 45.2 percent to US$760.8 million, driven by strong growth in its LISI AEROSPACE Fasteners and LISI AEROSPACE Structural Components segments; these segments benefitted from the first full year inclusion of the 2011 acquisitions of Creuzet Aéronautique and Indraero-Siren.39
In contrast, 27 of the 105 companies, mostly defense, experienced a decline in revenue in 2012, primarily due to the impact of cancellations or reductions in the value of government contracts. KBR had the largest percentage revenue decline in the Industry, falling 57.9 percent to US$1.1 billion in 2012. The defense contractor’s revenue dropped primarily due to the decline in logistics support services, associated with the withdrawal of U.S. combat troops in Iraq under the LogCAP III contract,40 to the U.S. government.
36 EADS, 2012 Financial statements, http://www.eads.com/dms/eads/int/en/investor-relations/documents/2013/AGM/EADS-Financial-Statements-2012/EADS%20Financial%20statements%202012.pdf (accessed 6 May 2013).37 Ibid38 Lockheed Martin, 2012 10-K, 28 February 2013.39 LISI Group, 2012 Annual Report, http://www.lisi-group.com/telechargement/fr/2012/finance_fr_2012.pdf (accessed 13 May 2013).40 KBR, 2012 10-K, 2 February 2013.
2012 Global A&D Industry performance in detail

12
Figure 3: Top 20 A&D companies by revenue in 2012
Top 20 A&D companies by revenue (US$ millions) (2012)
Boeing $81,698
EADS $72,628
Lockheed Martin $47,182
General Dynamics $31,513
United Technologies* $28,277
BAE Systems $26,501
Northrop Grumman $25,218
Raytheon $24,414
Finmeccanica $22,141
GE Aviation* $19,994
Rolls Royce $19,391
Thales $18,206
Safran $17,508
L-3 Communications $13,146
Textron $12,237
Honeywell Aerospace* $12,040
SAIC $11,173
Bombardier Aerospace* $8,628
Precision Castparts Corp. $7,215
Huntington Ingalls Industries $6,708
* Partial company results based on A&D activity, identified by A&D-specific business segment, where possible.
Source: Company filings and press releases, Deloitte LLP’s Global Manu-facturing Industry group analysis, 2012. See methodology section for further information and definitions of financial metrics.
Figure 4: Top 20 A&D companies by revenue growth in 2012
Top 20 A&D companies by revenue growth (2012)
LISI Aerospace* 45.2%
Transdigm Group 41.0%
RTI International Metals 39.4%
Kratos Defense & Security Solutions 35.8%
Ducommun 28.6%
Zodiac SA 25.8%
B/E Aerospace 23.4%
GKN Aerospace* 19.9%
Dassault Aviation 19.2%
Boeing 18.9%
United Technologies* 17.9%
HEICO Corporation 17.3%
Triumph Group 17.3%
SKF* 17.0%
Safran 16.8%
Precision Castparts Corp. 16.0%
Esterline 16.0%
JAMCO Corporation 15.9%
Volvo Aero* 15.4%
MTU Aero Engines 15.2%
* Partial company results based on A&D activity, identified by A&D-specific business segment, where possible. Figures are based on actual revenue growth change.
Source: Company filings and press releases, Deloitte LLP’s Global Manu-facturing Industry group analysis, 2012. See methodology section for further information and definitions of financial metrics.
Global Aerospace & Defense Industry Financial Performance Study, June 2013 13
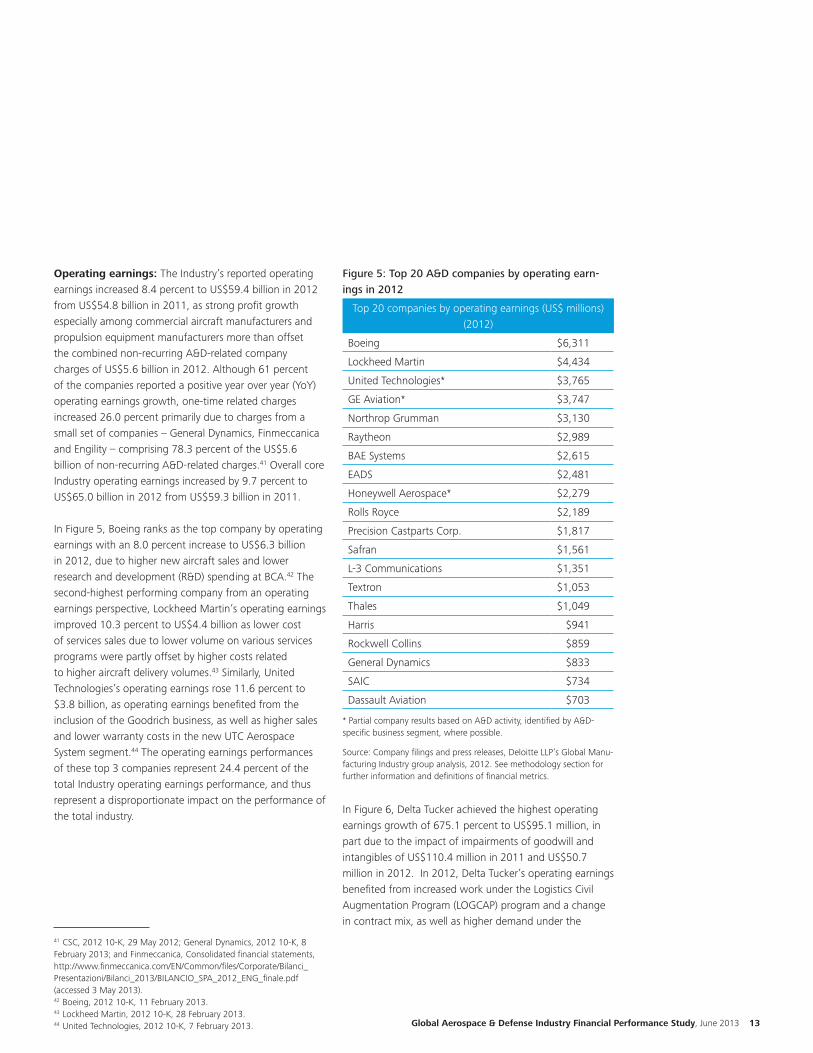
Operating earnings: The Industry’s reported operating earnings increased 8.4 percent to US$59.4 billion in 2012 from US$54.8 billion in 2011, as strong profit growth especially among commercial aircraft manufacturers and propulsion equipment manufacturers more than offset the combined non-recurring A&D-related company charges of US$5.6 billion in 2012. Although 61 percent of the companies reported a positive year over year (YoY) operating earnings growth, one-time related charges increased 26.0 percent primarily due to charges from a small set of companies – General Dynamics, Finmeccanica and Engility – comprising 78.3 percent of the US$5.6 billion of non-recurring A&D-related charges.41 Overall core Industry operating earnings increased by 9.7 percent to US$65.0 billion in 2012 from US$59.3 billion in 2011.
In Figure 5, Boeing ranks as the top company by operating earnings with an 8.0 percent increase to US$6.3 billion in 2012, due to higher new aircraft sales and lower research and development (R&D) spending at BCA.42 The second-highest performing company from an operating earnings perspective, Lockheed Martin’s operating earnings improved 10.3 percent to US$4.4 billion as lower cost of services sales due to lower volume on various services programs were partly offset by higher costs related to higher aircraft delivery volumes.43 Similarly, United Technologies’s operating earnings rose 11.6 percent to $3.8 billion, as operating earnings benefited from the inclusion of the Goodrich business, as well as higher sales and lower warranty costs in the new UTC Aerospace System segment.44 The operating earnings performances of these top 3 companies represent 24.4 percent of the total Industry operating earnings performance, and thus represent a disproportionate impact on the performance of the total industry.
41 CSC, 2012 10-K, 29 May 2012; General Dynamics, 2012 10-K, 8 February 2013; and Finmeccanica, Consolidated financial statements, http://www.finmeccanica.com/EN/Common/files/Corporate/Bilanci_Presentazioni/Bilanci_2013/BILANCIO_SPA_2012_ENG_finale.pdf (accessed 3 May 2013).42 Boeing, 2012 10-K, 11 February 2013. 43 Lockheed Martin, 2012 10-K, 28 February 2013.44 United Technologies, 2012 10-K, 7 February 2013.
Figure 5: Top 20 A&D companies by operating earn-ings in 2012
Top 20 companies by operating earnings (US$ millions) (2012)
Boeing $6,311
Lockheed Martin $4,434
United Technologies* $3,765
GE Aviation* $3,747
Northrop Grumman $3,130
Raytheon $2,989
BAE Systems $2,615
EADS $2,481
Honeywell Aerospace* $2,279
Rolls Royce $2,189
Precision Castparts Corp. $1,817
Safran $1,561
L-3 Communications $1,351
Textron $1,053
Thales $1,049
Harris $941
Rockwell Collins $859
General Dynamics $833
SAIC $734
Dassault Aviation $703
* Partial company results based on A&D activity, identified by A&D-specific business segment, where possible.
Source: Company filings and press releases, Deloitte LLP’s Global Manu-facturing Industry group analysis, 2012. See methodology section for further information and definitions of financial metrics.
In Figure 6, Delta Tucker achieved the highest operating earnings growth of 675.1 percent to US$95.1 million, in part due to the impact of impairments of goodwill and intangibles of US$110.4 million in 2011 and US$50.7 million in 2012. In 2012, Delta Tucker’s operating earnings benefited from increased work under the Logistics Civil Augmentation Program (LOGCAP) program and a change in contract mix, as well as higher demand under the
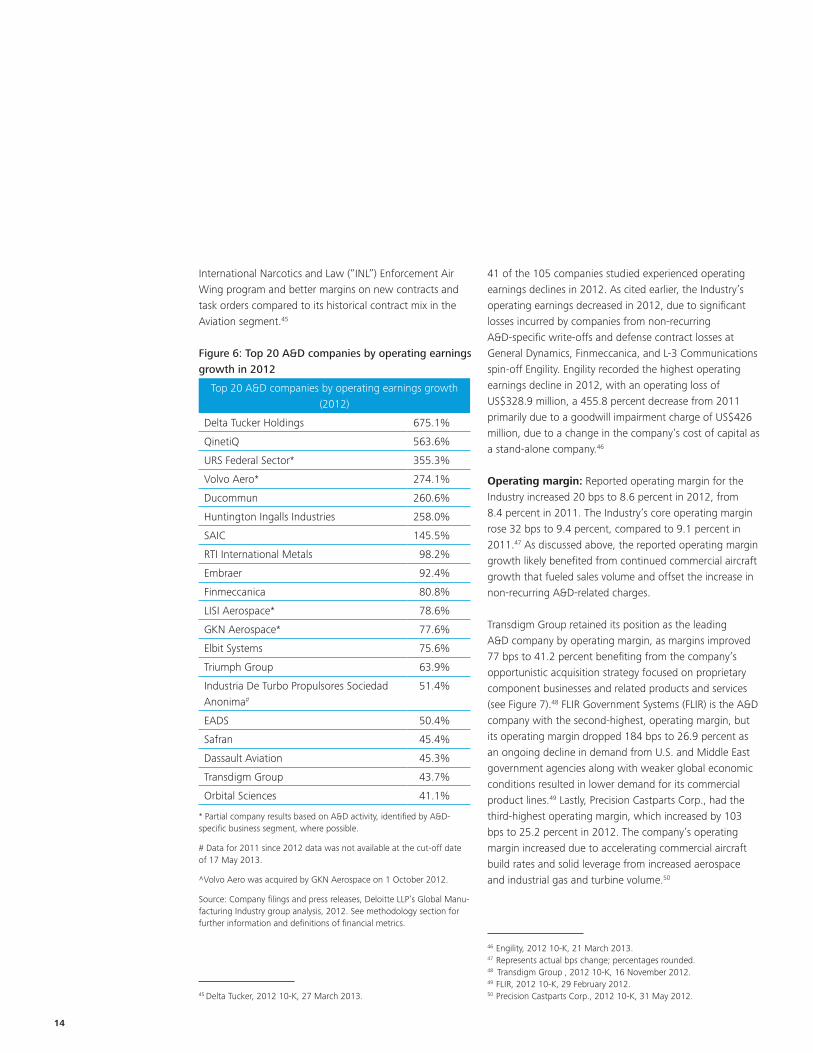
14
International Narcotics and Law (“INL”) Enforcement Air Wing program and better margins on new contracts and task orders compared to its historical contract mix in the Aviation segment.45
Figure 6: Top 20 A&D companies by operating earnings growth in 2012
Top 20 A&D companies by operating earnings growth (2012)
Delta Tucker Holdings 675.1%
QinetiQ 563.6%
URS Federal Sector* 355.3%
Volvo Aero* 274.1%
Ducommun 260.6%
Huntington Ingalls Industries 258.0%
SAIC 145.5%
RTI International Metals 98.2%
Embraer 92.4%
Finmeccanica 80.8%
LISI Aerospace* 78.6%
GKN Aerospace* 77.6%
Elbit Systems 75.6%
Triumph Group 63.9%
Industria De Turbo Propulsores Sociedad Anonima#
51.4%
EADS 50.4%
Safran 45.4%
Dassault Aviation 45.3%
Transdigm Group 43.7%
Orbital Sciences 41.1%
* Partial company results based on A&D activity, identified by A&D-specific business segment, where possible.
# Data for 2011 since 2012 data was not available at the cut-off date of 17 May 2013.
^Volvo Aero was acquired by GKN Aerospace on 1 October 2012.
Source: Company filings and press releases, Deloitte LLP’s Global Manu-facturing Industry group analysis, 2012. See methodology section for further information and definitions of financial metrics.
45 Delta Tucker, 2012 10-K, 27 March 2013.
41 of the 105 companies studied experienced operating earnings declines in 2012. As cited earlier, the Industry’s operating earnings decreased in 2012, due to significant losses incurred by companies from non-recurring A&D-specific write-offs and defense contract losses at General Dynamics, Finmeccanica, and L-3 Communications spin-off Engility. Engility recorded the highest operating earnings decline in 2012, with an operating loss of US$328.9 million, a 455.8 percent decrease from 2011 primarily due to a goodwill impairment charge of US$426 million, due to a change in the company’s cost of capital as a stand-alone company.46
Operating margin: Reported operating margin for the Industry increased 20 bps to 8.6 percent in 2012, from 8.4 percent in 2011. The Industry’s core operating margin rose 32 bps to 9.4 percent, compared to 9.1 percent in 2011.47 As discussed above, the reported operating margin growth likely benefited from continued commercial aircraft growth that fueled sales volume and offset the increase in non-recurring A&D-related charges.
Transdigm Group retained its position as the leading A&D company by operating margin, as margins improved 77 bps to 41.2 percent benefiting from the company’s opportunistic acquisition strategy focused on proprietary component businesses and related products and services (see Figure 7).48 FLIR Government Systems (FLIR) is the A&D company with the second-highest, operating margin, but its operating margin dropped 184 bps to 26.9 percent as an ongoing decline in demand from U.S. and Middle East government agencies along with weaker global economic conditions resulted in lower demand for its commercial product lines.49 Lastly, Precision Castparts Corp., had the third-highest operating margin, which increased by 103 bps to 25.2 percent in 2012. The company’s operating margin increased due to accelerating commercial aircraft build rates and solid leverage from increased aerospace and industrial gas and turbine volume.50
46 Engility, 2012 10-K, 21 March 2013.47 Represents actual bps change; percentages rounded.48 Transdigm Group , 2012 10-K, 16 November 2012.49 FLIR, 2012 10-K, 29 February 2012.50 Precision Castparts Corp., 2012 10-K, 31 May 2012.
Global Aerospace & Defense Industry Financial Performance Study, June 2013 15
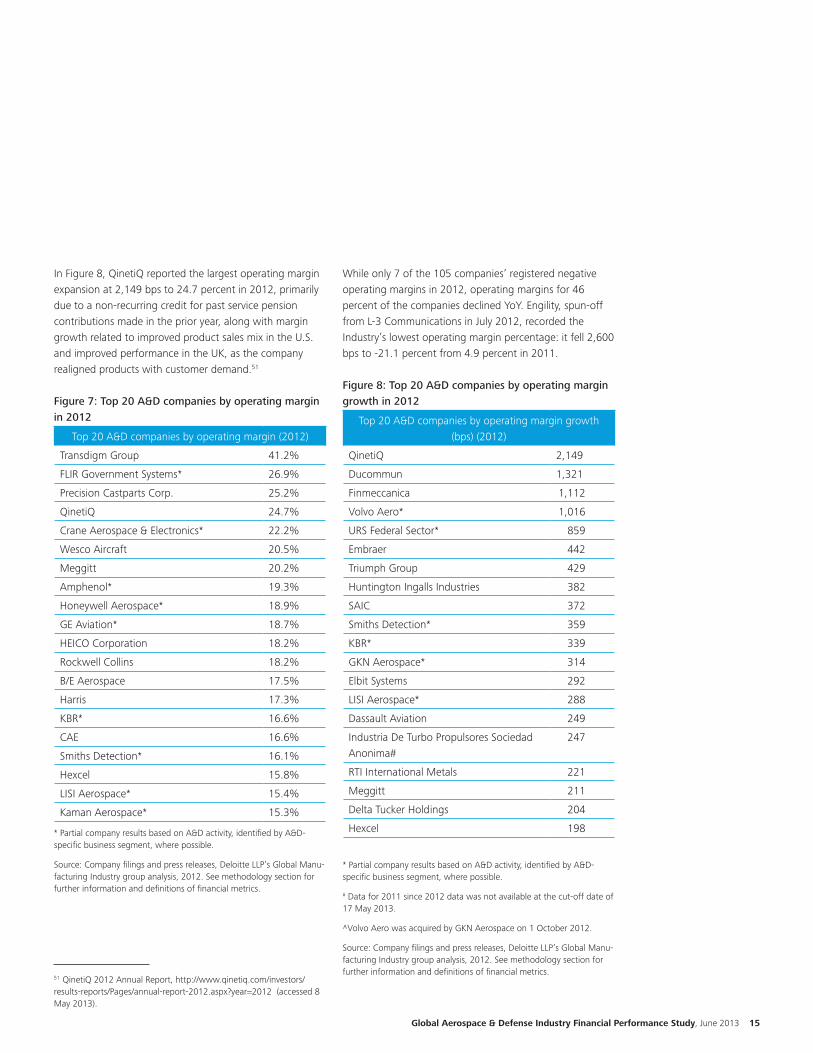
In Figure 8, QinetiQ reported the largest operating margin expansion at 2,149 bps to 24.7 percent in 2012, primarily due to a non-recurring credit for past service pension contributions made in the prior year, along with margin growth related to improved product sales mix in the U.S. and improved performance in the UK, as the company realigned products with customer demand.51
Figure 7: Top 20 A&D companies by operating margin in 2012
Top 20 A&D companies by operating margin (2012)
Transdigm Group 41.2%
FLIR Government Systems* 26.9%
Precision Castparts Corp. 25.2%
QinetiQ 24.7%
Crane Aerospace & Electronics* 22.2%
Wesco Aircraft 20.5%
Meggitt 20.2%
Amphenol* 19.3%
Honeywell Aerospace* 18.9%
GE Aviation* 18.7%
HEICO Corporation 18.2%
Rockwell Collins 18.2%
B/E Aerospace 17.5%
Harris 17.3%
KBR* 16.6%
CAE 16.6%
Smiths Detection* 16.1%
Hexcel 15.8%
LISI Aerospace* 15.4%
Kaman Aerospace* 15.3%
* Partial company results based on A&D activity, identified by A&D-specific business segment, where possible.
Source: Company filings and press releases, Deloitte LLP’s Global Manu-facturing Industry group analysis, 2012. See methodology section for further information and definitions of financial metrics.
51 QinetiQ 2012 Annual Report, http://www.qinetiq.com/investors/results-reports/Pages/annual-report-2012.aspx?year=2012 (accessed 8 May 2013).
While only 7 of the 105 companies’ registered negative operating margins in 2012, operating margins for 46 percent of the companies declined YoY. Engility, spun-off from L-3 Communications in July 2012, recorded the Industry’s lowest operating margin percentage: it fell 2,600 bps to -21.1 percent from 4.9 percent in 2011.
Figure 8: Top 20 A&D companies by operating margin growth in 2012
Top 20 A&D companies by operating margin growth (bps) (2012)
QinetiQ 2,149
Ducommun 1,321
Finmeccanica 1,112
Volvo Aero* 1,016
URS Federal Sector* 859
Embraer 442
Triumph Group 429
Huntington Ingalls Industries 382
SAIC 372
Smiths Detection* 359
KBR* 339
GKN Aerospace* 314
Elbit Systems 292
LISI Aerospace* 288
Dassault Aviation 249
Industria De Turbo Propulsores Sociedad Anonima#
247
RTI International Metals 221
Meggitt 211
Delta Tucker Holdings 204
Hexcel 198
* Partial company results based on A&D activity, identified by A&D-specific business segment, where possible.
# Data for 2011 since 2012 data was not available at the cut-off date of 17 May 2013.
^Volvo Aero was acquired by GKN Aerospace on 1 October 2012.
Source: Company filings and press releases, Deloitte LLP’s Global Manu-facturing Industry group analysis, 2012. See methodology section for further information and definitions of financial metrics.
16
As mentioned earlier, Engility’s operating margin was negatively impacted due to a non-recurring goodwill impairment charge of US$426 million resulting from a change in the company’s cost of capital as a stand-alone company.52
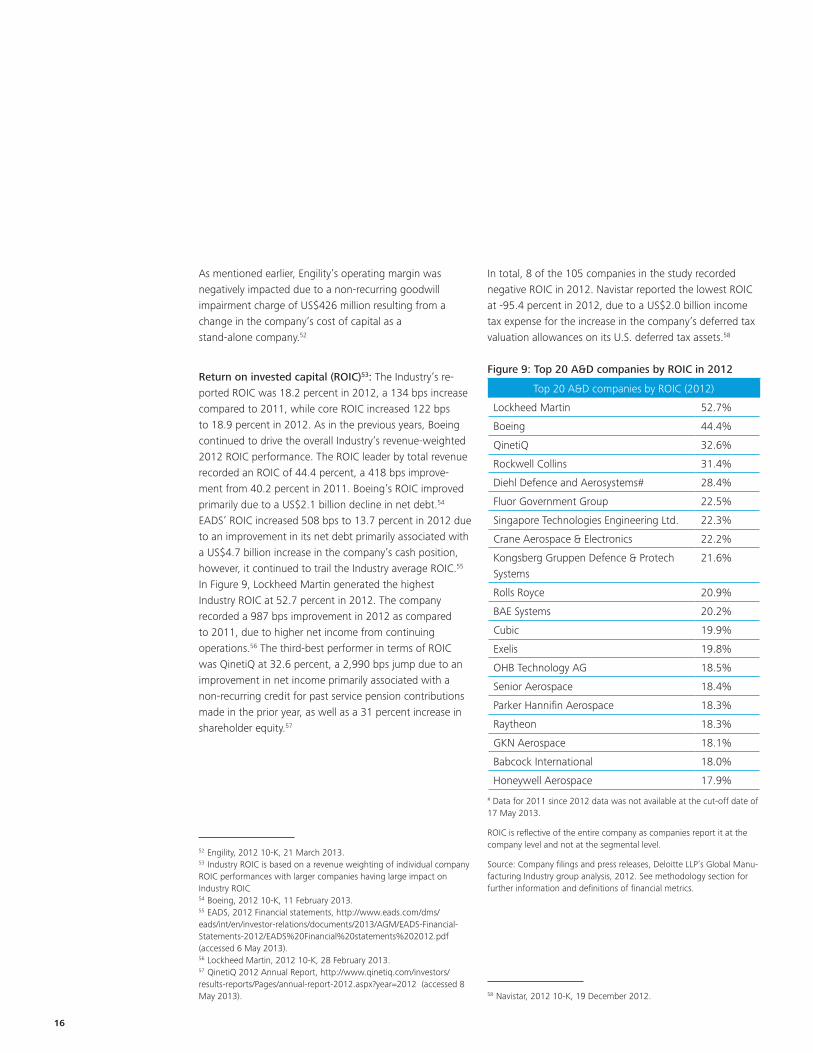
Return on invested capital (ROIC)53: The Industry’s re-ported ROIC was 18.2 percent in 2012, a 134 bps increase compared to 2011, while core ROIC increased 122 bps to 18.9 percent in 2012. As in the previous years, Boeing continued to drive the overall Industry’s revenue-weighted 2012 ROIC performance. The ROIC leader by total revenue recorded an ROIC of 44.4 percent, a 418 bps improve-ment from 40.2 percent in 2011. Boeing’s ROIC improved primarily due to a US$2.1 billion decline in net debt.54 EADS’ ROIC increased 508 bps to 13.7 percent in 2012 due to an improvement in its net debt primarily associated with a US$4.7 billion increase in the company’s cash position, however, it continued to trail the Industry average ROIC.55
In Figure 9, Lockheed Martin generated the highest Industry ROIC at 52.7 percent in 2012. The company recorded a 987 bps improvement in 2012 as compared to 2011, due to higher net income from continuing operations.56 The third-best performer in terms of ROIC was QinetiQ at 32.6 percent, a 2,990 bps jump due to an improvement in net income primarily associated with a non-recurring credit for past service pension contributions made in the prior year, as well as a 31 percent increase in shareholder equity.57
52 Engility, 2012 10-K, 21 March 2013.53 Industry ROIC is based on a revenue weighting of individual company ROIC performances with larger companies having large impact on Industry ROIC54 Boeing, 2012 10-K, 11 February 2013.55 EADS, 2012 Financial statements, http://www.eads.com/dms/eads/int/en/investor-relations/documents/2013/AGM/EADS-Financial-Statements-2012/EADS%20Financial%20statements%202012.pdf (accessed 6 May 2013).56 Lockheed Martin, 2012 10-K, 28 February 2013.57 QinetiQ 2012 Annual Report, http://www.qinetiq.com/investors/results-reports/Pages/annual-report-2012.aspx?year=2012 (accessed 8 May 2013).
In total, 8 of the 105 companies in the study recorded negative ROIC in 2012. Navistar reported the lowest ROIC at -95.4 percent in 2012, due to a US$2.0 billion income tax expense for the increase in the company’s deferred tax valuation allowances on its U.S. deferred tax assets.58
Figure 9: Top 20 A&D companies by ROIC in 2012
Top 20 A&D companies by ROIC (2012)
Lockheed Martin 52.7%
Boeing 44.4%
QinetiQ 32.6%
Rockwell Collins 31.4%
Diehl Defence and Aerosystems# 28.4%
Fluor Government Group 22.5%
Singapore Technologies Engineering Ltd. 22.3%
Crane Aerospace & Electronics 22.2%
Kongsberg Gruppen Defence & Protech Systems
21.6%
Rolls Royce 20.9%
BAE Systems 20.2%
Cubic 19.9%
Exelis 19.8%
OHB Technology AG 18.5%
Senior Aerospace 18.4%
Parker Hannifin Aerospace 18.3%
Raytheon 18.3%
GKN Aerospace 18.1%
Babcock International 18.0%
Honeywell Aerospace 17.9%
# Data for 2011 since 2012 data was not available at the cut-off date of 17 May 2013.
ROIC is reflective of the entire company as companies report it at the company level and not at the segmental level.
Source: Company filings and press releases, Deloitte LLP’s Global Manu-facturing Industry group analysis, 2012. See methodology section for further information and definitions of financial metrics.
58 Navistar, 2012 10-K, 19 December 2012.
Global Aerospace & Defense Industry Financial Performance Study, June 2013 17
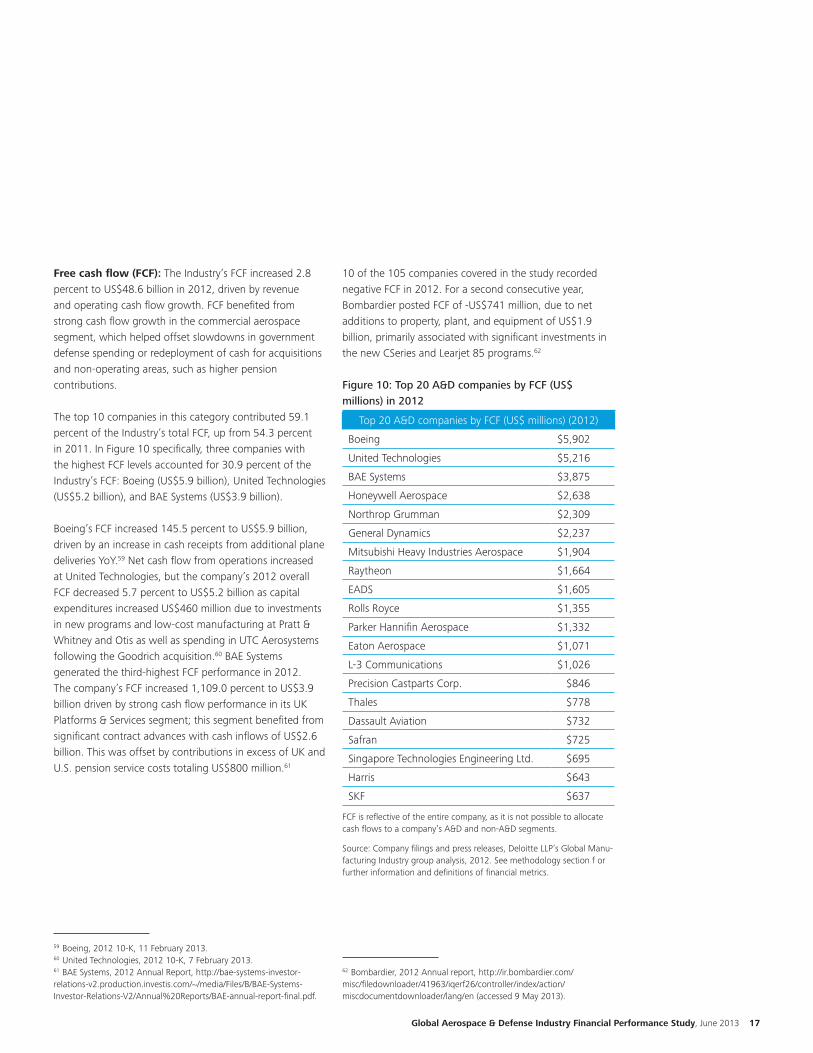
Free cash flow (FCF): The Industry’s FCF increased 2.8 percent to US$48.6 billion in 2012, driven by revenue and operating cash flow growth. FCF benefited from strong cash flow growth in the commercial aerospace segment, which helped offset slowdowns in government defense spending or redeployment of cash for acquisitions and non-operating areas, such as higher pension contributions.
The top 10 companies in this category contributed 59.1 percent of the Industry’s total FCF, up from 54.3 percent in 2011. In Figure 10 specifically, three companies with the highest FCF levels accounted for 30.9 percent of the Industry’s FCF: Boeing (US$5.9 billion), United Technologies (US$5.2 billion), and BAE Systems (US$3.9 billion).
Boeing’s FCF increased 145.5 percent to US$5.9 billion, driven by an increase in cash receipts from additional plane deliveries YoY.59 Net cash flow from operations increased at United Technologies, but the company’s 2012 overall FCF decreased 5.7 percent to US$5.2 billion as capital expenditures increased US$460 million due to investments in new programs and low-cost manufacturing at Pratt & Whitney and Otis as well as spending in UTC Aerosystems following the Goodrich acquisition.60 BAE Systems generated the third-highest FCF performance in 2012. The company’s FCF increased 1,109.0 percent to US$3.9 billion driven by strong cash flow performance in its UK Platforms & Services segment; this segment benefited from significant contract advances with cash inflows of US$2.6 billion. This was offset by contributions in excess of UK and U.S. pension service costs totaling US$800 million.61
59 Boeing, 2012 10-K, 11 February 2013.60 United Technologies, 2012 10-K, 7 February 2013.61 BAE Systems, 2012 Annual Report, http://bae-systems-investor-relations-v2.production.investis.com/~/media/Files/B/BAE-Systems-Investor-Relations-V2/Annual%20Reports/BAE-annual-report-final.pdf.
10 of the 105 companies covered in the study recorded negative FCF in 2012. For a second consecutive year, Bombardier posted FCF of -US$741 million, due to net additions to property, plant, and equipment of US$1.9 billion, primarily associated with significant investments in the new CSeries and Learjet 85 programs.62
Figure 10: Top 20 A&D companies by FCF (US$ millions) in 2012
Top 20 A&D companies by FCF (US$ millions) (2012)
Boeing $5,902
United Technologies $5,216
BAE Systems $3,875
Honeywell Aerospace $2,638
Northrop Grumman $2,309
General Dynamics $2,237
Mitsubishi Heavy Industries Aerospace $1,904
Raytheon $1,664
EADS $1,605
Rolls Royce $1,355
Parker Hannifin Aerospace $1,332
Eaton Aerospace $1,071
L-3 Communications $1,026
Precision Castparts Corp. $846
Thales $778
Dassault Aviation $732
Safran $725
Singapore Technologies Engineering Ltd. $695
Harris $643
SKF $637
FCF is reflective of the entire company, as it is not possible to allocate cash flows to a company’s A&D and non-A&D segments.
Source: Company filings and press releases, Deloitte LLP’s Global Manu-facturing Industry group analysis, 2012. See methodology section f or further information and definitions of financial metrics.
62 Bombardier, 2012 Annual report, http://ir.bombardier.com/misc/filedownloader/41963/iqerf26/controller/index/action/miscdocumentdownloader/lang/en (accessed 9 May 2013).
18
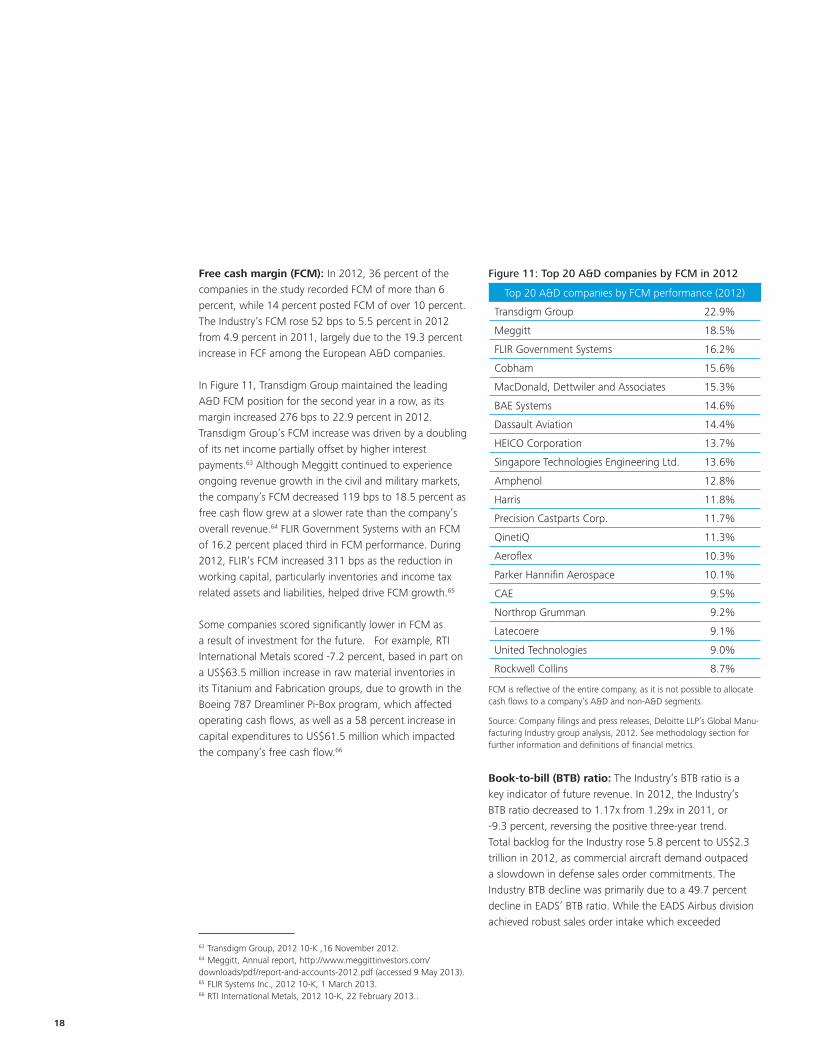
Free cash margin (FCM): In 2012, 36 percent of the companies in the study recorded FCM of more than 6 percent, while 14 percent posted FCM of over 10 percent. The Industry’s FCM rose 52 bps to 5.5 percent in 2012 from 4.9 percent in 2011, largely due to the 19.3 percent increase in FCF among the European A&D companies.
In Figure 11, Transdigm Group maintained the leading A&D FCM position for the second year in a row, as its margin increased 276 bps to 22.9 percent in 2012. Transdigm Group’s FCM increase was driven by a doubling of its net income partially offset by higher interest payments.63 Although Meggitt continued to experience ongoing revenue growth in the civil and military markets, the company’s FCM decreased 119 bps to 18.5 percent as free cash flow grew at a slower rate than the company’s overall revenue.64 FLIR Government Systems with an FCM of 16.2 percent placed third in FCM performance. During 2012, FLIR’s FCM increased 311 bps as the reduction in working capital, particularly inventories and income tax related assets and liabilities, helped drive FCM growth.65
Some companies scored significantly lower in FCM as a result of investment for the future. For example, RTI International Metals scored -7.2 percent, based in part on a US$63.5 million increase in raw material inventories in its Titanium and Fabrication groups, due to growth in the Boeing 787 Dreamliner Pi-Box program, which affected operating cash flows, as well as a 58 percent increase in capital expenditures to US$61.5 million which impacted the company’s free cash flow.66
63 Transdigm Group, 2012 10-K ,16 November 2012.64 Meggitt, Annual report, http://www.meggittinvestors.com/downloads/pdf/report-and-accounts-2012.pdf (accessed 9 May 2013).65 FLIR Systems Inc., 2012 10-K, 1 March 2013.66 RTI International Metals, 2012 10-K, 22 February 2013..
Figure 11: Top 20 A&D companies by FCM in 2012
Top 20 A&D companies by FCM performance (2012)
Transdigm Group 22.9%
Meggitt 18.5%
FLIR Government Systems 16.2%
Cobham 15.6%
MacDonald, Dettwiler and Associates 15.3%
BAE Systems 14.6%
Dassault Aviation 14.4%
HEICO Corporation 13.7%
Singapore Technologies Engineering Ltd. 13.6%
Amphenol 12.8%
Harris 11.8%
Precision Castparts Corp. 11.7%
QinetiQ 11.3%
Aeroflex 10.3%
Parker Hannifin Aerospace 10.1%
CAE 9.5%
Northrop Grumman 9.2%
Latecoere 9.1%
United Technologies 9.0%
Rockwell Collins 8.7%
FCM is reflective of the entire company, as it is not possible to allocate cash flows to a company’s A&D and non-A&D segments.
Source: Company filings and press releases, Deloitte LLP’s Global Manu-facturing Industry group analysis, 2012. See methodology section for further information and definitions of financial metrics.
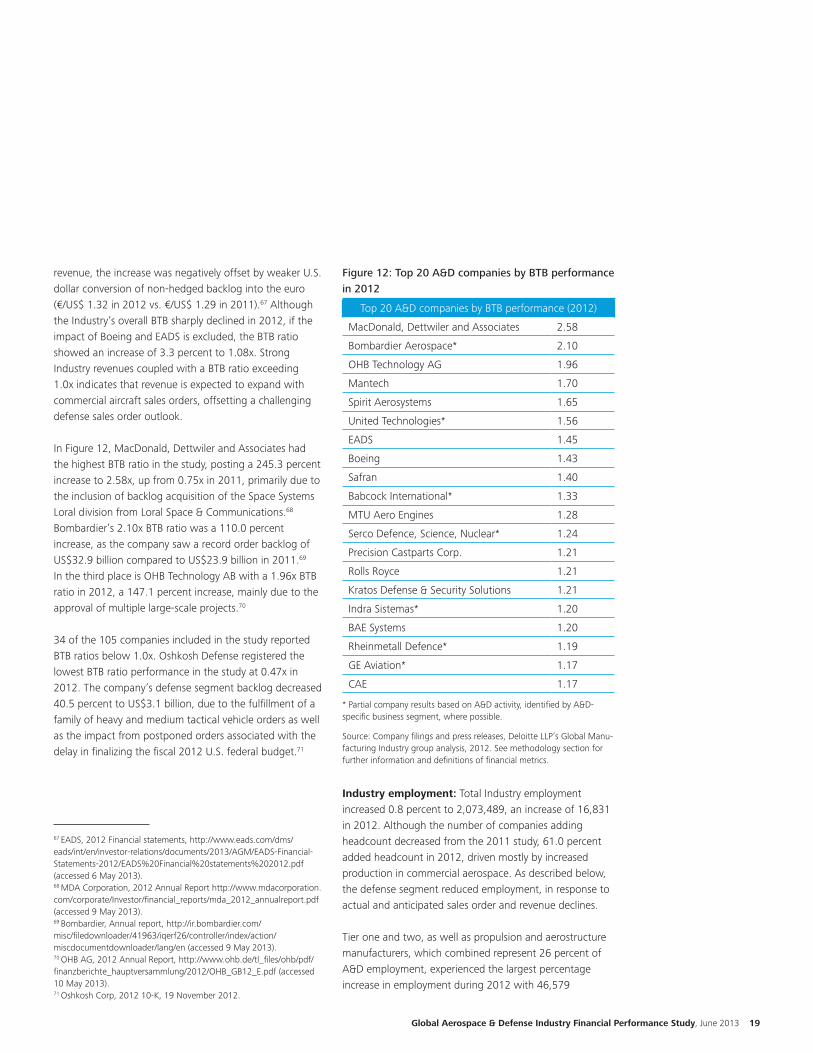
Book-to-bill (BTB) ratio: The Industry’s BTB ratio is a key indicator of future revenue. In 2012, the Industry’s BTB ratio decreased to 1.17x from 1.29x in 2011, or -9.3 percent, reversing the positive three-year trend. Total backlog for the Industry rose 5.8 percent to US$2.3 trillion in 2012, as commercial aircraft demand outpaced a slowdown in defense sales order commitments. The Industry BTB decline was primarily due to a 49.7 percent decline in EADS’ BTB ratio. While the EADS Airbus division achieved robust sales order intake which exceeded
Global Aerospace & Defense Industry Financial Performance Study, June 2013 19
revenue, the increase was negatively offset by weaker U.S. dollar conversion of non-hedged backlog into the euro (€/US$ 1.32 in 2012 vs. €/US$ 1.29 in 2011).67 Although the Industry’s overall BTB sharply declined in 2012, if the impact of Boeing and EADS is excluded, the BTB ratio showed an increase of 3.3 percent to 1.08x. Strong Industry revenues coupled with a BTB ratio exceeding 1.0x indicates that revenue is expected to expand with commercial aircraft sales orders, offsetting a challenging defense sales order outlook.
In Figure 12, MacDonald, Dettwiler and Associates had the highest BTB ratio in the study, posting a 245.3 percent increase to 2.58x, up from 0.75x in 2011, primarily due to the inclusion of backlog acquisition of the Space Systems Loral division from Loral Space & Communications.68 Bombardier’s 2.10x BTB ratio was a 110.0 percent increase, as the company saw a record order backlog of US$32.9 billion compared to US$23.9 billion in 2011.69 In the third place is OHB Technology AB with a 1.96x BTB ratio in 2012, a 147.1 percent increase, mainly due to the approval of multiple large-scale projects.70
34 of the 105 companies included in the study reported BTB ratios below 1.0x. Oshkosh Defense registered the lowest BTB ratio performance in the study at 0.47x in 2012. The company’s defense segment backlog decreased 40.5 percent to US$3.1 billion, due to the fulfillment of a family of heavy and medium tactical vehicle orders as well as the impact from postponed orders associated with the delay in finalizing the fiscal 2012 U.S. federal budget.71
67 EADS, 2012 Financial statements, http://www.eads.com/dms/eads/int/en/investor-relations/documents/2013/AGM/EADS-Financial-Statements-2012/EADS%20Financial%20statements%202012.pdf (accessed 6 May 2013).68 MDA Corporation, 2012 Annual Report http://www.mdacorporation.com/corporate/Investor/financial_reports/mda_2012_annualreport.pdf (accessed 9 May 2013).69 Bombardier, Annual report, http://ir.bombardier.com/misc/filedownloader/41963/iqerf26/controller/index/action/miscdocumentdownloader/lang/en (accessed 9 May 2013).70 OHB AG, 2012 Annual Report, http://www.ohb.de/tl_files/ohb/pdf/finanzberichte_hauptversammlung/2012/OHB_GB12_E.pdf (accessed 10 May 2013).71 Oshkosh Corp, 2012 10-K, 19 November 2012.
Figure 12: Top 20 A&D companies by BTB performance in 2012
Top 20 A&D companies by BTB performance (2012)
MacDonald, Dettwiler and Associates 2.58
Bombardier Aerospace* 2.10
OHB Technology AG 1.96
Mantech 1.70
Spirit Aerosystems 1.65
United Technologies* 1.56
EADS 1.45
Boeing 1.43
Safran 1.40
Babcock International* 1.33
MTU Aero Engines 1.28
Serco Defence, Science, Nuclear* 1.24
Precision Castparts Corp. 1.21
Rolls Royce 1.21
Kratos Defense & Security Solutions 1.21
Indra Sistemas* 1.20
BAE Systems 1.20
Rheinmetall Defence* 1.19
GE Aviation* 1.17
CAE 1.17
* Partial company results based on A&D activity, identified by A&D-specific business segment, where possible.
Source: Company filings and press releases, Deloitte LLP’s Global Manu-facturing Industry group analysis, 2012. See methodology section for further information and definitions of financial metrics.
Industry employment: Total Industry employment increased 0.8 percent to 2,073,489, an increase of 16,831 in 2012. Although the number of companies adding headcount decreased from the 2011 study, 61.0 percent added headcount in 2012, driven mostly by increased production in commercial aerospace. As described below, the defense segment reduced employment, in response to actual and anticipated sales order and revenue declines.
Tier one and two, as well as propulsion and aerostructure manufacturers, which combined represent 26 percent of A&D employment, experienced the largest percentage increase in employment during 2012 with 46,579
20
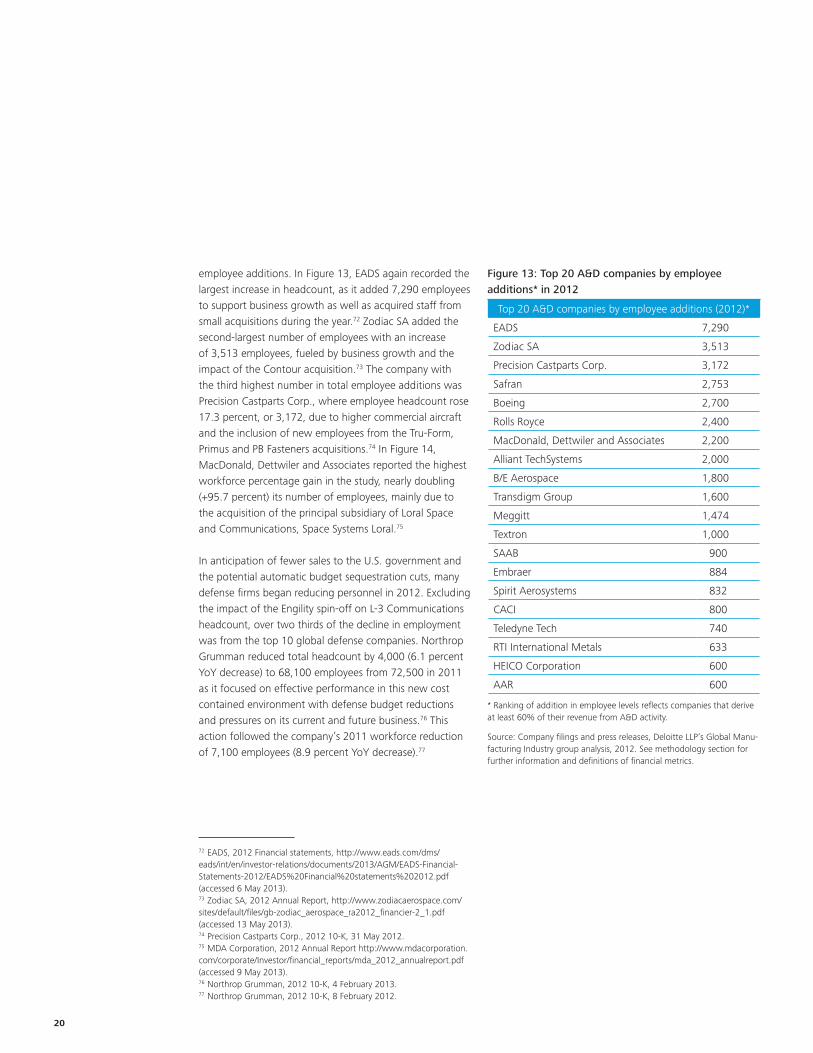
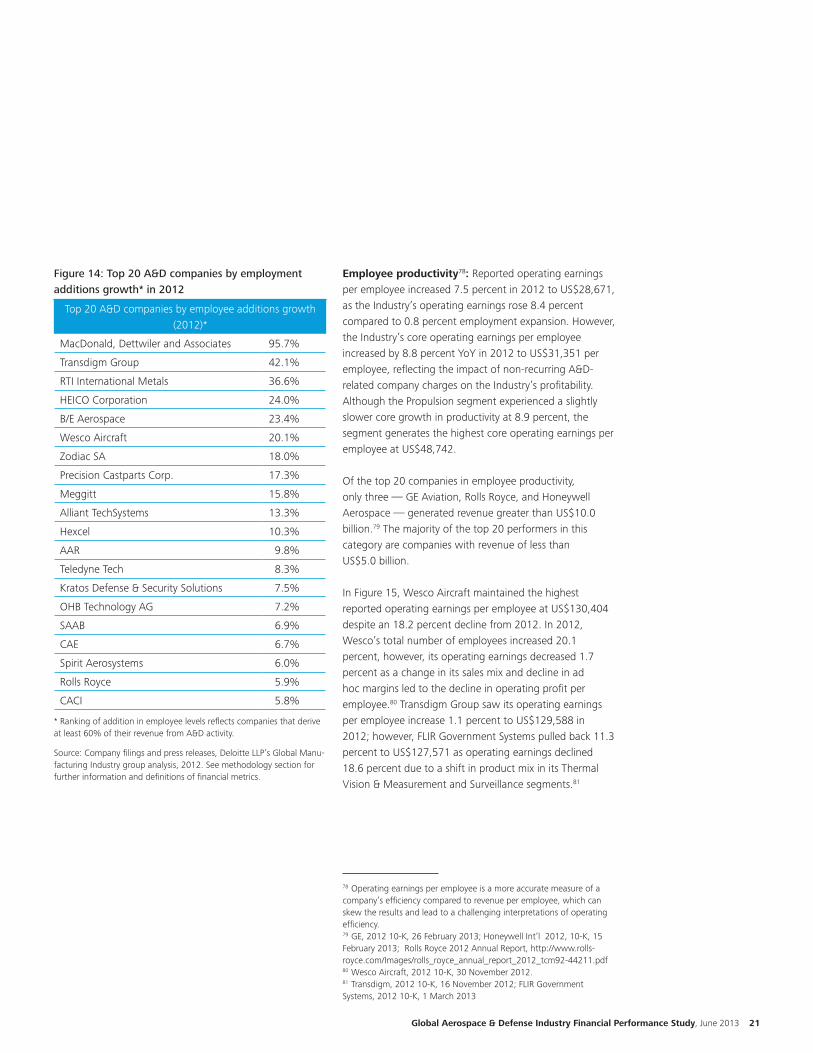
employee additions. In Figure 13, EADS again recorded the largest increase in headcount, as it added 7,290 employees to support business growth as well as acquired staff from small acquisitions during the year.72 Zodiac SA added the second-largest number of employees with an increase of 3,513 employees, fueled by business growth and the impact of the Contour acquisition.73 The company with the third highest number in total employee additions was Precision Castparts Corp., where employee headcount rose 17.3 percent, or 3,172, due to higher commercial aircraft and the inclusion of new employees from the Tru-Form, Primus and PB Fasteners acquisitions.74 In Figure 14, MacDonald, Dettwiler and Associates reported the highest workforce percentage gain in the study, nearly doubling (+95.7 percent) its number of employees, mainly due to the acquisition of the principal subsidiary of Loral Space and Communications, Space Systems Loral.75
In anticipation of fewer sales to the U.S. government and the potential automatic budget sequestration cuts, many defense firms began reducing personnel in 2012. Excluding the impact of the Engility spin-off on L-3 Communications headcount, over two thirds of the decline in employment was from the top 10 global defense companies. Northrop Grumman reduced total headcount by 4,000 (6.1 percent YoY decrease) to 68,100 employees from 72,500 in 2011 as it focused on effective performance in this new cost contained environment with defense budget reductions and pressures on its current and future business.76 This action followed the company’s 2011 workforce reduction of 7,100 employees (8.9 percent YoY decrease).77
72 EADS, 2012 Financial statements, http://www.eads.com/dms/eads/int/en/investor-relations/documents/2013/AGM/EADS-Financial-Statements-2012/EADS%20Financial%20statements%202012.pdf (accessed 6 May 2013).73 Zodiac SA, 2012 Annual Report, http://www.zodiacaerospace.com/sites/default/files/gb-zodiac_aerospace_ra2012_financier-2_1.pdf (accessed 13 May 2013).74 Precision Castparts Corp., 2012 10-K, 31 May 2012.75 MDA Corporation, 2012 Annual Report http://www.mdacorporation.com/corporate/Investor/financial_reports/mda_2012_annualreport.pdf (accessed 9 May 2013).76 Northrop Grumman, 2012 10-K, 4 February 2013.77 Northrop Grumman, 2012 10-K, 8 February 2012.
Figure 13: Top 20 A&D companies by employee additions* in 2012
Top 20 A&D companies by employee additions (2012)*
EADS 7,290
Zodiac SA 3,513
Precision Castparts Corp. 3,172
Safran 2,753
Boeing 2,700
Rolls Royce 2,400
MacDonald, Dettwiler and Associates 2,200
Alliant TechSystems 2,000
B/E Aerospace 1,800
Transdigm Group 1,600
Meggitt 1,474
Textron 1,000
SAAB 900
Embraer 884
Spirit Aerosystems 832
CACI 800
Teledyne Tech 740
RTI International Metals 633
HEICO Corporation 600
AAR 600
* Ranking of addition in employee levels reflects companies that derive at least 60% of their revenue from A&D activity.
Source: Company filings and press releases, Deloitte LLP’s Global Manu-facturing Industry group analysis, 2012. See methodology section for further information and definitions of financial metrics.
Global Aerospace & Defense Industry Financial Performance Study, June 2013 21
Figure 14: Top 20 A&D companies by employment additions growth* in 2012
Top 20 A&D companies by employee additions growth (2012)*
MacDonald, Dettwiler and Associates 95.7%
Transdigm Group 42.1%
RTI International Metals 36.6%
HEICO Corporation 24.0%
B/E Aerospace 23.4%
Wesco Aircraft 20.1%
Zodiac SA 18.0%
Precision Castparts Corp. 17.3%
Meggitt 15.8%
Alliant TechSystems 13.3%
Hexcel 10.3%
AAR 9.8%
Teledyne Tech 8.3%
Kratos Defense & Security Solutions 7.5%
OHB Technology AG 7.2%
SAAB 6.9%
CAE 6.7%
Spirit Aerosystems 6.0%
Rolls Royce 5.9%
CACI 5.8%
* Ranking of addition in employee levels reflects companies that derive at least 60% of their revenue from A&D activity.
Source: Company filings and press releases, Deloitte LLP’s Global Manu-facturing Industry group analysis, 2012. See methodology section for further information and definitions of financial metrics.
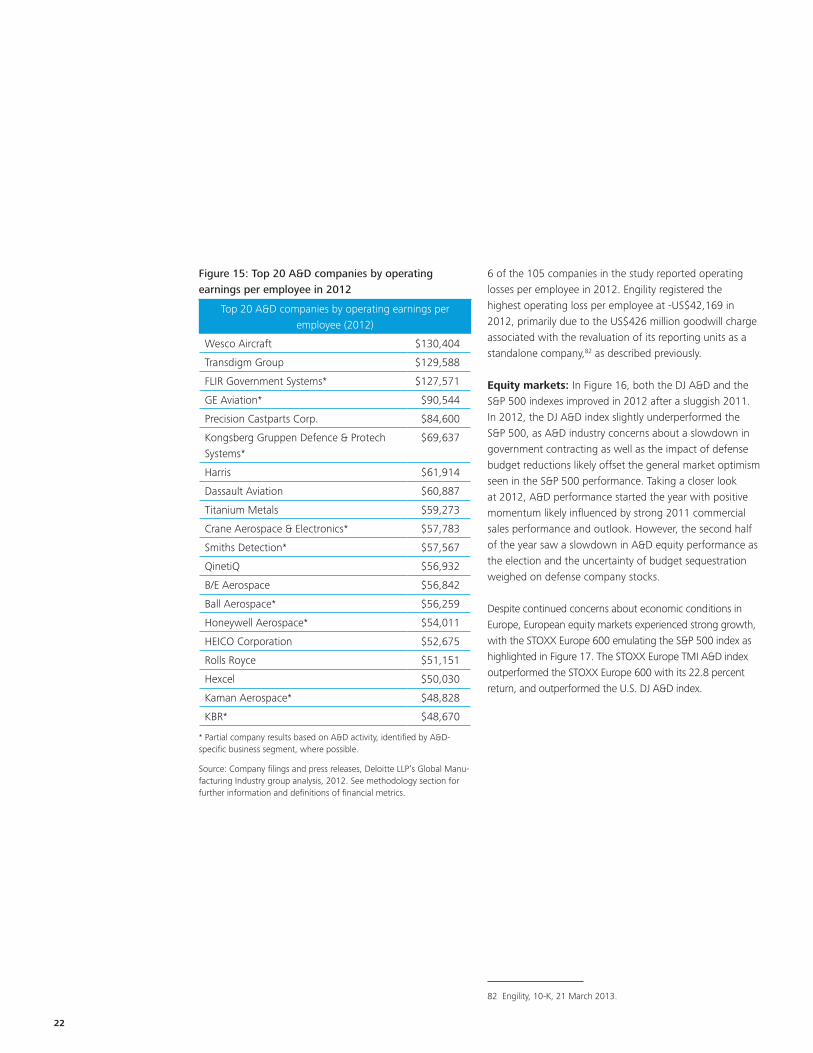
Employee productivity78: Reported operating earnings per employee increased 7.5 percent in 2012 to US$28,671, as the Industry’s operating earnings rose 8.4 percent compared to 0.8 percent employment expansion. However, the Industry’s core operating earnings per employee increased by 8.8 percent YoY in 2012 to US$31,351 per employee, reflecting the impact of non-recurring A&D- related company charges on the Industry’s profitability. Although the Propulsion segment experienced a slightly slower core growth in productivity at 8.9 percent, the segment generates the highest core operating earnings per employee at US$48,742.
Of the top 20 companies in employee productivity, only three — GE Aviation, Rolls Royce, and Honeywell Aerospace — generated revenue greater than US$10.0 billion.79 The majority of the top 20 performers in this category are companies with revenue of less than US$5.0 billion.
In Figure 15, Wesco Aircraft maintained the highest reported operating earnings per employee at US$130,404 despite an 18.2 percent decline from 2012. In 2012, Wesco’s total number of employees increased 20.1 percent, however, its operating earnings decreased 1.7 percent as a change in its sales mix and decline in ad hoc margins led to the decline in operating profit per employee.80 Transdigm Group saw its operating earnings per employee increase 1.1 percent to US$129,588 in 2012; however, FLIR Government Systems pulled back 11.3 percent to US$127,571 as operating earnings declined 18.6 percent due to a shift in product mix in its Thermal Vision & Measurement and Surveillance segments.81
78 Operating earnings per employee is a more accurate measure of a company’s efficiency compared to revenue per employee, which can skew the results and lead to a challenging interpretations of operating efficiency. 79 GE, 2012 10-K, 26 February 2013; Honeywell Int’l 2012, 10-K, 15 February 2013; Rolls Royce 2012 Annual Report, http://www.rolls-royce.com/Images/rolls_royce_annual_report_2012_tcm92-44211.pdf80 Wesco Aircraft, 2012 10-K, 30 November 2012.81 Transdigm, 2012 10-K, 16 November 2012; FLIR Government Systems, 2012 10-K, 1 March 2013
22
Figure 15: Top 20 A&D companies by operating earnings per employee in 2012
Top 20 A&D companies by operating earnings per employee (2012)
Wesco Aircraft $130,404
Transdigm Group $129,588
FLIR Government Systems* $127,571
GE Aviation* $90,544
Precision Castparts Corp. $84,600
Kongsberg Gruppen Defence & Protech Systems*
$69,637
Harris $61,914
Dassault Aviation $60,887
Titanium Metals $59,273
Crane Aerospace & Electronics* $57,783
Smiths Detection* $57,567
QinetiQ $56,932
B/E Aerospace $56,842
Ball Aerospace* $56,259
Honeywell Aerospace* $54,011
HEICO Corporation $52,675
Rolls Royce $51,151
Hexcel $50,030
Kaman Aerospace* $48,828
KBR* $48,670
* Partial company results based on A&D activity, identified by A&D-specific business segment, where possible.
Source: Company filings and press releases, Deloitte LLP’s Global Manu-facturing Industry group analysis, 2012. See methodology section for further information and definitions of financial metrics.
6 of the 105 companies in the study reported operating losses per employee in 2012. Engility registered the highest operating loss per employee at -US$42,169 in 2012, primarily due to the US$426 million goodwill charge associated with the revaluation of its reporting units as a standalone company,82 as described previously.
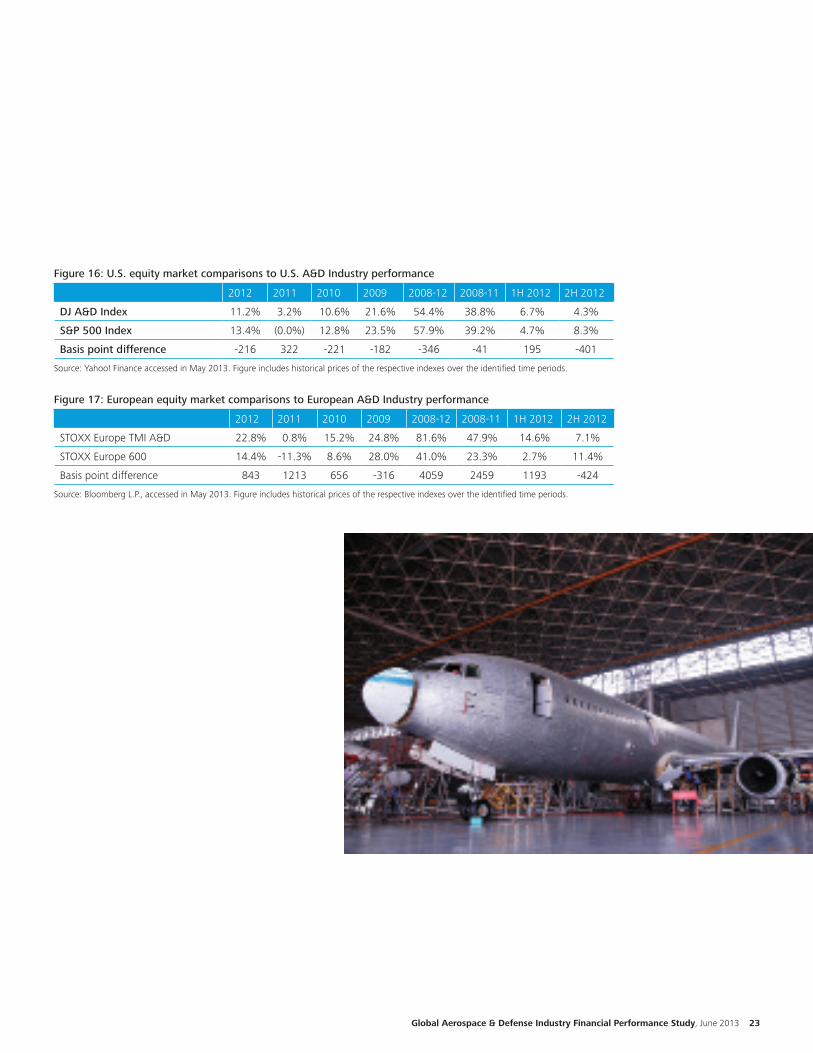
Equity markets: In Figure 16, both the DJ A&D and the S&P 500 indexes improved in 2012 after a sluggish 2011. In 2012, the DJ A&D index slightly underperformed the S&P 500, as A&D industry concerns about a slowdown in government contracting as well as the impact of defense budget reductions likely offset the general market optimism seen in the S&P 500 performance. Taking a closer look at 2012, A&D performance started the year with positive momentum likely influenced by strong 2011 commercial sales performance and outlook. However, the second half of the year saw a slowdown in A&D equity performance as the election and the uncertainty of budget sequestration weighed on defense company stocks.
Despite continued concerns about economic conditions in Europe, European equity markets experienced strong growth, with the STOXX Europe 600 emulating the S&P 500 index as highlighted in Figure 17. The STOXX Europe TMI A&D index outperformed the STOXX Europe 600 with its 22.8 percent return, and outperformed the U.S. DJ A&D index.
82 Engility, 10-K, 21 March 2013.
Global Aerospace & Defense Industry Financial Performance Study, June 2013 23
Figure 16: U.S. equity market comparisons to U.S. A&D Industry performance
2012 2011 2010 2009 2008-12 2008-11 1H 2012 2H 2012
DJ A&D Index 11.2% 3.2% 10.6% 21.6% 54.4% 38.8% 6.7% 4.3%
S&P 500 Index 13.4% (0.0%) 12.8% 23.5% 57.9% 39.2% 4.7% 8.3%
Basis point difference -216 322 -221 -182 -346 -41 195 -401
Source: Yahoo! Finance accessed in May 2013. Figure includes historical prices of the respective indexes over the identified time periods.
Figure 17: European equity market comparisons to European A&D Industry performance
2012 2011 2010 2009 2008-12 2008-11 1H 2012 2H 2012
STOXX Europe TMI A&D 22.8% 0.8% 15.2% 24.8% 81.6% 47.9% 14.6% 7.1%
STOXX Europe 600 14.4% -11.3% 8.6% 28.0% 41.0% 23.3% 2.7% 11.4%
Basis point difference 843 1213 656 -316 4059 2459 1193 -424
Source: Bloomberg L.P., accessed in May 2013. Figure includes historical prices of the respective indexes over the identified time periods.
24
Despite an uncertain global economy and an uncertain government spending outlook, both U.S. and European A&D companies experienced positive revenue growth and performance across most financial metrics. Following two years of underperformance, the pendulum swung back as European A&D companies’ performance outpaced that of U.S. A&D companies, across a majority of the financial performance categories.
As mentioned earlier, the following analysis of U.S. companies compared to European companies uses the constant conversion approach to eliminate the effect of foreign currency fluctuations from year to year.
Revenue: A&D companies headquartered in the U.S. accounted for 60.4 percent, or US$418.3 billion, of the global Industry’s US$692.5 billion revenue in 2012. European companies accounted for 32.9 percent, or US$228.1 billion, of the Industry revenue in 2012. Companies from Brazil, Canada, Israel, Japan, Singapore, and South Korea accounted for the remainder of the revenue reported in the study. However, it should be noted that many European and U.S. companies conduct operations, have employees, and indeed generate revenues in other countries.
U.S. companies’ revenue increased 5.1 percent, while European companies’ revenue grew 7.9 percent in 2012. The commercial aerospace segment drove all that growth and more both in Europe and the U.S., while defense companies recorded decreased revenue compared to their commercial counterparts.
In the U.S., total A&D revenue growth was led by Boeing, as discussed above, fueled by strong new airplane deliveries across all commercial airplane programs.83 United Technologies’ 2012 revenue increased 17.9 percent, primarily due to the inclusion of the Goodrich acquisition which comprised US$3.6 billion or 83 percent of the company’s A&D growth.84 GE Aviation continued to be a leading company in terms of revenue expansion, as revenue increased 6.0 percent, or US$1.1 billion, to US$20.0 billion due to increased commercial and military
83 Boeing, 2012 10-K, 11 February 2013.84 United Technologies, 2012 10-K, 7 February 2013.
engine sales and higher prices.85 Although two-thirds of the U.S. A&D companies generated cumulative revenue growth in 2012, the companies dependent on the U.S. government for business have felt the impact of slowing defense contracting. Northrop Grumman’s revenue continued to come under pressure, due to lower volumes in its Electronic Systems and Technical Services segments, and the gradual conclusion or termination of programs in the Information Systems segment.86
EADS contributed 31.9 percent of total European Industry revenue, as strong Airbus deliveries and the integration of the Vector Aerospace and Vizada businesses drove its services businesses.87 LISI Aerospace registered the highest total A&D revenue growth for the Industry benefiting from its 2011 acquisitions as discussed earlier.88 Safran generated the second-highest increase in nominal revenue growth, as revenue grew US$2.5 billion or 7.8 percent, supported by higher aerospace OEM volume, continued civil aftermarket sales growth, avionics-driven revenue growth in defense, coupled with increased activity in its Security segment.89 Comparatively, the European A&D companies in the study achieved positive revenue growth with only 22 percent, or 7 of the 32 companies recording negative revenue growth. Among the group, BAE Systems revenue decreased 6.5 percent or US$1.8 billion due to lower volumes in the Land & Armaments business and the absence of contracted Typhoon aircraft deliveries in the year.90
Operating earnings/Operating margin: Reported operating earnings for U.S. companies decreased 1.4 percent to US$42.0 billion. In addition, reported operating margin decreased 66 bps to 10.0 percent in 2012 as a
85 GE, 2012 10-K, 26 February 2013.86 Northrop Grumman, 2012 10-K, 4 February 2013.87 EADS, 2012 Financial statements, http://www.eads.com/dms/eads/int/en/investor-relations/documents/2013/AGM/EADS-Financial-Statements-2012/EADS%20Financial%20statements%202012.pdf (accessed 6 May 2013).88 LISI Group, 2012 Annual Report, http://www.lisi-group.com/telechargement/fr/2012/finance_fr_2012.pdf (accessed 13 May 2013).89 Safran, Registration document, http://www.safran-group.com/IMG/pdf/2012_Registration_Document-2.pdf (accessed 12 May 2013).90 BAE Systems, Annual report, http://bae-systems-investor-relations-v2.production.investis.com/~/media/Files/B/BAE-Systems-Investor-Relations-V2/Annual%20Reports/BAE-annual-report-final.pdf (accessed 12 May 2013).
U.S. versus European companies
Global Aerospace & Defense Industry Financial Performance Study, June 2013 25
number of U.S. companies recorded one-time A&D-related company charges totaling US$3.5 billion compared to US$1.7 billion in 2011. Excluding non-recurring A&D- related charges, the U.S. Industry’s core operating earnings grew 2.7 percent and core operating margin decreased by 25 bps in 2012.
As mentioned earlier, Boeing, Lockheed Martin and United Technologies generated the highest operating earnings among the U.S. A&D Industry. Another company that recorded a marked rise in operating profitability was Huntington Ingalls Industries with a 258.0 percent increase in operating earnings to $358.0 million in 2012. Huntington Ingalls Industries operating earnings increased due to the absence of a US$290 million goodwill impairment charge in its shipbuilding Ingalls segment from the prior year.91
In comparison, the European A&D Industry registered stronger operating earnings and margin growth compared to their U.S. counterparts. The 32 European A&D companies as a group rebounded in 2012 as operating earnings rose 49.7 percent to US$14.9 billion and reported operating margin increased 182 bps to 6.5 percent. In contrast to 2011, European A&D companies recorded lower non-recurring A&D-related company charges of US$1.9 billion in 2012 compared to US$2.7 billion in 2011.92 Excluding these one-time charges, the European Industry’s core operating earnings increased 32.6 percent to US$16.8 billion and core operating margin increased 137 bps to 7.4 percent in 2012.
BAE Systems generated the highest level of operating earnings at US$2.6 billion, an increase of 3.8 percent primarily due to a one-time US$164 million profit from the disposal of the US-based Safariland and other businesses.93 EADS’ operating earnings increased 50.4 percent to US$2.5 billion due to double-digit revenue growth fueled by the delivery of 588 aircraft, up from 534 in 2011 . Rolls
91 Huntington Ingalls Industries, 2012 10-K, 27 February 2013.92 EADS, 2012 Financial statements, http://www.eads.com/dms/eads/int/en/investor-relations/documents/2013/AGM/EADS-Financial-Statements-2012/EADS%20Financial%20statements%202012.pdf (accessed 6 May 2013).93 BAE Systems, 2012 Annual Report, http://bae-systems-investor-relations-v2.production.investis.com/~/media/Files/B/BAE-Systems-Investor-Relations-V2/Annual%20Reports/BAE-annual-report-final.pdf.
Royce recorded the third-highest operating earnings, up 15.8 percent to US$2.2 billion due to a strong 31 percent growth in civil aerospace and 12 percent growth in defence, better product mix, and unit cost reduction.94
Return on invested capital (ROIC): U.S. companies’ reported ROIC improved 50 bps to 21.9 percent in 2012. As mentioned earlier, Boeing, with a weighted-average contribution of 28.9 percent to the total U.S. group, had the highest ROIC.95 Additional companies that recorded significant ROIC growth were Lockheed Martin, 987 bps to 52.7 percent, and SAIC, 1,431 bps to 15.8 percent in 2012.
Similarly, European companies’ ROIC rose 385 bps to 13.0 percent in 2012 as the Industry reduced its net debt and increased its cash position. EADS’ ROIC leader on a weighted-revenue basis increased 508 bps to 13.7 percent in 2012.96 Additional ROIC leaders in Europe include QinetiQ at 32.6 percent and Diehl Defence and Aerosystems each at 28.4 percent.97 Despite improving YoY, only Finmeccanica recorded a negative ROIC in 2012, primarily due to a decline in shareholder equity.98
Free cash flow (FCF)/Free cash margin (FCM): Although the U.S. A&D Industry outperformed the European competitors in terms of FCF and FCM, the European competitors experienced a strong rebound in performance. The U.S. companies’ FCF was relatively flat at US$32.9 billion compared to a 19.3 percent increase in the European group’s FCF of US$13.0 billion. Similarly, the U.S. Industry’s FCM decreased 24 bps to 5.9 percent in contrast to the 167 bps improvement to 5.2 percent for
94 Rolls Royce 2012 Annual Report, http://www.rolls-royce.com/Images/rolls_royce_annual_report_2012_tcm92-44211.pdf95 Boeing, 2012 10-K, 11 February 2013.96 EADS, 2012 Financial statements, http://www.eads.com/dms/eads/int/en/investor-relations/documents/2013/AGM/EADS-Financial-Statements-2012/EADS%20Financial%20statements%202012.pdf (accessed 6 May 2013).97 QinetiQ 2012 Annual Report, http://www.qinetiq.com/investors/results-reports/Pages/annual-report-2012.aspx?year=2012 (accessed 8 May 2013); and Diehl Group, 2011 Annual Report, http://www.diehl.com/fileadmin/diehl-gruppe/upload/Annual_Report_2011.pdf (accessed 10 May 2013).98 Finmeccanica, Consolidated financial statements, http://www.finmeccanica.com/EN/Common/files/Corporate/Bilanci_Presentazioni/Bilanci_2013/BILANCIO_SPA_2012_ENG_finale.pdf (accessed 3 May 2013).
26
the European Industry. The jump in FCF of the European companies was mainly due to 1,109.0 percent increase in FCF at BAE Systems to US$3.9 billion, driven by strong cash flow performance in its UK Platforms & Services segment; this segment benefitted from significant contract advances, which increased cash inflows by US$2.6 billion.
Book-to-bill (BTB) ratio: Although Boeing’s backlog reached a record level of US$390.2 billion in 2012, its BTB ratio decreased 5.2 percent to 1.43x as the company generated more sales than growth in backlog.99 Excluding Boeing, the U.S. companies posted a BTB ratio of 1.06x, an improvement from past year’s 1.01x.
The European Industry’s 2012 BTB ratio decreased 28.3 percent to 1.23x, from 1.71x in 2011. Similar to the U.S. companies, European companies BTB performance was disproportionately affected by EADS (-49.7 percent to 1.45x in 2012).100 Excluding EADS, the European companies’ BTB ratio was 1.11x, or 3.8 percent below the overall group’s BTB ratio in 2012.
99 Boeing, 2012 10-K, 11 February 2013.100 EADS, 2012 Financial statements, http://www.eads.com/dms/eads/int/en/investor-relations/documents/2013/AGM/EADS-Financial-Statements-2012/EADS%20Financial%20statements%202012.pdf (accessed 6 May 2013).
Employment productivity: Overall Industry employment increased 0.8 percent in 2012 as compared to 2011. U.S. companies added 0.3 percent to their headcount to reach 1,270,122 (+3,806) in 2012, while European companies recorded a 1.0 percent increase to 658,379 (+6,445) in 2012. Employment in regions other than U.S. and Europe grew 4.9 percent to 145,090 in 2012.
U.S. companies’ reported operating earnings per employee continued to outpace European counterparts. Of the U.S. companies, 54.2 percent experienced positive operating earnings growth per employee in 2012 YoY, compared to 59.4 percent of European companies. Reported profit per employee decreased 1.7 percent to US$33,067 in the U.S. for 2012, compared to a 48.2 percent jump for the European companies to US$22,608. Core operating earnings per employee for U.S. companies rose 2.4 percent to US$35,851, while it increased 31.3 percent to US$25,541 for European companies.

Global Aerospace & Defense Industry Financial Performance Study, June 2013 27
Commercial versus Defense segment performance
While global A&D Industry revenue increased 5.9 percent, the commercial aerospace industry was the revenue driver that provided all the growth and more to offset the continued contraction in defense segment revenues. Continuing the previous year’s momentum, the commercial aerospace segment attained the highest production level in its history.101 Backlogs continue to grow as airlines update their fleets with new fuel-efficient aircraft in order to remain competitive and meet the increasing travel demands from emerging markets. Boeing forecasts 35,280 new aircraft will be produced from 2013 through 2032.102
Alternatively, global defense revenues decreased 1.3 percent in 2012,103 principally due to decreases in U.S.
101 Airbus Orders & Delivers, http://www.airbus.com/no_cache/company/market/orders-deliveries/ (accessed February 14, 2013); Boeing Orders & Deliveries, http://active.boeing.com/commercial/orders/index.cfm (accessed February 14, 2013)102 Boeing Current Market Outlook 2013-2032, http://www.boeing.com/assets/pdf/commercial/cmo/pdf/Boeing_Current_Market_Outlook_2013.pdf (accessed June 11, 2013)103 Deloitte LLP Global Aerospace & Defense Industry Financial Performance Study, June 2013. See the methodology section for further information and definitions of financial metrics related to the commercial versus defense calculations. Refer to Figure 18 in the report.
defense budgets where 39.1 percent of the global defense budget is spent, as well as European defense budget declines.104 This is the second consecutive year of global defense revenue declines with 2011 revenues decreasing 1.9 percent. The U.S. defense sector continues to be impacted by budget reductions of US$487 billion over 10 years, established under the Budget Control Act of 2011,105 as well as the additional $42 billion in annual budget reduction associated with the automatic “sequester” which took effect on March 1, 2013.106 However, sales by global defense companies to non-domestic markets offer some upside potential as certain geographies face increasing national security threats, although this is not expected to fill the revenue gap completely.
104 Stockholm International Peace Research Institute (SIPRI), SIPRI Military Expenditure Database - http://milexdata.sipri.org/files/?file=SIPRI+military+expenditure+database+1988-2012.xlsx (accessed May 28, 2013).105 Aerospace Industries Association, “The Real Defense Budget Challenges Lie Ahead,” 26 January 2012.106 “Automatic Reductions in Government Spending -- aka Sequestration”; Wendy Edelberg - CBO Assistant Director for Macroeconomic Analysis. http://www.cbo.gov/publication/43961 (accessed 17 May 2013).
Figure 18: 2012 Commercial aerospace versus defense performance comparison
Commercial aerospace Defense
2012 2011Change (2012 versus 2011)
2012 2011Change (2012 versus 2011)
Revenue (US$ billion)*
$275.1 $236.6 16.2% $324.1 $328.6 -1.3%
Operating earnings (US$ billion)
$25.1 $20.3 24.1% $28.1 $28.5 -1.6%
Operating margin
9.1% 8.6% 58 8.7% 8.7% -2
*Extrapolation of the Commercial Aerospace versus Defense performance of the Top 48 A&D companies. Combined figures reported in text may differ slightly to the sum of the rounded figures shown in the figures.
Source: Deloitte LLP’s Global Manufacturing Industry group analysis, 2012. See methodology section for further information and definitions of financial metrics.
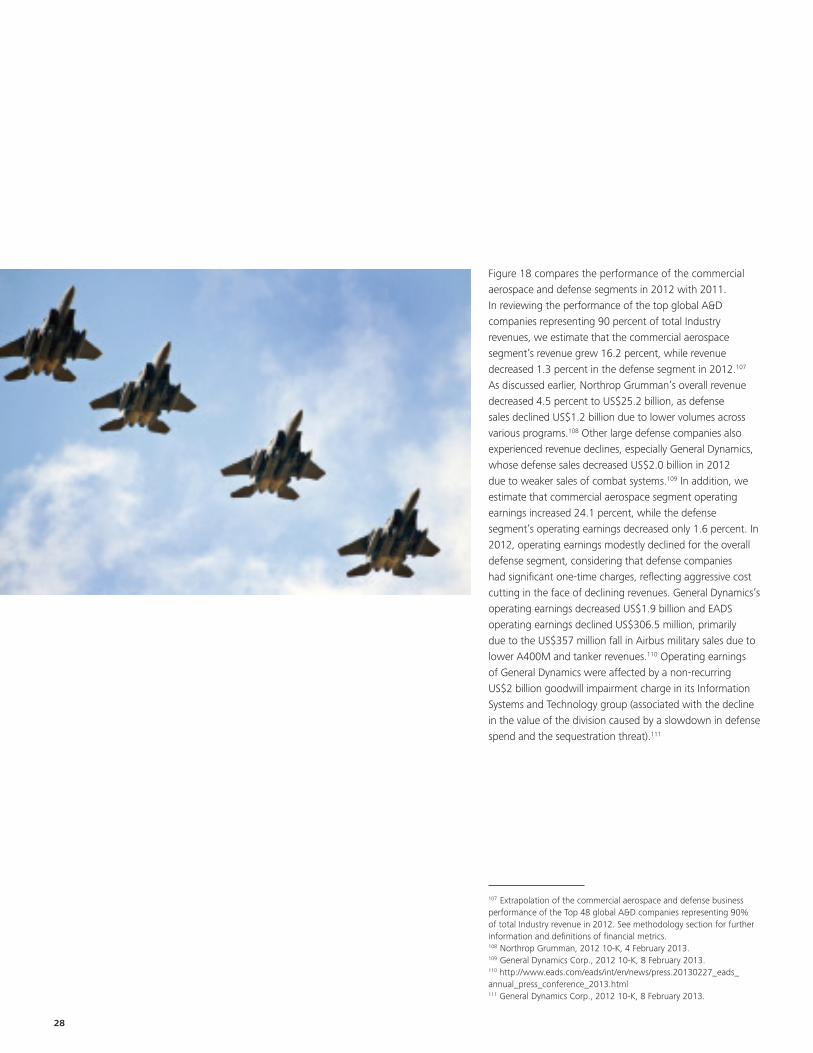
28
Figure 18 compares the performance of the commercial aerospace and defense segments in 2012 with 2011. In reviewing the performance of the top global A&D companies representing 90 percent of total Industry revenues, we estimate that the commercial aerospace segment’s revenue grew 16.2 percent, while revenue decreased 1.3 percent in the defense segment in 2012.107 As discussed earlier, Northrop Grumman’s overall revenue decreased 4.5 percent to US$25.2 billion, as defense sales declined US$1.2 billion due to lower volumes across various programs.108 Other large defense companies also experienced revenue declines, especially General Dynamics, whose defense sales decreased US$2.0 billion in 2012 due to weaker sales of combat systems.109 In addition, we estimate that commercial aerospace segment operating earnings increased 24.1 percent, while the defense segment’s operating earnings decreased only 1.6 percent. In 2012, operating earnings modestly declined for the overall defense segment, considering that defense companies had significant one-time charges, reflecting aggressive cost cutting in the face of declining revenues. General Dynamics’s operating earnings decreased US$1.9 billion and EADS operating earnings declined US$306.5 million, primarily due to the US$357 million fall in Airbus military sales due to lower A400M and tanker revenues.110 Operating earnings of General Dynamics were affected by a non-recurring US$2 billion goodwill impairment charge in its Information Systems and Technology group (associated with the decline in the value of the division caused by a slowdown in defense spend and the sequestration threat).111
107 Extrapolation of the commercial aerospace and defense business performance of the Top 48 global A&D companies representing 90% of total Industry revenue in 2012. See methodology section for further information and definitions of financial metrics.108 Northrop Grumman, 2012 10-K, 4 February 2013.109 General Dynamics Corp., 2012 10-K, 8 February 2013.110 http://www.eads.com/eads/int/en/news/press.20130227_eads_annual_press_conference_2013.html111 General Dynamics Corp., 2012 10-K, 8 February 2013.
Global Aerospace & Defense Industry Financial Performance Study, June 2013 29
Subsector performance
OEM and supplier companiesThe 2012 OEM subsector revenue reported in this year’s study increased 5.9 percent to US$364.0 billion, up from US$343.9 billion in 2011, in line with the Industry’s overall revenue growth of 5.9 percent (see Figures 21 and 23). Revenue declines in the defense sector companies reduced the growth average for the OEM group. However, revenue growth at the OEM industry leaders, Boeing and EADS, helped offset the defense related declines. Suppliers included in this study, excluding the Electronics segment, reported positive revenue growth that exceeded the Industry average. In Figure 19, the Tier one, two, and three suppliers generated double-digit revenue growth: Tier one: 14.4 percent; Tier two: 10.1; Tier three: 14.4 percent, together with Aerostructures: 8.9 percent and Propulsion: 10.5 percent. However, the Electronics (+1.8 percent) subsector underperformed the Industry revenue growth, likely due to a slowdown in defense contracting as well as the conclusion of support services associated with the Iraq and Afghanistan wars.
The OEM subsector’s reported operating earnings increased 4.9 percent to US$23.4 billion in 2012 from US$22.3 billion in 2011. OEM’s operating earnings underperformed the 8.4 percent increase in overall Industry earnings (see Figures 21 and 23). The underperformance was due to the impact of declining defense sales and US$4.3 billion in non-recurring charges primarily attributable to the US$2.3 billion in goodwill write-off at General Dynamics and US$1.6 billion in one-time charges at Finmeccanica.112 In Figure 20, OEM core operating earnings increased 10.6 percent in 2012, more than the Industry’s core average of 9.7 percent, the Tier three A&D supplier segment and the Electronics and Aerostructures segments. In contrast to its strong operating earnings growth of 9.9 percent, if the impact of non-recurring charges is excluded, Aerostructures’s core operating earnings declined 3.7 percent in 2012 (see Figure 20), largely due to the impact of a non-recurring gain associated with an insurance settlement at Spirit Aerosystems in 2012.113
112 General Dynamics Corp., 2012 10-K, 8 February 2013 and Finmeccanica, Consolidated financial statements, http://www.finmeccanica.com/EN/Common/files/Corporate/Bilanci_Presentazioni/Bilanci_2013/BILANCIO_SPA_2012_ENG_finale.pdf (accessed 3 May 2013).113 Spirit Aerosystems, 2012 10-K, 28 February 2013.
The Industry average reported operating margin increased 2.3 percent, or 20 bps to 8.6 percent, affected partially by the negative operating margin decline of the Tier three suppliers, which fell by 12.9 percent in 2012 (see Figure 19). The Industry’s core operating margin rose 3.6 percent, or 32 bps, to 9.4 percent in 2012, with the Propulsion segment generating the highest core operating margin increase of 46 bps to 12.4 percent (see figure 22). With reported operating margins of 6.4 percent, the OEMs were outperformed by most suppliers except the Aerostructures’s segment at 4.9 percent. Tier two suppliers generated the highest reported and core operating margin among the Industry subsectors at 16.2 percent and 16.4 percent, respectively, (see Figure 21 and 22) largely due to strong operating margin at Transdigm Group, FLIR Government Systems, and Precision Castparts Corp. in 2012.
In Figure 19, reported ROIC performance for the OEM subsector rose 14.7 percent, or 300 bps (293 bps core), in 2012, higher than reported Industry average growth of 7.9 percent, or 134 bps (122 bps core). Propulsion and Electronics suppliers also showed improved reported ROIC growth of 7.0 percent or 96 bps (92 bps core) and 2.9 percent or 42 bps (31 bps core), respectively, offset by a 25.0 percent or 473 bps (457 bps core) decrease in Tier one suppliers reported ROIC growth in 2012 (see Figure 19).
OEMs’ total FCF increased 19.9 percent to US$18.1 billion in 2012 from US$15.1 billion in 2011, as compared to the Industry’s FCF increase of 2.8 percent (see Figures 19, 21 and 23). The OEM group recorded a 31.5 percent increase in FCM growth compared to a 10.5 percent increase for the overall Industry (see Figure 19). Lower OEM FCFs were largely attributed to Lockheed Martin, General Dynamics, and SAAB. The Aerostructures subsector posted the highest FCM growth among the Industry subsectors, with a growth of 128.1 percent (see Figure 19). Latecore and Ducommun were large contributors to the Aerostructures subsector FCM performance.
30
The OEMs’ average BTB ratio in 2012 was 1.20x versus 1.17x for the Industry. In Figure 19, the BTB ratio for OEMs decreased 14.8 percent in 2012, as compared to the average Industry decrease of 9.3 percent. Boeing’s and EADS’ impact on the BTB ratio for the subsector was significant given the relatively high-revenue weighting and strong individual BTB performance improvement of these two companies. Tier one suppliers achieved a 49.6 percent BTB ratio growth in 2012 (see Figure 19), the highest percentage increase among the subsectors due to a rise in bookings at United Technologies; the company also benefitted from the additional backlog associated with the Goodrich acquisition.114
Services focused companiesServices companies’ reported revenue decreased 1.2 percent to US$58.3 billion (see Figures 19 and 21), underperforming the total Industry growth of 5.9 percent. Defense-related services companies, – URS Federal Sector, CSC, and Fluor Government Group – accounting for 20 percent of the segment’s revenue, posted revenue declines in 2012. In particular, government services companies tend to be “people” focused businesses, charging labor hours, which are highly competitive, and typically result in lower margins. In contrast to the last two years, services companies registered higher reported operating earnings growth than the reported Industry average, 15.3 percent versus 8.4 percent for the Industry (see Figure 19), mainly due to operating earnings growth of QinetiQ (563.6 percent) and SAIC (145.5 percent).
Reported ROIC growth for the services subsector was -8.6 percent in 2012 compared to the Industry average of 7.9 percent (see Figure 19) as companies such as CSC and Engility reported negative ROIC of -54.9 percent and -29.6 percent, respectively. Services FCF declined 24.9 percent to US$3.9 billion in 2012 compared to US$5.2 million in 2011 (see Figures 21 and 23). Similar to other metrics, the BTB ratio for the services sector also declined to 1.01x in 2012 compared to 1.07x in 2011, and was significantly below the overall Industry ratio of 1.17x in 2012.
114 United Technologies, 2012 10-K, 7 February 2013.
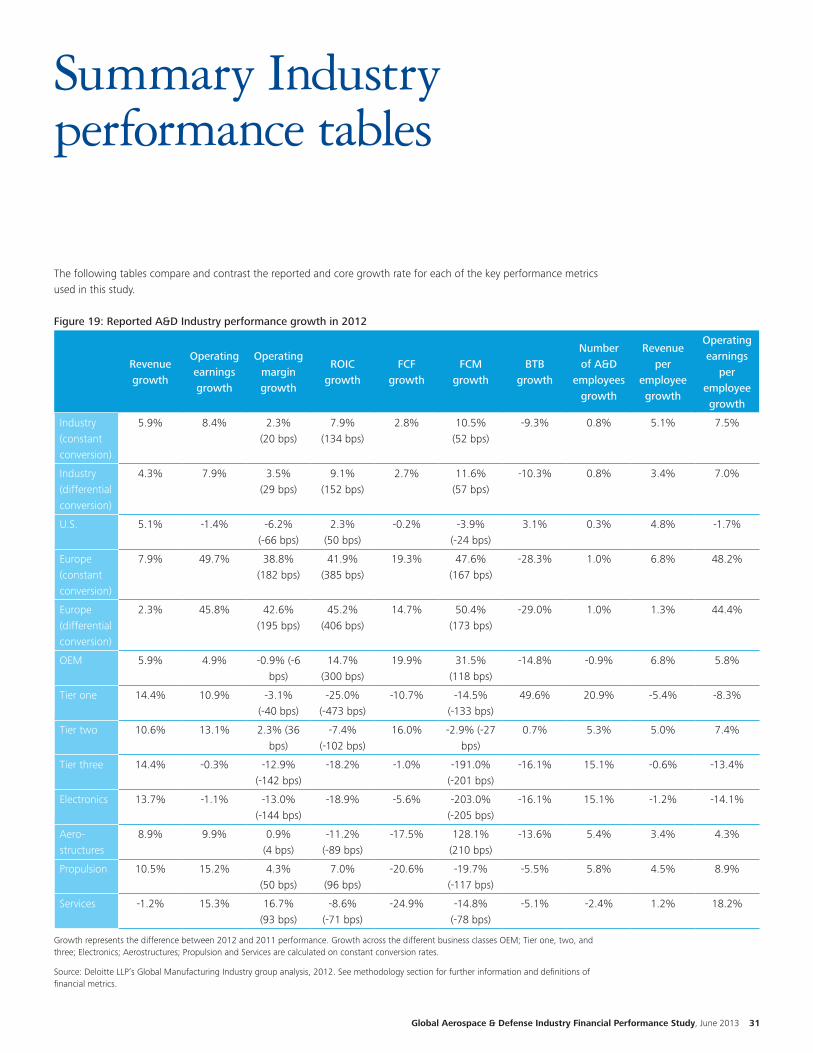
Global Aerospace & Defense Industry Financial Performance Study, June 2013 31
Summary Industry performance tables
The following tables compare and contrast the reported and core growth rate for each of the key performance metrics used in this study.
Figure 19: Reported A&D Industry performance growth in 2012
Revenue growth
Operating earnings growth
Operating margin growth
ROIC growth
FCF growth
FCM growth
BTB growth
Number of A&D
employees growth
Revenue per
employee growth
Operating earnings
per employee growth
Industry (constant conversion)
5.9% 8.4% 2.3% (20 bps)
7.9% (134 bps)
2.8% 10.5% (52 bps)
-9.3% 0.8% 5.1% 7.5%
Industry (differential conversion)
4.3% 7.9% 3.5% (29 bps)
9.1% (152 bps)
2.7% 11.6% (57 bps)
-10.3% 0.8% 3.4% 7.0%
U.S. 5.1% -1.4% -6.2% (-66 bps)
2.3% (50 bps)
-0.2% -3.9% (-24 bps)
3.1% 0.3% 4.8% -1.7%
Europe (constant conversion)
7.9% 49.7% 38.8% (182 bps)
41.9% (385 bps)
19.3% 47.6% (167 bps)
-28.3% 1.0% 6.8% 48.2%
Europe (differential conversion)
2.3% 45.8% 42.6% (195 bps)
45.2% (406 bps)
14.7% 50.4% (173 bps)
-29.0% 1.0% 1.3% 44.4%
OEM 5.9% 4.9% -0.9% (-6 bps)
14.7% (300 bps)
19.9% 31.5% (118 bps)
-14.8% -0.9% 6.8% 5.8%
Tier one 14.4% 10.9% -3.1% (-40 bps)
-25.0% (-473 bps)
-10.7% -14.5% (-133 bps)
49.6% 20.9% -5.4% -8.3%
Tier two 10.6% 13.1% 2.3% (36 bps)
-7.4% (-102 bps)
16.0% -2.9% (-27 bps)
0.7% 5.3% 5.0% 7.4%
Tier three 14.4% -0.3% -12.9% (-142 bps)
-18.2% -1.0% -191.0% (-201 bps)
-16.1% 15.1% -0.6% -13.4%
Electronics 13.7% -1.1% -13.0% (-144 bps)
-18.9% -5.6% -203.0% (-205 bps)
-16.1% 15.1% -1.2% -14.1%
Aero- structures
8.9% 9.9% 0.9% (4 bps)
-11.2% (-89 bps)
-17.5% 128.1% (210 bps)
-13.6% 5.4% 3.4% 4.3%
Propulsion 10.5% 15.2% 4.3% (50 bps)
7.0% (96 bps)
-20.6% -19.7% (-117 bps)
-5.5% 5.8% 4.5% 8.9%
Services -1.2% 15.3% 16.7% (93 bps)
-8.6% (-71 bps)
-24.9% -14.8% (-78 bps)
-5.1% -2.4% 1.2% 18.2%
Growth represents the difference between 2012 and 2011 performance. Growth across the different business classes OEM; Tier one, two, and three; Electronics; Aerostructures; Propulsion and Services are calculated on constant conversion rates.
Source: Deloitte LLP’s Global Manufacturing Industry group analysis, 2012. See methodology section for further information and definitions of financial metrics.
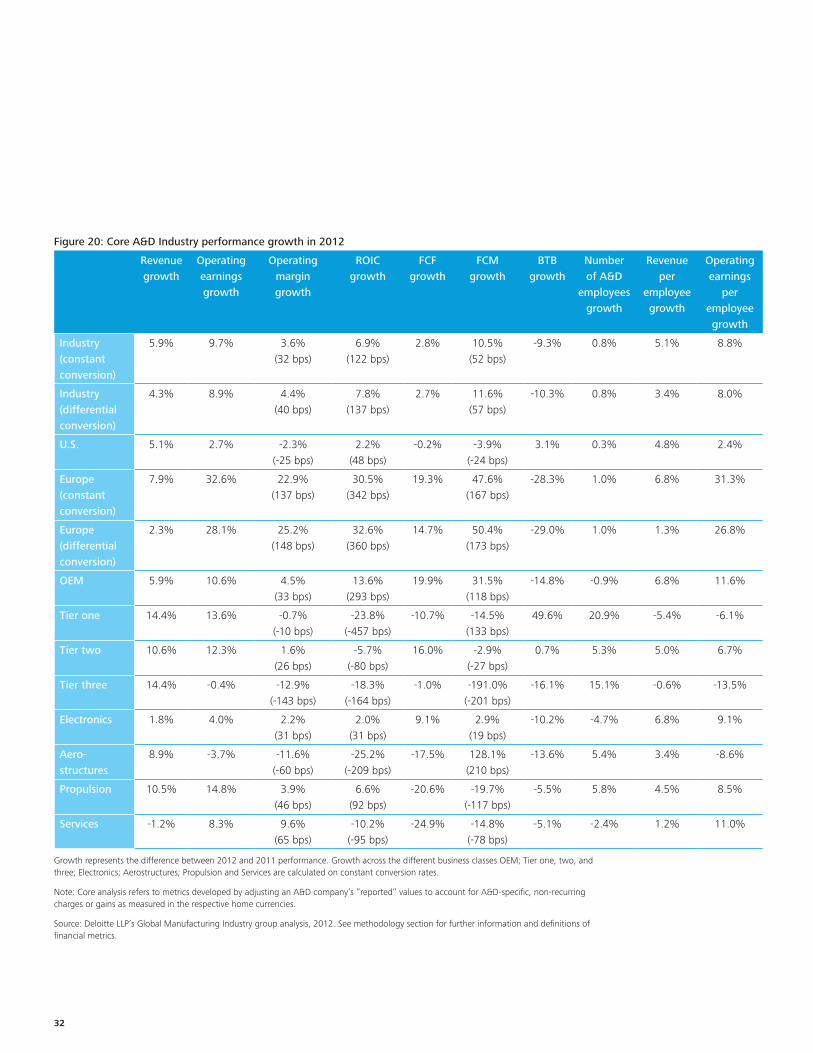
32
Figure 20: Core A&D Industry performance growth in 2012
Revenue growth
Operating earnings growth
Operating margin growth
ROIC growth
FCF growth
FCM growth
BTB growth
Number of A&D
employees growth
Revenue per
employee growth
Operating earnings
per employee growth
Industry (constant conversion)
5.9% 9.7% 3.6% (32 bps)
6.9% (122 bps)
2.8% 10.5% (52 bps)
-9.3% 0.8% 5.1% 8.8%
Industry (differential conversion)
4.3% 8.9% 4.4% (40 bps)
7.8% (137 bps)
2.7% 11.6% (57 bps)
-10.3% 0.8% 3.4% 8.0%
U.S. 5.1% 2.7% -2.3% (-25 bps)
2.2% (48 bps)
-0.2% -3.9% (-24 bps)
3.1% 0.3% 4.8% 2.4%
Europe (constant conversion)
7.9% 32.6% 22.9% (137 bps)
30.5% (342 bps)
19.3% 47.6% (167 bps)
-28.3% 1.0% 6.8% 31.3%
Europe (differential conversion)
2.3% 28.1% 25.2% (148 bps)
32.6% (360 bps)
14.7% 50.4% (173 bps)
-29.0% 1.0% 1.3% 26.8%
OEM 5.9% 10.6% 4.5% (33 bps)
13.6% (293 bps)
19.9% 31.5% (118 bps)
-14.8% -0.9% 6.8% 11.6%
Tier one 14.4% 13.6% -0.7% (-10 bps)
-23.8% (-457 bps)
-10.7% -14.5% (133 bps)
49.6% 20.9% -5.4% -6.1%
Tier two 10.6% 12.3% 1.6% (26 bps)
-5.7% (-80 bps)
16.0% -2.9% (-27 bps)
0.7% 5.3% 5.0% 6.7%
Tier three 14.4% -0.4% -12.9% (-143 bps)
-18.3% (-164 bps)
-1.0% -191.0% (-201 bps)
-16.1% 15.1% -0.6% -13.5%
Electronics 1.8% 4.0% 2.2% (31 bps)
2.0% (31 bps)
9.1% 2.9% (19 bps)
-10.2% -4.7% 6.8% 9.1%
Aero- structures
8.9% -3.7% -11.6% (-60 bps)
-25.2% (-209 bps)
-17.5% 128.1% (210 bps)
-13.6% 5.4% 3.4% -8.6%
Propulsion 10.5% 14.8% 3.9% (46 bps)
6.6% (92 bps)
-20.6% -19.7% (-117 bps)
-5.5% 5.8% 4.5% 8.5%
Services -1.2% 8.3% 9.6% (65 bps)
-10.2% (-95 bps)
-24.9% -14.8% (-78 bps)
-5.1% -2.4% 1.2% 11.0%
Growth represents the difference between 2012 and 2011 performance. Growth across the different business classes OEM; Tier one, two, and three; Electronics; Aerostructures; Propulsion and Services are calculated on constant conversion rates.
Note: Core analysis refers to metrics developed by adjusting an A&D company’s “reported” values to account for A&D-specific, non-recurring charges or gains as measured in the respective home currencies.
Source: Deloitte LLP’s Global Manufacturing Industry group analysis, 2012. See methodology section for further information and definitions of financial metrics.

Global Aerospace & Defense Industry Financial Performance Study, June 2013 33
Figure 21: Reported A&D Industry performance in 2012
Reported A&D Industry performance 2012
Revenue (US$
million)
Operating earnings
(US$ million)
Operating margin %
ROIC % FCF (US$ million)
FCM % BTB ratio Number of A&D
employees
A&D Revenue/ employee
(US$)
A&D Operating earnings/ employee
(US$)
Industry $692,400 $59,449 8.6% 18.2% $48,551 5.5% 1.17 2,073,489 $333,930 $28,671
U.S. $418,333 $41,999 10.0% 21.9% $32,825 5.9% 1.13 1,270,122 $329,365 $33,067
Europe $228,124 $14,885 6.5% 13.0% $12,977 5.2% 1.23 658,379 $346,494 $22,608
OEM $364,028 $23,423 6.4% 23.4% $18,080 4.9% 1.20 931,542 $390,780 $25,144
Tier one $39,681 $5,088 12.8% 14.2% $5,753 7.9% 1.44 152,762 $259,756 $33,309
Tier two $37,395 $6,061 16.2% 12.8% $6,594 9.0% 1.09 140,128 $266,865 $43,255
Tier three $4,007 $385 9.6% 7.4% $507 -3.1% 0.96 11,371 $352,394 $33,827
Electronics $94,511 $11,281 11.9% 14.9% $8,218 6.8% 0.99 329,043 $287,231 $34,284
Aero- structures
$28,699 $1,417 4.9% 7.0% $3,438 3.7% 1.22 79,528 $360,865 $17,813
Propulsion $65,762 $8,021 12.2% 14.6% $2,026 4.8% 1.24 164,569 $399,603 $48,742
Services $58,317 $3,773 6.5% 7.6% $3,935 4.5% 1.01 264,547 $220,441 $14,263
Source: Deloitte LLP’s Global Manufacturing Industry group analysis, 2012. See methodology section for further information and definitions of financial metrics.
Figure 22: Core Industry performance in 2012
Reported A&D Industry performance 2012
Revenue (US$
million)
Operating earnings
(US$ million)
Operating margin %
ROIC % FCF (US$ million)
FCM % BTB ratio Number of A&D
employees
A&D Revenue/ employee
(US$)
A&D Operating earnings/ employee
(US$)
Industry $692,400 $65,007 9.4% 18.9% $48,551 5.5% 1.17 2,073,489 $333,930 $31,351
U.S. $418,333 $45,536 10.9% 22.2% $32,825 5.9% 1.13 1,270,122 $329,365 $35,851
Europe $228,124 $16,816 7.4% 14.7% $12,977 5.2% 1.23 658,379 $346,494 $25,541
OEM $364,028 $27,708 7.6% 24.4% $18,080 4.9% 1.20 931,542 $390,780 $29,744
Tier one $39,681 $5,382 13.6% 14.6% $5,753 7.9% 1.44 152,762 $259,756 $35,230
Tier two $37,395 $6,128 16.4% 13.2% $6,594 9.0% 1.09 140,128 $266,865 $43,730
Tier three $4,007 $385 9.6% 7.4% $507 -3.1% 0.96 11,371 $352,394 $33,834
Electronics $94,511 $11,631 12.3% 15.5% $8,218 6.8% 0.99 329,043 $287,231 $35,347
Aero- structures
$28,699 $1,316 4.6% 6.2% $3,438 3.7% 1.22 79,528 $360,865 $16,551
Propulsion $65,762 $8,131 12.4% 14.9% $2,026 4.8% 1.24 164,569 $399,603 $49,407
Services $58,317 $4,327 7.4% 8.3% $3,935 4.5% 1.01 264,547 $220,441 $16,357
Source: Deloitte LLP’s Global Manufacturing Industry group analysis, 2012. See methodology section for further information and definitions of financial metrics.
Note: Core analysis refers to metrics developed by adjusting an A&D company’s “reported” values to account for A&D-specific, non-recurring charges or gains as measured in the respective home currencies.
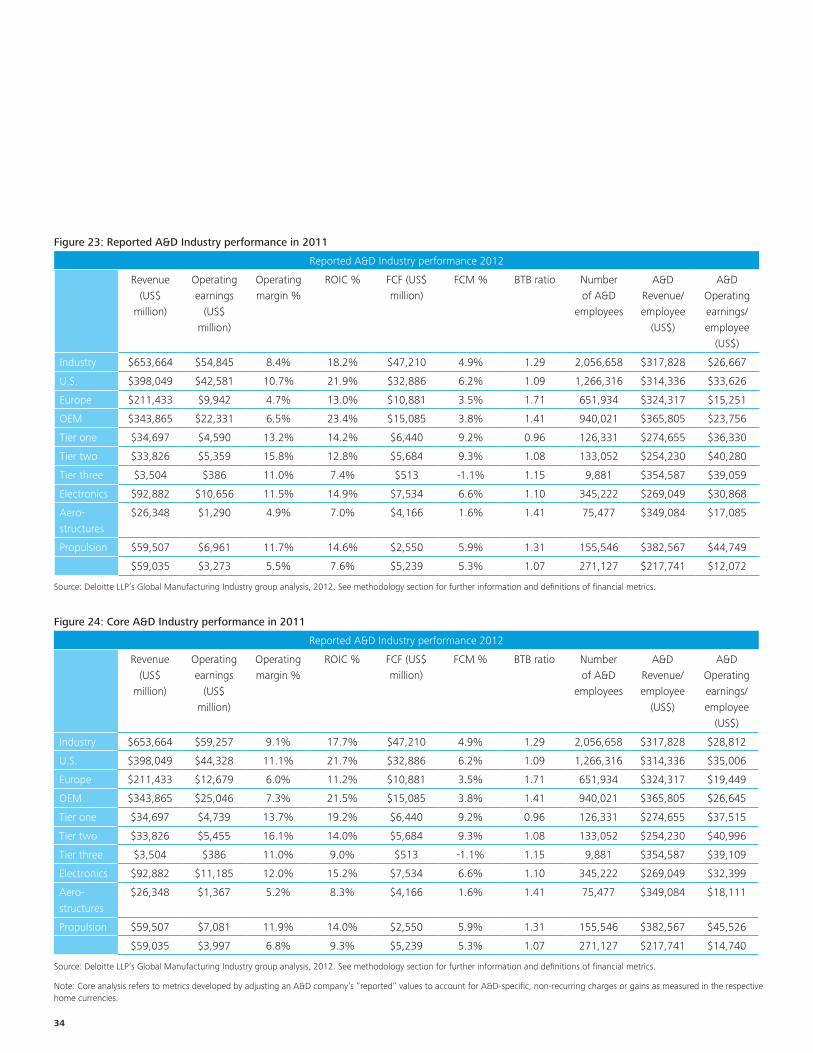
34
Figure 23: Reported A&D Industry performance in 2011
Reported A&D Industry performance 2012
Revenue (US$
million)
Operating earnings
(US$ million)
Operating margin %
ROIC % FCF (US$ million)
FCM % BTB ratio Number of A&D
employees
A&D Revenue/ employee
(US$)
A&D Operating earnings/ employee
(US$)
Industry $653,664 $54,845 8.4% 18.2% $47,210 4.9% 1.29 2,056,658 $317,828 $26,667
U.S. $398,049 $42,581 10.7% 21.9% $32,886 6.2% 1.09 1,266,316 $314,336 $33,626
Europe $211,433 $9,942 4.7% 13.0% $10,881 3.5% 1.71 651,934 $324,317 $15,251
OEM $343,865 $22,331 6.5% 23.4% $15,085 3.8% 1.41 940,021 $365,805 $23,756
Tier one $34,697 $4,590 13.2% 14.2% $6,440 9.2% 0.96 126,331 $274,655 $36,330
Tier two $33,826 $5,359 15.8% 12.8% $5,684 9.3% 1.08 133,052 $254,230 $40,280
Tier three $3,504 $386 11.0% 7.4% $513 -1.1% 1.15 9,881 $354,587 $39,059
Electronics $92,882 $10,656 11.5% 14.9% $7,534 6.6% 1.10 345,222 $269,049 $30,868
Aero- structures
$26,348 $1,290 4.9% 7.0% $4,166 1.6% 1.41 75,477 $349,084 $17,085
Propulsion $59,507 $6,961 11.7% 14.6% $2,550 5.9% 1.31 155,546 $382,567 $44,749
$59,035 $3,273 5.5% 7.6% $5,239 5.3% 1.07 271,127 $217,741 $12,072
Source: Deloitte LLP’s Global Manufacturing Industry group analysis, 2012. See methodology section for further information and definitions of financial metrics.
Figure 24: Core A&D Industry performance in 2011
Reported A&D Industry performance 2012
Revenue (US$
million)
Operating earnings
(US$ million)
Operating margin %
ROIC % FCF (US$ million)
FCM % BTB ratio Number of A&D
employees
A&D Revenue/ employee
(US$)
A&D Operating earnings/ employee
(US$)
Industry $653,664 $59,257 9.1% 17.7% $47,210 4.9% 1.29 2,056,658 $317,828 $28,812
U.S. $398,049 $44,328 11.1% 21.7% $32,886 6.2% 1.09 1,266,316 $314,336 $35,006
Europe $211,433 $12,679 6.0% 11.2% $10,881 3.5% 1.71 651,934 $324,317 $19,449
OEM $343,865 $25,046 7.3% 21.5% $15,085 3.8% 1.41 940,021 $365,805 $26,645
Tier one $34,697 $4,739 13.7% 19.2% $6,440 9.2% 0.96 126,331 $274,655 $37,515
Tier two $33,826 $5,455 16.1% 14.0% $5,684 9.3% 1.08 133,052 $254,230 $40,996
Tier three $3,504 $386 11.0% 9.0% $513 -1.1% 1.15 9,881 $354,587 $39,109
Electronics $92,882 $11,185 12.0% 15.2% $7,534 6.6% 1.10 345,222 $269,049 $32,399
Aero- structures
$26,348 $1,367 5.2% 8.3% $4,166 1.6% 1.41 75,477 $349,084 $18,111
Propulsion $59,507 $7,081 11.9% 14.0% $2,550 5.9% 1.31 155,546 $382,567 $45,526
$59,035 $3,997 6.8% 9.3% $5,239 5.3% 1.07 271,127 $217,741 $14,740
Source: Deloitte LLP’s Global Manufacturing Industry group analysis, 2012. See methodology section for further information and definitions of financial metrics.
Note: Core analysis refers to metrics developed by adjusting an A&D company’s “reported” values to account for A&D-specific, non-recurring charges or gains as measured in the respective home currencies.

Global Aerospace & Defense Industry Financial Performance Study, June 2013 35
36
This study is based on the key financial performance metrics for 105 global A&D companies or segments of industrial conglomerates with A&D businesses which generated A&D revenue greater than US$500 million in 2012. By using the data from the companies’ respective 10-Ks, annual reports, and other official financial releases into the calculation framework, Deloitte LLP analyzed the Industry’s performance in 2012. The study used audited results for all companies, except three companies for which unaudited data was used as the audited results of such companies were not available until after the cut-off date (17th May 2013) for the final stage of data collection and analysis. The study highlighted specific companies that had a positive or negative impact on the Industry’s performance and also analyzed categorical performance on the basis of business types and geographic identifications. The presentation of the companies’ 2012 financial performance data is based on the companies’ respective 2012 fiscal year (ending between 1st February 2012 and 31st January 2013), unless otherwise identified in the methodology. Similar treatment applies to the presentation of the companies’ 2011 financial performance data. In 2011, Bombardier changed its fiscal year from February 2010 - January 2011 to January 2011 - December 2011. So Bombardier’s fiscal year ending December 2011 comprises 11 months of Bombardier Aerospace results. The study took four companies 2011 data as 2012 results as their financial results were not available by the 17 May 2013 cut-off date.
Where metrics were referenced as “reported”, the analysis included metrics using the standard methodology discussed below. Where it was referred to metrics as “core”, the analysis included metrics by adjusting their “reported” values to account for A&D-specific non-recurring charges or gains as measured in the respective home currencies. In the study, “charges” is an umbrella term to reflect non-recurring program-related A&D related write-offs (such as cancellations, terminations), restructuring charges, asset impairment charges, acquisition-related expenses, loss on disposal of businesses, and litigation charges. Similarly, “gains” is an umbrella term to reflect non-recurring business disposal-related gains, pension curtailment gains, insurance settlements, etc. The treatment for calculating core performance across the affected metrics (operating earnings, operating margin, operating earnings/employee, and ROIC) is detailed below.
Certain companies were excluded from the analysis including government controlled entities; private companies that do not release public filings, or public companies that do not report A&D segment information. Additionally, certain companies from the previous year’s study were excluded due to conformance with study criteria; i.e., lower threshold of US$500 million in revenues, companies that were acquired, companies going private. The estimated cumulative 2012 A&D revenue of these excluded companies was estimated to be US$63.3 billion.
All data in this study is presented in U.S. dollar currency. Approximately 44 percent of the 105 companies under analysis in this study are headquartered in countries other than the United States. For such companies, the study applied a dual foreign currency conversion method to calculate Industry aggregate figures in U.S. dollar. On the one hand, the study applied the appropriate fiscal year end conversion rate to a non-U.S. company’s “static” data such as backlogs. On the other hand, for “flow” data, such as revenue and earnings, a 365-day daily average conversion rate was applied corresponding to the company’s fiscal year. Embraer, Elbit Systems, BBA Aviation, and Bombardier Aerospace are four non-U.S. companies that report financials in U.S. dollars. The study used the standard constant approach to eliminate the effect of significant currency fluctuations from year to year. Where the study explicitly refers to the growth rate of a non-U.S. company’s “flow” data, such as revenue, the growth rate stated is based on home currency data values, so as to assess the pure performance of the company and mitigate the impact of currency conversions.
In the commercial versus defense segment section, the study compares and contrasts the performance of the top 48 global A&D companies that constituted about 90 percent of the global industry’s revenue in 2012. Revenues, operating earnings, and operating margins have been calculated for commercial and defense businesses of these companies.
Most of the companies provided their commercial versus defense revenues. However, there were only a few companies which explicitly stated commercial versus defense operating earnings; in absence of explicit detail, the study used the commercial and defense percentage of revenue as a proxy to estimate the respective operating earnings. Also, most companies published information around their current commercial versus defense splits. However, for Elbit Systems, the study used the commercial versus defense split for 2011 from Defense Top News as a proxy due to lack of information in their releases.
1. Industry revenue:• To calculate the A&D revenue for a company, we determined the
percentage of revenue associated with A&D activities. In calculating this percentage, the study first checked to see if the company explicitly stated an A&D revenue figure. In such a case, the study used that explicitly stated percentage directly. If the percentage was not explicitly stated, the company’s various business segments or end-markets were analyzed and considered only those which were related to A&D in estimating the revenue percentage.
Study methodology

Global Aerospace & Defense Industry Financial Performance Study, June 2013 37
• Once A&D revenue percentages were assigned to the companies, the study put them into two categories: those companies that derived less than 60 percent of their respective revenue from A&D and those companies that derived equal to or greater than 60 percent of their respective revenue from A&D. If a company derived less than 60 percent of its revenue from A&D, the study included only the revenue generated by the A&D part. However, if the company derived equal to or greater than 60 percent of its revenue from A&D, the analysis used total revenue for the company.
• Precision Castparts Corp., Babcock International, and MOOG are the only companies in the study which changed to the greater than 60 percent revenue category in 2012. Precision Castparts Corp.’s revenue increased to over 60 percent so the entire company revenue was used. Conversely, for Babcock International and MOOG, the A&D revenue was more than 60 percent in 2011; however it fell below 60 percent in 2012. The study used the revenue from the A&D segments for 2012 and 2011 to ensure a fair comparison of its performance in both of the years for both the companies.
• In determining Industry revenue, the study calculated a summation of the revenue of the constituent 105 companies.For Loral Space & Communications Ltd., the study has used the revenue from discontinued operations, since the company divested its A&D business (the satellite manufacturing business – Space Systems Loral), in November 2012. The study uses the revenue performance data for the first ten months of 2012 and 2011.
• GKN group acquired Volvo’s Aero business in October 2012, so Volvo has reported revenues for Volvo Aero for first nine months of 2012. The study uses the revenue performance data for the first nine months of 2012 and 2011.
• Precision Castparts Corp. acquired Titanium Metals in January 2013, so revenue for Titanium Metals is represented on a rolling four quarters basis – from 4Q 2011 to 3Q 2012 and 4Q2010 to 3Q2011.
2. Operating earnings/margin:• In calculating the A&D operating earnings, the study
took a two-pronged approach (same as above), which states that if a company derived less than 60 percent of its revenue from A&D, the analysis factored only the operating earnings clearly associated with the A&D part. However, if the company derived equal to or more than 60 percent of its revenue from A&D, the study took the total operating earnings for the company.
• In the cases of companies: Alleghany Technologies. Amphenol, Babcock International, Curtiss Wright, Diehl Defense and Aerosystems, GKN Aerospace, Indra Sistemas, Jacobs Engineering Group, MOOG, Navistar, Serco Defense, Science and Nuclear, SKF, United Technologies, and URS Federal Sector (these companies derive less than 60 percent of their respective revenues from A&D), it was not possible to clearly assign operating earnings to the A&D part. In these cases, the companies’ respective A&D operating earnings were derived by multiplying the companies’ respective A&D revenue by the companies’ respective total operating earnings.
• The study examined the operating earnings as stated, if reported by the company. If the operating earnings were not published by the company, it was calculated as:
– Operating earnings = Sales – Cost of goods sold – SG&A expenses – R&D expenses – Restructuring/acquisition costs – Impairments/amortizations.
• Core operating earnings/margin for a company is calculated by adding back the company’s A&D-related charges or subtracting the non-recurring A&D-related gains in home currencies to the reported operating earnings of the company for 2011 and 2012, as applicable. In cases where the companies do not clearly assign charges/gains to their A&D businesses, the study estimated that the company’s A&D-related charges/gains as a percentage of total company charges/gains could be the same as the company’s A&D revenue percentage of total revenue. This was done for companies: United Technologies, Kratos Defense & Security, Bombardier Aerospace, Babcock International among other companies.

38
• The companies’ respective A&D operating margins were calculated by dividing their respective A&D operating earnings by their respective A&D revenues.
• Operating earnings for the Industry (reported and core) is a summation of operating earnings of the constituent companies.
• Operating margin for the Industry (reported and core) was calculated as the total Industry operating earnings as a percentage of total Industry revenue.
• For Loral Space & Communications Ltd., the study has used operating earnings from discontinued operations, since the company divested its A&D business (the satellite manufacturing business – Loral SS/L), in November 2012. The operating earnings are for the first ten months of 2012.
• GKN group acquired Volvo’s Aero business in October 2012, so Volvo has reported operating income for Volvo Aero for first nine months of 2012.
• Precision Castparts Corp. acquired Titanium Metals in January 2013, so revenue for Titanium Metals is represented on a rolling four quarters basis – from 4Q 2011 to 3Q 2012.
3. ROIC:• ROIC was calculated for the entire company, as
companies report it at the company level and not at the segmental level.
• ROIC was calculated based on component values in home currencies to eliminate the impact of currency conversion.
• The study took the ROIC value as stated, if reported by the company. GE, GKN, General Dynamics, Kawasaki Heavy Industries, BBA Aviation and Babcock International, published their ROIC values and the same were incorporated into the study. GE states that ROIC excluding GECS (General Electric Capital Services). The study analyzed GE’s ROIC excluding GECS, as inclusion of GECS could have had a distorting effect on GE’s ROIC performance.
• If the ROIC value was not published by the company, it was calculated as:
– ROIC = (Net operating earnings after tax)/(average shareholder equity + average net financial debt).
• Net operating earnings after tax (NOPAT) is calculated as:
– NOPAT = Net income from continuing operations + ((1– country’s prevailing tax rate)*(non-operating expenses)).
• A company’s 2012 average shareholder equity is calculated as the simple averages of its 2012 and 2011 fiscal year end shareholder equity values. A company’s 2011 average shareholder equity is calculated as the simple averages of its 2011 and 2010 fiscal year end shareholder equity values. Analogous treatment applies to the calculation of a company’s 2012 and 2011 average net financial debt values.
• Net financial debt is calculated as:
– Net financial debt = Short-term interest-bearing liabilities + long-term interest-bearing liabilities – ((0.8*(cash and cash equivalents)).
– 80 percent of cash and cash equivalents is used in the calculation of net financial debt as the study assumed that 20 percent of a company’s cash is reserved for running the operations of the company and, thus, not available for investment, for the purposes of this study.
• In the case of Indra Sistemas Security & Defense, the study used the net financial debt figures explicitly stated by the companies in their press releases since these companies did not publish their audited results by the cut-off date.
• In order to calculate the core ROIC for a company, the study adjusted certain ROIC components depending on the nature of the one-time A&D-related charges/gains for 2011 and 2012, as applicable.
• ROIC for the Industry (reported and core) is a revenue –
Global Aerospace & Defense Industry Financial Performance Study, June 2013 39
weighted average. It was calculated as:
– Industry ROIC = Σ (Company ROIC*Company A&D revenue)/Total Industry A&D revenue.
– ROIC stated in the study differs from ROCE (Return on capital employed).
• Some companies — such as Rolls Royce, SAAB, and Rheinmettal — publish their ROCE. Despite this fact, for purposes of this study, a calculation of these companies’ ROIC was made. A company’s ROCE was not compared with its ROIC for the purposes of this study.
• ROIC for Volvo is not included since Aerospace represents only 1.7 percent of the total company revenue and the company’s overall ROIC is distorting the industry calculations.
• Since Loral Space & Communications Ltd., divested its A&D business (Loral SS/L), the company provides only revenue and earnings for the business under discontinued and the overall company-level ROIC will not be applicable because the study uses only discontinued operations data.
• As mentioned previously, the study uses rolling four quarters data – from 4Q 2011 to 3Q 2012 for Titanium Metals.
4. FCF/FCM:• FCF was calculated for the entire company, as it is not
practical to allocate cash flows to a company’s A&D and non-A&D segments.
• If the FCF value was published by the company, the study used it directly as in the cases of Northrop Grumman, Safran, Huntington Ingalls Industries, Embraer, Kawasaki Heavy Industries, Singapore Technologies Engineering, Babcock International, MTU Aero Engines, IHI, Rheinmetall, Cobham, Teledyne Technologies, Hexcel, Chemring, Ultra Electronics, Fuji, GenCorp, Woodward, Ball Aerospace, Kaman, Bombardier, EADS, BAE Systems, Serco, BBA Aviation, Smiths Group, CSC, CAE, Senior plc, ThyssenKrupp, GKN, and General Dynamics, among others.
• If the FCF value was not published by the company, it was calculated as:
– FCF = Operating cash flow – net capital expenditures.
• Net capital expenditures are calculated as:
– Net capital expenditure = purchases of plant, property, and equipment – proceeds from the sale of plant, property, and equipment.
• The study calculated the Industry FCF as a summation of the FCFs of the constituent companies.
• FCM is calculated for the entire company, analogous to FCF. FCM for a company was calculated as:
– Company FCM = Company FCF/Company revenue.
• FCM for the Industry is a revenue-weighted average. It was calculated as:
Industry FCM = Σ (Company FCM*Company A&D revenue)/total Industry A&D revenue.
• FCF and FCM for two companies, Industria De Turbo Propulsores Sociedad Anonima (ITP) and Korea Aerospace, were not included in the analysis because of data unavailability. In addition, the FCF and FCM of GE were excluded as its inclusion would have had a distorting effect on the calculation of Industry FCF and FCM, respectively.
• FCF and FCM for Volvo were not included since Aerospace is merely 1.7 percent of the total company revenue and the company’s overall FCF is distorting the industry calculations.
• Since Loral Space & Communications Ltd., divested its A&D business, the company provides only revenue and earnings for the business under discontinued and the overall company level FCF and FCM will not be applicable because the study uses only discontinued operations data.
40
• As mentioned above, the study uses rolling four quarters data – from 4Q 2011 to 3Q 2012 for Titanium Metals.
5. BTB ratio• The study took the BTB ratio as stated if reported by the
company, such as in cases of Bombardier Aerospace , Cobham, Kongsberg Gruppen, Indra Sistemas Security & Defence, and CAE
• If the BTB ratio was not published by the company, it was calculated as follows:
BTB = 1+((Current fiscal year total backlog - previous fiscal year total backlog)/(current fiscal year revenue)).
• In calculating BTB ratio, the study used a two-pronged approach, which states that if a company derived less than 60 percent of its revenue from A&D, taking a look at the backlog and revenue of the A&D part. However, if the company derived equal to or more than 60 percent of its revenue from A&D, the study took backlog and revenue for the entire company.
• There were cases in which the company derived less than 60 percent of its revenue from A&D, but the study based calculations of BTB ratio on backlog and revenue for the entire company. Such was made necessary by the lack of A&D segmental backlog information. Examples of such companies include CSC, Precision Castparts Corp., Babcock International, United Technologies, Honeywell Aerospace, Kawasaki Heavy Industries, and Indra Sistemas Security & Defense.
• The BTB ratio for the Industry is a revenue-weighted average. It was calculated as:
– Industry BTB = Σ (Company BTB*Company A&D revenue)/total Industry A&D revenue.
• BTB ratio was calculated based on component values as reported in home currencies to eliminate the impact of currency conversion.
• BTB ratios for services firms, such as BBA Aviation and Wesco Aircraft were not included in the calculation of the Industry BTB ratio for lack of backlog data. The 2012 and/or 2011 BTB of certain other companies could not be calculated for lack of backlog data. Examples of such companies include GKN Aerospace, ThyssenKrupp Marine Systems, Hexcel, Fuji Aerospace, Smiths Detection, Titanium Metals, etc.
• Backlog for Volvo Aero and Loral Space & Communications (Loral SS/L) was not included as the backlog’s transferred to the acquiring companies (e.g., GKN Aerospace and MDA Corporation).
6. Number of A&D employees:• The study applied the 60 percent approach in assessing
A&D employees of companies, such that if a company derives 60 percent or more of its total revenue from A&D, the analysis took its total number of employees. However, if the company derives less than 60 percent of its total revenue from A&D, the study considered only the employees associated specifically with the A&D business of a company.
• If a company derives less than 60 percent revenue from A&D, and it explicitly states the number of employees associated with its A&D activities, the study took it as stated. Examples of such companies include Rheinmetall Defence, ThyssenKrupp Marine Systems, Serco Defence, Science & Nuclear, GKN Aerospace, Kongsberg Gruppen, Smiths Detection, Bombardier Aerospace, etc.
• If a company derives less than 60 percent revenue from A&D, however, and it does not explicitly state the number of employees associated with its A&D business, the study estimates that the company’s A&D employees as a percentage of total employees may likely be the same as the company’s A&D revenue percentage of total revenue. The study used this approach for companies, such as United Technologies, GE Aviation, Honeywell Aerospace, FLIR Government Systems, Kawasaki Aerospace & Gas Turbines, URS Federal Sector, among others, as they do not explicitly state the workforce aligned to their A&D-related businesses and derive less than 60 percent of their total revenue from A&D.
Global Aerospace & Defense Industry Financial Performance Study, June 2013 41
• Where stated, the study took the average employee numbers for the respective fiscal years. If average employee numbers were not available, factored in the employee figures as of the end of the respective fiscal years.
7. Employee productivity:• The study measures employee productivity for individual
companies and the Industry — A&D operating earnings per employee.
• If a company derives more than 60 percent of its revenue from A&D, the metric is calculated as:
– A&D operating earnings per employee = Company’s total operating earnings/Total number of employees.
• If, however, the company derives less than 60 percent from A&D, the metric is calculated as:
– A&D operating earnings per employee = Company’s A&D operating earnings/Estimated employees associated with the A&D business.
• The study used the number of employees associated with the A&D business as reported by the company if so stated explicitly. However, if the same is not explicitly stated, the number of employees associated with the A&D business is estimated as described above.
• Core A&D operating earnings per employee for a company are calculated by adding back the one-time A&D-related charges or subtracting the one-time A&D related gains to the reported operating earnings of the company, divided by the company’s A&D number of employees, for 2011 and 2012, as applicable.
• Operating earnings per employee (reported and core) for the Industry are calculated as:
– Operating earnings per employee in the A&D Industry = Total operating earnings of the Industry/Total number of employees in the Industry.
• Operating earnings per employee not included for Volvo Aero and Loral Space & Communications (Loral SS/L) due to their acquisitions by GKN and MDA Corp., respectively.

42
Tom CaptainPrincipal & Vice Chairman, Global & U.S. A&D Sector LeaderDeloitte LLP +1 206 716 6452 [email protected]
AcknowledgementsThe author would like to thank David Fawley (Deloitte Services LP), Khushi Shah (Deloitte Support Services India Pvt. Ltd), and Achyoot Sinha (Deloitte Support Services India Pvt. Ltd.) for their significant contributions to the research and writing. I would also like to acknowledge the contributions of Monica Mahto (Deloitte Support Services India Pvt. Ltd), Chiara Slewett (Deloitte Corporate Finance LLC), Prema Graper (Deloitte Services LP), Jennifer McHugh (Deloitte Touche Tohmatsu Limited), and Navya Kumar (Deloitte Support Services India Pvt. Ltd.).
Contact

Global Aerospace & Defense Industry Financial Performance Study, June 2013 43

44
The information provided in this Financial Performance Analysis was obtained from sources believed to be reliable, but has not been independently verified and its accuracy cannot be assured. Information contained herein is as of the date of such information or the date of this publication, as applicable. Deloitte undertakes no obligation to notify any recipient of this Financial Performance Analysis of any such change.
This publication contains general information only and Deloitte is not, by means of this publication, rendering accounting, business, financial, investment, legal, tax, or other professional advice or services. This publication is not a substitute for such professional advice or services, nor should it be used as a basis for any decision or action that may affect your business. Before making any decision or taking any action that may affect your business, you should consult a qualified professional advisor.
Deloitte shall not be responsible for any loss sustained by any person who relies on this publication.
About Deloitte Deloitte refers to one or more of Deloitte Touche Tohmatsu Limited, a UK private company limited by guarantee, and its network of member firms, each of which is a legally separate and independent entity. Please see www.deloitte.com/about for a detailed description of the legal structure of Deloitte Touche Tohmatsu Limited and its member firms. Please see www.deloitte.com/us/about for a detailed description of the legal structure of Deloitte LLP and its subsidiaries. Certain services may not be available to attest clients under the rules and regulations of public accounting.
Copyright © 2013 Deloitte Development LLC. All rights reserved. Member of Deloitte Touche Tohmatsu Limited