us aerospace and defense export competitiveness study · us aerospace and defense export...
TRANSCRIPT
US Aerospace and DefenseExport Competitiveness Study
Despite currency headwinds, sector exports grew $5 billion in 2015
April 2016

Contents
3 Executive summary 4 Outlook 5 Sector exports compared to other major US industrial sectors
6 Export growth trends 9 Exports by subsector 11 Exports and imports by product category 13 Major trading partners 15 Exports and imports by state 19 Scope and methodology 20 Sources 21 Contact
3
Executive summary
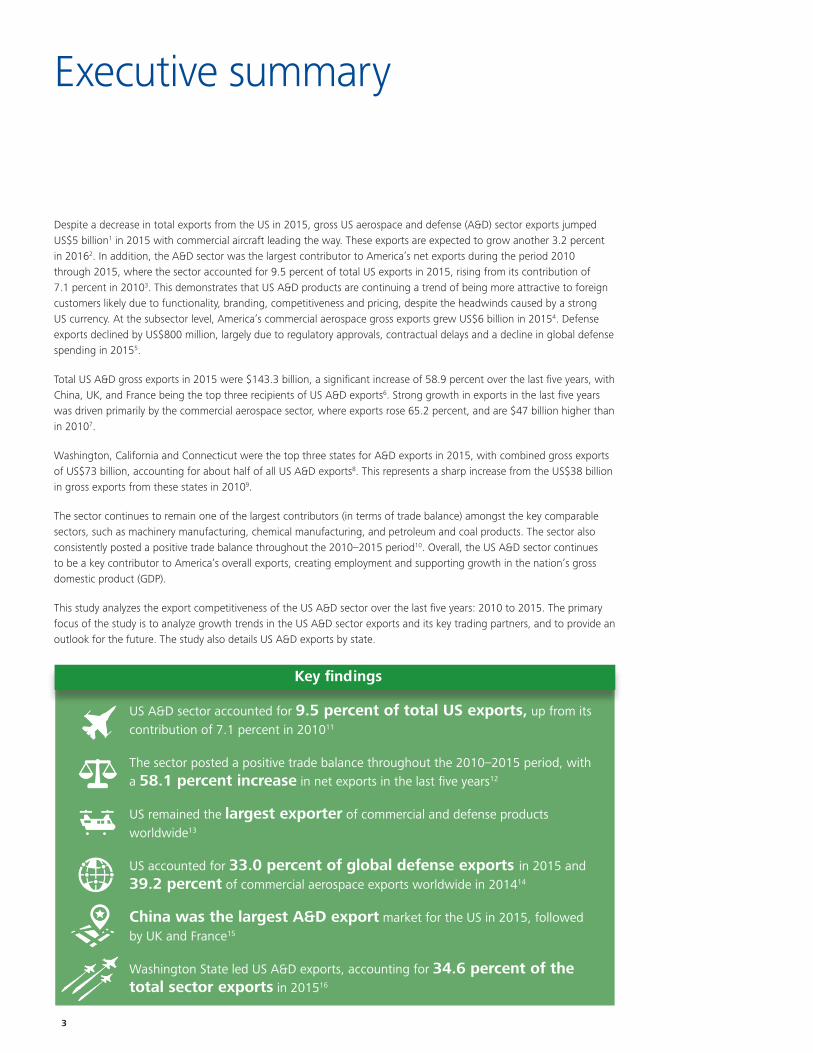
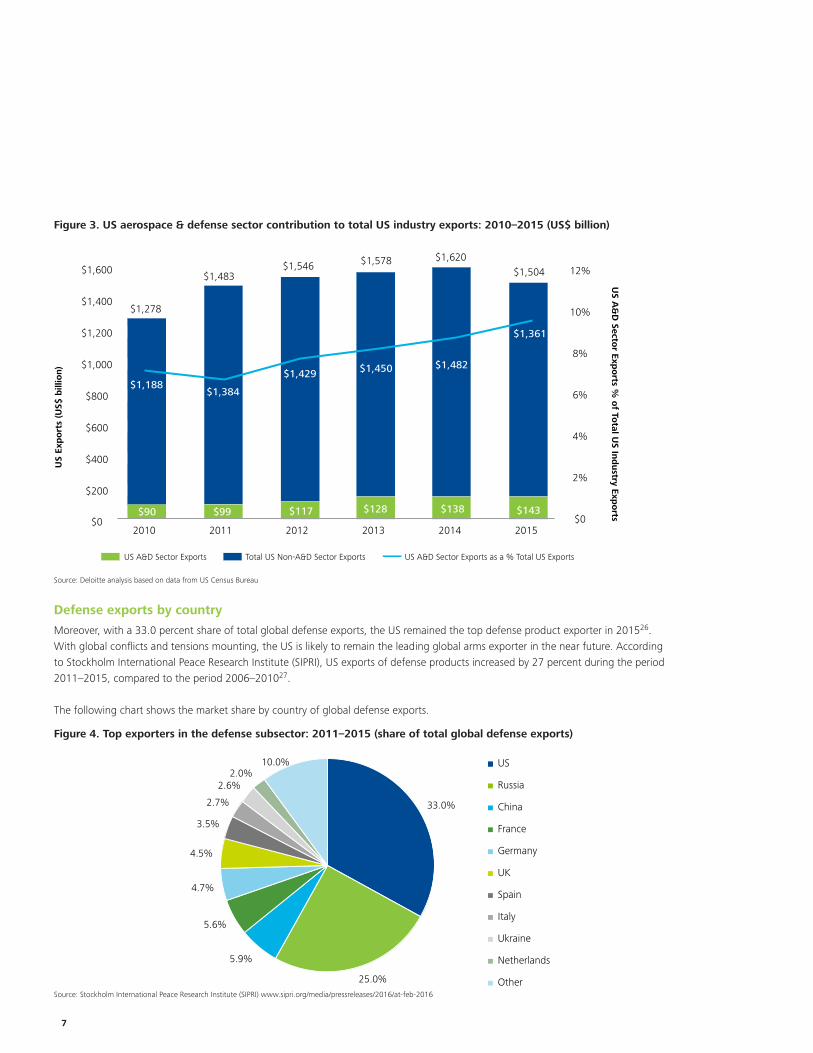
Despite a decrease in total exports from the US in 2015, gross US aerospace and defense (A&D) sector exports jumped US$5 billion1 in 2015 with commercial aircraft leading the way. These exports are expected to grow another 3.2 percent in 20162. In addition, the A&D sector was the largest contributor to America’s net exports during the period 2010 through 2015, where the sector accounted for 9.5 percent of total US exports in 2015, rising from its contribution of 7.1 percent in 20103. This demonstrates that US A&D products are continuing a trend of being more attractive to foreign customers likely due to functionality, branding, competitiveness and pricing, despite the headwinds caused by a strong US currency. At the subsector level, America’s commercial aerospace gross exports grew US$6 billion in 20154. Defense exports declined by US$800 million, largely due to regulatory approvals, contractual delays and a decline in global defense spending in 20155.
Total US A&D gross exports in 2015 were $143.3 billion, a significant increase of 58.9 percent over the last five years, with China, UK, and France being the top three recipients of US A&D exports6. Strong growth in exports in the last five years was driven primarily by the commercial aerospace sector, where exports rose 65.2 percent, and are $47 billion higher than in 20107.
Washington, California and Connecticut were the top three states for A&D exports in 2015, with combined gross exports of US$73 billion, accounting for about half of all US A&D exports8. This represents a sharp increase from the US$38 billion in gross exports from these states in 20109.
The sector continues to remain one of the largest contributors (in terms of trade balance) amongst the key comparable sectors, such as machinery manufacturing, chemical manufacturing, and petroleum and coal products. The sector also consistently posted a positive trade balance throughout the 2010–2015 period10. Overall, the US A&D sector continues to be a key contributor to America’s overall exports, creating employment and supporting growth in the nation’s gross domestic product (GDP).
This study analyzes the export competitiveness of the US A&D sector over the last five years: 2010 to 2015. The primary focus of the study is to analyze growth trends in the US A&D sector exports and its key trading partners, and to provide an outlook for the future. The study also details US A&D exports by state.
Key findings
US A&D sector accounted for 9.5 percent of total US exports, up from its contribution of 7.1 percent in 201011
The sector posted a positive trade balance throughout the 2010–2015 period, with a 58.1 percent increase in net exports in the last five years12
US remained the largest exporter of commercial and defense products worldwide13
US accounted for 33.0 percent of global defense exports in 2015 and 39.2 percent of commercial aerospace exports worldwide in 201414
China was the largest A&D export market for the US in 2015, followed by UK and France15
Washington State led US A&D exports, accounting for 34.6 percent of the total sector exports in 201516

US Aerospace & Defense Export Competitiveness 2016 4
Outlook
We expect that US A&D sector gross exports will increase by $4.6 billion, or 3.2 percent, in 2016, primarily due to an increased pipeline of defense platform products announced and expected for foreign military sales by US defense contractors17. Commercial aircraft exports are expected to flatten out in 2016 before a growth resurgence in 2017. However, this outlook could be at risk if the US dollar accelerates its strength, low oil prices cause affordability challenges for key customers or a global recession occurs. On the other hand, low oil prices may contribute to increased airline profitability, allowing for accelerated aircraft fleet renewals. In addition, renewed regional security threats may accelerate purchases of defense platforms in the near future.
We also expect that US sector products will continue to be in high demand by foreign customers despite the relatively higher price point in US dollars. US exports of commercial A&D sector products face increased competition, especially from established European companies. Competition from newer Asian A&D companies may be several years away, but could affect export competitiveness in the next decade. Other competition is increasing intensely from foreign defense enterprises, especially in Russia, all of which are increasing their pipelines of innovative products. Many of these foreign entities offer their products at lower prices and with less regulatory controls than their US counterparts. Further intensifying this competitive landscape, about 60 countries now operate export credit agencies, such as the US Export-Import (EXIM) Bank, that support foreign sales of A&D sector products.
Recent macro-economic trends may also impact an upward trend in export growth. Continued weak crude oil prices may selectively cause foreign airlines to postpone purchases of new fuel-efficient aircraft to replace their older jets. Weak oil prices may also affect the affordability and import of both commercial aerospace as well as defense products by oil producing states, especially in the Middle East, an important customer to both subsectors. Finally, as mentioned, continued strengthening of the US dollar against major global currencies could make US A&D sector exports even more expensive, thus dampening demand.
5
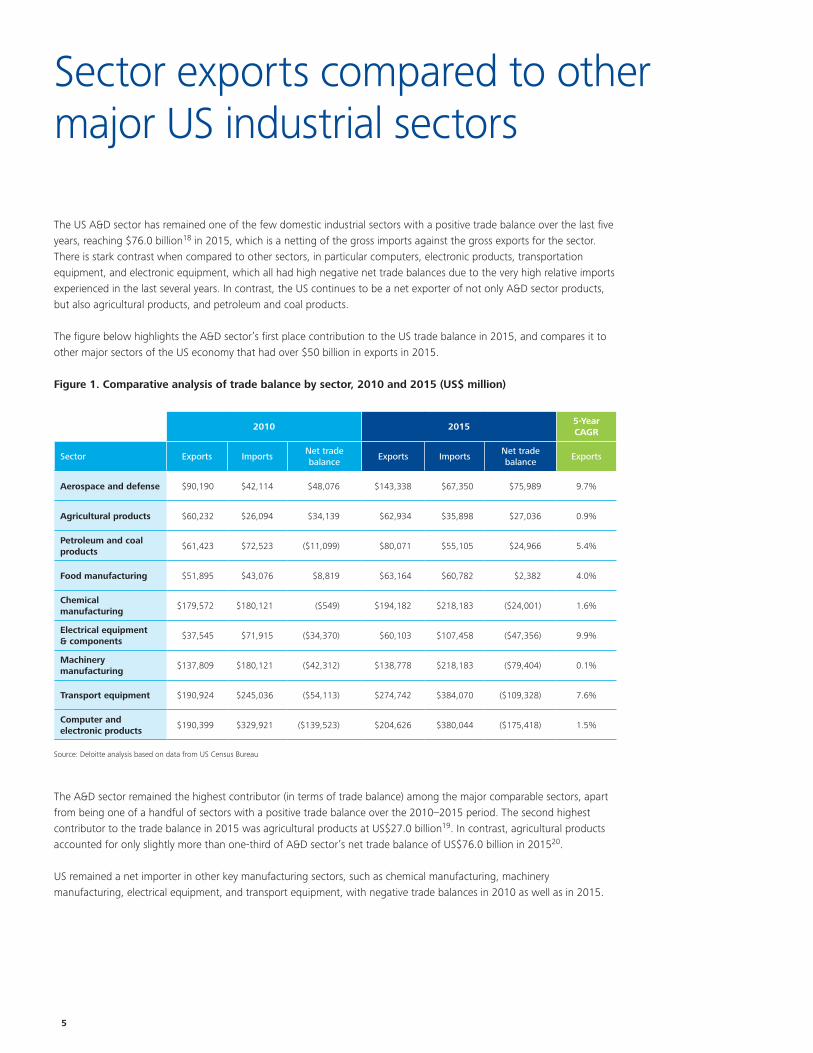
The US A&D sector has remained one of the few domestic industrial sectors with a positive trade balance over the last five years, reaching $76.0 billion18 in 2015, which is a netting of the gross imports against the gross exports for the sector. There is stark contrast when compared to other sectors, in particular computers, electronic products, transportation equipment, and electronic equipment, which all had high negative net trade balances due to the very high relative imports experienced in the last several years. In contrast, the US continues to be a net exporter of not only A&D sector products, but also agricultural products, and petroleum and coal products.
The figure below highlights the A&D sector’s first place contribution to the US trade balance in 2015, and compares it to other major sectors of the US economy that had over $50 billion in exports in 2015.
Figure 1. Comparative analysis of trade balance by sector, 2010 and 2015 (US$ million)
The A&D sector remained the highest contributor (in terms of trade balance) among the major comparable sectors, apart from being one of a handful of sectors with a positive trade balance over the 2010–2015 period. The second highest contributor to the trade balance in 2015 was agricultural products at US$27.0 billion19. In contrast, agricultural products accounted for only slightly more than one-third of A&D sector’s net trade balance of US$76.0 billion in 201520.
US remained a net importer in other key manufacturing sectors, such as chemical manufacturing, machinery manufacturing, electrical equipment, and transport equipment, with negative trade balances in 2010 as well as in 2015.
Sector exports compared to other major US industrial sectors
2010 2015
5-Year CAGR
Sector Exports ImportsNet trade balance
Exports ImportsNet trade balance
Exports
Aerospace and defense $90,190 $42,114 $48,076 $143,338 $67,350 $75,989 9.7%
Agricultural products $60,232 $26,094 $34,139 $62,934 $35,898 $27,036 0.9%
Petroleum and coal products
$61,423 $72,523 ($11,099) $80,071 $55,105 $24,966 5.4%
Food manufacturing $51,895 $43,076 $8,819 $63,164 $60,782 $2,382 4.0%
Chemical manufacturing
$179,572 $180,121 ($549) $194,182 $218,183 ($24,001) 1.6%
Electrical equipment & components
$37,545 $71,915 ($34,370) $60,103 $107,458 ($47,356) 9.9%
Machinery manufacturing
$137,809 $180,121 ($42,312) $138,778 $218,183 ($79,404) 0.1%
Transport equipment $190,924 $245,036 ($54,113) $274,742 $384,070 ($109,328) 7.6%
Computer and electronic products
$190,399 $329,921 ($139,523) $204,626 $380,044 ($175,418) 1.5%
Source: Deloitte analysis based on data from US Census Bureau
US Aerospace & Defense Export Competitiveness 2016 6
US total exports vs. aerospace & defense sector exports
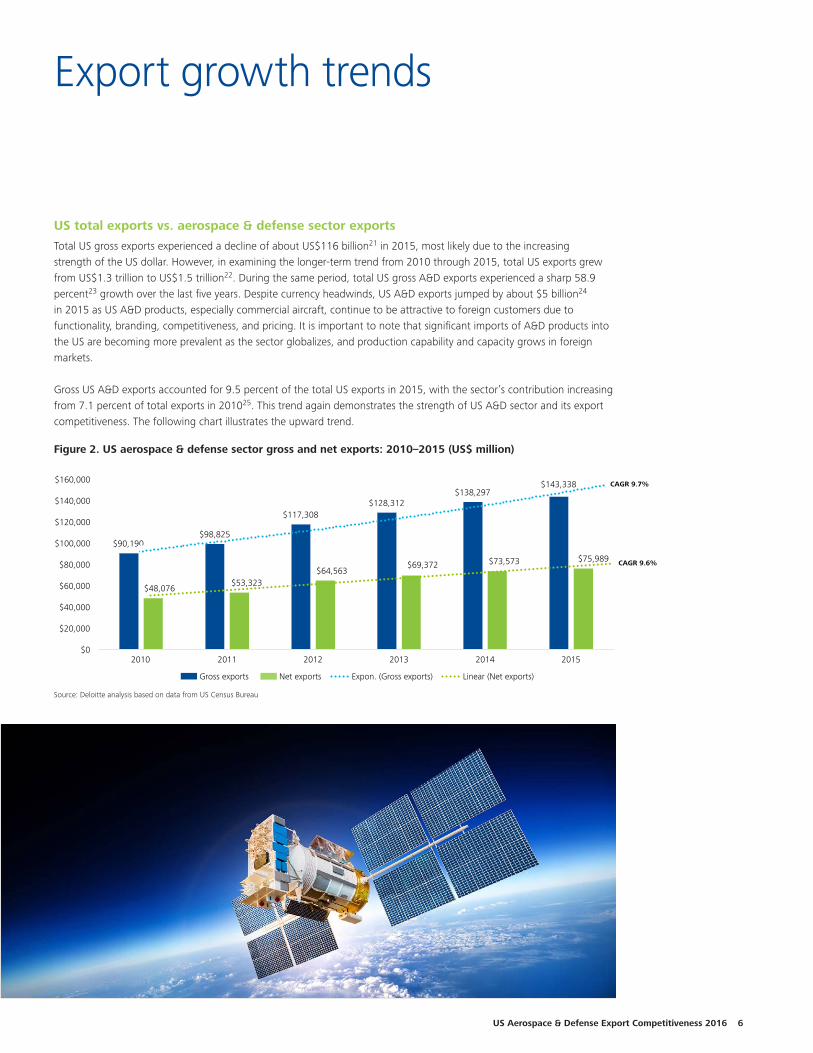
Total US gross exports experienced a decline of about US$116 billion21 in 2015, most likely due to the increasing strength of the US dollar. However, in examining the longer-term trend from 2010 through 2015, total US exports grew from US$1.3 trillion to US$1.5 trillion22. During the same period, total US gross A&D exports experienced a sharp 58.9 percent23 growth over the last five years. Despite currency headwinds, US A&D exports jumped by about $5 billion24 in 2015 as US A&D products, especially commercial aircraft, continue to be attractive to foreign customers due to functionality, branding, competitiveness, and pricing. It is important to note that significant imports of A&D products into the US are becoming more prevalent as the sector globalizes, and production capability and capacity grows in foreign markets.
Gross US A&D exports accounted for 9.5 percent of the total US exports in 2015, with the sector’s contribution increasing from 7.1 percent of total exports in 201025. This trend again demonstrates the strength of US A&D sector and its export competitiveness. The following chart illustrates the upward trend.
Export growth trends
$90,190$98,825
$117,308$128,312
$138,297$143,338
$48,076$53,323
$64,563$69,372 $73,573 $75,989
$0
$20,000
$40,000
$60,000
$80,000
$100,000
$120,000
$140,000
$160,000
2010 2011 2012 2013 2014 2015
Gross exports Net exports Expon. (Gross exports) Linear (Net exports)
CAGR 9.7%
CAGR 9.6%$90,190
$98,825
$117,308$128,312
$138,297$143,338
$48,076$53,323
$64,563$69,372 $73,573 $75,989
$0
$20,000
$40,000
$60,000
$80,000
$100,000
$120,000
$140,000
$160,000
2010 2011 2012 2013 2014 2015
Gross exports Net exports Expon. (Gross exports) Linear (Net exports)
CAGR 9.7%
CAGR 9.6%
Source: Deloitte analysis based on data from US Census Bureau
Figure 2. US aerospace & defense sector gross and net exports: 2010–2015 (US$ million)
7
$1,278
$1,483$1,546 $1,578 $1,620
$1,504$1,600
$1,400
$1,200
$800
$1,000
$600
$400
$200
$02010 2011 2012 2013 2014 2015
US A&D Sector Exports Total US Non-A&D Sector Exports US A&D Sector Exports as a % Total US Exports
12%
8%
10%
6%
4%
2%
$0
US
Exp
ort
s (U
S$ b
illio
n)
$1,188$1,384
$1,429 $1,450 $1,482
$1,361
$90 $99 $117 $128 $138 $143
US A
&D
Sector Exp
orts %
of To
tal US In
dustry Exp
orts
Figure 3. US aerospace & defense sector contribution to total US industry exports: 2010–2015 (US$ billion)
Source: Deloitte analysis based on data from US Census Bureau
Defense exports by country
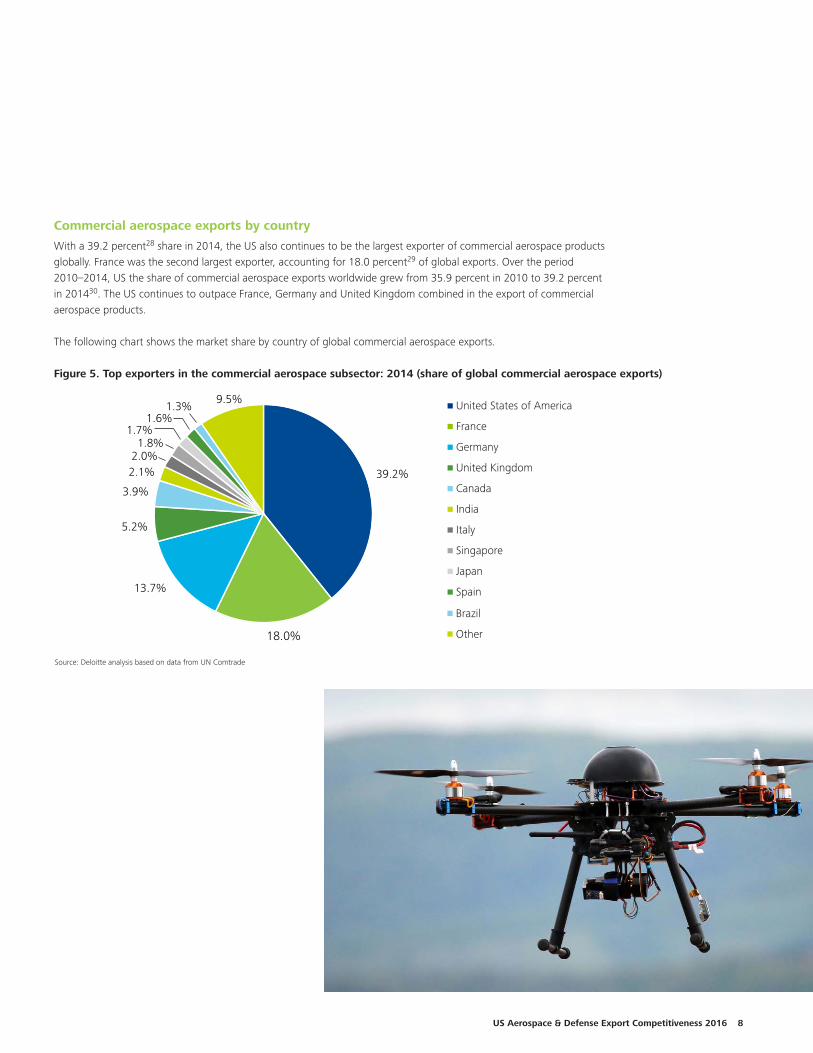
Moreover, with a 33.0 percent share of total global defense exports, the US remained the top defense product exporter in 201526. With global conflicts and tensions mounting, the US is likely to remain the leading global arms exporter in the near future. According to Stockholm International Peace Research Institute (SIPRI), US exports of defense products increased by 27 percent during the period 2011–2015, compared to the period 2006–201027.
The following chart shows the market share by country of global defense exports.
Figure 4. Top exporters in the defense subsector: 2011–2015 (share of total global defense exports)
33.0%
25.0%
5.9%
5.6%
4.7%
4.5%
3.5%
2.7%
2.6%2.0%
10.0%US
Russia
China
France
Germany
UK
Spain
Italy
Ukraine
Netherlands
Other
33.0%
25.0%
5.9%
5.6%
4.7%
4.5%
3.5%
2.7%
2.6%2.0%
10.0%US
Russia
China
France
Germany
UK
Spain
Italy
Ukraine
Netherlands
OtherSource: Stockholm International Peace Research Institute (SIPRI) www.sipri.org/media/pressreleases/2016/at-feb-2016
US Aerospace & Defense Export Competitiveness 2016 8
39.2%
18.0%
13.7%
5.2%
3.9%
2.1%2.0%1.8%
1.7%1.6%
1.3%9.5%
United States of America
France
Germany
United Kingdom
Canada
India
Italy
Singapore
Japan
Spain
Brazil
Other
Commercial aerospace exports by country
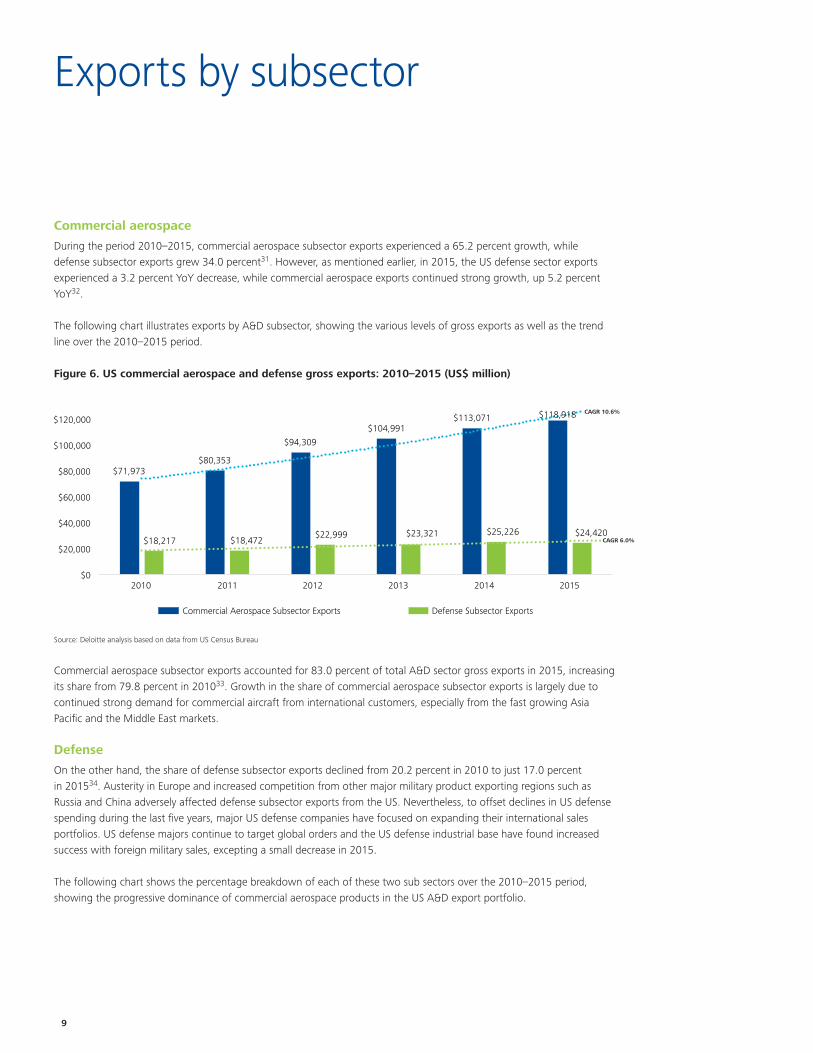
With a 39.2 percent28 share in 2014, the US also continues to be the largest exporter of commercial aerospace products globally. France was the second largest exporter, accounting for 18.0 percent29 of global exports. Over the period 2010–2014, US the share of commercial aerospace exports worldwide grew from 35.9 percent in 2010 to 39.2 percent in 201430. The US continues to outpace France, Germany and United Kingdom combined in the export of commercial aerospace products.
The following chart shows the market share by country of global commercial aerospace exports.
Figure 5. Top exporters in the commercial aerospace subsector: 2014 (share of global commercial aerospace exports)
39.2%
18.0%
13.7%
5.2%
3.9%
2.1%2.0%1.8%
1.7%1.6%
1.3%9.5%
United States of America
France
Germany
United Kingdom
Canada
India
Italy
Singapore
Japan
Spain
Brazil
Other
Source: Deloitte analysis based on data from UN Comtrade
9
$71,973$80,353
$94,309
$104,991$113,071 $118,918
$18,217 $18,472$22,999 $23,321 $25,226 $24,420
$0
$20,000
$40,000
$60,000
$80,000
$100,000
$120,000
2010 2011 2012 2013 2014 2015
Commercial Aerospace Subsector Exports Defense Subsector Exports
CAGR 10.6%
CAGR 6.0%
Commercial aerospace
During the period 2010–2015, commercial aerospace subsector exports experienced a 65.2 percent growth, while defense subsector exports grew 34.0 percent31. However, as mentioned earlier, in 2015, the US defense sector exports experienced a 3.2 percent YoY decrease, while commercial aerospace exports continued strong growth, up 5.2 percent YoY32.
The following chart illustrates exports by A&D subsector, showing the various levels of gross exports as well as the trend line over the 2010–2015 period.
Figure 6. US commercial aerospace and defense gross exports: 2010–2015 (US$ million)
Source: Deloitte analysis based on data from US Census Bureau
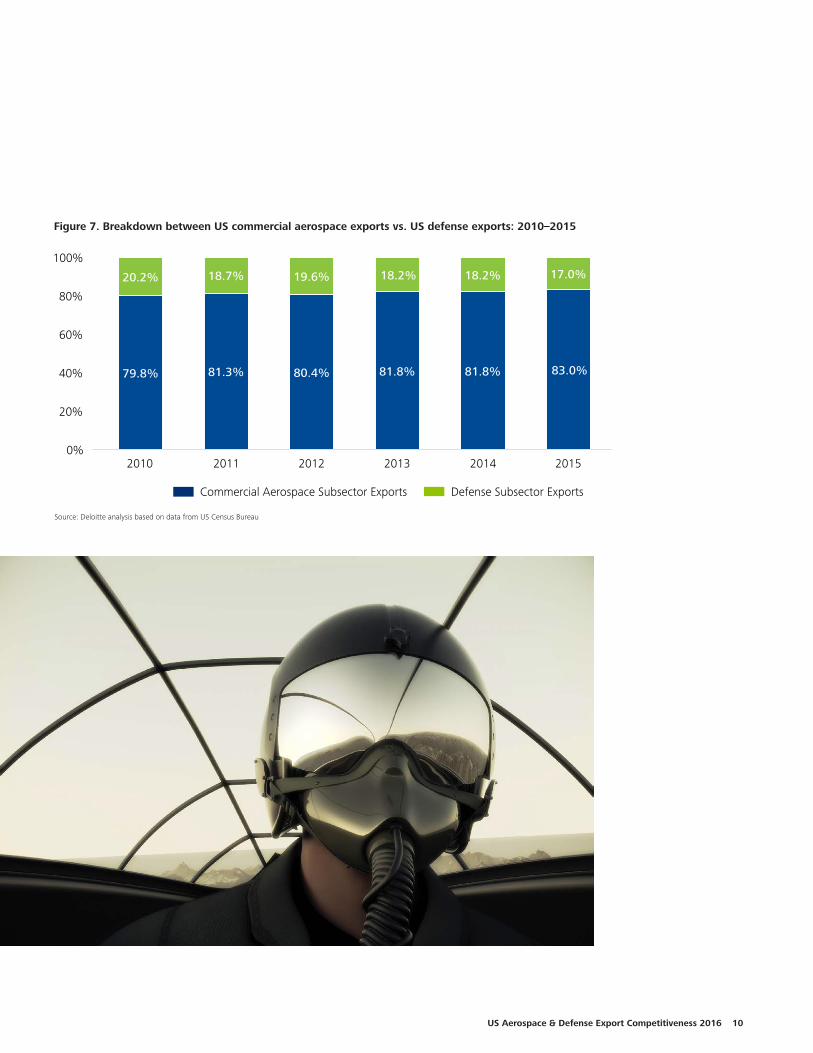
Commercial aerospace subsector exports accounted for 83.0 percent of total A&D sector gross exports in 2015, increasing its share from 79.8 percent in 201033. Growth in the share of commercial aerospace subsector exports is largely due to continued strong demand for commercial aircraft from international customers, especially from the fast growing Asia Pacific and the Middle East markets.
Defense
On the other hand, the share of defense subsector exports declined from 20.2 percent in 2010 to just 17.0 percent in 201534. Austerity in Europe and increased competition from other major military product exporting regions such as Russia and China adversely affected defense subsector exports from the US. Nevertheless, to offset declines in US defense spending during the last five years, major US defense companies have focused on expanding their international sales portfolios. US defense majors continue to target global orders and the US defense industrial base have found increased success with foreign military sales, excepting a small decrease in 2015.
The following chart shows the percentage breakdown of each of these two sub sectors over the 2010–2015 period, showing the progressive dominance of commercial aerospace products in the US A&D export portfolio.
Exports by subsector
$71,973$80,353
$94,309
$104,991$113,071 $118,918
$18,217 $18,472$22,999 $23,321 $25,226 $24,420
$0
$20,000
$40,000
$60,000
$80,000
$100,000
$120,000
2010 2011 2012 2013 2014 2015
Commercial Aerospace Subsector Exports Defense Subsector Exports
$71,973$80,353
$94,309$104,991
$113,071 $118,918
$18,217 $18,472 $22,999 $23,321 $25,226 $24,420
$0
$20,000
$40,000
$60,000
$80,000
$100,000
$120,000
2010 2011 2012 2013 2014 2015
Commercial Aerospace Subsector Exports Defense Subsector Exports
CAGR 10.6%
CAGR 6.0%
CAGR 10.6%
CAGR 6.0%
US Aerospace & Defense Export Competitiveness 2016 10
Figure 7. Breakdown between US commercial aerospace exports vs. US defense exports: 2010–2015
79.8% 81.3% 80.4% 81.8% 81.8% 83.0%
20.2% 18.7% 19.6% 18.2% 18.2% 17.0%
0%
20%
40%
60%
80%
100%
2010 2011 2012 2013 2014 2015
Commercial Aerospace Subsector Exports Defense Subsector Exports
Source: Deloitte analysis based on data from US Census Bureau
11
Exports
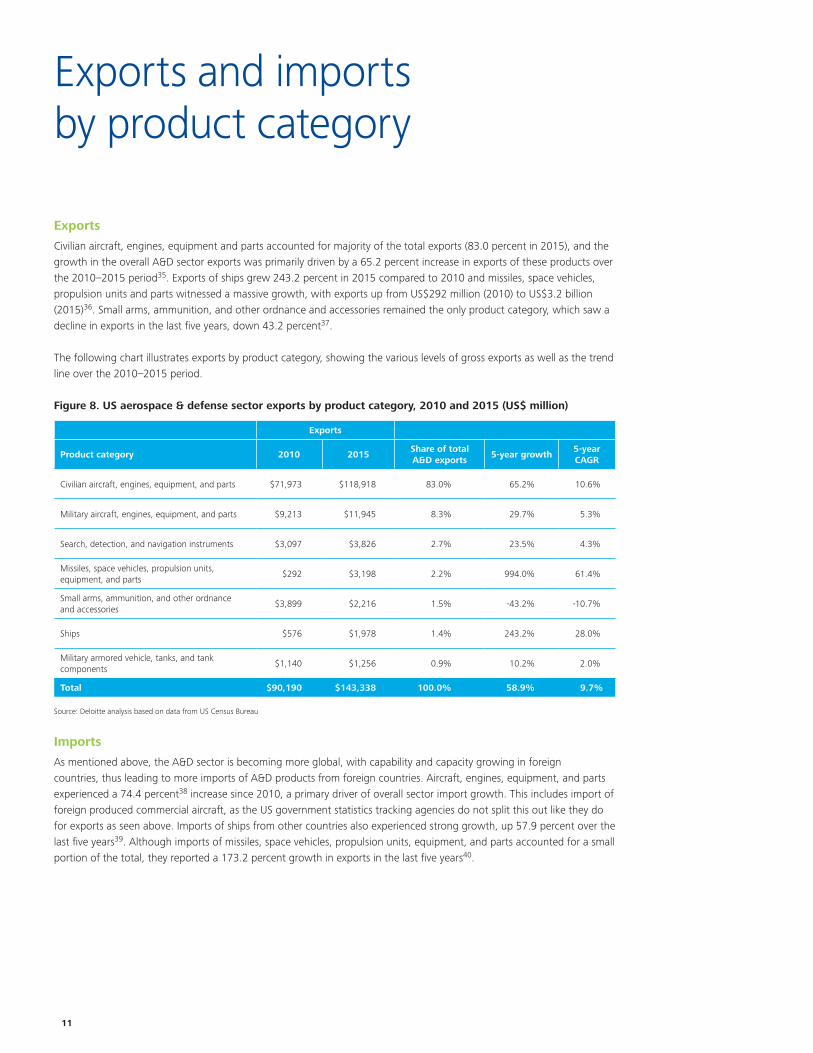
Civilian aircraft, engines, equipment and parts accounted for majority of the total exports (83.0 percent in 2015), and the growth in the overall A&D sector exports was primarily driven by a 65.2 percent increase in exports of these products over the 2010–2015 period35. Exports of ships grew 243.2 percent in 2015 compared to 2010 and missiles, space vehicles, propulsion units and parts witnessed a massive growth, with exports up from US$292 million (2010) to US$3.2 billion (2015)36. Small arms, ammunition, and other ordnance and accessories remained the only product category, which saw a decline in exports in the last five years, down 43.2 percent37.
The following chart illustrates exports by product category, showing the various levels of gross exports as well as the trend line over the 2010–2015 period.
Figure 8. US aerospace & defense sector exports by product category, 2010 and 2015 (US$ million)
Source: Deloitte analysis based on data from US Census Bureau
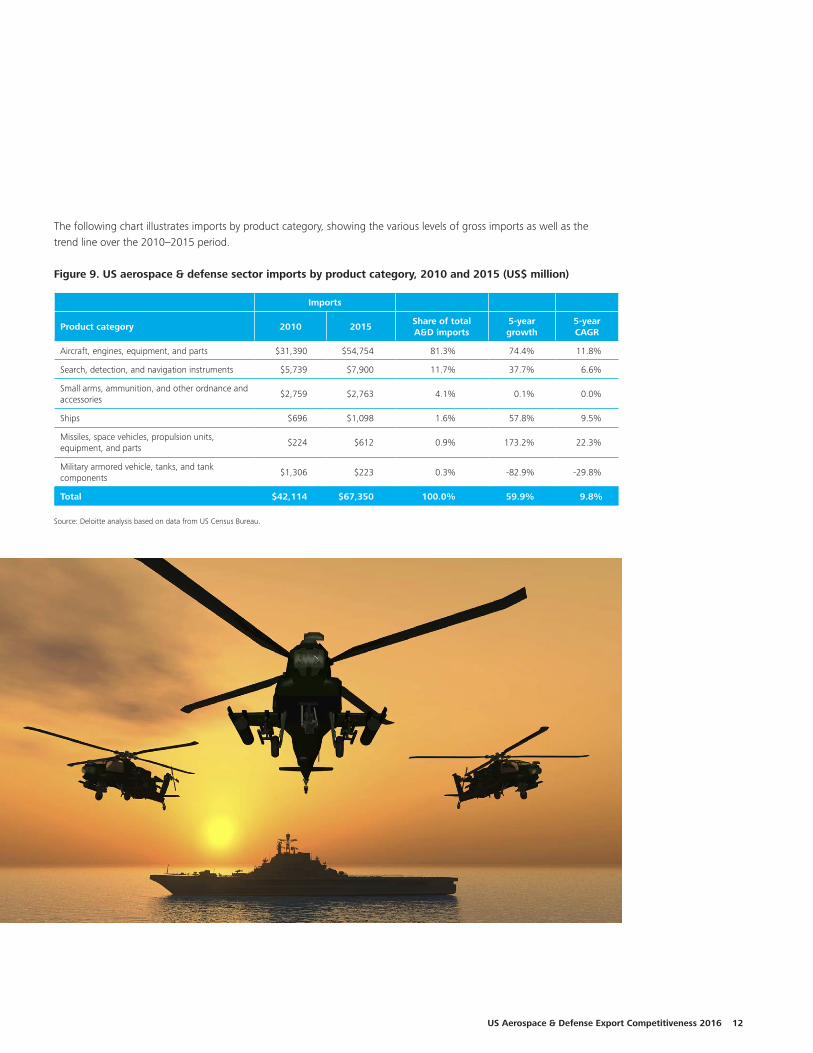
Imports
As mentioned above, the A&D sector is becoming more global, with capability and capacity growing in foreign countries, thus leading to more imports of A&D products from foreign countries. Aircraft, engines, equipment, and parts experienced a 74.4 percent38 increase since 2010, a primary driver of overall sector import growth. This includes import of foreign produced commercial aircraft, as the US government statistics tracking agencies do not split this out like they do for exports as seen above. Imports of ships from other countries also experienced strong growth, up 57.9 percent over the last five years39. Although imports of missiles, space vehicles, propulsion units, equipment, and parts accounted for a small portion of the total, they reported a 173.2 percent growth in exports in the last five years40.
Exports and imports by product category
Exports
Product category 2010 2015Share of total A&D exports
5-year growth5-year CAGR
Civilian aircraft, engines, equipment, and parts $71,973 $118,918 83.0% 65.2% 10.6%
Military aircraft, engines, equipment, and parts $9,213 $11,945 8.3% 29.7% 5.3%
Search, detection, and navigation instruments $3,097 $3,826 2.7% 23.5% 4.3%
Missiles, space vehicles, propulsion units, equipment, and parts
$292 $3,198 2.2% 994.0% 61.4%
Small arms, ammunition, and other ordnance and accessories
$3,899 $2,216 1.5% -43.2% -10.7%
Ships $576 $1,978 1.4% 243.2% 28.0%
Military armored vehicle, tanks, and tank components
$1,140 $1,256 0.9% 10.2% 2.0%
Total $90,190 $143,338 100.0% 58.9% 9.7%
US Aerospace & Defense Export Competitiveness 2016 12
The following chart illustrates imports by product category, showing the various levels of gross imports as well as the trend line over the 2010–2015 period.
Figure 9. US aerospace & defense sector imports by product category, 2010 and 2015 (US$ million)
Imports
Product category 2010 2015Share of total A&D imports
5-year growth
5-year CAGR
Aircraft, engines, equipment, and parts $31,390 $54,754 81.3% 74.4% 11.8%
Search, detection, and navigation instruments $5,739 $7,900 11.7% 37.7% 6.6%
Small arms, ammunition, and other ordnance and accessories
$2,759 $2,763 4.1% 0.1% 0.0%
Ships $696 $1,098 1.6% 57.8% 9.5%
Missiles, space vehicles, propulsion units, equipment, and parts
$224 $612 0.9% 173.2% 22.3%
Military armored vehicle, tanks, and tank components
$1,306 $223 0.3% -82.9% -29.8%
Total $42,114 $67,350 100.0% 59.9% 9.8%
Source: Deloitte analysis based on data from US Census Bureau.
13
Major trading partners
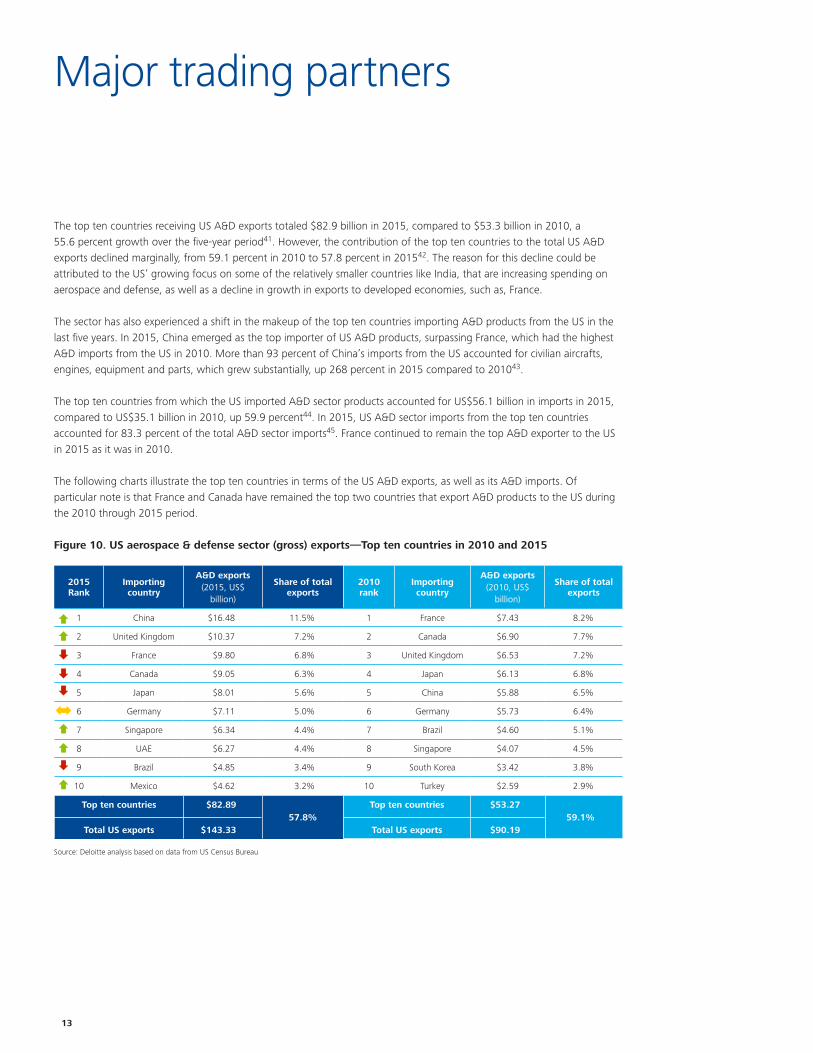
The top ten countries receiving US A&D exports totaled $82.9 billion in 2015, compared to $53.3 billion in 2010, a 55.6 percent growth over the five-year period41. However, the contribution of the top ten countries to the total US A&D exports declined marginally, from 59.1 percent in 2010 to 57.8 percent in 201542. The reason for this decline could be attributed to the US’ growing focus on some of the relatively smaller countries like India, that are increasing spending on aerospace and defense, as well as a decline in growth in exports to developed economies, such as, France.
The sector has also experienced a shift in the makeup of the top ten countries importing A&D products from the US in the last five years. In 2015, China emerged as the top importer of US A&D products, surpassing France, which had the highest A&D imports from the US in 2010. More than 93 percent of China’s imports from the US accounted for civilian aircrafts, engines, equipment and parts, which grew substantially, up 268 percent in 2015 compared to 201043.
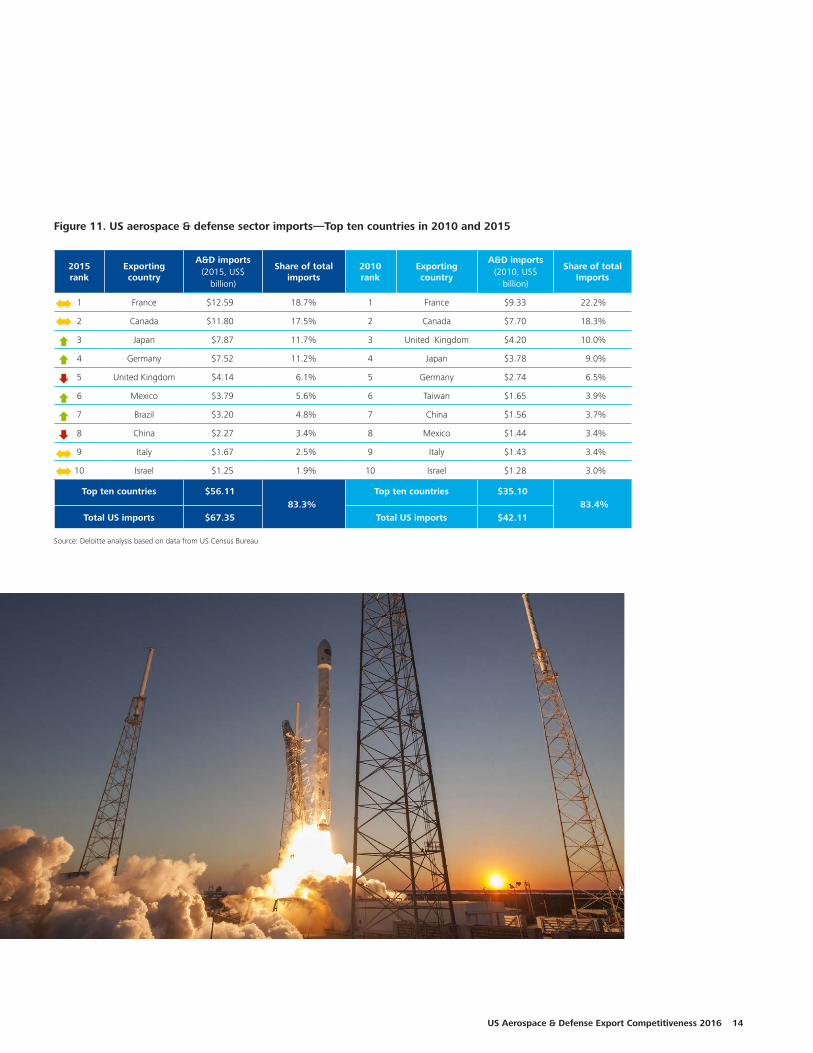
The top ten countries from which the US imported A&D sector products accounted for US$56.1 billion in imports in 2015, compared to US$35.1 billion in 2010, up 59.9 percent44. In 2015, US A&D sector imports from the top ten countries accounted for 83.3 percent of the total A&D sector imports45. France continued to remain the top A&D exporter to the US in 2015 as it was in 2010.
The following charts illustrate the top ten countries in terms of the US A&D exports, as well as its A&D imports. Of particular note is that France and Canada have remained the top two countries that export A&D products to the US during the 2010 through 2015 period.
Figure 10. US aerospace & defense sector (gross) exports—Top ten countries in 2010 and 2015
2015 Rank
Importing country
A&D exports (2015, US$
billion)
Share of total exports
2010 rank
Importing country
A&D exports (2010, US$
billion)
Share of total exports
1 China $16.48 11.5% 1 France $7.43 8.2%
2 United Kingdom $10.37 7.2% 2 Canada $6.90 7.7%
3 France $9.80 6.8% 3 United Kingdom $6.53 7.2%
4 Canada $9.05 6.3% 4 Japan $6.13 6.8%
5 Japan $8.01 5.6% 5 China $5.88 6.5%
6 Germany $7.11 5.0% 6 Germany $5.73 6.4%
7 Singapore $6.34 4.4% 7 Brazil $4.60 5.1%
8 UAE $6.27 4.4% 8 Singapore $4.07 4.5%
9 Brazil $4.85 3.4% 9 South Korea $3.42 3.8%
10 Mexico $4.62 3.2% 10 Turkey $2.59 2.9%
Top ten countries
Total US exports
$82.89
$143.3357.8%
Top ten countries
Total US exports
$53.27
$90.1959.1%
Source: Deloitte analysis based on data from US Census Bureau
US Aerospace & Defense Export Competitiveness 2016 14
Figure 11. US aerospace & defense sector imports—Top ten countries in 2010 and 2015
2015 rank
Exporting country
A&D imports (2015, US$
billion)
Share of total imports
2010 rank
Exporting country
A&D imports (2010, US$
billion)
Share of total Imports
1 France $12.59 18.7% 1 France $9.33 22.2%
2 Canada $11.80 17.5% 2 Canada $7.70 18.3%
3 Japan $7.87 11.7% 3 United Kingdom $4.20 10.0%
4 Germany $7.52 11.2% 4 Japan $3.78 9.0%
5 United Kingdom $4.14 6.1% 5 Germany $2.74 6.5%
6 Mexico $3.79 5.6% 6 Taiwan $1.65 3.9%
7 Brazil $3.20 4.8% 7 China $1.56 3.7%
8 China $2.27 3.4% 8 Mexico $1.44 3.4%
9 Italy $1.67 2.5% 9 Italy $1.43 3.4%
10 Israel $1.25 1.9% 10 Israel $1.28 3.0%
Top ten countries
Total US imports
$56.11
$67.3583.3%
Top ten countries
Total US imports
$35.10
$42.1183.4%
Source: Deloitte analysis based on data from US Census Bureau
15
-38%40%
35%
109%
255%
137%
602%
123%
-21%
-57%
-54%
-81%
-20%
79%
33%
66%
34%
19%
72%
69%
31%
18%
15%
57%
67%
23%35%
45% 40%
25%
55%12%
33%
68%
26%
43%
25%
34%
88%
-2%
-7%
4%
73%
-7%
109%
255%602%
137%
123%-81%
-21% -20%
-54%
-57%
66%
34%
19%
72%
69%
31%
18%
15%
57%
67%
88%
23%
45% 40%
25%
55%12%
33%
68%
26%
43%
25%
34%
79%
33%
35%
-2%
4%30%
37%
16%
-1%
2010 & 2015_v2
2 23,671
2010
-86% 602%
% Change 2010..
20154
10,00020,00030,00040,00050,000
Map based on Longitude (generated) and Longitude (generated) and Latitude (generated) and Latitude (generated). Details are shown for State. For pane Latitude (generated) (2): Color shows sum of % Change 2010 - 2015. Size shows sum of 2015. The marks are labeled by sum of % Change 2010 - 2015. For pane Latitude(generated): Color shows sum of 2010. The view is filtered on sum of % Change 2010 - 2015, which ranges from -81% to 602%.
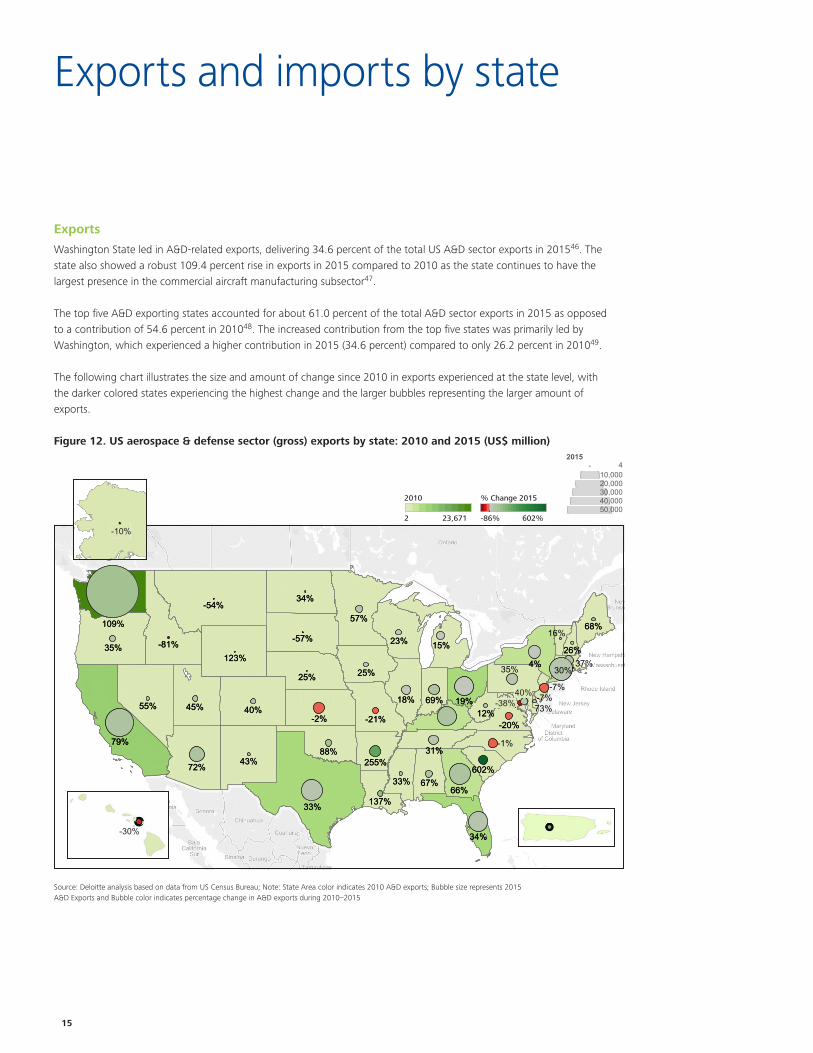
Exports and imports by state
Exports
Washington State led in A&D-related exports, delivering 34.6 percent of the total US A&D sector exports in 201546. The state also showed a robust 109.4 percent rise in exports in 2015 compared to 2010 as the state continues to have the largest presence in the commercial aircraft manufacturing subsector47.
The top five A&D exporting states accounted for about 61.0 percent of the total A&D sector exports in 2015 as opposed to a contribution of 54.6 percent in 201048. The increased contribution from the top five states was primarily led by Washington, which experienced a higher contribution in 2015 (34.6 percent) compared to only 26.2 percent in 201049.
The following chart illustrates the size and amount of change since 2010 in exports experienced at the state level, with the darker colored states experiencing the highest change and the larger bubbles representing the larger amount of exports.
Figure 12. US aerospace & defense sector (gross) exports by state: 2010 and 2015 (US$ million)
Source: Deloitte analysis based on data from US Census Bureau; Note: State Area color indicates 2010 A&D exports; Bubble size represents 2015 A&D Exports and Bubble color indicates percentage change in A&D exports during 2010–2015
2 23,671 -86% 602%
-38%40%
109%
123%
255%
137%
602%
-21%-20%
-57%
-54%
-81%
33%
66%
34%
19%
72%
35%
69%
31%
18%
15%
57%
67%
79%
23%35%
45% 40%
25%
55%12%
33%
68%
26%
43%
25%
34%
88%
-2%
-7%
4%
73%-38%
40%
109%
123%
255%
137%
602%
-21%-20%
-57%
-54%
-81%
33%
66%
34%
19%
72%
35%
69%
31%
18%
15%
57%
67%
79%
23%35%
45% 40%
25%
55%12%
33%
68%
26%
43%
25%
34%
88%
-2%
-7%
4%
-86% 602%
% Change 201..
2 23,671
201020154
10,00020,00030,00040,00050,000
2010 % Change 2015
-10%-10%
-10%-10% -10%
-30% 234%
-38%40%
109%
123%
255%
137%
602%
-21%-20%
-57%
-54%
-81%
33%
66%
34%
19%
72%
35%
69%
31%
18%
15%
57%
67%
79%
23%35%
45% 40%
25%
55%12%
33%
68%
26%
43%
25%
34%
88%
-2%
-7%
4%
73%-38%
40%
109%
123%
255%
137%
602%
-21%-20%
-57%
-54%
-81%
33%
66%
34%
19%
72%
35%
69%
31%
18%
15%
57%
67%
79%
23%35%
45% 40%
25%
55%12%
33%
68%
26%
43%
25%
34%
88%
-2%
-7%
4%
-86% 602%
% Change 201..
2 23,671
201020154
10,00020,00030,00040,00050,000
-38%
-38%40%
109%
123%
255%
137%
602%
-21%-20%
-57%
-54%
-81%
33%
66%
34%
19%
72%
35%
69%
31%
18%
15%
57%
67%
79%
23%35%
45% 40%
25%
55%12%
33%
68%
26%
43%
25%
34%
88%
-2%
-7%
4%
73%-38%
40%
109%
123%
255%
137%
602%
-21%-20%
-57%
-54%
-81%
33%
66%
34%
19%
72%
35%
69%
31%
18%
15%
57%
67%
79%
23%35%
45% 40%
25%
55%12%
33%
68%
26%
43%
25%
34%
88%
-2%
-7%
4%
-86% 602%
% Change 201..
2 23,671
201020154
10,00020,00030,00040,00050,000
40%
US Aerospace & Defense Export Competitiveness 2016 16
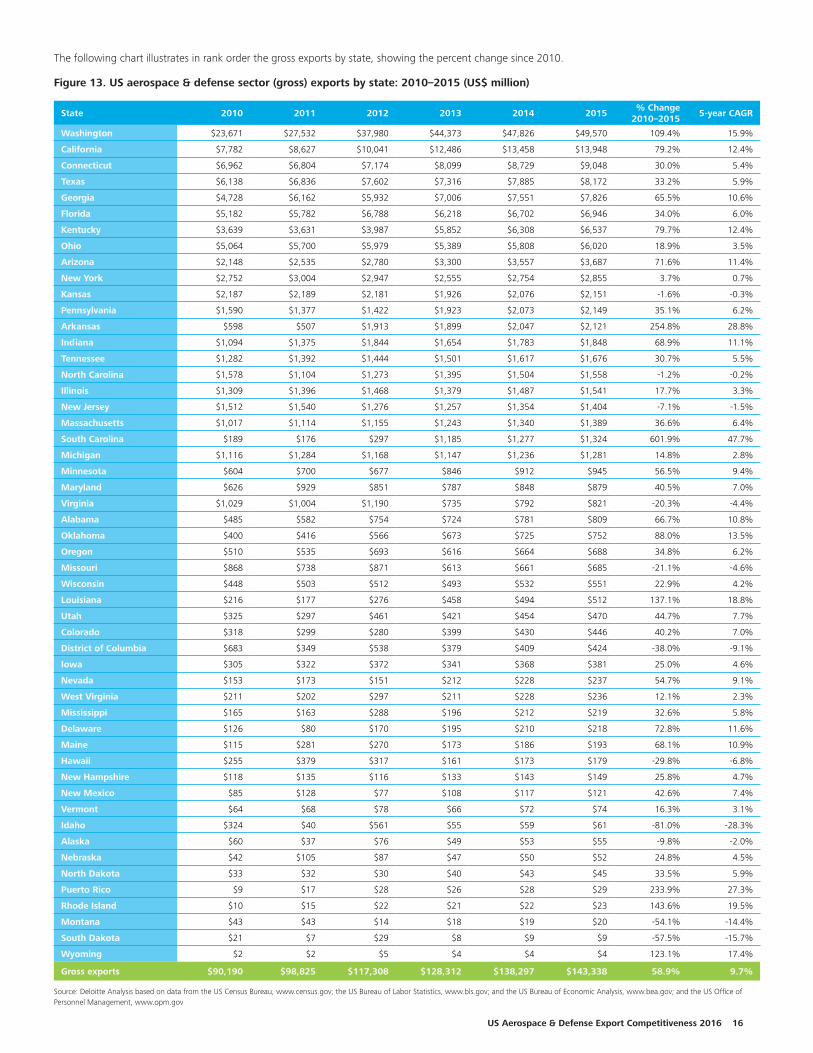
The following chart illustrates in rank order the gross exports by state, showing the percent change since 2010.
Figure 13. US aerospace & defense sector (gross) exports by state: 2010–2015 (US$ million)
State 2010 2011 2012 2013 2014 2015% Change
2010–20155-year CAGR
Washington $23,671 $27,532 $37,980 $44,373 $47,826 $49,570 109.4% 15.9%
California $7,782 $8,627 $10,041 $12,486 $13,458 $13,948 79.2% 12.4%
Connecticut $6,962 $6,804 $7,174 $8,099 $8,729 $9,048 30.0% 5.4%
Texas $6,138 $6,836 $7,602 $7,316 $7,885 $8,172 33.2% 5.9%
Georgia $4,728 $6,162 $5,932 $7,006 $7,551 $7,826 65.5% 10.6%
Florida $5,182 $5,782 $6,788 $6,218 $6,702 $6,946 34.0% 6.0%
Kentucky $3,639 $3,631 $3,987 $5,852 $6,308 $6,537 79.7% 12.4%
Ohio $5,064 $5,700 $5,979 $5,389 $5,808 $6,020 18.9% 3.5%
Arizona $2,148 $2,535 $2,780 $3,300 $3,557 $3,687 71.6% 11.4%
New York $2,752 $3,004 $2,947 $2,555 $2,754 $2,855 3.7% 0.7%
Kansas $2,187 $2,189 $2,181 $1,926 $2,076 $2,151 -1.6% -0.3%
Pennsylvania $1,590 $1,377 $1,422 $1,923 $2,073 $2,149 35.1% 6.2%
Arkansas $598 $507 $1,913 $1,899 $2,047 $2,121 254.8% 28.8%
Indiana $1,094 $1,375 $1,844 $1,654 $1,783 $1,848 68.9% 11.1%
Tennessee $1,282 $1,392 $1,444 $1,501 $1,617 $1,676 30.7% 5.5%
North Carolina $1,578 $1,104 $1,273 $1,395 $1,504 $1,558 -1.2% -0.2%
Illinois $1,309 $1,396 $1,468 $1,379 $1,487 $1,541 17.7% 3.3%
New Jersey $1,512 $1,540 $1,276 $1,257 $1,354 $1,404 -7.1% -1.5%
Massachusetts $1,017 $1,114 $1,155 $1,243 $1,340 $1,389 36.6% 6.4%
South Carolina $189 $176 $297 $1,185 $1,277 $1,324 601.9% 47.7%
Michigan $1,116 $1,284 $1,168 $1,147 $1,236 $1,281 14.8% 2.8%
Minnesota $604 $700 $677 $846 $912 $945 56.5% 9.4%
Maryland $626 $929 $851 $787 $848 $879 40.5% 7.0%
Virginia $1,029 $1,004 $1,190 $735 $792 $821 -20.3% -4.4%
Alabama $485 $582 $754 $724 $781 $809 66.7% 10.8%
Oklahoma $400 $416 $566 $673 $725 $752 88.0% 13.5%
Oregon $510 $535 $693 $616 $664 $688 34.8% 6.2%
Missouri $868 $738 $871 $613 $661 $685 -21.1% -4.6%
Wisconsin $448 $503 $512 $493 $532 $551 22.9% 4.2%
Louisiana $216 $177 $276 $458 $494 $512 137.1% 18.8%
Utah $325 $297 $461 $421 $454 $470 44.7% 7.7%
Colorado $318 $299 $280 $399 $430 $446 40.2% 7.0%
District of Columbia $683 $349 $538 $379 $409 $424 -38.0% -9.1%
Iowa $305 $322 $372 $341 $368 $381 25.0% 4.6%
Nevada $153 $173 $151 $212 $228 $237 54.7% 9.1%
West Virginia $211 $202 $297 $211 $228 $236 12.1% 2.3%
Mississippi $165 $163 $288 $196 $212 $219 32.6% 5.8%
Delaware $126 $80 $170 $195 $210 $218 72.8% 11.6%
Maine $115 $281 $270 $173 $186 $193 68.1% 10.9%
Hawaii $255 $379 $317 $161 $173 $179 -29.8% -6.8%
New Hampshire $118 $135 $116 $133 $143 $149 25.8% 4.7%
New Mexico $85 $128 $77 $108 $117 $121 42.6% 7.4%
Vermont $64 $68 $78 $66 $72 $74 16.3% 3.1%
Idaho $324 $40 $561 $55 $59 $61 -81.0% -28.3%
Alaska $60 $37 $76 $49 $53 $55 -9.8% -2.0%
Nebraska $42 $105 $87 $47 $50 $52 24.8% 4.5%
North Dakota $33 $32 $30 $40 $43 $45 33.5% 5.9%
Puerto Rico $9 $17 $28 $26 $28 $29 233.9% 27.3%
Rhode Island $10 $15 $22 $21 $22 $23 143.6% 19.5%
Montana $43 $43 $14 $18 $19 $20 -54.1% -14.4%
South Dakota $21 $7 $29 $8 $9 $9 -57.5% -15.7%
Wyoming $2 $2 $5 $4 $4 $4 123.1% 17.4%
Gross exports $90,190 $98,825 $117,308 $128,312 $138,297 $143,338 58.9% 9.7%
Source: Deloitte Analysis based on data from the US Census Bureau, www.census.gov; the US Bureau of Labor Statistics, www.bls.gov; and the US Bureau of Economic Analysis, www.bea.gov; and the US Office of Personnel Management, www.opm.gov
17
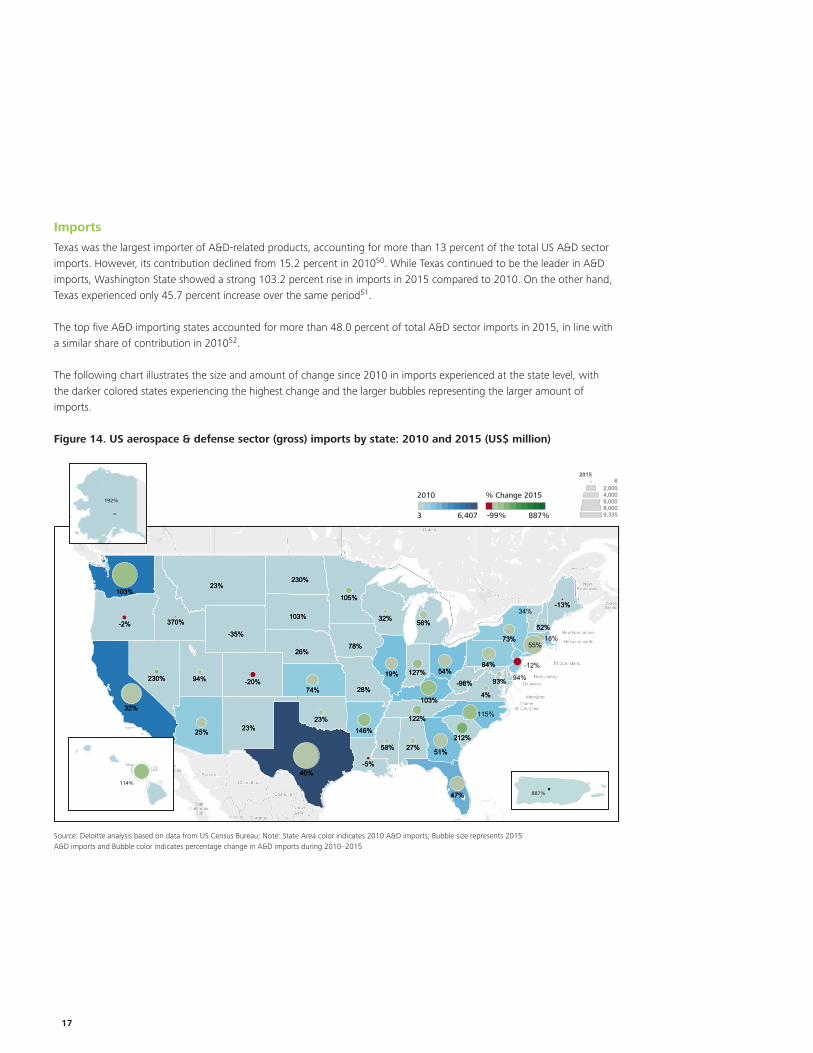
Imports
Texas was the largest importer of A&D-related products, accounting for more than 13 percent of the total US A&D sector imports. However, its contribution declined from 15.2 percent in 201050. While Texas continued to be the leader in A&D imports, Washington State showed a strong 103.2 percent rise in imports in 2015 compared to 2010. On the other hand, Texas experienced only 45.7 percent increase over the same period51.
The top five A&D importing states accounted for more than 48.0 percent of total A&D sector imports in 2015, in line with a similar share of contribution in 201052.
The following chart illustrates the size and amount of change since 2010 in imports experienced at the state level, with the darker colored states experiencing the highest change and the larger bubbles representing the larger amount of imports.
Figure 14. US aerospace & defense sector (gross) imports by state: 2010 and 2015 (US$ million)
Source: Deloitte analysis based on data from US Census Bureau; Note: State Area color indicates 2010 A&D imports; Bubble size represents 2015 A&D imports and Bubble color indicates percentage change in A&D imports during 2010–2015
105%
146%
370%
230%
230%
212%
103%
122%
103%
-35%
-20%
-13%
-98%
78%
74%
93%
56%
58%
28%
27%
26%
23%
73%
25%
54%
23%
84%
32%
47%
46%
94%
34%
51%
19%
32%
23%
-5%
-2%
4%
105%
146%
370%
230%
230%
212%
103%
122%
103%
-35%
-20%
-13%
-98%
78%
74%
93%
56%
58%
28%
27%
26%
23%
73%
25%
54%
23%
84%
32%
47%
46%
94%
34%
51%
19%
32%
23%
-5%
-2%
4%
-99% 887%
% Change 201..
3 6,407
201020156
2,0004,0006,0008,0009,335105%
146%
370%
230%
230%
212%
103%
122%
103%
-35%
-20%
-13%
-98%
78%
74%
93%
56%
58%
28%
27%
26%
23%
73%
25%
54%
23%
84%
32%
47%
46%
94%
34%
51%
19%
32%
23%
-5%
-2%
4%
105%
146%
370%
230%
230%
212%
103%
122%
103%
-35%
-20%
-13%
-98%
78%
74%
93%
56%
58%
28%
27%
26%
23%
73%
25%
54%
23%
84%
32%
47%
46%
94%
34%
51%
19%
32%
23%
-5%
-2%
4%
-99% 887%
% Change 201..
3 6,407
201020156
2,0004,0006,0008,0009,335
2010
3 6,407 -99% 887%
% Change 2015
127%
103%
146%
230%
105%
370%
230%
212%
103%
122%
103%
-20%
-35%
-13%
-98%
78%
74%93%
56%
58%
28%
27%
26%
52%
23%
73%
25%
54%
23%
84%
32%
47%
51%
46%
94%
23%
19%
32%
-5%
-2%
4%
115%
127%
103%
146%
230%
105%
370%
230%
212%
103%
122%
103%
-20%
-35%
-13%
-98%
78%
74%93%
56%
58%
28%
27%
26%
52%
23%
73%
25%
54%
23%
84%
32%
47%
51%
46%
94%
23%
19%
32%
-5%
-2%
4%
34%
55%18%
-12%
94%
2010 & 2015_v2
-99% 887%
% Change 2010..
3 6,407
2010
20156
2,0004,0006,0008,0009,335
Map based on Longitude (generated) and Longitude (generated) and Latitude (generated) and Latitude (generated). Details are shown for State. For pane Longitude (generated): Color showssum of 2010. For pane Longitude (generated) (2): Color shows sum of % Change 2010 - 2015. Size shows sum of 2015. The marks are labeled by sum of % Change 2010 - 2015.
192%192%
192%192%
192%
887%
146%
114%
230%
887%
212%
122%
-20% -98%
27%
25%
32%
94%
47%
51%
19%
74%
58%
28%
23%23%
46%
94%
-5%
4%
146%
114%
230%
887%
212%
122%
-20% -98%
27%
25%
32%
94%
47%
51%
19%
74%
58%
28%
23%23%
46%
94%
-5%
4%
114%
US Aerospace & Defense Export Competitiveness 2016 18
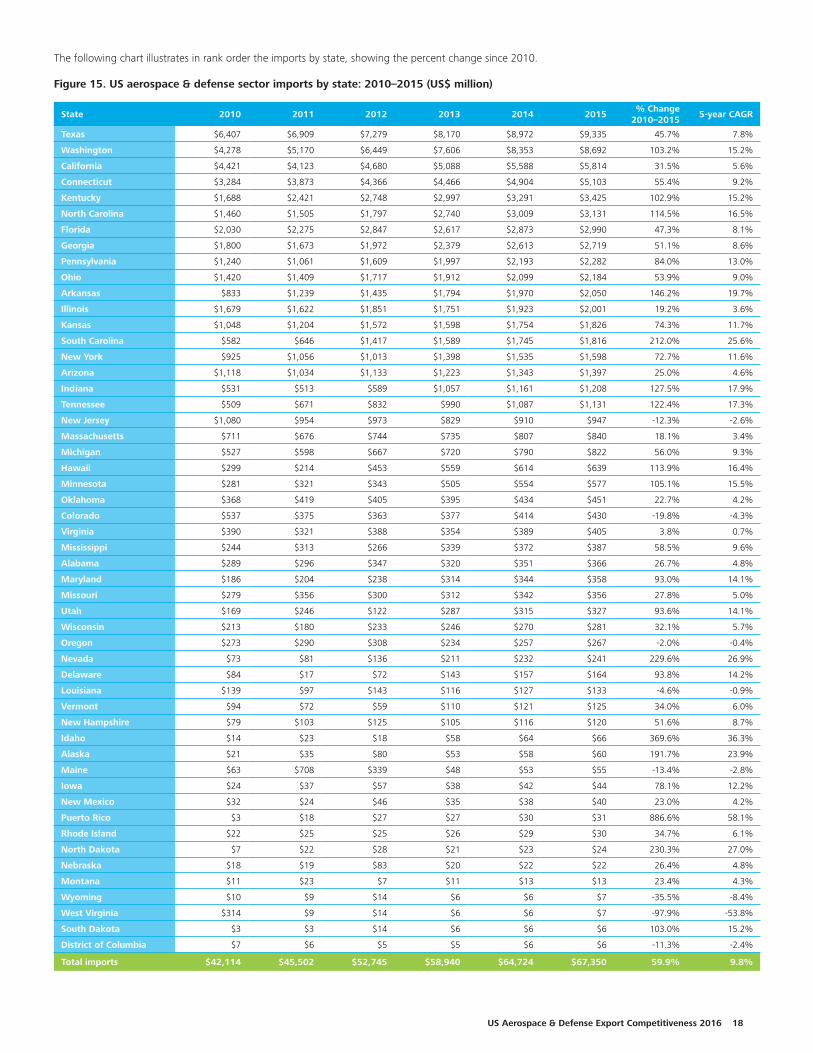
The following chart illustrates in rank order the imports by state, showing the percent change since 2010.
Figure 15. US aerospace & defense sector imports by state: 2010–2015 (US$ million)
State 2010 2011 2012 2013 2014 2015% Change
2010–20155-year CAGR
Texas $6,407 $6,909 $7,279 $8,170 $8,972 $9,335 45.7% 7.8%
Washington $4,278 $5,170 $6,449 $7,606 $8,353 $8,692 103.2% 15.2%
California $4,421 $4,123 $4,680 $5,088 $5,588 $5,814 31.5% 5.6%
Connecticut $3,284 $3,873 $4,366 $4,466 $4,904 $5,103 55.4% 9.2%
Kentucky $1,688 $2,421 $2,748 $2,997 $3,291 $3,425 102.9% 15.2%
North Carolina $1,460 $1,505 $1,797 $2,740 $3,009 $3,131 114.5% 16.5%
Florida $2,030 $2,275 $2,847 $2,617 $2,873 $2,990 47.3% 8.1%
Georgia $1,800 $1,673 $1,972 $2,379 $2,613 $2,719 51.1% 8.6%
Pennsylvania $1,240 $1,061 $1,609 $1,997 $2,193 $2,282 84.0% 13.0%
Ohio $1,420 $1,409 $1,717 $1,912 $2,099 $2,184 53.9% 9.0%
Arkansas $833 $1,239 $1,435 $1,794 $1,970 $2,050 146.2% 19.7%
Illinois $1,679 $1,622 $1,851 $1,751 $1,923 $2,001 19.2% 3.6%
Kansas $1,048 $1,204 $1,572 $1,598 $1,754 $1,826 74.3% 11.7%
South Carolina $582 $646 $1,417 $1,589 $1,745 $1,816 212.0% 25.6%
New York $925 $1,056 $1,013 $1,398 $1,535 $1,598 72.7% 11.6%
Arizona $1,118 $1,034 $1,133 $1,223 $1,343 $1,397 25.0% 4.6%
Indiana $531 $513 $589 $1,057 $1,161 $1,208 127.5% 17.9%
Tennessee $509 $671 $832 $990 $1,087 $1,131 122.4% 17.3%
New Jersey $1,080 $954 $973 $829 $910 $947 -12.3% -2.6%
Massachusetts $711 $676 $744 $735 $807 $840 18.1% 3.4%
Michigan $527 $598 $667 $720 $790 $822 56.0% 9.3%
Hawaii $299 $214 $453 $559 $614 $639 113.9% 16.4%
Minnesota $281 $321 $343 $505 $554 $577 105.1% 15.5%
Oklahoma $368 $419 $405 $395 $434 $451 22.7% 4.2%
Colorado $537 $375 $363 $377 $414 $430 -19.8% -4.3%
Virginia $390 $321 $388 $354 $389 $405 3.8% 0.7%
Mississippi $244 $313 $266 $339 $372 $387 58.5% 9.6%
Alabama $289 $296 $347 $320 $351 $366 26.7% 4.8%
Maryland $186 $204 $238 $314 $344 $358 93.0% 14.1%
Missouri $279 $356 $300 $312 $342 $356 27.8% 5.0%
Utah $169 $246 $122 $287 $315 $327 93.6% 14.1%
Wisconsin $213 $180 $233 $246 $270 $281 32.1% 5.7%
Oregon $273 $290 $308 $234 $257 $267 -2.0% -0.4%
Nevada $73 $81 $136 $211 $232 $241 229.6% 26.9%
Delaware $84 $17 $72 $143 $157 $164 93.8% 14.2%
Louisiana $139 $97 $143 $116 $127 $133 -4.6% -0.9%
Vermont $94 $72 $59 $110 $121 $125 34.0% 6.0%
New Hampshire $79 $103 $125 $105 $116 $120 51.6% 8.7%
Idaho $14 $23 $18 $58 $64 $66 369.6% 36.3%
Alaska $21 $35 $80 $53 $58 $60 191.7% 23.9%
Maine $63 $708 $339 $48 $53 $55 -13.4% -2.8%
Iowa $24 $37 $57 $38 $42 $44 78.1% 12.2%
New Mexico $32 $24 $46 $35 $38 $40 23.0% 4.2%
Puerto Rico $3 $18 $27 $27 $30 $31 886.6% 58.1%
Rhode Island $22 $25 $25 $26 $29 $30 34.7% 6.1%
North Dakota $7 $22 $28 $21 $23 $24 230.3% 27.0%
Nebraska $18 $19 $83 $20 $22 $22 26.4% 4.8%
Montana $11 $23 $7 $11 $13 $13 23.4% 4.3%
Wyoming $10 $9 $14 $6 $6 $7 -35.5% -8.4%
West Virginia $314 $9 $14 $6 $6 $7 -97.9% -53.8%
South Dakota $3 $3 $14 $6 $6 $6 103.0% 15.2%
District of Columbia $7 $6 $5 $5 $6 $6 -11.3% -2.4%
Total imports $42,114 $45,502 $52,745 $58,940 $64,724 $67,350 59.9% 9.8%
19
Scope and methodology
The scope of this study includes aerospace and defense sector products such as commercial and military aircrafts, as well as naval platforms, military land vehicles, arms, armaments, defense-contracting services, and several other related categories. The following US-based categories were specifically included in our study:
• Military, civil passenger, freight, and general aviation aircrafts, space-crafts, launch vehicles, military land and naval platforms, missiles, munitions, arms, and armaments.
• Command, control, communications, computing, intelligence, surveillance, reconnaissance (C4ISR), security, mission software, and government contracting services.
• Other related supply chain portions of the sector.
It is important to note that the activities included within the scope of this study primarily focus on the sector that serves the US government defense subsector, as well as the commercial aircraft, general aviation, and commercial space subsectors. Commercial airlines are not included in the scope of this study.
The analysis in this study is based on inputs from various sources, including the US Census Bureau, the US Bureau of Labor Statistics, the US Bureau of Economic Analysis, USA Trade Online, and UN Comtrade International Trade Statistics Database. The data was assessed for the years 2010 through 2015, except where noted.
The foreign trade division of the US Census Bureau reports export and import trade statistics by NAICS code at a national level. Total values were identified for exports and imports for each manufacturing-related six-digit NAICS code and state-level trade information at a four-digit NAICS code level.
US Aerospace & Defense Export Competitiveness 2016 20
Sources
1 Deloitte Analysis based on data from US Census Bureau www.census.gov
2 Deloitte Analysis based on historical export data (2008 to 2015) from US Census Bureau www.census.gov; and UN Comtrade comtrade.un.org; actual and projected aircraft delivery data (2008 to 2016 E) from The Boeing Company www.boeing.com
3 Deloitte Analysis based on data from US Census Bureau www.census.gov
4 Ibid
5 Ibid
6 Ibid
7 Ibid
8 Deloitte Analysis based on data from US Census Bureau www.census.gov; US Bureau of Labor Statistics www.bls.gov; US Bureau of Economic Analysis www.bea.gov; and US Office of Personnel Management www.opm.gov
9 Ibid
10 Deloitte Analysis based on data from US Census Bureau www.census.gov
11 Ibid
12 Ibid
13 Deloitte Analysis based on data from Stockholm International Peace Research Institute (SIPRI) www.sipri.org and UN Comtrade comtrade.un.org
14 Ibid
15 Deloitte Analysis based on data from US Census Bureau www.census.gov
16 Deloitte Analysis based on data from US Census Bureau www.census.gov; US Bureau of Labor Statistics www.bls.gov; US Bureau of Economic Analysis www.bea.gov; and US Office of Personnel Management www.opm.gov
17 Deloitte Analysis based on data from US Census Bureau www.census.gov and UN Comtrade comtrade.un.org
18 Deloitte Analysis based on data from US Census Bureau www.census.gov
19 Ibid
20 Ibid
21 Ibid
22 Ibid
23 Ibid
24 Ibid
25 Ibid
26 Deloitte Analysis based on data from Stockholm International Peace Research Institute (SIPRI) www.sipri.org
27 Ibid
28 Deloitte Analysis based on data from UN Comtrade comtrade.un.org
29 Ibid
30 Ibid
31 Deloitte Analysis based on data from US Census Bureau www.census.gov
32 Ibid
33 Ibid
34 Ibid
35 Ibid
36 Ibid
37 Ibid
38 Ibid
39 Ibid
40 Ibid
41 Ibid
42 Ibid
43 Ibid
44 Ibid
45 Ibid
46 Deloitte Analysis based on data from US Census Bureau, www.census.gov; US Bureau of Labor Statistics, www.bls.gov; US Bureau of Economic Analysis, www.bea.gov; and US Office of Personnel Management, www.opm.gov
47 Ibid
48 Ibid
49 Ibid
50 Ibid
51 Ibid
52 Ibid

2121
Contact
Tom CaptainVice Chairman Aerospace & Defense Sector Leader Deloitte LLP +1 206 716 6452 [email protected]
AcknowledgementsThe leadership thanks Aijaz Hussain, Aerospace & Defense Sector Research Leader from the Deloitte Center for Industry Insights, for his significant contribution towards the ideation, research, analysis, and writing of this report. Also thanks to Siddhant Mehra, Deloitte Support Services India Private Limited.
About the Deloitte Center for Industry InsightsThe Deloitte Center for Industry Insights provides premier insights based on primary research on the most prevalent issues facing the consumer business and manufacturing industries to help companies run effectively and achieve superior business results. The Center is associated with the Deloitte US firm’s Consumer & Industrial Products practice, which benefits from the insights of over 12,000 multi-disciplined professionals with a wide array of deep, hands-on industry experience.
About Deloitte Deloitte refers to one or more of Deloitte Touche Tohmatsu Limited, a UK private company limited by guarantee (“DTTL”), its network of member firms, and their related entities. DTTL and each of its member firms are legally separate and independent entities. DTTL (also referred to as “Deloitte Global”) does not provide services to clients. Please see www.deloitte.com/about for a detailed description of DTTL and its member firms. Please see www.deloitte.com/us/about for a detailed description of the legal structure of Deloitte LLP and its subsidiaries. Certain services may not be available to attest clients under the rules and regulations of public accounting.
Deloitte provides audit, tax, consulting, and financial advisory services to public and private clients spanning multiple industries. With a globally connected network of member firms in more than 150 countries and territories, Deloitte brings world-class capabilities and high-quality service to clients, delivering the insights they need to address their most complex business challenges. Deloitte’s more than 200,000 professionals are committed to becoming the standard of excellence.
This publication contains general information only and Deloitte is not, by means of this publication, rendering accounting, business, financial, investment, legal, tax, or other professional advice or services. This publication is not a substitute for such professional advice or services, nor should it be used as a basis for any decision or action that may affect your business. Before making any decision or taking any action that may affect your business, you should consult a qualified professional advisor.
Deloitte shall not be responsible for any loss sustained by any person who relies on this publication.
Copyright © 2016 Deloitte Development LLC. All rights reserved. Member of Deloitte Touche Tohmatsu Limited