2014 global aerospace and defense sector financial ... · growth slowing; strong commercial...
TRANSCRIPT
July 2014
2014 Global aerospace and defense sector financial performance study Growth slowing; strong commercial aerospace; continued contraction in defense
2014 Global aerospace and defense sector financial performance study
Contents
Executive summary 1
Summary of key 2013 financial performance measures 5
Scope of the study 9
Detailed 2013 global aerospace and defense (A&D) industry performance 12
U.S. compared with European A&D companies 29
Commercial compared with defense subsector performance 33
Segment performance 35
Summary A&D sector performance figures 37
Study methodology 41
Contact 50
References 51
Executive summary
2014 Global aerospace and defense sector financial performance study 1
Executive summary
The Deloitte Touche Tohmatsu Limited’s (DTTL) Global Manufacturing Industry group analyzed the 2013 financial performance of 100 major global aerospace and defense (A&D) companies using information from public company filings and press releases. The key financial indicators studied include sales revenue, operating earnings, and operating margin. The results presented in this study reveal important observations about the overall global A&D industry.
Global aerospace and defense sector growth slowed down in 2013. The global A&D sector revenue growth rate from 2012 to 2013 declined, from 5.9 percent to 3.1 percent. Despite the slowdown, the industry still added US$21.4 billion in revenues, which is the second largest annual increase over the last five years. Total global industry revenues exceeded US$700 billion, an overall record with improved operating efficiencies, higher profits, and higher margins. This is the second year in a row that sector growth was above global GDP growth, which in 2013 was 2.4 percent.1 Rate increases
for commercial aerospace, new product introductions, and a flattening of government defense spending rates in the United States (U.S.) and Europe over the next few years are expected.2 Therefore, it is likely that above average revenue growth will continue, if not accelerate slightly in 2014, driven largely from anticipated growth in the commercial aerospace sector.
U.S defense subsector slowdown is a key contributor. The decline in total revenue of the U.S. defense subsector significantly contributed to decreased global revenue growth. The revenues of the top 20 U.S. defense contractors’ declined by US$5.8 billion, or 2.5 percent. This decrease was attributed to a continued decline in funding outlays by the U.S. Department of Defense, the largest subsector customer, whose budget decreased by 4.4 percent in 2013.3 Of the top 20, only three U.S. defense contractors experienced revenue growth. However, with escalation of tensions in the Middle East and other global conflict areas, several countries outside of the U.S. are expected to increase defense spending. The U.S. is likely to start increasing defense spending by 2017, barring unexpected global security events and military actions, which might lead to increases.4
Commercial aerospace growth slowed from “ultra-fast” to merely “very fast”. The global commercial aerospace subsector grew by 9.8 percent, with 85 more large commercial aircraft delivered in 2013. This compares to an unprecedented 16.1 percent subsector growth in 2012, when 178 additional aircraft were delivered, compared to 2011.5 The Boeing Company and Airbus Group alone added US$11 billion in additional revenue in 2013, down from US$20.5 billion of incremental growth in 2012. It is estimated that 100 more aircraft will likely be delivered in 2014, with an expected return to higher revenue growth rates, albeit lower than in 2012. Key questions raised
2
are whether the lower number of deliveries in 2013 is the beginning of a longer-term slowdown, and, is the often-cited order backlog “bubble” bursting? We believe long-term increases in demand for travel, especially in China, India and the Middle East, as well as the need for more fuel-efficient aircraft, appear to support the view that aircraft sales demand and production volume will likely continue to grow. Additionally, should there be future increases in oil prices, fuel-efficient aircraft sales demand may increase.6
Top 10 global A&D company rankings have changed from 2012, reflecting commercial aerospace growth. In terms of sales revenues, United Technologies Corporation has moved up the list to the fourth spot with General Dynamics, now in fifth position. Rolls-Royce has also moved up in ranking to the eighth spot ahead of Raytheon, which is now ninth. Finmeccanica S.p.A has dropped off the top 10 list, while GE Aerospace remains in the tenth position. These ranking movements reflect the rising fortunes of commercial aerospace including significant revenue increases in the supplier base, which has resulted from commercial aircraft production increases. Additionally, it reflects declining growth in global defense spending experienced over the last few years. Indeed, faster growth in commercial aerospace is driving this subsector towards a larger share within the overall sector. At the current rate of growth, it is expected that the commercial aerospace subsector will likely reach parity with the defense subsector in terms of contribution to total A&D sector revenues for the first time by 2016, barring the unexpected. 7
Although U.S. companies continue to dominate, the A&D sector is becoming more global. U.S.-based sector companies comprise 59 percent of revenues for the global A&D industry. European headquartered companies represent 34.2 percent of total revenues, while the balance is shared by companies headquartered in Japan, Canada, Brazil, and other countries. Although this geographic makeup has been relatively constant for the past few years, over the longer term U.S. dominance has declined as the growth of non-U.S.-based A&D companies continues. With globalization increasing across the sector, many
companies are designing, manufacturing, and selling some of their products in non-domestic markets. Thus, the comparison of revenues based on a company’s headquarter location will likely become less important, as compared to where revenues are generated. Many U.S. and European companies today have invested in manufacturing operations in China, Poland, Mexico, and North Africa, as well as other geographies. This is significant because in those countries, no major publically held A&D companies are headquartered, yet tens of thousands of workers are employed in the sector. Many European companies are generating increased revenues in the U.S., Middle East, and other geographies. Similarly, U.S. companies are generating increased revenues in Australia, India, Saudi Arabia, United Arab Emirates (UAE), Japan, South Korea, and other non-domestic markets.
Europe is gaining momentum in revenue growth, but losing some ground in profitability. The European A&D sector revenue growth rate of 5.4 percent exceeded the U.S revenue growth rate of 1.3 percent. This was partly attributable to negative revenue performance of the U.S. defense subsector as cited above, as well as the heavy weighting of Airbus Group, whose profitability grew by 4.9 percent. However, despite higher revenue growth rates, European companies lagged U.S. companies in profitability with a 3.6 percent decline in earnings in 2013, as compared to an 11.6 percent increase in operating profits for U.S. companies. This shortfall resulted partly from certain European companies reporting most of the sector impairment charges, which was close to 70 percent of the global non-recurring A&D write-offs in 2013, plus continued below average core operating performance.
Profitability is improving across the global A&D industry. A&D sector earnings, a key financial performance indicator, outpaced revenue growth globally. The sector added US$5.1 billion in global profits, reaching a record US$62.6 billion. Commercial aerospace grew earnings by 15.7 percent, because of more aircraft delivered at lower costs. Defense companies grew earnings by 3.6 percent despite the revenue decline cited above, which was mostly the result of anticipatory cost cuts. In
Executive summary
2014 Global aerospace and defense sector financial performance study 3
addition, profitability was not uniform across the different segment and supplier tiers. Original equipment manufacturers (OEMs) and platform companies generally experienced significantly lower margins than their suppliers. For example, top performing engine and avionics tier one suppliers can routinely earn close to 20 percent operating profit margins. Conversely, the services segment and tier three suppliers typically lag A&D sector averages in profitability. Global earnings would likely have been much higher, but for one-time charges – see below.
Impairment charges have returned. One-time earnings charges have increased for the second year in a row, with approximately US$5.6 billion in one-time charges in 2013. The two most significant one-time charges occurred at BAE Systems plc (minus US$1.388 billion charge) and Finmeccanica S.p.A (minus US$1.085 billion charge). One-time write-offs mostly resulted from a variety of factors, including difficult conditions caused by the U.S. defense slowdown, the complexity of new product development, challenged program execution, and asset impairment. It is expected the environment of complex product development and uncertain market dynamics could likely result in a certain level of impairments and one-time charges in the future, however those levels are difficult to forecast. Program performance continues to be a key management challenge of the global A&D industry.
Europe still lags the U.S. in profit margin performance. There are still large differences between the U.S. and Europe in operating margins, with the U.S. at 11.0 percent in 2013 and 10.0 percent in 2012. This is compared to Europe at 5.6 percent in 2013 and 6.2 percent in 2012 in operating margin performance. Airbus Group, with operating margins of 3.4 percent in 2013, is the largest A&D company in Europe, while The Boeing Company, with margins of 7.6 percent in 2013, is the largest U.S. A&D company. This difference serves as a reasonable proxy for gaps between U.S and European profit margin performance, which has existed for several years. It brings into focus the efficiency of the cost and asset base and the comparative ability of the European A&D sector to rationalize assets and reduce operating
expenses. In the European A&D sector, country specific defense budgets supporting the individual country industrial base may not be large enough to achieve competitive efficiencies. Thus, the European A&D sector may benefit from a certain level of regional consolidation in order to gain scale economies, should that coincide with national employment and defense policies.
A&D sector share prices outpaced global equity indices. In 2013, despite the fall in defense subsector revenues and the slowing pace of growth in commercial aerospace, A&D sector share prices continued to advance at a significantly greater rate than most of the global averages. U.S.-based A&D sector companies outpaced the Dow Jones Industrials and Standard & Poor’s 500 averages at 39.4 percent versus. 28.1 percent and 31.8 percent respectively.8 European A&D companies outpaced the STOXX 600 index, 41.4 percent to 17.3 percent.9 Likely contributors to share price increases for commercial aerospace include the continued increased demand for commercial air travel, increased demand for fuel efficient aircraft, greater subsector profit margins, increased generation of free cash flow, and an expectation of continued above average growth prospects for the subsector.
Bottom line: Still a tale of two subsectors with better than average growth performance and outlook. For the commercial aerospace subsector, as The Boeing Company and Airbus Group goes because of their relative weighting, so does the A&D sector. For the defense subsector, U.S. defense contractors are driving the overall global performance because of their relative weighting. Overall, financial performance is heavily influenced by the concentrated nature of the sector where the top 20 global A&D companies make up 74.0 percent of the total global A&D sector revenues. Defense continues to be impacted by lower sales volume, while commercial aerospace continues to grow due to increased travel and demand for more fuel-efficient aircraft. The overall A&D sector slowed down in 2013 but still had revenue growth of 3.1 percent, which was above global GDP growth at 2.4 percent.11 The Global A&D industry in 2013 has improved operating efficiencies, resulting in higher profits and margins. A slightly higher growth rate is anticipated for 2014 likely due to increased commercial aerospace revenues, and a slowdown in the rate of decline for the defense subsector.12 Figure 1 represents a summary of the key drivers of A&D sector revenue and earnings performance.
4
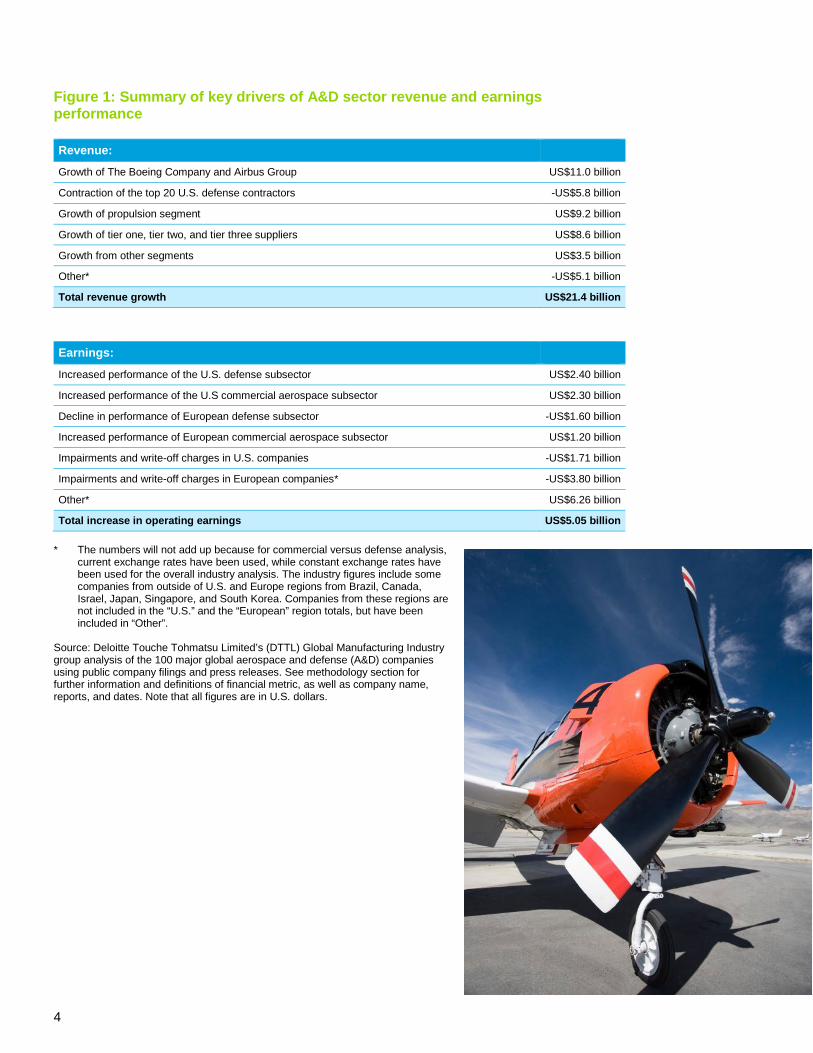
Figure 1: Summary of key drivers of A&D sector revenue and earnings performance Revenue:
Growth of The Boeing Company and Airbus Group US$11.0 billion
Contraction of the top 20 U.S. defense contractors -US$5.8 billion
Growth of propulsion segment US$9.2 billion
Growth of tier one, tier two, and tier three suppliers US$8.6 billion
Growth from other segments US$3.5 billion
Other* -US$5.1 billion
Total revenue growth US$21.4 billion
Earnings:
Increased performance of the U.S. defense subsector US$2.40 billion
Increased performance of the U.S commercial aerospace subsector US$2.30 billion
Decline in performance of European defense subsector -US$1.60 billion
Increased performance of European commercial aerospace subsector US$1.20 billion
Impairments and write-off charges in U.S. companies -US$1.71 billion
Impairments and write-off charges in European companies* -US$3.80 billion
Other* US$6.26 billion
Total increase in operating earnings US$5.05 billion * The numbers will not add up because for commercial versus defense analysis,
current exchange rates have been used, while constant exchange rates have been used for the overall industry analysis. The industry figures include some companies from outside of U.S. and Europe regions from Brazil, Canada, Israel, Japan, Singapore, and South Korea. Companies from these regions are not included in the “U.S.” and the “European” region totals, but have been included in “Other”.
Source: Deloitte Touche Tohmatsu Limited’s (DTTL) Global Manufacturing Industry group analysis of the 100 major global aerospace and defense (A&D) companies using public company filings and press releases. See methodology section for further information and definitions of financial metric, as well as company name, reports, and dates. Note that all figures are in U.S. dollars.
Summary of key 2013 financial performance measures
2014 Global aerospace and defense sector financial performance study 5
Summary of key 2013 financial performance measures
• Revenues: The global A&D sector’s revenues grew to US$706 billion in 2013, recording an increase of 3.1 percent, as compared to revenue growth of 5.9 percent in 2012 and 1.6 percent in 2011.13 This represents a decrease of 280 basis points of growth year over year (YoY), but a nominal US$21.4 billion increase in global A&D sector revenues and the second largest nominal increase in the last five years.
– In 2013, U.S. A&D companies’ revenues increased 1.3 percent with the significant increases driven by Boeing Commercial Aircraft, and a minus 2.5 percent originating from the top 20 U.S. defense companies. This is compared to a 5.4 percent increase in revenues for European companies, driven primarily by Airbus Group commercial aircraft deliveries.
– The OEM segment’s revenues were bifurcated, with Airbus Group and The Boeing Company growing together at 5.5 percent, representing US$11 billion of growth, while top defense platform providers’ revenues declined. This resulted in a combined total OEM growth of 1.9 percent reflects the weighted impact of defense on the combined average.
• Earnings: Reported A&D sector operating earnings increased 8.8 percent to US$62.6 billion in 2013 from US$57.6 billion in 2012. With strong profit growth, especially among propulsion equipment manufacturers and commercial aircraft manufacturers, this more than offset the combined non-recurring A&D-related company charges of US$5.56 billion in 2013. If not for these one-time charges, A&D sector reported earnings
would have increased by US$10.6 billion, a record performance in the last five years, or US$5.6 billion compared YoY in a similar fashion. Continuing with this theme of comparison, earnings-related metrics are presented two ways including reported earnings and core earnings. The latter is used to illustrate the elimination of the impact of one-time write-offs on financial performance.
– U.S. companies’ reported operating earnings increased 11.6 percent in 2013. European A&D companies’ operating profits decreased by 3.6 percent and accounted for nearly 70.0 percent of non-recurring charges.
– Services and electronics segments’ operating earnings decreased 19.1 percent and 3.4 percent respectively, likely due to non-recurring charges of US$1.6 billion recorded by services oriented companies in 2013.
– OEMs and the propulsion segments’ growth in operating earnings reflects the strong commercial market, which also makes up for the declining defense subsector, despite the write-off of nearly US$3.0 billion in non-recurring charges in 2013.
– Excluding the impact of non-recurring charges, the A&D sector’s core operating earnings increased by 8.1 percent to US$68.2 billion in 2013 from US$62.9 billion in 2012.
– Four companies accounted for nearly 60.0 percent of the global A&D sector’s US$5.56 billion non-recurring A&D- related charges in 2013: BAE Systems,
6
Finmeccanica S.p.A, QinetiQ, and Lockheed Martin.
– Based on geography, European companies’ core operating profits increased by 7.2 percent in 2013 to US$17.4 billion from US$16.1 billion in 2012. On the other hand, U.S. companies’ core operating profits increased by 6.8 percent in 2013 to US$47.3 billion in 2013 from US$44.3 billion in 2012. U.S. earnings accounted for 72.8 percent of total global earnings.
– Excluding the approximately US$3.0 billion in non-recurring charges, the OEM segment’s core operating earnings increased 6.2 percent YoY in 2013.
• Margins: Reported A&D sector operating margins increased 43 basis point (bps) to 8.9 percent in 2013, from 8.4 percent in 2012. This was the result of strong profit growth, especially in the propulsion equipment. Also, commercial aircraft manufacturing margins more than offset the combined non-recurring A&D related charges.
– U.S. A&D companies reported an 11.0 percent operating margin in 2013, compared to European companies’ 5.6 percent.
– Core operating margin increased by 42 bps to 9.7 percent in 2013 for the global A&D sector.
– Excluding the impact of one-time charges, core-operating margins for U.S. companies were 11.4 percent, still higher than their European counterparts at 7.2 percent.
• Return on invested capital (ROIC): Reported A&D sector ROIC for 2013 declined to 17.0 percent compared to 18.8 percent in 2012, down 176 bps. Core ROIC, however, improved compared to 2012, with an 87 bps increase to 20.4 percent in 2013 versus 19.6 percent in 2012.
• Free Cash Flow (FCF): A&D sector FCF increased 6.2 percent to US$50 billion in 2013, compared to US$47.0 billion in 2012. This is the result of A&D companies’
revenue and operating cash flow growth, especially in commercial aerospace. The FCF increase more than offset decreases in government defense spending or redeployment of cash for acquisitions and non-operating areas, such as higher pension contributions.
• Free Cash Margin (FCM): A&D sector FCM decreased 49 bps to 5.1 percent in 2013 compared to 5.5 percent in 2012, likely due to a 39.5 percent decrease in FCF among European A&D companies in 2013. European companies including Airbus Group, BAE Systems plc, and Finmeccanica S.p.A. reported negative FCF in 2013 likely as a result of increased investments in property, plant, and equipment (PP&E) or likely due to operational underperformance or the timing of advance payments on large contracts. In 2013, 55 percent of the companies reported FCM of equal to or more than 5.0 percent, while 14 percent reported FCM of 10.0 percent or more.
• Book-to-bill ratio (BTB): As an indicator of future financial performance, A&D sector BTB ratio increased 17.6 percent in 2013 to 1.38 times as compared to 1.18 times in 2012. This was likely due to significant sales order increases for commercial aircraft companies. Airbus Group reported a record BTB ratio of 3.03 times in 2013 with Boeing at 1.59 times. Excluding Airbus Group and The Boeing Company BTBs ratios, the A&D sector BTB ratio would be 0.83 times in 2013 versus 0.84 times in 2012, underscoring the increased impact that growth in commercial aerospace has on the entire global A&D sector.
• OEMs and propulsion segments reported the largest increase in BTBs at 31.7 percent and 39.8 percent respectively, reflecting the increased order books for commercial aircraft. Lower tier suppliers, however reported a decrease in BTB. Tier one suppliers reported a 37.2 percent decline in 2013 at 0.95 times largely because they experienced a high BTB ratio of 1.51 times in 2012.
Summary of key 2013 financial performance measures
2014 Global aerospace and defense sector financial performance study 7
– Some of the top defense companies including Lockheed Martin, L-3 Communications, and Raytheon reported reduced BTB ratios year on year in 2013. Thus, the future revenue outlook for 2014 for defense companies looks less optimistic compared to commercial aerospace.14
– Employment: The A&D sector’s total global employment was essentially flat with a nominal increase of 0.4 percent to approximately 2.04 million in 2013, as compared to 2.03 million in 2012. This figure reveals much slower growth than the increase in revenues and earnings, which helped boost productivity.
• Productivity: The rate at which employees can drive higher profits is an important measure of productivity. This is unaffected by outsourcing plans that tend to skew revenue-per-employee analysis. Labor is a key cost driver of cost of goods sold and a
key driver of efficiency, thus earnings per employee is an effective proxy for a productivity performance metric. Reported operating earnings per employee in 2013 increased 8.3 percent in to US$30,661, as the A&D sector’s total operating earnings rose 8.8 percent compared to a 0.4 percent increase in employees. Core operating earnings per employee grew 7.6 percent, to US$33,384 from US$31,212.
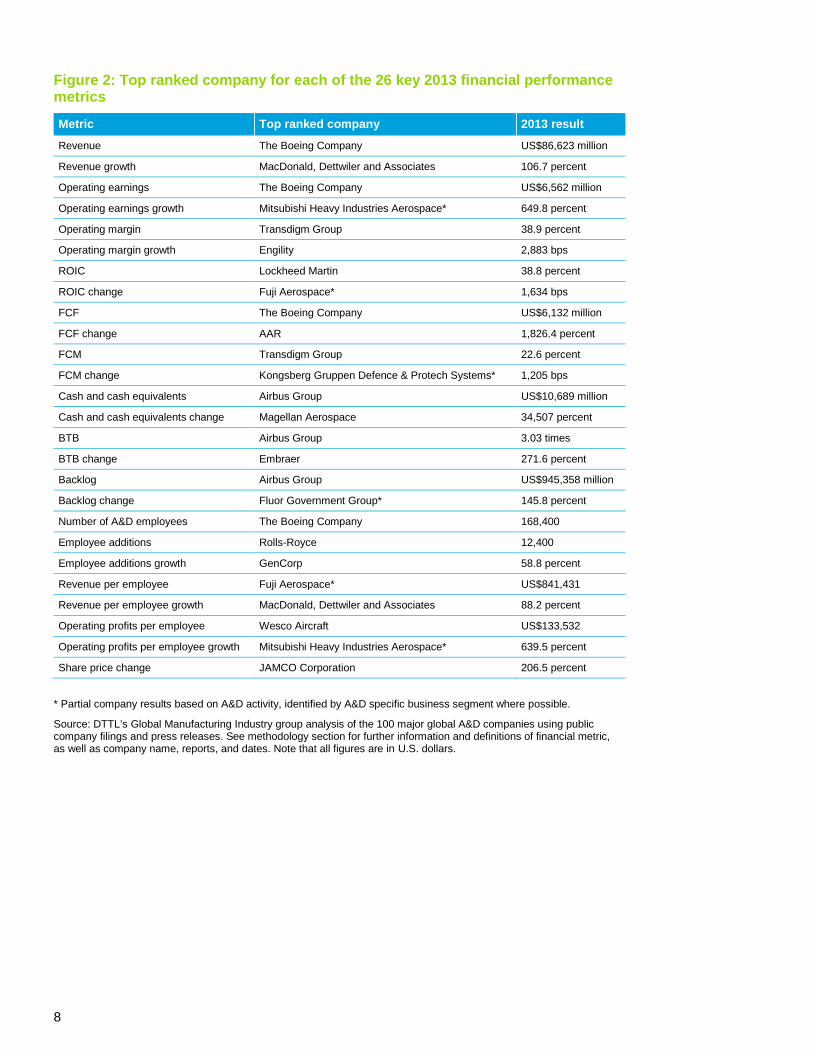
• Summary of top performing companies: Figure 2 lists the companies that are ranked as the top performers in the 26 metrics among the 100 companies in this study, according to the methodology used for this report (see methodology section for more information). Although this is not a financial performance ranking, it does provide some visibility as to the number of times a specific company has been ranked with the highest performance in a given financial metric category.
8
Figure 2: Top ranked company for each of the 26 key 2013 financial performance metrics
Metric Top ranked company 2013 result
Revenue The Boeing Company US$86,623 million
Revenue growth MacDonald, Dettwiler and Associates 106.7 percent
Operating earnings The Boeing Company US$6,562 million
Operating earnings growth Mitsubishi Heavy Industries Aerospace* 649.8 percent
Operating margin Transdigm Group 38.9 percent
Operating margin growth Engility 2,883 bps
ROIC Lockheed Martin 38.8 percent
ROIC change Fuji Aerospace* 1,634 bps
FCF The Boeing Company US$6,132 million
FCF change AAR 1,826.4 percent
FCM Transdigm Group 22.6 percent
FCM change Kongsberg Gruppen Defence & Protech Systems* 1,205 bps
Cash and cash equivalents Airbus Group US$10,689 million
Cash and cash equivalents change Magellan Aerospace 34,507 percent
BTB Airbus Group 3.03 times
BTB change Embraer 271.6 percent
Backlog Airbus Group US$945,358 million
Backlog change Fluor Government Group* 145.8 percent
Number of A&D employees The Boeing Company 168,400
Employee additions Rolls-Royce 12,400
Employee additions growth GenCorp 58.8 percent
Revenue per employee Fuji Aerospace* US$841,431
Revenue per employee growth MacDonald, Dettwiler and Associates 88.2 percent
Operating profits per employee Wesco Aircraft US$133,532
Operating profits per employee growth Mitsubishi Heavy Industries Aerospace* 639.5 percent
Share price change JAMCO Corporation 206.5 percent
* Partial company results based on A&D activity, identified by A&D specific business segment where possible.
Source: DTTL’s Global Manufacturing Industry group analysis of the 100 major global A&D companies using public company filings and press releases. See methodology section for further information and definitions of financial metric, as well as company name, reports, and dates. Note that all figures are in U.S. dollars.
Scope of the study
2014 Global aerospace and defense sector financial performance study 9
Scope of the study
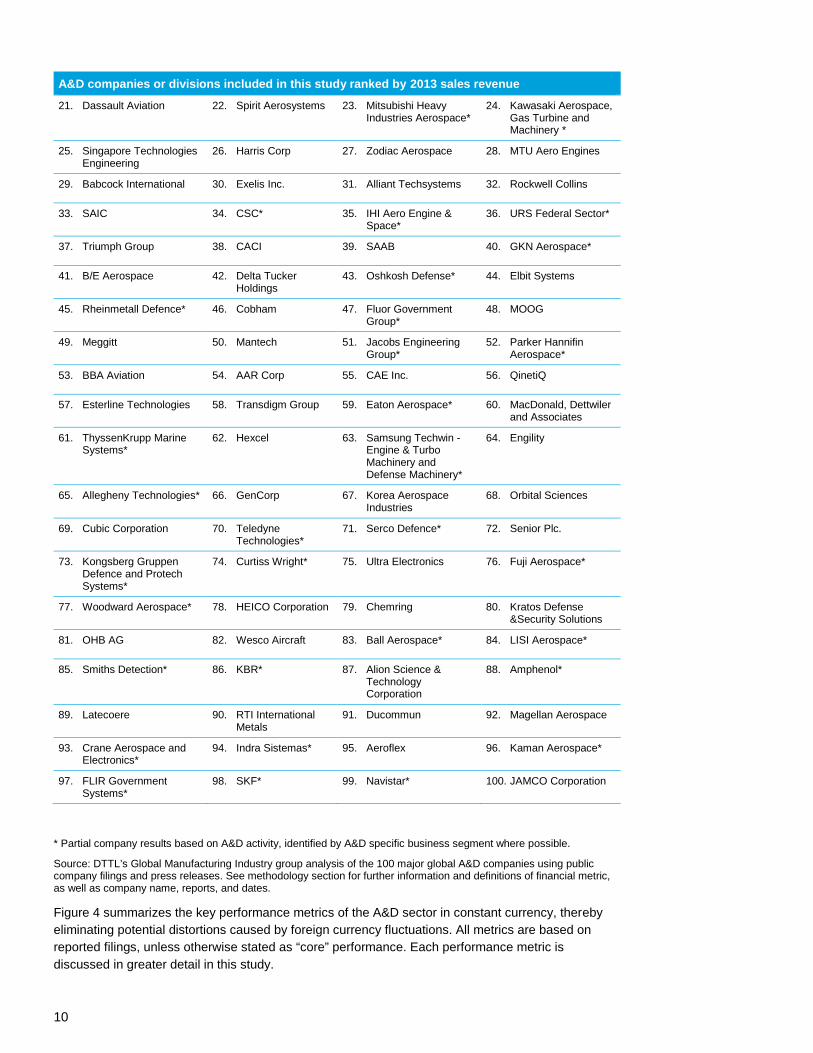
The DTTL Global Manufacturing Industry group’s 2014 Global aerospace and defense sector financial performance study analyzes the top 100 A&D companies or business units of industrial conglomerates with A&D businesses that reported revenue of more than US$500 million in 2013 with financial statements filed by 31 December 2013 unless otherwise specified. Figure 3 below lists the 100 companies and divisions that were analyzed. The study, however, does not include A&D organizations such as government-controlled entities, private companies that do not release public filings, or public companies that do not report A&D business activity information. In addition, certain companies from the previous year’s study were excluded likely due to conformance with study criteria. That is, lower threshold of US$500 million in revenue, companies that were acquired, and companies going private. Please refer to the methodology section for further information that includes the company information used to complete this study.
The study was conducted by assessing performance based on calculating 26 key financial metrics. These include key nominal and growth metrics for revenue, operating earnings, operating margin, return on invested capital (ROIC), free cash flow (FCF), free cash
margin (FCM), book-to-bill (BTB) ratio, employee productivity, and equity market performance. In addition to “reported” financial performance, the report also assess and calculates “core” financial performance to understand underlying operating profit performance, by excluding one-time charges. All financial metrics in the study are based on a constant currency conversion method (unless otherwise stated as “differential method”) to eliminate the impact of foreign exchange fluctuations on companies’ or the A&D sector’s performance. For more information on the conversion method, refer to the methodology section of this report.
Financial performance metrics at the company level are cited throughout this study, especially for the top performing companies and selectively for the lower performers. However, unique metrics for a given company should not be viewed in isolation, as there typically are logical reasons for individual metrics by company, e.g., one time charges, prior year acquisitions, special circumstances, etc. The combined metrics for a given company, taken as a whole, are more likely to form the basis for an overall assessment of the financial performance of the A&D sector, as well as individual companies.
Figure 3: A&D companies included in the analysis
A&D companies or divisions included in this study ranked by 2013 sales revenue
1. The Boeing Company 2. Airbus Group 3. Lockheed Martin 4. United Technologies Corporation*
5. General Dynamics 6. BAE Systems plc 7. Northrop Grumman 8. Rolls-Royce
9. Raytheon 10. GE Aviation* 11. Finmeccanica S.p.A. 12. Safran
13. Thales 14. L-3 Communications
15. Textron 16. Honeywell Aerospace*
17. Bombardier Aerospace* 18. Precision Castparts 19. Huntington Ingalls Industries
20. Embraer
10
A&D companies or divisions included in this study ranked by 2013 sales revenue
21. Dassault Aviation 22. Spirit Aerosystems 23. Mitsubishi Heavy Industries Aerospace*
24. Kawasaki Aerospace, Gas Turbine and Machinery *
25. Singapore Technologies Engineering
26. Harris Corp 27. Zodiac Aerospace 28. MTU Aero Engines
29. Babcock International 30. Exelis Inc. 31. Alliant Techsystems 32. Rockwell Collins
33. SAIC 34. CSC* 35. IHI Aero Engine & Space*
36. URS Federal Sector*
37. Triumph Group 38. CACI 39. SAAB 40. GKN Aerospace*
41. B/E Aerospace 42. Delta Tucker Holdings
43. Oshkosh Defense* 44. Elbit Systems
45. Rheinmetall Defence* 46. Cobham 47. Fluor Government Group*
48. MOOG
49. Meggitt 50. Mantech 51. Jacobs Engineering Group*
52. Parker Hannifin Aerospace*
53. BBA Aviation 54. AAR Corp 55. CAE Inc. 56. QinetiQ
57. Esterline Technologies 58. Transdigm Group 59. Eaton Aerospace* 60. MacDonald, Dettwiler and Associates
61. ThyssenKrupp Marine Systems*
62. Hexcel 63. Samsung Techwin - Engine & Turbo Machinery and Defense Machinery*
64. Engility
65. Allegheny Technologies* 66. GenCorp 67. Korea Aerospace Industries
68. Orbital Sciences
69. Cubic Corporation 70. Teledyne Technologies*
71. Serco Defence* 72. Senior Plc.
73. Kongsberg Gruppen Defence and Protech Systems*
74. Curtiss Wright* 75. Ultra Electronics 76. Fuji Aerospace*
77. Woodward Aerospace* 78. HEICO Corporation 79. Chemring 80. Kratos Defense &Security Solutions
81. OHB AG 82. Wesco Aircraft 83. Ball Aerospace* 84. LISI Aerospace*
85. Smiths Detection* 86. KBR* 87. Alion Science & Technology Corporation
88. Amphenol*
89. Latecoere 90. RTI International Metals
91. Ducommun 92. Magellan Aerospace
93. Crane Aerospace and Electronics*
94. Indra Sistemas* 95. Aeroflex 96. Kaman Aerospace*
97. FLIR Government Systems*
98. SKF* 99. Navistar* 100. JAMCO Corporation
* Partial company results based on A&D activity, identified by A&D specific business segment where possible.
Source: DTTL’s Global Manufacturing Industry group analysis of the 100 major global A&D companies using public company filings and press releases. See methodology section for further information and definitions of financial metric, as well as company name, reports, and dates.
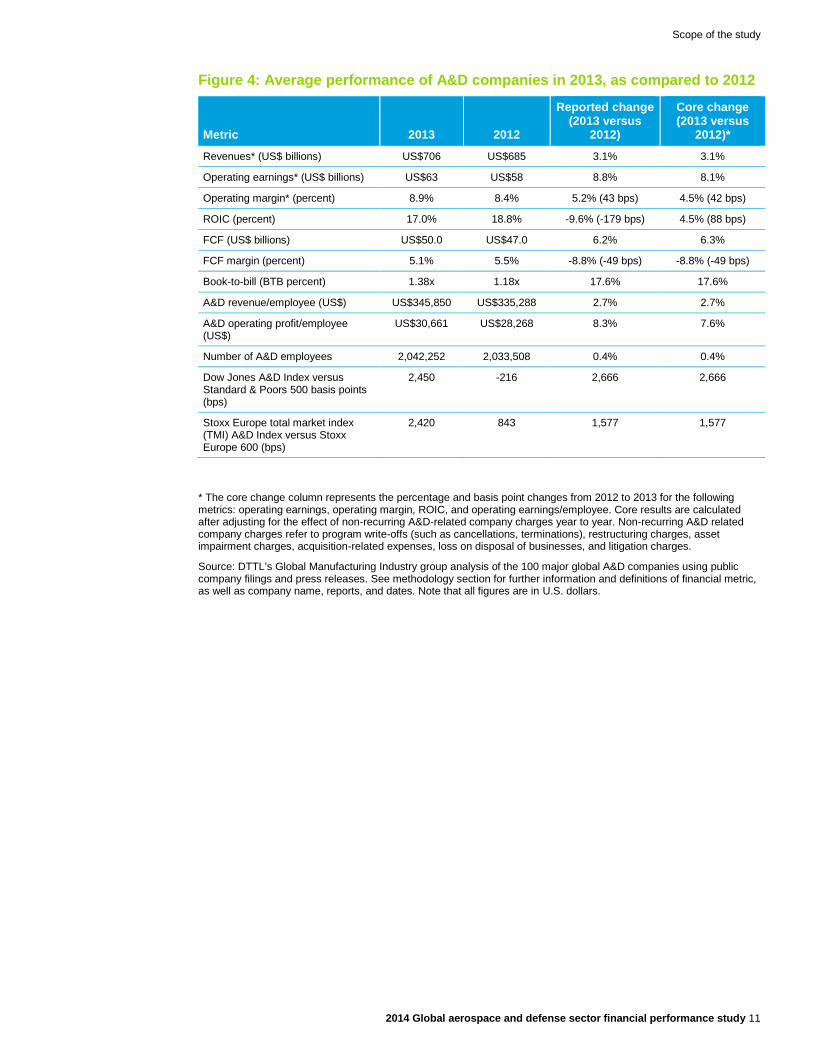
Figure 4 summarizes the key performance metrics of the A&D sector in constant currency, thereby eliminating potential distortions caused by foreign currency fluctuations. All metrics are based on reported filings, unless otherwise stated as “core” performance. Each performance metric is discussed in greater detail in this study.
Scope of the study
2014 Global aerospace and defense sector financial performance study 11
Figure 4: Average performance of A&D companies in 2013, as compared to 2012
Metric 2013 2012
Reported change (2013 versus
2012)
Core change (2013 versus
2012)*
Revenues* (US$ billions) US$706 US$685 3.1% 3.1%
Operating earnings* (US$ billions) US$63 US$58 8.8% 8.1%
Operating margin* (percent) 8.9% 8.4% 5.2% (43 bps) 4.5% (42 bps)
ROIC (percent) 17.0% 18.8% -9.6% (-179 bps) 4.5% (88 bps)
FCF (US$ billions) US$50.0 US$47.0 6.2% 6.3%
FCF margin (percent) 5.1% 5.5% -8.8% (-49 bps) -8.8% (-49 bps)
Book-to-bill (BTB percent) 1.38x 1.18x 17.6% 17.6%
A&D revenue/employee (US$) US$345,850 US$335,288 2.7% 2.7%
A&D operating profit/employee (US$)
US$30,661 US$28,268 8.3% 7.6%
Number of A&D employees 2,042,252 2,033,508 0.4% 0.4%
Dow Jones A&D Index versus Standard & Poors 500 basis points (bps)
2,450 -216 2,666 2,666
Stoxx Europe total market index (TMI) A&D Index versus Stoxx Europe 600 (bps)
2,420 843 1,577 1,577
* The core change column represents the percentage and basis point changes from 2012 to 2013 for the following metrics: operating earnings, operating margin, ROIC, and operating earnings/employee. Core results are calculated after adjusting for the effect of non-recurring A&D-related company charges year to year. Non-recurring A&D related company charges refer to program write-offs (such as cancellations, terminations), restructuring charges, asset impairment charges, acquisition-related expenses, loss on disposal of businesses, and litigation charges.
Source: DTTL’s Global Manufacturing Industry group analysis of the 100 major global A&D companies using public company filings and press releases. See methodology section for further information and definitions of financial metric, as well as company name, reports, and dates. Note that all figures are in U.S. dollars.
12
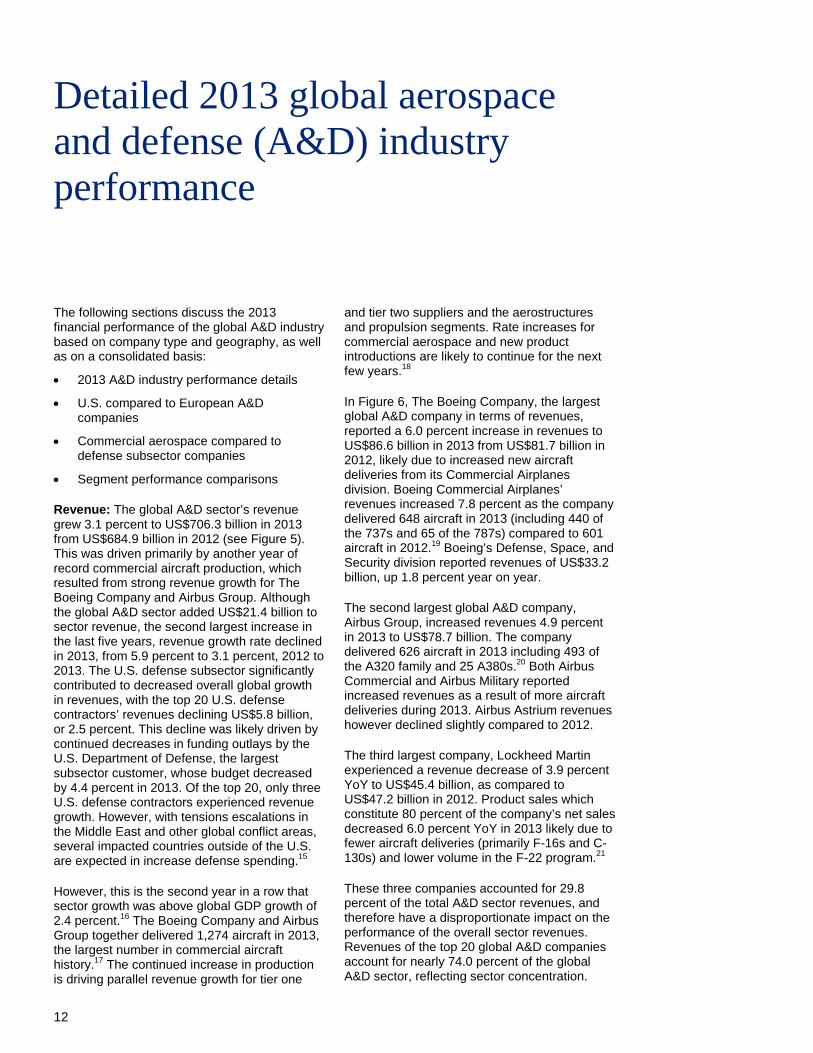
Detailed 2013 global aerospace and defense (A&D) industry performance
The following sections discuss the 2013 financial performance of the global A&D industry based on company type and geography, as well as on a consolidated basis:
• 2013 A&D industry performance details
• U.S. compared to European A&D companies
• Commercial aerospace compared to defense subsector companies
• Segment performance comparisons
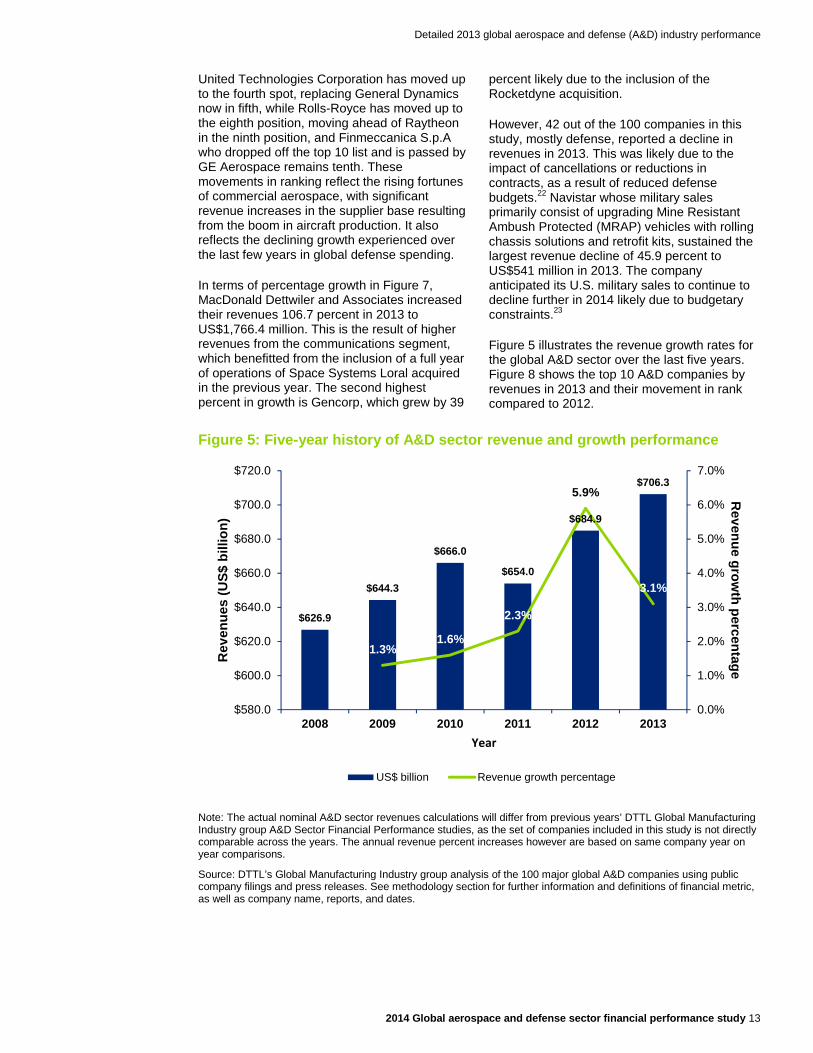
Revenue: The global A&D sector’s revenue grew 3.1 percent to US$706.3 billion in 2013 from US$684.9 billion in 2012 (see Figure 5). This was driven primarily by another year of record commercial aircraft production, which resulted from strong revenue growth for The Boeing Company and Airbus Group. Although the global A&D sector added US$21.4 billion to sector revenue, the second largest increase in the last five years, revenue growth rate declined in 2013, from 5.9 percent to 3.1 percent, 2012 to 2013. The U.S. defense subsector significantly contributed to decreased overall global growth in revenues, with the top 20 U.S. defense contractors’ revenues declining US$5.8 billion, or 2.5 percent. This decline was likely driven by continued decreases in funding outlays by the U.S. Department of Defense, the largest subsector customer, whose budget decreased by 4.4 percent in 2013. Of the top 20, only three U.S. defense contractors experienced revenue growth. However, with tensions escalations in the Middle East and other global conflict areas, several impacted countries outside of the U.S. are expected in increase defense spending.15
However, this is the second year in a row that sector growth was above global GDP growth of 2.4 percent.16 The Boeing Company and Airbus Group together delivered 1,274 aircraft in 2013, the largest number in commercial aircraft history.17 The continued increase in production is driving parallel revenue growth for tier one
and tier two suppliers and the aerostructures and propulsion segments. Rate increases for commercial aerospace and new product introductions are likely to continue for the next few years.18
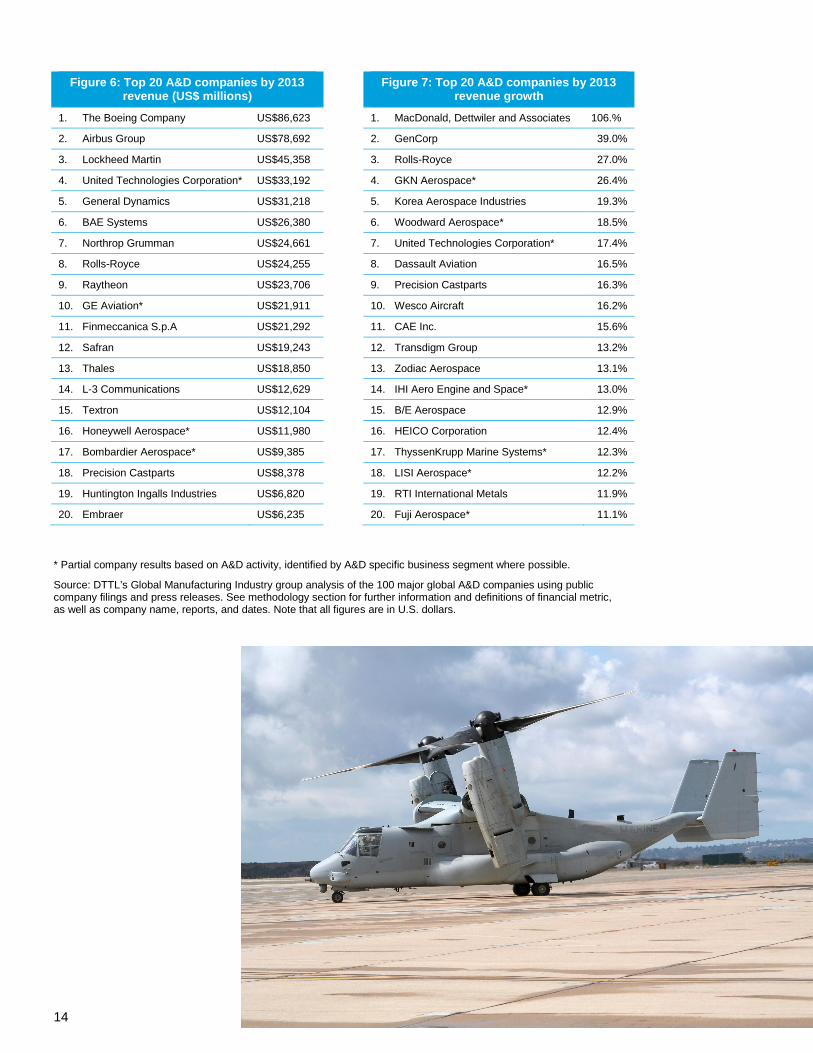
In Figure 6, The Boeing Company, the largest global A&D company in terms of revenues, reported a 6.0 percent increase in revenues to US$86.6 billion in 2013 from US$81.7 billion in 2012, likely due to increased new aircraft deliveries from its Commercial Airplanes division. Boeing Commercial Airplanes’ revenues increased 7.8 percent as the company delivered 648 aircraft in 2013 (including 440 of the 737s and 65 of the 787s) compared to 601 aircraft in 2012.19 Boeing’s Defense, Space, and Security division reported revenues of US$33.2 billion, up 1.8 percent year on year.
The second largest global A&D company, Airbus Group, increased revenues 4.9 percent in 2013 to US$78.7 billion. The company delivered 626 aircraft in 2013 including 493 of the A320 family and 25 A380s.20 Both Airbus Commercial and Airbus Military reported increased revenues as a result of more aircraft deliveries during 2013. Airbus Astrium revenues however declined slightly compared to 2012.
The third largest company, Lockheed Martin experienced a revenue decrease of 3.9 percent YoY to US$45.4 billion, as compared to US$47.2 billion in 2012. Product sales which constitute 80 percent of the company’s net sales decreased 6.0 percent YoY in 2013 likely due to fewer aircraft deliveries (primarily F-16s and C-130s) and lower volume in the F-22 program.21
These three companies accounted for 29.8 percent of the total A&D sector revenues, and therefore have a disproportionate impact on the performance of the overall sector revenues. Revenues of the top 20 global A&D companies account for nearly 74.0 percent of the global A&D sector, reflecting sector concentration.
Detailed 2013 global aerospace and defense (A&D) industry performance
2014 Global aerospace and defense sector financial performance study 13
United Technologies Corporation has moved up to the fourth spot, replacing General Dynamics now in fifth, while Rolls-Royce has moved up to the eighth position, moving ahead of Raytheon in the ninth position, and Finmeccanica S.p.A who dropped off the top 10 list and is passed by GE Aerospace remains tenth. These movements in ranking reflect the rising fortunes of commercial aerospace, with significant revenue increases in the supplier base resulting from the boom in aircraft production. It also reflects the declining growth experienced over the last few years in global defense spending.
In terms of percentage growth in Figure 7, MacDonald Dettwiler and Associates increased their revenues 106.7 percent in 2013 to US$1,766.4 million. This is the result of higher revenues from the communications segment, which benefitted from the inclusion of a full year of operations of Space Systems Loral acquired in the previous year. The second highest percent in growth is Gencorp, which grew by 39
percent likely due to the inclusion of the Rocketdyne acquisition.
However, 42 out of the 100 companies in this study, mostly defense, reported a decline in revenues in 2013. This was likely due to the impact of cancellations or reductions in contracts, as a result of reduced defense budgets.22 Navistar whose military sales primarily consist of upgrading Mine Resistant Ambush Protected (MRAP) vehicles with rolling chassis solutions and retrofit kits, sustained the largest revenue decline of 45.9 percent to US$541 million in 2013. The company anticipated its U.S. military sales to continue to decline further in 2014 likely due to budgetary constraints.23
Figure 5 illustrates the revenue growth rates for the global A&D sector over the last five years. Figure 8 shows the top 10 A&D companies by revenues in 2013 and their movement in rank compared to 2012.
Figure 5: Five-year history of A&D sector revenue and growth performance
Note: The actual nominal A&D sector revenues calculations will differ from previous years’ DTTL Global Manufacturing Industry group A&D Sector Financial Performance studies, as the set of companies included in this study is not directly comparable across the years. The annual revenue percent increases however are based on same company year on year comparisons.
Source: DTTL’s Global Manufacturing Industry group analysis of the 100 major global A&D companies using public company filings and press releases. See methodology section for further information and definitions of financial metric, as well as company name, reports, and dates.
$626.9
$644.3
$666.0
$654.0
$684.9
$706.3
1.3%1.6%
2.3%
5.9%
3.1%
0.0%
1.0%
2.0%
3.0%
4.0%
5.0%
6.0%
7.0%
$580.0
$600.0
$620.0
$640.0
$660.0
$680.0
$700.0
$720.0
2008 2009 2010 2011 2012 2013
Revenue grow
th percentage
Rev
enue
s (U
S$ b
illio
n)
Year
US$ billion Revenue growth percentage
14
Figure 6: Top 20 A&D companies by 2013 revenue (US$ millions)
Figure 7: Top 20 A&D companies by 2013 revenue growth
1. The Boeing Company US$86,623
1. MacDonald, Dettwiler and Associates 106.%
2. Airbus Group US$78,692
2. GenCorp 39.0%
3. Lockheed Martin US$45,358
3. Rolls-Royce 27.0%
4. United Technologies Corporation* US$33,192
4. GKN Aerospace* 26.4%
5. General Dynamics US$31,218
5. Korea Aerospace Industries 19.3%
6. BAE Systems US$26,380
6. Woodward Aerospace* 18.5%
7. Northrop Grumman US$24,661
7. United Technologies Corporation* 17.4%
8. Rolls-Royce US$24,255
8. Dassault Aviation 16.5%
9. Raytheon US$23,706
9. Precision Castparts 16.3%
10. GE Aviation* US$21,911
10. Wesco Aircraft 16.2%
11. Finmeccanica S.p.A US$21,292
11. CAE Inc. 15.6%
12. Safran US$19,243
12. Transdigm Group 13.2%
13. Thales US$18,850
13. Zodiac Aerospace 13.1%
14. L-3 Communications US$12,629
14. IHI Aero Engine and Space* 13.0%
15. Textron US$12,104
15. B/E Aerospace 12.9%
16. Honeywell Aerospace* US$11,980
16. HEICO Corporation 12.4%
17. Bombardier Aerospace* US$9,385
17. ThyssenKrupp Marine Systems* 12.3%
18. Precision Castparts US$8,378
18. LISI Aerospace* 12.2%
19. Huntington Ingalls Industries US$6,820
19. RTI International Metals 11.9%
20. Embraer US$6,235
20. Fuji Aerospace* 11.1%
* Partial company results based on A&D activity, identified by A&D specific business segment where possible.
Source: DTTL’s Global Manufacturing Industry group analysis of the 100 major global A&D companies using public company filings and press releases. See methodology section for further information and definitions of financial metric, as well as company name, reports, and dates. Note that all figures are in U.S. dollars.
Detailed 2013 global aerospace and defense (A&D) industry performance
2014 Global aerospace and defense sector financial performance study 15
“A&D sector operating earnings increased 8.8 percent to US$62.6 billion, outpaced revenue growth globally, adding about US$5.1 billion in global profits.”
16
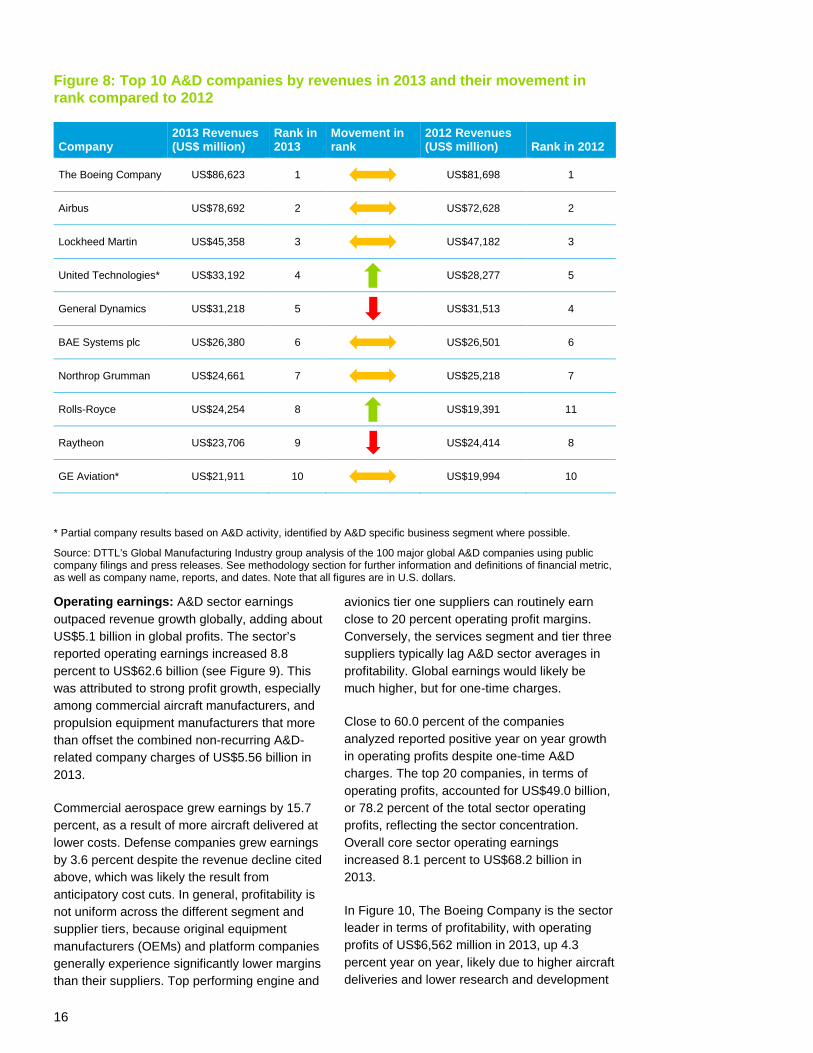
Figure 8: Top 10 A&D companies by revenues in 2013 and their movement in rank compared to 2012
Company 2013 Revenues (US$ million)
Rank in 2013
Movement in rank
2012 Revenues (US$ million) Rank in 2012
The Boeing Company US$86,623 1 US$81,698 1
Airbus US$78,692 2 US$72,628 2
Lockheed Martin US$45,358 3 US$47,182 3
United Technologies* US$33,192 4
US$28,277 5
General Dynamics US$31,218 5
US$31,513 4
BAE Systems plc US$26,380 6 US$26,501 6
Northrop Grumman US$24,661 7 US$25,218 7
Rolls-Royce US$24,254 8
US$19,391 11
Raytheon US$23,706 9
US$24,414 8
GE Aviation* US$21,911 10 US$19,994 10
* Partial company results based on A&D activity, identified by A&D specific business segment where possible.
Source: DTTL’s Global Manufacturing Industry group analysis of the 100 major global A&D companies using public company filings and press releases. See methodology section for further information and definitions of financial metric, as well as company name, reports, and dates. Note that all figures are in U.S. dollars.
Operating earnings: A&D sector earnings outpaced revenue growth globally, adding about US$5.1 billion in global profits. The sector’s reported operating earnings increased 8.8 percent to US$62.6 billion (see Figure 9). This was attributed to strong profit growth, especially among commercial aircraft manufacturers, and propulsion equipment manufacturers that more than offset the combined non-recurring A&D-related company charges of US$5.56 billion in 2013.
Commercial aerospace grew earnings by 15.7 percent, as a result of more aircraft delivered at lower costs. Defense companies grew earnings by 3.6 percent despite the revenue decline cited above, which was likely the result from anticipatory cost cuts. In general, profitability is not uniform across the different segment and supplier tiers, because original equipment manufacturers (OEMs) and platform companies generally experience significantly lower margins than their suppliers. Top performing engine and
avionics tier one suppliers can routinely earn close to 20 percent operating profit margins. Conversely, the services segment and tier three suppliers typically lag A&D sector averages in profitability. Global earnings would likely be much higher, but for one-time charges.
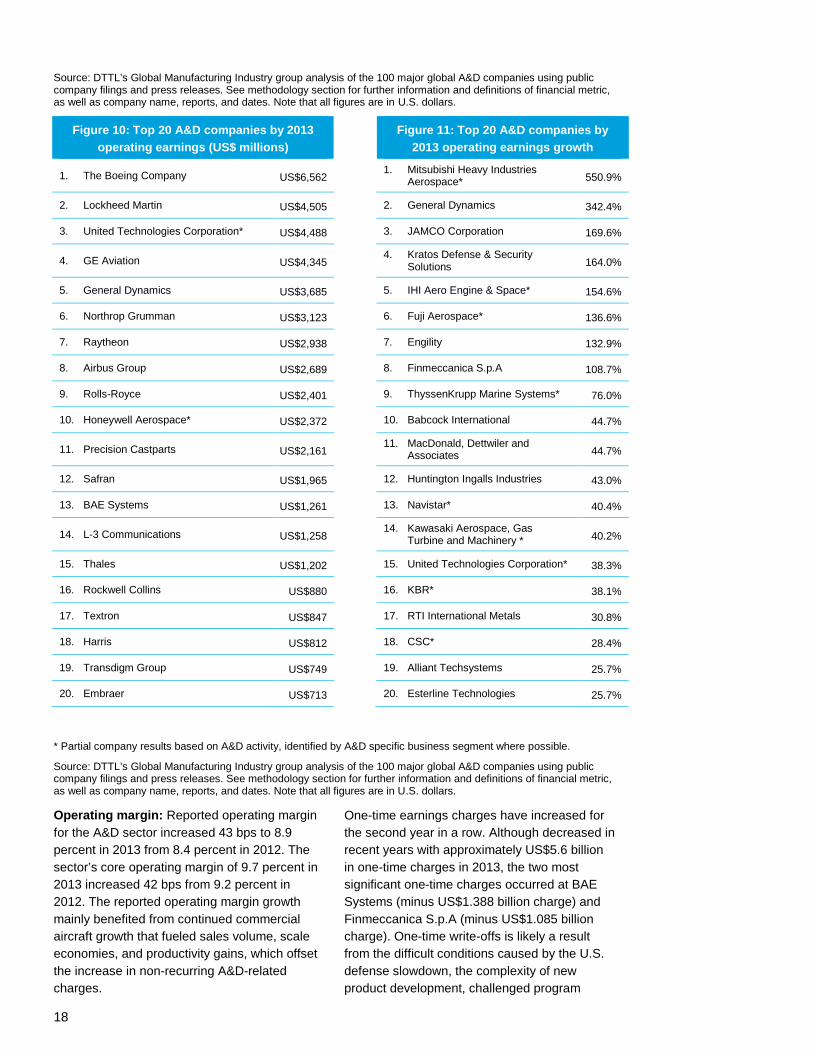
Close to 60.0 percent of the companies analyzed reported positive year on year growth in operating profits despite one-time A&D charges. The top 20 companies, in terms of operating profits, accounted for US$49.0 billion, or 78.2 percent of the total sector operating profits, reflecting the sector concentration. Overall core sector operating earnings increased 8.1 percent to US$68.2 billion in 2013.
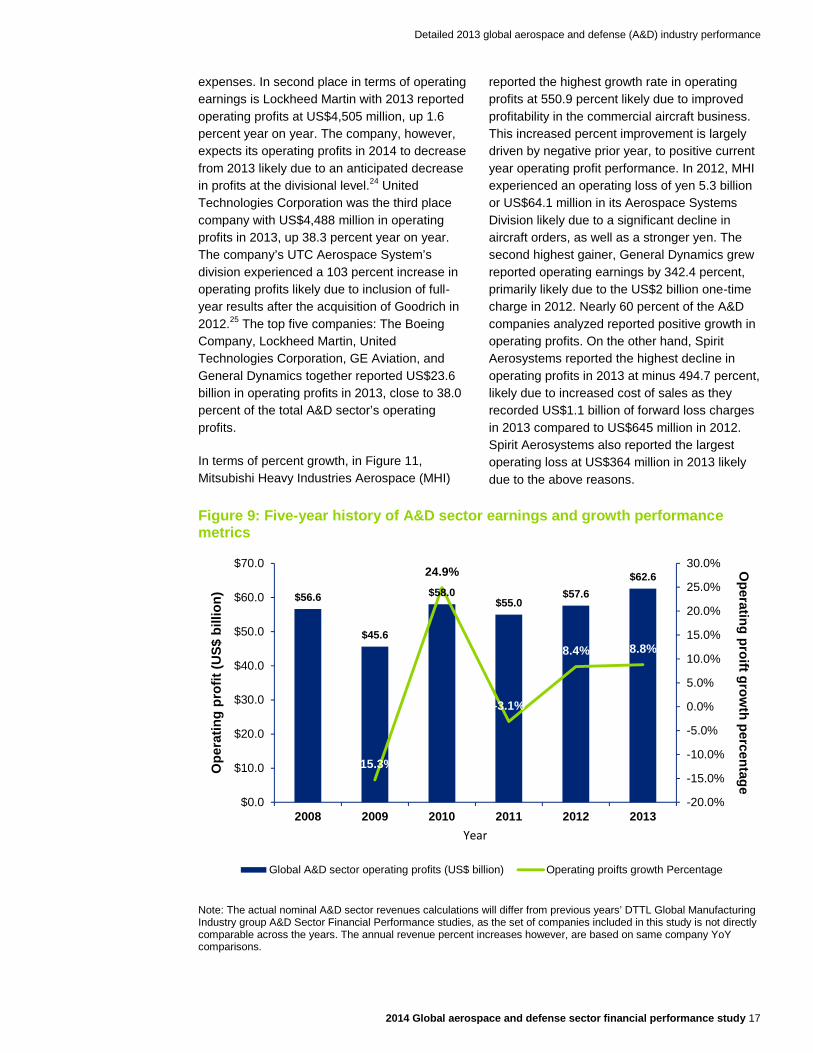
In Figure 10, The Boeing Company is the sector leader in terms of profitability, with operating profits of US$6,562 million in 2013, up 4.3 percent year on year, likely due to higher aircraft deliveries and lower research and development
Detailed 2013 global aerospace and defense (A&D) industry performance
2014 Global aerospace and defense sector financial performance study 17
expenses. In second place in terms of operating earnings is Lockheed Martin with 2013 reported operating profits at US$4,505 million, up 1.6 percent year on year. The company, however, expects its operating profits in 2014 to decrease from 2013 likely due to an anticipated decrease in profits at the divisional level.24 United Technologies Corporation was the third place company with US$4,488 million in operating profits in 2013, up 38.3 percent year on year. The company’s UTC Aerospace System’s division experienced a 103 percent increase in operating profits likely due to inclusion of full-year results after the acquisition of Goodrich in 2012.25 The top five companies: The Boeing Company, Lockheed Martin, United Technologies Corporation, GE Aviation, and General Dynamics together reported US$23.6 billion in operating profits in 2013, close to 38.0 percent of the total A&D sector’s operating profits.
In terms of percent growth, in Figure 11, Mitsubishi Heavy Industries Aerospace (MHI)
reported the highest growth rate in operating profits at 550.9 percent likely due to improved profitability in the commercial aircraft business. This increased percent improvement is largely driven by negative prior year, to positive current year operating profit performance. In 2012, MHI experienced an operating loss of yen 5.3 billion or US$64.1 million in its Aerospace Systems Division likely due to a significant decline in aircraft orders, as well as a stronger yen. The second highest gainer, General Dynamics grew reported operating earnings by 342.4 percent, primarily likely due to the US$2 billion one-time charge in 2012. Nearly 60 percent of the A&D companies analyzed reported positive growth in operating profits. On the other hand, Spirit Aerosystems reported the highest decline in operating profits in 2013 at minus 494.7 percent, likely due to increased cost of sales as they recorded US$1.1 billion of forward loss charges in 2013 compared to US$645 million in 2012. Spirit Aerosystems also reported the largest operating loss at US$364 million in 2013 likely due to the above reasons.
Figure 9: Five-year history of A&D sector earnings and growth performance metrics
Note: The actual nominal A&D sector revenues calculations will differ from previous years’ DTTL Global Manufacturing Industry group A&D Sector Financial Performance studies, as the set of companies included in this study is not directly comparable across the years. The annual revenue percent increases however, are based on same company YoY comparisons.
$56.6
$45.6
$58.0$55.0
$57.6$62.6
-15.3%
24.9%
-3.1%
8.4% 8.8%
-20.0%
-15.0%
-10.0%
-5.0%
0.0%
5.0%
10.0%
15.0%
20.0%
25.0%
30.0%
$0.0
$10.0
$20.0
$30.0
$40.0
$50.0
$60.0
$70.0
2008 2009 2010 2011 2012 2013
Operating proift grow
th percentage
Ope
ratin
g pr
ofit
(US$
bill
ion)
Year
Global A&D sector operating profits (US$ billion) Operating proifts growth Percentage
18
Source: DTTL’s Global Manufacturing Industry group analysis of the 100 major global A&D companies using public company filings and press releases. See methodology section for further information and definitions of financial metric, as well as company name, reports, and dates. Note that all figures are in U.S. dollars.
Figure 10: Top 20 A&D companies by 2013 operating earnings (US$ millions)
Figure 11: Top 20 A&D companies by 2013 operating earnings growth
1. The Boeing Company US$6,562 1. Mitsubishi Heavy Industries Aerospace* 550.9%
2. Lockheed Martin US$4,505 2. General Dynamics 342.4%
3. United Technologies Corporation* US$4,488 3. JAMCO Corporation 169.6%
4. GE Aviation US$4,345 4. Kratos Defense & Security Solutions 164.0%
5. General Dynamics US$3,685 5. IHI Aero Engine & Space* 154.6%
6. Northrop Grumman US$3,123 6. Fuji Aerospace* 136.6%
7. Raytheon US$2,938 7. Engility 132.9%
8. Airbus Group US$2,689 8. Finmeccanica S.p.A 108.7%
9. Rolls-Royce US$2,401 9. ThyssenKrupp Marine Systems* 76.0%
10. Honeywell Aerospace* US$2,372 10. Babcock International 44.7%
11. Precision Castparts US$2,161 11. MacDonald, Dettwiler and Associates 44.7%
12. Safran US$1,965 12. Huntington Ingalls Industries 43.0%
13. BAE Systems US$1,261 13. Navistar* 40.4%
14. L-3 Communications US$1,258 14. Kawasaki Aerospace, Gas Turbine and Machinery * 40.2%
15. Thales US$1,202 15. United Technologies Corporation* 38.3%
16. Rockwell Collins US$880 16. KBR* 38.1%
17. Textron US$847 17. RTI International Metals 30.8%
18. Harris US$812 18. CSC* 28.4%
19. Transdigm Group US$749 19. Alliant Techsystems 25.7%
20. Embraer US$713 20. Esterline Technologies 25.7%
* Partial company results based on A&D activity, identified by A&D specific business segment where possible.
Source: DTTL’s Global Manufacturing Industry group analysis of the 100 major global A&D companies using public company filings and press releases. See methodology section for further information and definitions of financial metric, as well as company name, reports, and dates. Note that all figures are in U.S. dollars.
Operating margin: Reported operating margin for the A&D sector increased 43 bps to 8.9 percent in 2013 from 8.4 percent in 2012. The sector’s core operating margin of 9.7 percent in 2013 increased 42 bps from 9.2 percent in 2012. The reported operating margin growth mainly benefited from continued commercial aircraft growth that fueled sales volume, scale economies, and productivity gains, which offset the increase in non-recurring A&D-related charges.
One-time earnings charges have increased for the second year in a row. Although decreased in recent years with approximately US$5.6 billion in one-time charges in 2013, the two most significant one-time charges occurred at BAE Systems (minus US$1.388 billion charge) and Finmeccanica S.p.A (minus US$1.085 billion charge). One-time write-offs is likely a result from the difficult conditions caused by the U.S. defense slowdown, the complexity of new product development, challenged program
Detailed 2013 global aerospace and defense (A&D) industry performance
2014 Global aerospace and defense sector financial performance study 19
execution, and asset impairment. It is expected the environment of complex product development and uncertain market dynamics could likely result in a certain level of impairments and one-time charges in the future, however those levels are difficult to forecast. Program performance continues to be a key management challenge of the global A&D industry.
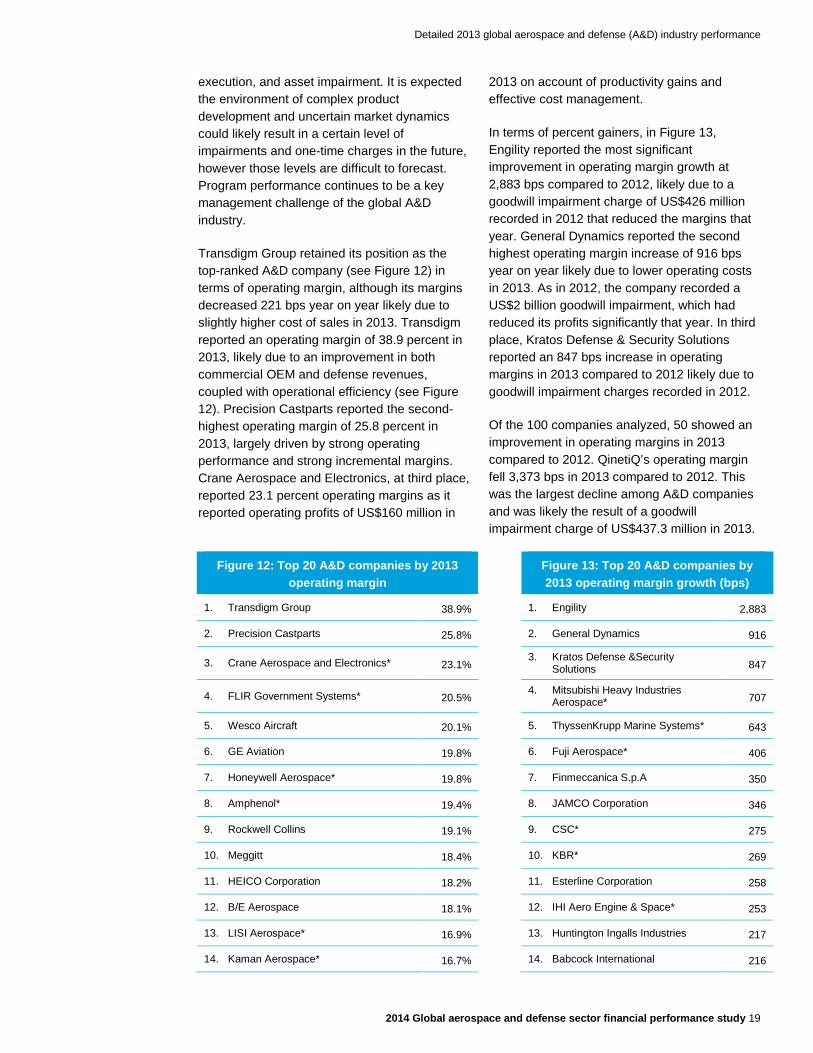
Transdigm Group retained its position as the top-ranked A&D company (see Figure 12) in terms of operating margin, although its margins decreased 221 bps year on year likely due to slightly higher cost of sales in 2013. Transdigm reported an operating margin of 38.9 percent in 2013, likely due to an improvement in both commercial OEM and defense revenues, coupled with operational efficiency (see Figure 12). Precision Castparts reported the second-highest operating margin of 25.8 percent in 2013, largely driven by strong operating performance and strong incremental margins. Crane Aerospace and Electronics, at third place, reported 23.1 percent operating margins as it reported operating profits of US$160 million in
2013 on account of productivity gains and effective cost management.
In terms of percent gainers, in Figure 13, Engility reported the most significant improvement in operating margin growth at 2,883 bps compared to 2012, likely due to a goodwill impairment charge of US$426 million recorded in 2012 that reduced the margins that year. General Dynamics reported the second highest operating margin increase of 916 bps year on year likely due to lower operating costs in 2013. As in 2012, the company recorded a US$2 billion goodwill impairment, which had reduced its profits significantly that year. In third place, Kratos Defense & Security Solutions reported an 847 bps increase in operating margins in 2013 compared to 2012 likely due to goodwill impairment charges recorded in 2012.
Of the 100 companies analyzed, 50 showed an improvement in operating margins in 2013 compared to 2012. QinetiQ’s operating margin fell 3,373 bps in 2013 compared to 2012. This was the largest decline among A&D companies and was likely the result of a goodwill impairment charge of US$437.3 million in 2013.
Figure 12: Top 20 A&D companies by 2013 operating margin
Figure 13: Top 20 A&D companies by 2013 operating margin growth (bps)
1. Transdigm Group 38.9% 1. Engility 2,883
2. Precision Castparts 25.8% 2. General Dynamics 916
3. Crane Aerospace and Electronics* 23.1% 3. Kratos Defense &Security Solutions 847
4. FLIR Government Systems* 20.5% 4. Mitsubishi Heavy Industries Aerospace* 707
5. Wesco Aircraft 20.1% 5. ThyssenKrupp Marine Systems* 643
6. GE Aviation 19.8% 6. Fuji Aerospace* 406
7. Honeywell Aerospace* 19.8% 7. Finmeccanica S.p.A 350
8. Amphenol* 19.4% 8. JAMCO Corporation 346
9. Rockwell Collins 19.1% 9. CSC* 275
10. Meggitt 18.4% 10. KBR* 269
11. HEICO Corporation 18.2% 11. Esterline Corporation 258
12. B/E Aerospace 18.1% 12. IHI Aero Engine & Space* 253
13. LISI Aerospace* 16.9% 13. Huntington Ingalls Industries 217
14. Kaman Aerospace* 16.7% 14. Babcock International 216
20
Figure 12: Top 20 A&D companies by 2013 operating margin
Figure 13: Top 20 A&D companies by 2013 operating margin growth (bps)
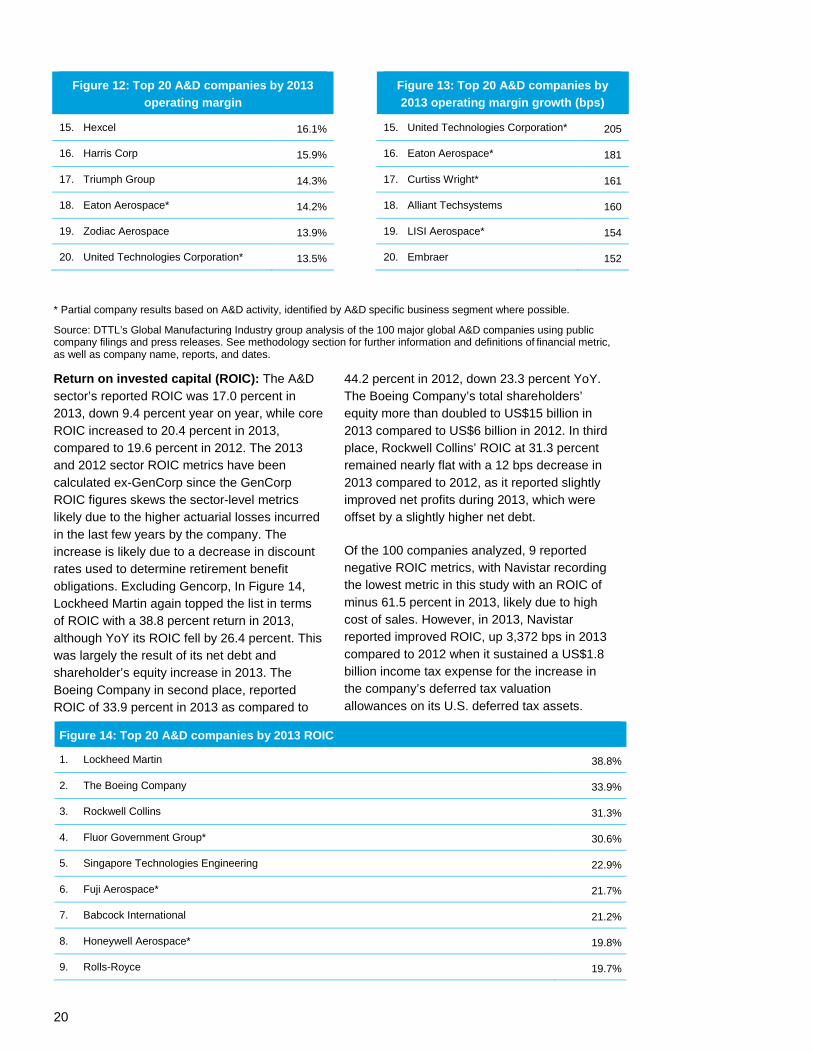
15. Hexcel 16.1% 15. United Technologies Corporation* 205
16. Harris Corp 15.9% 16. Eaton Aerospace* 181
17. Triumph Group 14.3% 17. Curtiss Wright* 161
18. Eaton Aerospace* 14.2% 18. Alliant Techsystems 160
19. Zodiac Aerospace 13.9% 19. LISI Aerospace* 154
20. United Technologies Corporation* 13.5% 20. Embraer 152
* Partial company results based on A&D activity, identified by A&D specific business segment where possible.
Source: DTTL’s Global Manufacturing Industry group analysis of the 100 major global A&D companies using public company filings and press releases. See methodology section for further information and definitions of financial metric, as well as company name, reports, and dates.
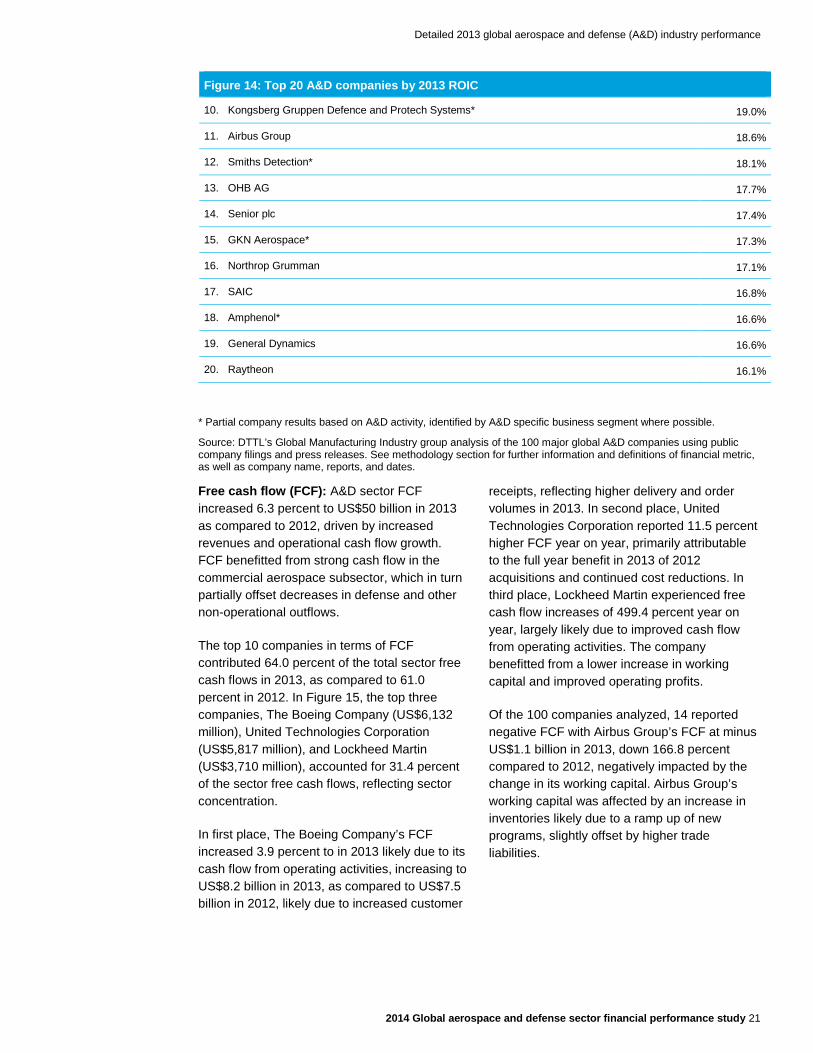
Return on invested capital (ROIC): The A&D sector’s reported ROIC was 17.0 percent in 2013, down 9.4 percent year on year, while core ROIC increased to 20.4 percent in 2013, compared to 19.6 percent in 2012. The 2013 and 2012 sector ROIC metrics have been calculated ex-GenCorp since the GenCorp ROIC figures skews the sector-level metrics likely due to the higher actuarial losses incurred in the last few years by the company. The increase is likely due to a decrease in discount rates used to determine retirement benefit obligations. Excluding Gencorp, In Figure 14, Lockheed Martin again topped the list in terms of ROIC with a 38.8 percent return in 2013, although YoY its ROIC fell by 26.4 percent. This was largely the result of its net debt and shareholder’s equity increase in 2013. The Boeing Company in second place, reported ROIC of 33.9 percent in 2013 as compared to
44.2 percent in 2012, down 23.3 percent YoY. The Boeing Company’s total shareholders’ equity more than doubled to US$15 billion in 2013 compared to US$6 billion in 2012. In third place, Rockwell Collins’ ROIC at 31.3 percent remained nearly flat with a 12 bps decrease in 2013 compared to 2012, as it reported slightly improved net profits during 2013, which were offset by a slightly higher net debt.
Of the 100 companies analyzed, 9 reported negative ROIC metrics, with Navistar recording the lowest metric in this study with an ROIC of minus 61.5 percent in 2013, likely due to high cost of sales. However, in 2013, Navistar reported improved ROIC, up 3,372 bps in 2013 compared to 2012 when it sustained a US$1.8 billion income tax expense for the increase in the company’s deferred tax valuation allowances on its U.S. deferred tax assets.
Figure 14: Top 20 A&D companies by 2013 ROIC
1. Lockheed Martin 38.8%
2. The Boeing Company 33.9%
3. Rockwell Collins 31.3%
4. Fluor Government Group* 30.6%
5. Singapore Technologies Engineering 22.9%
6. Fuji Aerospace* 21.7%
7. Babcock International 21.2%
8. Honeywell Aerospace* 19.8%
9. Rolls-Royce 19.7%
Detailed 2013 global aerospace and defense (A&D) industry performance
2014 Global aerospace and defense sector financial performance study 21
Figure 14: Top 20 A&D companies by 2013 ROIC
10. Kongsberg Gruppen Defence and Protech Systems* 19.0%
11. Airbus Group 18.6%
12. Smiths Detection* 18.1%
13. OHB AG 17.7%
14. Senior plc 17.4%
15. GKN Aerospace* 17.3%
16. Northrop Grumman 17.1%
17. SAIC 16.8%
18. Amphenol* 16.6%
19. General Dynamics 16.6%
20. Raytheon 16.1%
* Partial company results based on A&D activity, identified by A&D specific business segment where possible.
Source: DTTL’s Global Manufacturing Industry group analysis of the 100 major global A&D companies using public company filings and press releases. See methodology section for further information and definitions of financial metric, as well as company name, reports, and dates.
Free cash flow (FCF): A&D sector FCF increased 6.3 percent to US$50 billion in 2013 as compared to 2012, driven by increased revenues and operational cash flow growth. FCF benefitted from strong cash flow in the commercial aerospace subsector, which in turn partially offset decreases in defense and other non-operational outflows.
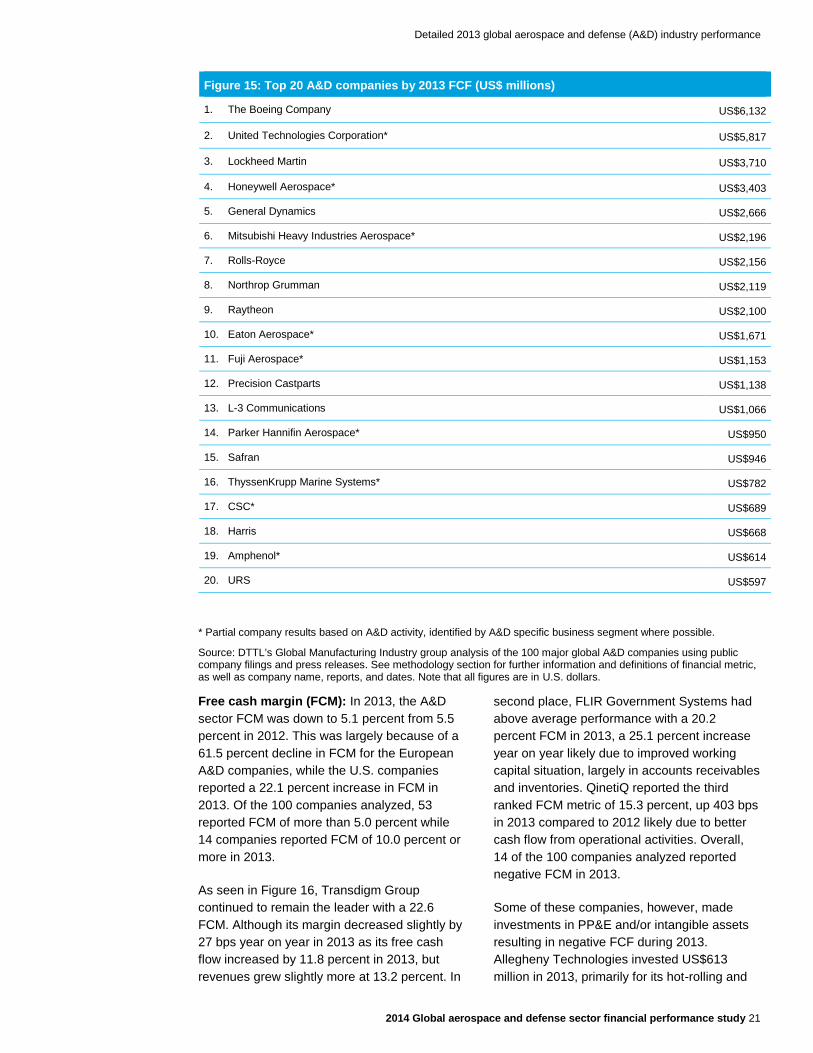
The top 10 companies in terms of FCF contributed 64.0 percent of the total sector free cash flows in 2013, as compared to 61.0 percent in 2012. In Figure 15, the top three companies, The Boeing Company (US$6,132 million), United Technologies Corporation (US$5,817 million), and Lockheed Martin (US$3,710 million), accounted for 31.4 percent of the sector free cash flows, reflecting sector concentration.
In first place, The Boeing Company’s FCF increased 3.9 percent to in 2013 likely due to its cash flow from operating activities, increasing to US$8.2 billion in 2013, as compared to US$7.5 billion in 2012, likely due to increased customer
receipts, reflecting higher delivery and order volumes in 2013. In second place, United Technologies Corporation reported 11.5 percent higher FCF year on year, primarily attributable to the full year benefit in 2013 of 2012 acquisitions and continued cost reductions. In third place, Lockheed Martin experienced free cash flow increases of 499.4 percent year on year, largely likely due to improved cash flow from operating activities. The company benefitted from a lower increase in working capital and improved operating profits.
Of the 100 companies analyzed, 14 reported negative FCF with Airbus Group’s FCF at minus US$1.1 billion in 2013, down 166.8 percent compared to 2012, negatively impacted by the change in its working capital. Airbus Group’s working capital was affected by an increase in inventories likely due to a ramp up of new programs, slightly offset by higher trade liabilities.
Detailed 2013 global aerospace and defense (A&D) industry performance
2014 Global aerospace and defense sector financial performance study 21
Figure 15: Top 20 A&D companies by 2013 FCF (US$ millions)
1. The Boeing Company US$6,132
2. United Technologies Corporation* US$5,817
3. Lockheed Martin US$3,710
4. Honeywell Aerospace* US$3,403
5. General Dynamics US$2,666
6. Mitsubishi Heavy Industries Aerospace* US$2,196
7. Rolls-Royce US$2,156
8. Northrop Grumman US$2,119
9. Raytheon US$2,100
10. Eaton Aerospace* US$1,671
11. Fuji Aerospace* US$1,153
12. Precision Castparts US$1,138
13. L-3 Communications US$1,066
14. Parker Hannifin Aerospace* US$950
15. Safran US$946
16. ThyssenKrupp Marine Systems* US$782
17. CSC* US$689
18. Harris US$668
19. Amphenol* US$614
20. URS US$597
* Partial company results based on A&D activity, identified by A&D specific business segment where possible.
Source: DTTL’s Global Manufacturing Industry group analysis of the 100 major global A&D companies using public company filings and press releases. See methodology section for further information and definitions of financial metric, as well as company name, reports, and dates. Note that all figures are in U.S. dollars.
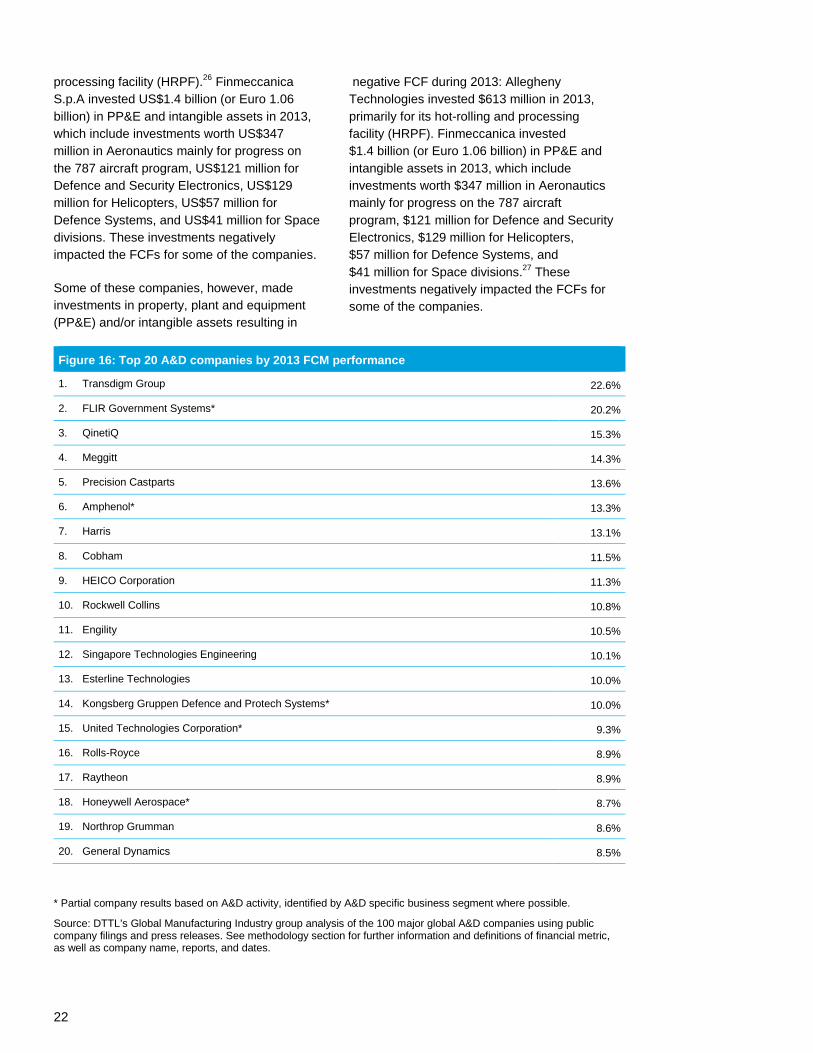
Free cash margin (FCM): In 2013, the A&D sector FCM was down to 5.1 percent from 5.5 percent in 2012. This was largely because of a 61.5 percent decline in FCM for the European A&D companies, while the U.S. companies reported a 22.1 percent increase in FCM in 2013. Of the 100 companies analyzed, 53 reported FCM of more than 5.0 percent while 14 companies reported FCM of 10.0 percent or more in 2013.
As seen in Figure 16, Transdigm Group continued to remain the leader with a 22.6 FCM. Although its margin decreased slightly by 27 bps year on year in 2013 as its free cash flow increased by 11.8 percent in 2013, but revenues grew slightly more at 13.2 percent. In
second place, FLIR Government Systems had above average performance with a 20.2 percent FCM in 2013, a 25.1 percent increase year on year likely due to improved working capital situation, largely in accounts receivables and inventories. QinetiQ reported the third ranked FCM metric of 15.3 percent, up 403 bps in 2013 compared to 2012 likely due to better cash flow from operational activities. Overall, 14 of the 100 companies analyzed reported negative FCM in 2013.
Some of these companies, however, made investments in PP&E and/or intangible assets resulting in negative FCF during 2013. Allegheny Technologies invested US$613 million in 2013, primarily for its hot-rolling and
22
processing facility (HRPF).26 Finmeccanica S.p.A invested US$1.4 billion (or Euro 1.06 billion) in PP&E and intangible assets in 2013, which include investments worth US$347 million in Aeronautics mainly for progress on the 787 aircraft program, US$121 million for Defence and Security Electronics, US$129 million for Helicopters, US$57 million for Defence Systems, and US$41 million for Space divisions. These investments negatively impacted the FCFs for some of the companies.
Some of these companies, however, made investments in property, plant and equipment (PP&E) and/or intangible assets resulting in
negative FCF during 2013: Allegheny Technologies invested $613 million in 2013, primarily for its hot-rolling and processing facility (HRPF). Finmeccanica invested $1.4 billion (or Euro 1.06 billion) in PP&E and intangible assets in 2013, which include investments worth $347 million in Aeronautics mainly for progress on the 787 aircraft program, $121 million for Defence and Security Electronics, $129 million for Helicopters, $57 million for Defence Systems, and $41 million for Space divisions.27 These investments negatively impacted the FCFs for some of the companies.
Figure 16: Top 20 A&D companies by 2013 FCM performance
1. Transdigm Group 22.6%
2. FLIR Government Systems* 20.2%
3. QinetiQ 15.3%
4. Meggitt 14.3%
5. Precision Castparts 13.6%
6. Amphenol* 13.3%
7. Harris 13.1%
8. Cobham 11.5%
9. HEICO Corporation 11.3%
10. Rockwell Collins 10.8%
11. Engility 10.5%
12. Singapore Technologies Engineering 10.1%
13. Esterline Technologies 10.0%
14. Kongsberg Gruppen Defence and Protech Systems* 10.0%
15. United Technologies Corporation* 9.3%
16. Rolls-Royce 8.9%
17. Raytheon 8.9%
18. Honeywell Aerospace* 8.7%
19. Northrop Grumman 8.6%
20. General Dynamics 8.5%
* Partial company results based on A&D activity, identified by A&D specific business segment where possible.
Source: DTTL’s Global Manufacturing Industry group analysis of the 100 major global A&D companies using public company filings and press releases. See methodology section for further information and definitions of financial metric, as well as company name, reports, and dates.
Detailed 2013 global aerospace and defense (A&D) industry performance
2014 Global aerospace and defense sector financial performance study 1
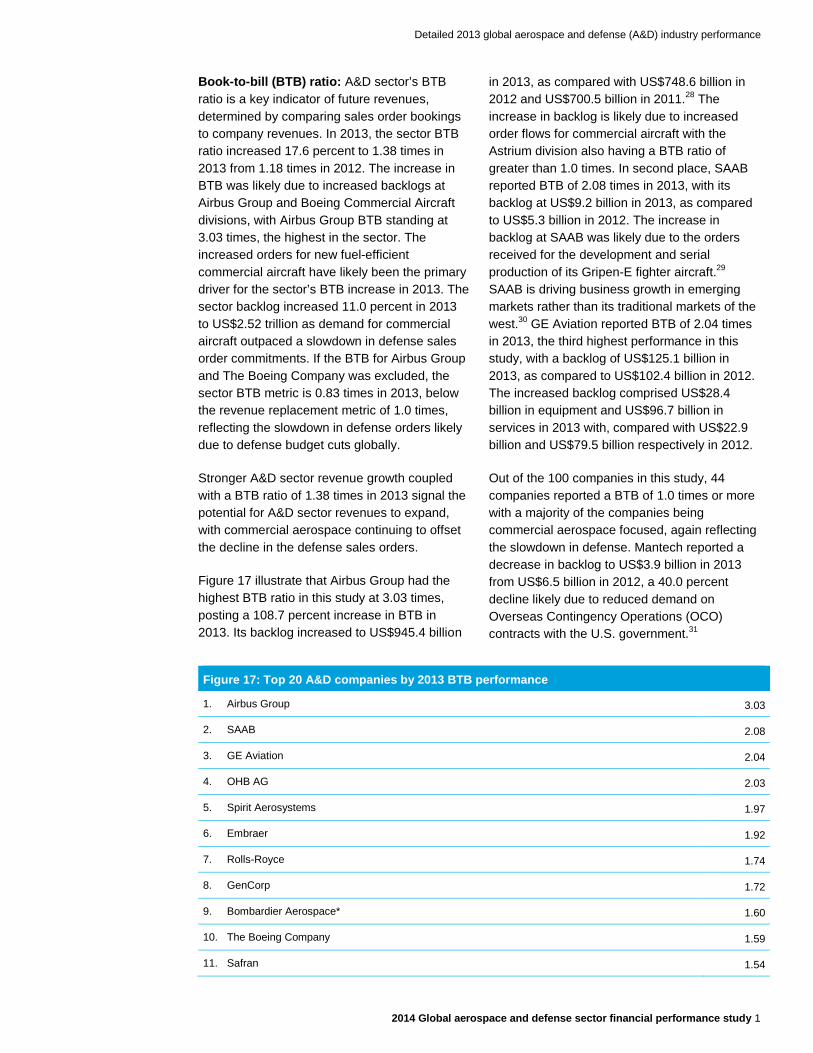
Book-to-bill (BTB) ratio: A&D sector’s BTB ratio is a key indicator of future revenues, determined by comparing sales order bookings to company revenues. In 2013, the sector BTB ratio increased 17.6 percent to 1.38 times in 2013 from 1.18 times in 2012. The increase in BTB was likely due to increased backlogs at Airbus Group and Boeing Commercial Aircraft divisions, with Airbus Group BTB standing at 3.03 times, the highest in the sector. The increased orders for new fuel-efficient commercial aircraft have likely been the primary driver for the sector’s BTB increase in 2013. The sector backlog increased 11.0 percent in 2013 to US$2.52 trillion as demand for commercial aircraft outpaced a slowdown in defense sales order commitments. If the BTB for Airbus Group and The Boeing Company was excluded, the sector BTB metric is 0.83 times in 2013, below the revenue replacement metric of 1.0 times, reflecting the slowdown in defense orders likely due to defense budget cuts globally.
Stronger A&D sector revenue growth coupled with a BTB ratio of 1.38 times in 2013 signal the potential for A&D sector revenues to expand, with commercial aerospace continuing to offset the decline in the defense sales orders.
Figure 17 illustrate that Airbus Group had the highest BTB ratio in this study at 3.03 times, posting a 108.7 percent increase in BTB in 2013. Its backlog increased to US$945.4 billion
in 2013, as compared with US$748.6 billion in 2012 and US$700.5 billion in 2011.28 The increase in backlog is likely due to increased order flows for commercial aircraft with the Astrium division also having a BTB ratio of greater than 1.0 times. In second place, SAAB reported BTB of 2.08 times in 2013, with its backlog at US$9.2 billion in 2013, as compared to US$5.3 billion in 2012. The increase in backlog at SAAB was likely due to the orders received for the development and serial production of its Gripen-E fighter aircraft.29 SAAB is driving business growth in emerging markets rather than its traditional markets of the west.30 GE Aviation reported BTB of 2.04 times in 2013, the third highest performance in this study, with a backlog of US$125.1 billion in 2013, as compared to US$102.4 billion in 2012. The increased backlog comprised US$28.4 billion in equipment and US$96.7 billion in services in 2013 with, compared with US$22.9 billion and US$79.5 billion respectively in 2012.
Out of the 100 companies in this study, 44 companies reported a BTB of 1.0 times or more with a majority of the companies being commercial aerospace focused, again reflecting the slowdown in defense. Mantech reported a decrease in backlog to US$3.9 billion in 2013 from US$6.5 billion in 2012, a 40.0 percent decline likely due to reduced demand on Overseas Contingency Operations (OCO) contracts with the U.S. government.31
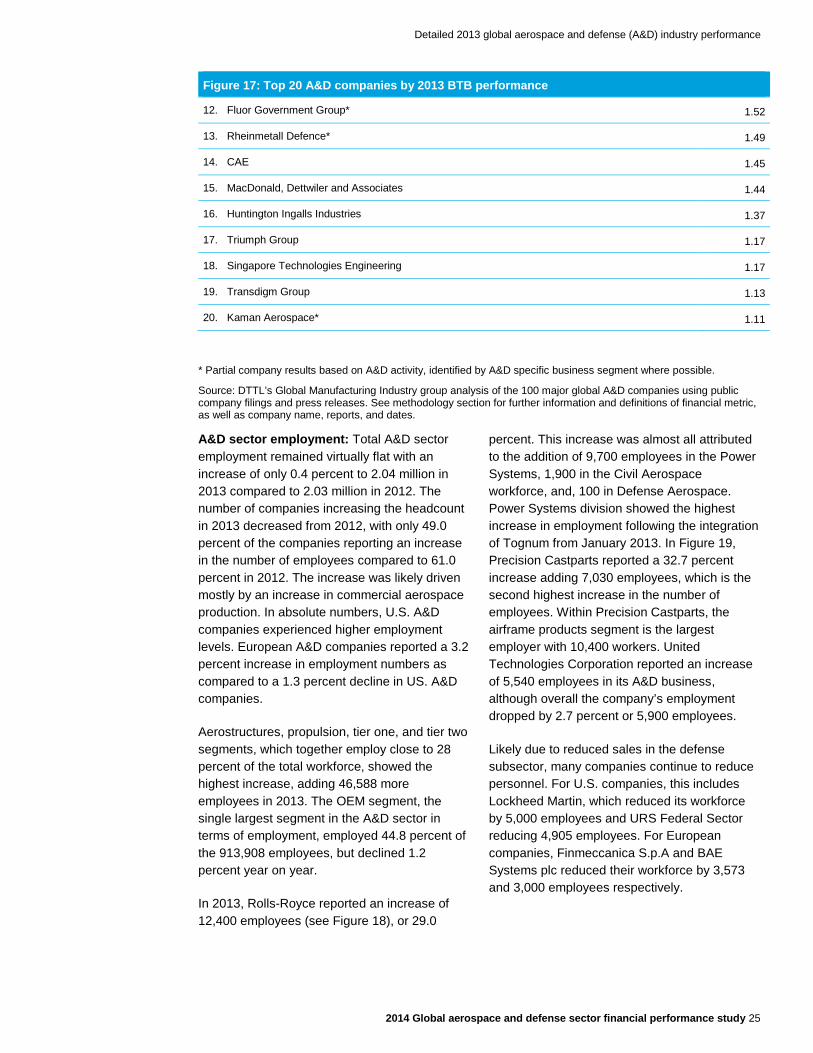
Figure 17: Top 20 A&D companies by 2013 BTB performance
1. Airbus Group 3.03
2. SAAB 2.08
3. GE Aviation 2.04
4. OHB AG 2.03
5. Spirit Aerosystems 1.97
6. Embraer 1.92
7. Rolls-Royce 1.74
8. GenCorp 1.72
9. Bombardier Aerospace* 1.60
10. The Boeing Company 1.59
11. Safran 1.54
Detailed 2013 global aerospace and defense (A&D) industry performance
2014 Global aerospace and defense sector financial performance study 25
Figure 17: Top 20 A&D companies by 2013 BTB performance
12. Fluor Government Group* 1.52
13. Rheinmetall Defence* 1.49
14. CAE 1.45
15. MacDonald, Dettwiler and Associates 1.44
16. Huntington Ingalls Industries 1.37
17. Triumph Group 1.17
18. Singapore Technologies Engineering 1.17
19. Transdigm Group 1.13
20. Kaman Aerospace* 1.11
* Partial company results based on A&D activity, identified by A&D specific business segment where possible.
Source: DTTL’s Global Manufacturing Industry group analysis of the 100 major global A&D companies using public company filings and press releases. See methodology section for further information and definitions of financial metric, as well as company name, reports, and dates.
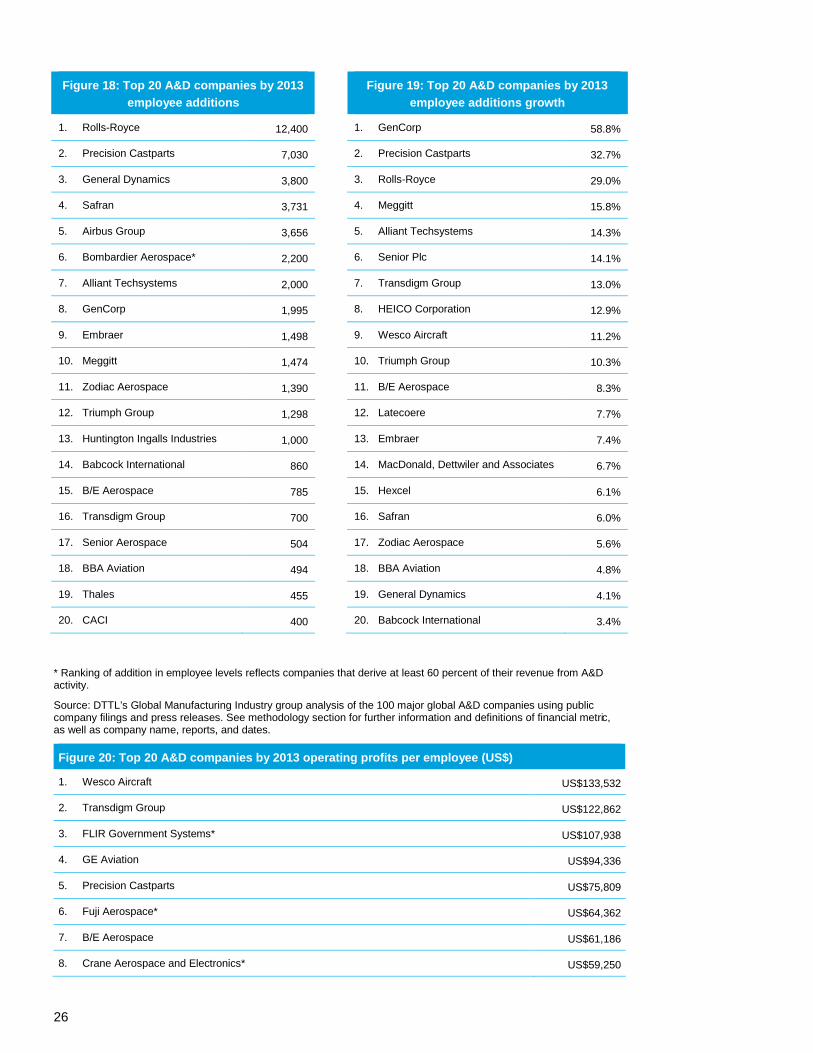
A&D sector employment: Total A&D sector employment remained virtually flat with an increase of only 0.4 percent to 2.04 million in 2013 compared to 2.03 million in 2012. The number of companies increasing the headcount in 2013 decreased from 2012, with only 49.0 percent of the companies reporting an increase in the number of employees compared to 61.0 percent in 2012. The increase was likely driven mostly by an increase in commercial aerospace production. In absolute numbers, U.S. A&D companies experienced higher employment levels. European A&D companies reported a 3.2 percent increase in employment numbers as compared to a 1.3 percent decline in US. A&D companies.
Aerostructures, propulsion, tier one, and tier two segments, which together employ close to 28 percent of the total workforce, showed the highest increase, adding 46,588 more employees in 2013. The OEM segment, the single largest segment in the A&D sector in terms of employment, employed 44.8 percent of the 913,908 employees, but declined 1.2 percent year on year.
In 2013, Rolls-Royce reported an increase of 12,400 employees (see Figure 18), or 29.0
percent. This increase was almost all attributed to the addition of 9,700 employees in the Power Systems, 1,900 in the Civil Aerospace workforce, and, 100 in Defense Aerospace. Power Systems division showed the highest increase in employment following the integration of Tognum from January 2013. In Figure 19, Precision Castparts reported a 32.7 percent increase adding 7,030 employees, which is the second highest increase in the number of employees. Within Precision Castparts, the airframe products segment is the largest employer with 10,400 workers. United Technologies Corporation reported an increase of 5,540 employees in its A&D business, although overall the company’s employment dropped by 2.7 percent or 5,900 employees.
Likely due to reduced sales in the defense subsector, many companies continue to reduce personnel. For U.S. companies, this includes Lockheed Martin, which reduced its workforce by 5,000 employees and URS Federal Sector reducing 4,905 employees. For European companies, Finmeccanica S.p.A and BAE Systems plc reduced their workforce by 3,573 and 3,000 employees respectively.
26
Figure 18: Top 20 A&D companies by 2013 employee additions
Figure 19: Top 20 A&D companies by 2013 employee additions growth
1. Rolls-Royce 12,400 1. GenCorp 58.8%
2. Precision Castparts 7,030 2. Precision Castparts 32.7%
3. General Dynamics 3,800 3. Rolls-Royce 29.0%
4. Safran 3,731 4. Meggitt 15.8%
5. Airbus Group 3,656 5. Alliant Techsystems 14.3%
6. Bombardier Aerospace* 2,200 6. Senior Plc 14.1%
7. Alliant Techsystems 2,000 7. Transdigm Group 13.0%
8. GenCorp 1,995 8. HEICO Corporation 12.9%
9. Embraer 1,498 9. Wesco Aircraft 11.2%
10. Meggitt 1,474 10. Triumph Group 10.3%
11. Zodiac Aerospace 1,390 11. B/E Aerospace 8.3%
12. Triumph Group 1,298 12. Latecoere 7.7%
13. Huntington Ingalls Industries 1,000 13. Embraer 7.4%
14. Babcock International 860 14. MacDonald, Dettwiler and Associates 6.7%
15. B/E Aerospace 785 15. Hexcel 6.1%
16. Transdigm Group 700 16. Safran 6.0%
17. Senior Aerospace 504 17. Zodiac Aerospace 5.6%
18. BBA Aviation 494 18. BBA Aviation 4.8%
19. Thales 455 19. General Dynamics 4.1%
20. CACI 400 20. Babcock International 3.4%
* Ranking of addition in employee levels reflects companies that derive at least 60 percent of their revenue from A&D activity.
Source: DTTL’s Global Manufacturing Industry group analysis of the 100 major global A&D companies using public company filings and press releases. See methodology section for further information and definitions of financial metric, as well as company name, reports, and dates.
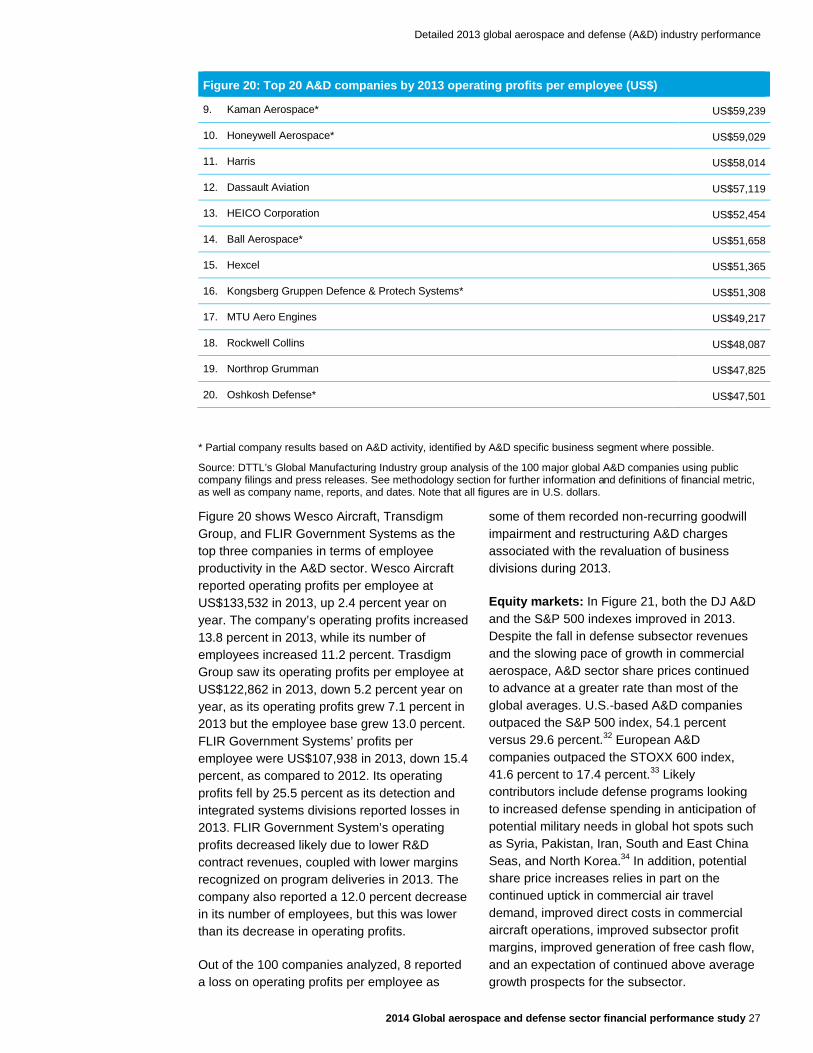
Figure 20: Top 20 A&D companies by 2013 operating profits per employee (US$)
1. Wesco Aircraft US$133,532
2. Transdigm Group US$122,862
3. FLIR Government Systems* US$107,938
4. GE Aviation US$94,336
5. Precision Castparts US$75,809
6. Fuji Aerospace* US$64,362
7. B/E Aerospace US$61,186
8. Crane Aerospace and Electronics* US$59,250
Detailed 2013 global aerospace and defense (A&D) industry performance
2014 Global aerospace and defense sector financial performance study 27
Figure 20: Top 20 A&D companies by 2013 operating profits per employee (US$)
9. Kaman Aerospace* US$59,239
10. Honeywell Aerospace* US$59,029
11. Harris US$58,014
12. Dassault Aviation US$57,119
13. HEICO Corporation US$52,454
14. Ball Aerospace* US$51,658
15. Hexcel US$51,365
16. Kongsberg Gruppen Defence & Protech Systems* US$51,308
17. MTU Aero Engines US$49,217
18. Rockwell Collins US$48,087
19. Northrop Grumman US$47,825
20. Oshkosh Defense* US$47,501
* Partial company results based on A&D activity, identified by A&D specific business segment where possible.
Source: DTTL’s Global Manufacturing Industry group analysis of the 100 major global A&D companies using public company filings and press releases. See methodology section for further information and definitions of financial metric, as well as company name, reports, and dates. Note that all figures are in U.S. dollars.
Figure 20 shows Wesco Aircraft, Transdigm Group, and FLIR Government Systems as the top three companies in terms of employee productivity in the A&D sector. Wesco Aircraft reported operating profits per employee at US$133,532 in 2013, up 2.4 percent year on year. The company’s operating profits increased 13.8 percent in 2013, while its number of employees increased 11.2 percent. Trasdigm Group saw its operating profits per employee at US$122,862 in 2013, down 5.2 percent year on year, as its operating profits grew 7.1 percent in 2013 but the employee base grew 13.0 percent. FLIR Government Systems’ profits per employee were US$107,938 in 2013, down 15.4 percent, as compared to 2012. Its operating profits fell by 25.5 percent as its detection and integrated systems divisions reported losses in 2013. FLIR Government System’s operating profits decreased likely due to lower R&D contract revenues, coupled with lower margins recognized on program deliveries in 2013. The company also reported a 12.0 percent decrease in its number of employees, but this was lower than its decrease in operating profits.
Out of the 100 companies analyzed, 8 reported a loss on operating profits per employee as
some of them recorded non-recurring goodwill impairment and restructuring A&D charges associated with the revaluation of business divisions during 2013.
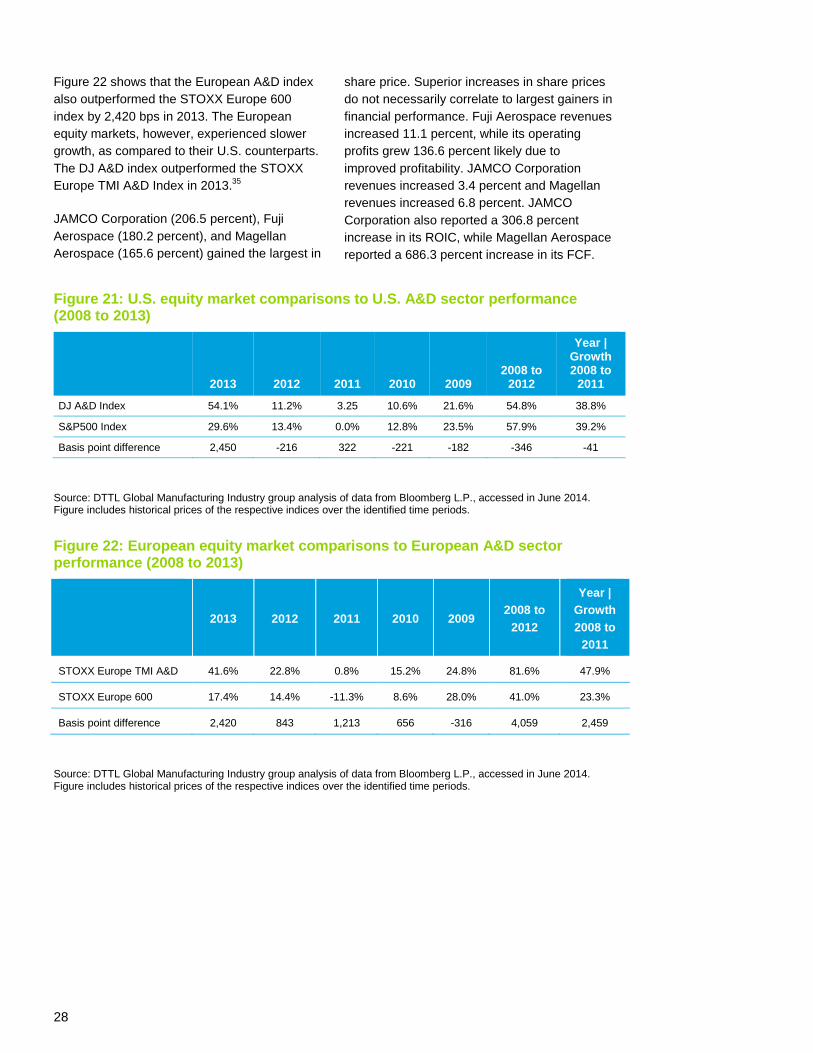
Equity markets: In Figure 21, both the DJ A&D and the S&P 500 indexes improved in 2013. Despite the fall in defense subsector revenues and the slowing pace of growth in commercial aerospace, A&D sector share prices continued to advance at a greater rate than most of the global averages. U.S.-based A&D companies outpaced the S&P 500 index, 54.1 percent versus 29.6 percent.32 European A&D companies outpaced the STOXX 600 index, 41.6 percent to 17.4 percent.33 Likely contributors include defense programs looking to increased defense spending in anticipation of potential military needs in global hot spots such as Syria, Pakistan, Iran, South and East China Seas, and North Korea.34 In addition, potential share price increases relies in part on the continued uptick in commercial air travel demand, improved direct costs in commercial aircraft operations, improved subsector profit margins, improved generation of free cash flow, and an expectation of continued above average growth prospects for the subsector.
28
Figure 22 shows that the European A&D index also outperformed the STOXX Europe 600 index by 2,420 bps in 2013. The European equity markets, however, experienced slower growth, as compared to their U.S. counterparts. The DJ A&D index outperformed the STOXX Europe TMI A&D Index in 2013.35
JAMCO Corporation (206.5 percent), Fuji Aerospace (180.2 percent), and Magellan Aerospace (165.6 percent) gained the largest in
share price. Superior increases in share prices do not necessarily correlate to largest gainers in financial performance. Fuji Aerospace revenues increased 11.1 percent, while its operating profits grew 136.6 percent likely due to improved profitability. JAMCO Corporation revenues increased 3.4 percent and Magellan revenues increased 6.8 percent. JAMCO Corporation also reported a 306.8 percent increase in its ROIC, while Magellan Aerospace reported a 686.3 percent increase in its FCF.
Figure 21: U.S. equity market comparisons to U.S. A&D sector performance (2008 to 2013)
2013 2012 2011 2010 2009 2008 to
2012
Year | Growth 2008 to
2011
DJ A&D Index 54.1% 11.2% 3.25 10.6% 21.6% 54.8% 38.8%
S&P500 Index 29.6% 13.4% 0.0% 12.8% 23.5% 57.9% 39.2%
Basis point difference 2,450 -216 322 -221 -182 -346 -41
Source: DTTL Global Manufacturing Industry group analysis of data from Bloomberg L.P., accessed in June 2014. Figure includes historical prices of the respective indices over the identified time periods.
Figure 22: European equity market comparisons to European A&D sector performance (2008 to 2013)
2013 2012 2011 2010 2009 2008 to
2012
Year | Growth 2008 to
2011
STOXX Europe TMI A&D 41.6% 22.8% 0.8% 15.2% 24.8% 81.6% 47.9%
STOXX Europe 600 17.4% 14.4% -11.3% 8.6% 28.0% 41.0% 23.3%
Basis point difference 2,420 843 1,213 656 -316 4,059 2,459
Source: DTTL Global Manufacturing Industry group analysis of data from Bloomberg L.P., accessed in June 2014. Figure includes historical prices of the respective indices over the identified time periods.
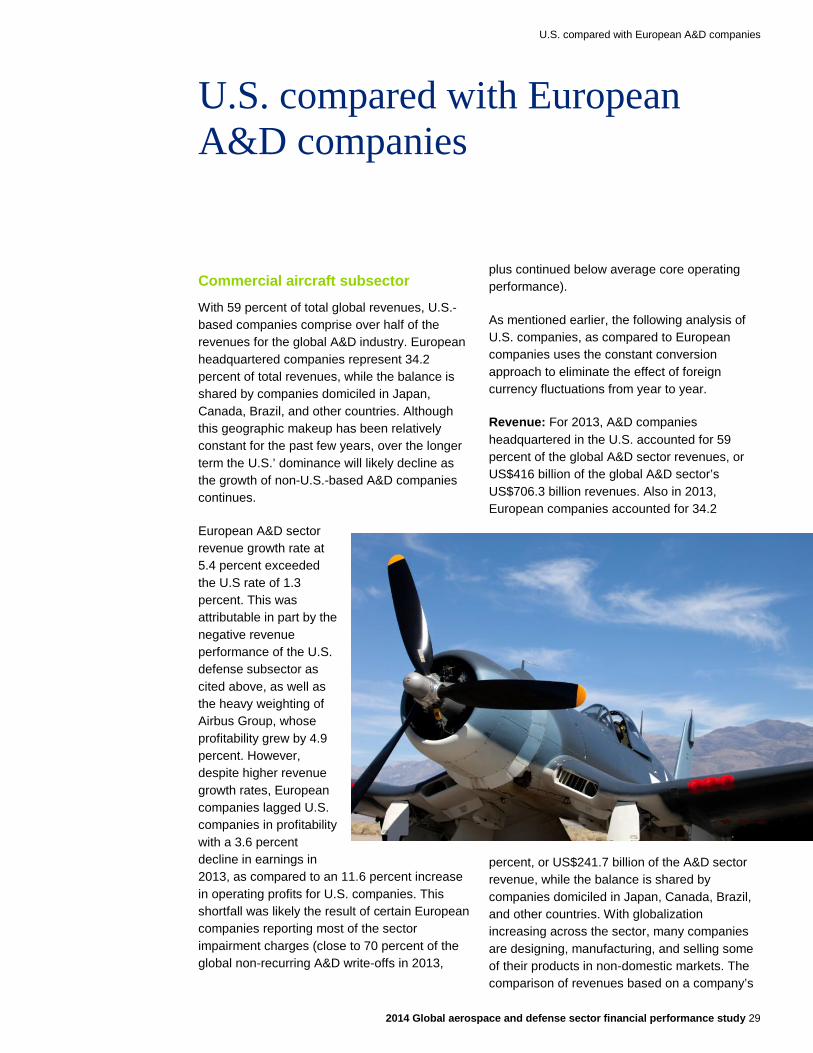
U.S. compared with European A&D companies
2014 Global aerospace and defense sector financial performance study 29
U.S. compared with European A&D companies
Commercial aircraft subsector
With 59 percent of total global revenues, U.S.-based companies comprise over half of the revenues for the global A&D industry. European headquartered companies represent 34.2 percent of total revenues, while the balance is shared by companies domiciled in Japan, Canada, Brazil, and other countries. Although this geographic makeup has been relatively constant for the past few years, over the longer term the U.S.’ dominance will likely decline as the growth of non-U.S.-based A&D companies continues.
European A&D sector revenue growth rate at 5.4 percent exceeded the U.S rate of 1.3 percent. This was attributable in part by the negative revenue performance of the U.S. defense subsector as cited above, as well as the heavy weighting of Airbus Group, whose profitability grew by 4.9 percent. However, despite higher revenue growth rates, European companies lagged U.S. companies in profitability with a 3.6 percent decline in earnings in 2013, as compared to an 11.6 percent increase in operating profits for U.S. companies. This shortfall was likely the result of certain European companies reporting most of the sector impairment charges (close to 70 percent of the global non-recurring A&D write-offs in 2013,
plus continued below average core operating performance).
As mentioned earlier, the following analysis of U.S. companies, as compared to European companies uses the constant conversion approach to eliminate the effect of foreign currency fluctuations from year to year.
Revenue: For 2013, A&D companies headquartered in the U.S. accounted for 59 percent of the global A&D sector revenues, or US$416 billion of the global A&D sector’s US$706.3 billion revenues. Also in 2013, European companies accounted for 34.2
percent, or US$241.7 billion of the A&D sector revenue, while the balance is shared by companies domiciled in Japan, Canada, Brazil, and other countries. With globalization increasing across the sector, many companies are designing, manufacturing, and selling some of their products in non-domestic markets. The comparison of revenues based on a company’s
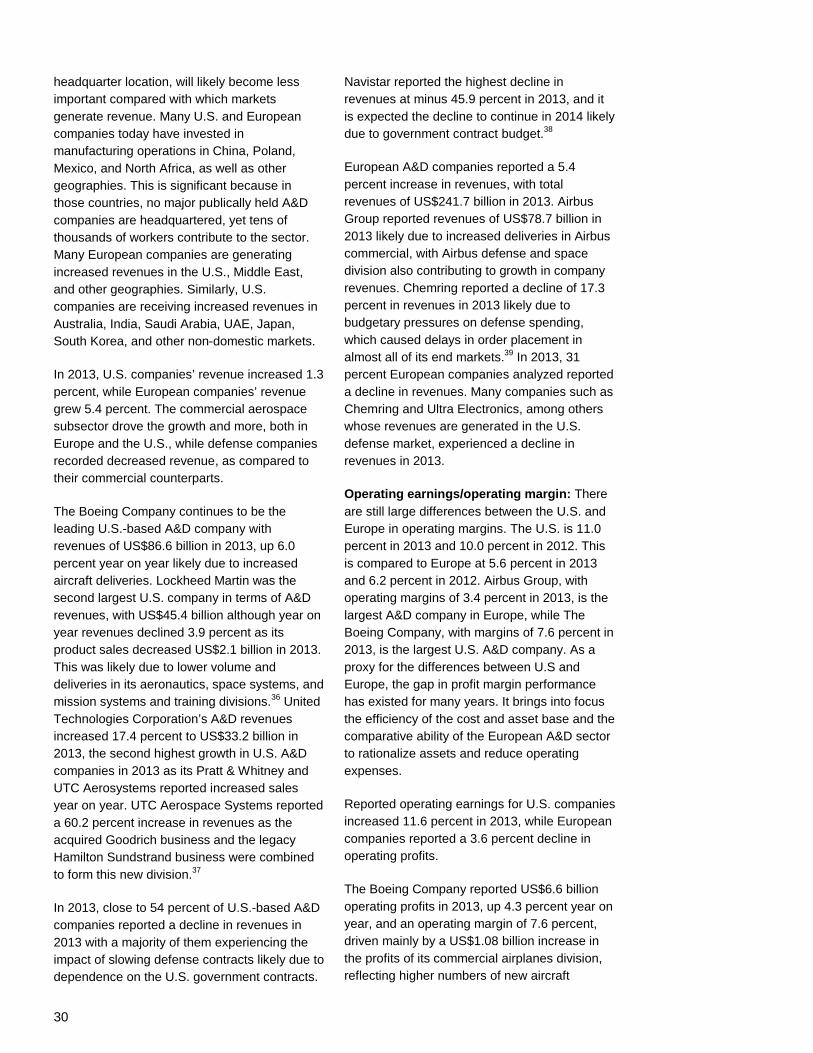
30
headquarter location, will likely become less important compared with which markets generate revenue. Many U.S. and European companies today have invested in manufacturing operations in China, Poland, Mexico, and North Africa, as well as other geographies. This is significant because in those countries, no major publically held A&D companies are headquartered, yet tens of thousands of workers contribute to the sector. Many European companies are generating increased revenues in the U.S., Middle East, and other geographies. Similarly, U.S. companies are receiving increased revenues in Australia, India, Saudi Arabia, UAE, Japan, South Korea, and other non-domestic markets.
In 2013, U.S. companies’ revenue increased 1.3 percent, while European companies’ revenue grew 5.4 percent. The commercial aerospace subsector drove the growth and more, both in Europe and the U.S., while defense companies recorded decreased revenue, as compared to their commercial counterparts.
The Boeing Company continues to be the leading U.S.-based A&D company with revenues of US$86.6 billion in 2013, up 6.0 percent year on year likely due to increased aircraft deliveries. Lockheed Martin was the second largest U.S. company in terms of A&D revenues, with US$45.4 billion although year on year revenues declined 3.9 percent as its product sales decreased US$2.1 billion in 2013. This was likely due to lower volume and deliveries in its aeronautics, space systems, and mission systems and training divisions.36 United Technologies Corporation’s A&D revenues increased 17.4 percent to US$33.2 billion in 2013, the second highest growth in U.S. A&D companies in 2013 as its Pratt & Whitney and UTC Aerosystems reported increased sales year on year. UTC Aerospace Systems reported a 60.2 percent increase in revenues as the acquired Goodrich business and the legacy Hamilton Sundstrand business were combined to form this new division.37
In 2013, close to 54 percent of U.S.-based A&D companies reported a decline in revenues in 2013 with a majority of them experiencing the impact of slowing defense contracts likely due to dependence on the U.S. government contracts.
Navistar reported the highest decline in revenues at minus 45.9 percent in 2013, and it is expected the decline to continue in 2014 likely due to government contract budget.38
European A&D companies reported a 5.4 percent increase in revenues, with total revenues of US$241.7 billion in 2013. Airbus Group reported revenues of US$78.7 billion in 2013 likely due to increased deliveries in Airbus commercial, with Airbus defense and space division also contributing to growth in company revenues. Chemring reported a decline of 17.3 percent in revenues in 2013 likely due to budgetary pressures on defense spending, which caused delays in order placement in almost all of its end markets.39 In 2013, 31 percent European companies analyzed reported a decline in revenues. Many companies such as Chemring and Ultra Electronics, among others whose revenues are generated in the U.S. defense market, experienced a decline in revenues in 2013.
Operating earnings/operating margin: There are still large differences between the U.S. and Europe in operating margins. The U.S. is 11.0 percent in 2013 and 10.0 percent in 2012. This is compared to Europe at 5.6 percent in 2013 and 6.2 percent in 2012. Airbus Group, with operating margins of 3.4 percent in 2013, is the largest A&D company in Europe, while The Boeing Company, with margins of 7.6 percent in 2013, is the largest U.S. A&D company. As a proxy for the differences between U.S and Europe, the gap in profit margin performance has existed for many years. It brings into focus the efficiency of the cost and asset base and the comparative ability of the European A&D sector to rationalize assets and reduce operating expenses.
Reported operating earnings for U.S. companies increased 11.6 percent in 2013, while European companies reported a 3.6 percent decline in operating profits.
The Boeing Company reported US$6.6 billion operating profits in 2013, up 4.3 percent year on year, and an operating margin of 7.6 percent, driven mainly by a US$1.08 billion increase in the profits of its commercial airplanes division, reflecting higher numbers of new aircraft
U.S. compared with European A&D companies
2014 Global aerospace and defense sector financial performance study 31
deliveries and lower research and development expenses. General Dynamics, with an operating margin at 11.8 percent, reported the highest increase in operating profits year on year at 342.4 percent, likely due to the US$2 billion in impairment charges recorded in 2012. Excluding the effect of the charges in 2012, in 2013 the operating profits increased for the company’s aerospace and combat systems divisions likely due to increased deliveries of G650 aircraft and the favorable impact of cost savings associated with restructuring activities in their European military vehicles business. Lockheed Martin reported the second highest operating profits at US$4,505 million, up 1.6 percent year on year, with an operating margin of 9.9 percent, despite a 3.9 percent YoY decline in revenues in 2013. Among U.S. companies, Transdigm Group, Precision Castparts, and Crane Aerospace and Electronics reported the highest operating margins, while LISI Aerospace, Meggitt, and Zodiac Aerospace reported the highest operating margins among the European companies.
European A&D companies reported lower profits and margins compared to U.S. companies in 2013 because of increased non-recurring A&D related charges adding up to US$3.8 billion in 2013, compared to US$2.1 billion in 2012, while U.S.-based A&D companies reported A&D charges of US$1.7 billion and US$3.4 billion worth in 2013 and 2012 respectively.
Return on invested capital (ROIC): U.S. companies’ reported ROIC decreased 290 bps to 19.9 percent in 2013. Lockheed Martin reported an ROIC of 38.8 percent, with The Boeing Company reporting a return on capital of 33.9 percent. Out of the U.S. companies, four reported a negative ROIC in 2013, with Navistar yielding minus 61.5 percent, Spirit Aerosystems minus 22.1 percent, Delta Tucker Holdings minus14.8 percent, and Aeroflex at minus 8.5 percent.
European companies reported a 13.6 percent ROIC in 2013 versus 13.3 percent in 2012, a slight increase of 30 bps year on year. Among the European companies, Babcock International and Rolls-Royce represent the top two highest ROIC performers at 21.2 percent and 19.7 percent respectively. Four of the European
companies experienced negative ROIC with QinetiQ yielding minus 17.5 percent, Laetcoere minus 13.1 percent, ThyssenKrupp Marine Systems minus 7.8 percent, and Chemring minus 4.8 percent.
Free cash flow (FCF)/free cash margin (FCM): U.S. A&D companies reported free cash flow of US$40 billion, up 29.0 percent year on year likely due to strong operating profitability. European A&D companies reported free cash flow of US$6.8 billion, down 39.5 percent year on year likely due to the 3.6 percent decrease in operating profits. U.S. companies reported a 130 bps improvement in free cash margins, while European companies saw a 330 bps decrease in free cash margins.
QinetiQ and Meggitt were the top two European A&D companies with free cash margins at 15.3 percent and 14.3 percent respectively. QinetiQ reported a 35.8 percent increase in its FCM likely due to improved cash flow during the year, while Meggitt experienced a 22.6 percent decline in its FCM as its FCF decreased to US$365 million in 2013, down 21.1 percent.
Among U.S. companies, Transdigm Group and FLIR Government Systems were the top performers with 22.6 percent and 20.2 percent FCM in 2013. FLIR Government Systems reported a 25.1 percent increase in FCM in 201 as its FCF increased 33.3 percent to US$302.9 million in 2013.
Book-to-bill (BTB) ratio: Airbus Group, with a BTB of 3.03 times, experienced the highest metric in the global A&D sector. The European A&D companies’ BTB increased to 1.83 times in 2013, as compared to 1.23 times in 2012. However, excluding Airbus Group, the European A&D sector’s BTB fell to 1.18 times in 2013 and 1.12 times in 2012, reflecting the impact of Airbus Group on the Europe A&D industry.
U.S. companies’ BTB in 2013 was 1.14 times the same as in 2012 with GE Aviation being the highest performer ahead of The Boeing Company with a 2.04 times BTB. This reflects the high order book for GE engines for the new bigger and more fuel- efficient aircraft. The Boeing Company’s BTB increased to 1.59 times in 2013 compared to 1.43 times in 2012 as its
32
backlog increased 13 percent to US$441 billion in 2013 likely due to high order intakes for its commercial aircraft.
Employment productivity: Overall A&D sector employment increased 0.4 percent to 2.04 million in 2013, while employee productivity increased 8.3 percent to US$30,661 likely due to the overall operating profits increasing 8.8 percent.
The operating profits per employee in the European A&D sector decreased 6.5 percent year on year, as its workforce increased by 3.0 percent, while its operating profits decreased 3.6 percent in 2013, as compared to 2012. For the U.S. A&D sector, the employee productivity increased 13.1 percent year on year to US$37,533 as their operating profits increased, while the employee workforce decreased 1.3 percent to 1.2 million.
Wesco Aircraft outperformed the A&D sector in terms of employee productivity at US$133,532 in 2013, up 2.4 percent year on year. Its workforce increased 11.2 percent YoY to 1,354 employees in 2013, its operating profits increased 13.8 percent year on year.
Defense subsector
In Figure 23, U.S. Defense revenues declined 2.7 percent year on year in 2013 to US$256.8 billion from US$264.0 billion in 2012. The top 20 U.S. defense companies reported a 2.5 percent revenue decline year on year in 2013 as the revenues declined to US$224.6 billion in 2013, as compared to US$230.5 billion in 2012. However, in both years, the top 20 U.S companies accounted for 87 percent share of the total U.S. defense segment revenues with the other companies accounting for the
remaining 13 percent. European defense companies reported a year on year increase of 2.4 percent in revenues as the revenues increased to US$120.3 billion in 2013 with 9 out of the top 20 defense companies reporting increased revenues in 2013.
The overall defense subsector reported an 8.9 percent increase in operating profits in 2013.The U.S. defense companies reported operating earnings of US$26.6 billion in 2013 compared to US$24.2 billion in 2012, an increase of 10.0 percent as the top 20 U.S. defense companies also reported 10.0 percent increase in operating profits year on year. The top 20 U.S. defense companies accounted for 88 percent of the defense subsector operating profits in the U.S. The European defense companies reported a decline of 22.0 percent in their profitability as companies like BAE Systems plc reported non-recurring A&D related charges in 2013.
Average margins for U.S. and European defense companies varied widely. In total, U.S. defense companies recorded operating margins of 10.4 percent, while European defense companies reported 4.7 percent operating margins. As a proxy for the differences between U.S and Europe, the gap in profit margin performance has existed for many years. It brings into focus the efficiency of the cost and asset base and the comparative ability of the European A&D sector to rationalize assets and reduce operating expenses. In the European A&D sector, country specific defense budgets supporting the individual country industrial base may not be enough to achieve competitive efficiencies. Thus, the European A&D sector may benefit from a certain level of regional consolidation in order to gain scale economies should that coincide with national employment and defense policies.
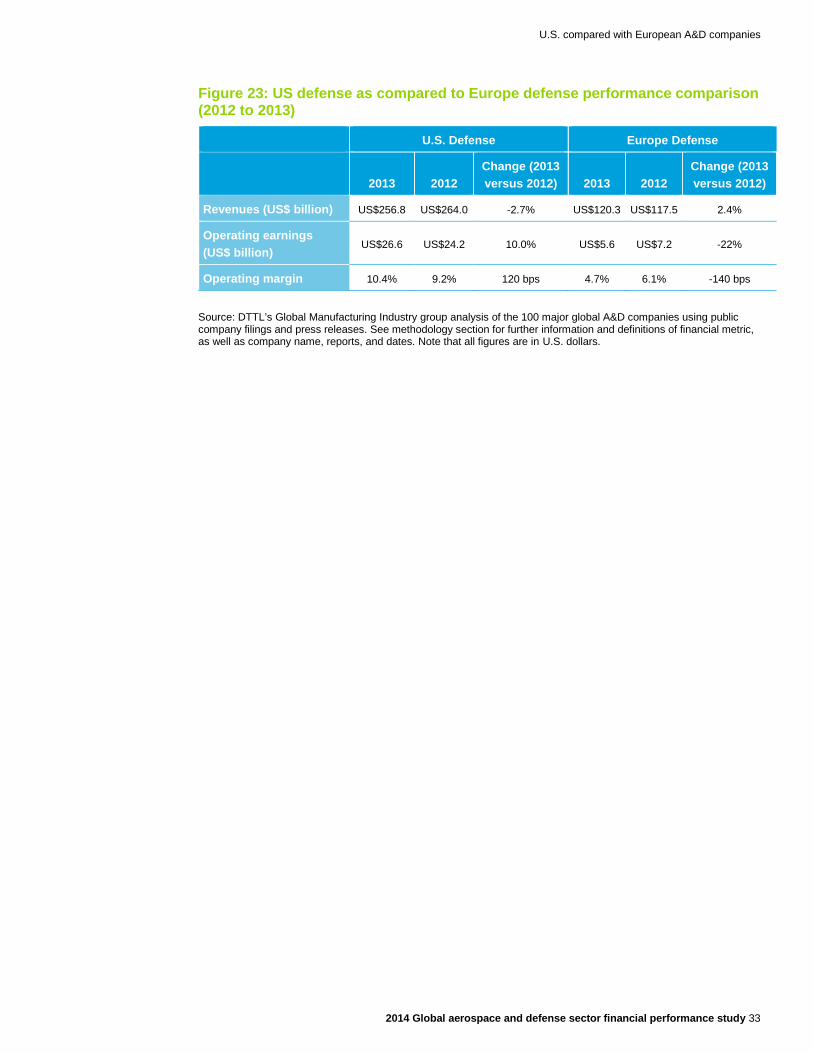
U.S. compared with European A&D companies
2014 Global aerospace and defense sector financial performance study 33
Figure 23: US defense as compared to Europe defense performance comparison (2012 to 2013)
U.S. Defense Europe Defense
2013 2012
Change (2013 versus 2012) 2013 2012
Change (2013 versus 2012)
Revenues (US$ billion) US$256.8 US$264.0 -2.7% US$120.3 US$117.5 2.4%
Operating earnings (US$ billion)
US$26.6 US$24.2 10.0% US$5.6 US$7.2 -22%
Operating margin 10.4% 9.2% 120 bps 4.7% 6.1% -140 bps
Source: DTTL’s Global Manufacturing Industry group analysis of the 100 major global A&D companies using public company filings and press releases. See methodology section for further information and definitions of financial metric, as well as company name, reports, and dates. Note that all figures are in U.S. dollars.
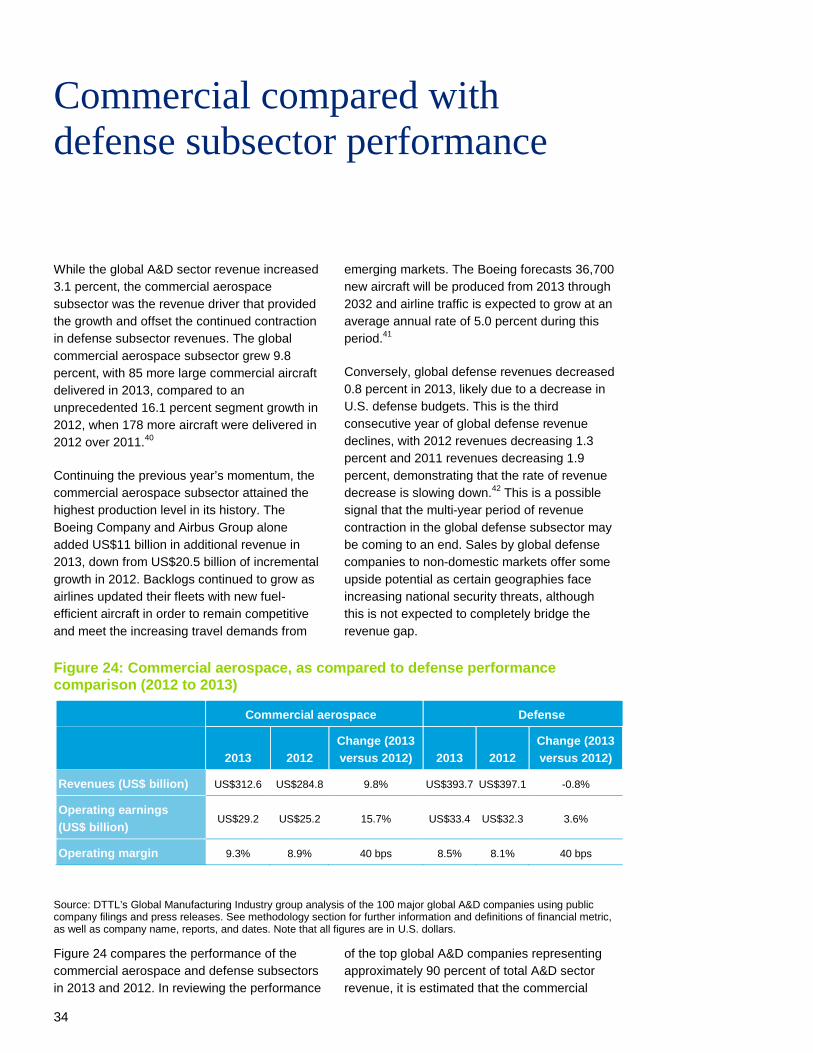
34
Commercial compared with defense subsector performance
While the global A&D sector revenue increased 3.1 percent, the commercial aerospace subsector was the revenue driver that provided the growth and offset the continued contraction in defense subsector revenues. The global commercial aerospace subsector grew 9.8 percent, with 85 more large commercial aircraft delivered in 2013, compared to an unprecedented 16.1 percent segment growth in 2012, when 178 more aircraft were delivered in 2012 over 2011.40
Continuing the previous year’s momentum, the commercial aerospace subsector attained the highest production level in its history. The Boeing Company and Airbus Group alone added US$11 billion in additional revenue in 2013, down from US$20.5 billion of incremental growth in 2012. Backlogs continued to grow as airlines updated their fleets with new fuel-efficient aircraft in order to remain competitive and meet the increasing travel demands from
emerging markets. The Boeing forecasts 36,700 new aircraft will be produced from 2013 through 2032 and airline traffic is expected to grow at an average annual rate of 5.0 percent during this period.41
Conversely, global defense revenues decreased 0.8 percent in 2013, likely due to a decrease in U.S. defense budgets. This is the third consecutive year of global defense revenue declines, with 2012 revenues decreasing 1.3 percent and 2011 revenues decreasing 1.9 percent, demonstrating that the rate of revenue decrease is slowing down.42 This is a possible signal that the multi-year period of revenue contraction in the global defense subsector may be coming to an end. Sales by global defense companies to non-domestic markets offer some upside potential as certain geographies face increasing national security threats, although this is not expected to completely bridge the revenue gap.
Figure 24: Commercial aerospace, as compared to defense performance comparison (2012 to 2013)
Commercial aerospace Defense
2013 2012
Change (2013 versus 2012) 2013 2012
Change (2013 versus 2012)
Revenues (US$ billion) US$312.6 US$284.8 9.8% US$393.7 US$397.1 -0.8%
Operating earnings (US$ billion)
US$29.2 US$25.2 15.7% US$33.4 US$32.3 3.6%
Operating margin 9.3% 8.9% 40 bps 8.5% 8.1% 40 bps
Source: DTTL’s Global Manufacturing Industry group analysis of the 100 major global A&D companies using public company filings and press releases. See methodology section for further information and definitions of financial metric, as well as company name, reports, and dates. Note that all figures are in U.S. dollars.
Figure 24 compares the performance of the commercial aerospace and defense subsectors in 2013 and 2012. In reviewing the performance
of the top global A&D companies representing approximately 90 percent of total A&D sector revenue, it is estimated that the commercial
34
aerospace subsector’s revenues grew 9.8 percent, while the defense subsector’s revenue declined 0.8 percent in 2013. Airbus Commercial revenues increased 8.7 percent likely due to the strong order books for commercial aerospace, while Airbus Military and Eurocopter also contributed positively to the company’s revenues with a 7.6 percent increase year on year. Airbus Group’s profitability also increased with commercial aerospace profits increasing 26.6 percent, while defense profits increased 25.3 percent. Similar to Airbus Group, The Boeing Company also experienced
increased commercial as well as defense revenues and improved profitability, although The Boeing Company’s defense revenues increased only 1.8 percent in 2013, with defense profits increasing 5.4 year on year#. General Dynamics with a 26 percent to 74 percent commercial to defense share ratio in 2013, which saw a 6.1 percent decline in defense revenues as the defense sector experienced budget cuts. Similarly, Lockheed Martin also experienced a 3.9 percent decline in defense revenues, likely due to lower volume and delivery of military aircraft during 2013.
Note: # Page 19 of The Boeing Company’s 10-K; however, since The Boeing Company derived equal to or greater than 60 percent of its revenue from A&D, total revenue for the company was used and therefore, there will be difference in growth rates in for performance calculations. For more details, please refer to the study’s methodology section.
Segment performance
2014 Global aerospace and defense sector financial performance study 35
Segment performance
Original equipment manufacturers and supplier companies
The 2013 OEM segment revenues reported in this year’s study increased 1.9 percent to US$372.1 billion, up from US$362.1 billion in 2012. This is compared to the A&D sector’s overall revenue growth of 3.1 percent. Revenue declines in defense subsector companies reduced the growth average for the OEM group. However, revenue growth of the OEM segment leaders, The Boeing Company and Airbus Group, helped offset defense-related declines. Suppliers included in this study, excluding the electronics and tier three segments, reported positive revenue growth that exceeded the A&D sector average. In Figure 25, companies among the tier one suppliers and propulsion segment generated double-digit revenue growth including tier one at 15.8 percent and propulsion and 14.1 percent. Tier two suppliers with a 7.1 percent increase in revenues and aerostructures with 8.0 percent still reported higher revenue growth compared to the A&D sector in 2013. However, tier three suppliers with 4.0 percent and electronics with minus 2.2 percent, reported a decline in revenues in 2013.
The OEM segment’s reported operating earnings increased 13.3 percent to US$25.9 billion in 2013 from US$22.8 billion in 2012 (see Figure 25). OEM’s operating earnings outperformed the 8.8 percent increase in overall A&D sector earnings. This outperformance was likely due to the performance of Airbus Group and The Boeing Company in 2013, coupled with the performance of General Dynamics and Finmeccanica S.p.A for whom non-recurring charges recorded last year in 2012 did not get repeated in 2013.
In Figure 26, OEM core operating earnings increased 6.2 percent in 2013, less than the A&D sector’s core average of 8.1 percent. Tier two with 9.3 percent, tier one suppliers with 27.7
percent, propulsion with 16.8 percent, and aerostructures with 33.5 percent core operating earnings outperformed the A&D sector. However, electronics with minus 0.7 percent, services with minus 4.0 percent, and tier three suppliers with minus 18.9 percent core operating earnings lagged the A&D sector, as companies worldwide faced constrained defense budgets coupled with non-recurring charges as they restructured their businesses to meet challenges.
The A&D sector’s average operating margin increased 5.2 percent, or 43 bps to 8.9 percent with aerostructures (4.0 percent increase), OEMs (10.5 percent increase), propulsion (2.7 percent increase), and tier one suppliers (12.9 percent increase) performing above sector average. This was slightly offset by tier three suppliers (69.0 percent decline), tier two suppliers (2.1 percent decline), services (13.7 percent decline), and electronics (1.6 percent decline). The tier two supplier segment reported the highest operating margins in 2013 at 16.3 percent, however its year on year performance declined 2.1 percent likely due to a one-time charge totaling US$472 million, as compared to US$190.9 million in 2012. Tier three suppliers reported the lowest margins in 2013 at 2.3 percent down 521 bps year on year largely likely due to one-time charges of US$115.8 million. The core operating margins for the sector stood at 9.7 percent, increasing 42 bps compared to 2012. Apart from tier three suppliers (15.2 percent decline year on year), the other subsectors’ core operating margins increased compared to 2012. Aerostructures reported the highest increase in core operating margins at 25.6 percent likely due to improved profitability in some of the constituent companies.
The ROIC for the A&D sector increased to 17.0 percent, down 176 bps compared to 2012 with only the propulsion segment experiencing a positive increase of 72 bps year on year.
36
Aerostructures with a 2.6 percent ROIC experienced the largest decline of 444 bps in 2013 as two of its constituent companies, Spirit Aerosystems and Latecoere, reported net losses in 2013. OEMs reported the highest ROIC at 21.4 percent, however year on year were down 207 bps as Lockheed Martin and Textron reported lower ROIC compared to 2012.
OEM’s total FCF decreased 13.1 percent to US$14.3 billion in 2013 from US$16.4 billion in 2012, as compared to the A&D sector’s FCF increase of 6.3 percent. Lower FCF in the OEM segment was largely attributable to SAAB, Finmeccanica S.p.A, and Airbus Group. The propulsion segment experienced the highest year on year increase in FCM at 143 bps as Rolls-Royce reported a 193 bps increase likely due to improved cash flow. The tier two segment reported operating margins of 9.5 percent, 32 bps increase year on year with FLIR Government Systems and Magellan Aerospace among the largest growth contributors.
The OEMs’ average BTB ratio in 2012 was 1.59 times versus 1.20 times for the A&D sector. The BTB ratio for OEMs increased 31.7 percent in 2013, as compared to the average A&D sector increase of 17.6 percent. The Boeing Company’s and Airbus Group’s impact on the BTB ratio for the segment was significant, given the relatively high-revenue weighting and strong individual BTB performance improvement of these two companies. The OEM and propulsion segments reported the highest BTB ratios at 1.59 times and 1.67 times, respectively,
reiterating the strong outlook for commercial aerospace as this subsector continues to be a key factor in global A&D sector revenue, profit, and backlog growth.
Services focused companies
Services companies, with a revenue decline of 6.4 percent to US$50.8 billion in 2013 underperformed the total global A&D sector, which grew 3.1 percent. Defense related services companies including URS Federal Sector, CSC, and Fluor Government Group, which accounted for close to 21 percent of the segment’s revenues, posted a 14.8 percent decline in revenues in 2013 and a 19.1 percent decline in operating profits. Delta Tucker reported an operating loss in 2013, as compared to an operating profit in 2012 likely due to the impact of goodwill, intangibles, and long-lived assets impairment charges of US$312.7 million in 2013.
Reported ROIC for the services companies also decreased 256 bps to 10.2 percent in 2013 from 12.7 percent in 2012, as Delta Tucker and QinetiQ reported negative ROIC metrics of minus 14.8 percent and minus 17.5 percent respectively. Services’ segment free cash flows increased 25.8 percent to US$5.2 billion in 2013, as compared to US$4.1 billion in 2012. Similarly, the segment’s BTB ratio also decreased 28.5 percent to 0.82 times in 2013 compared to 1.14 times in 2012, as most companies reported reduced backlog in 2013, likely due to reduced U.S. government spending on military actions in the Middle East region.
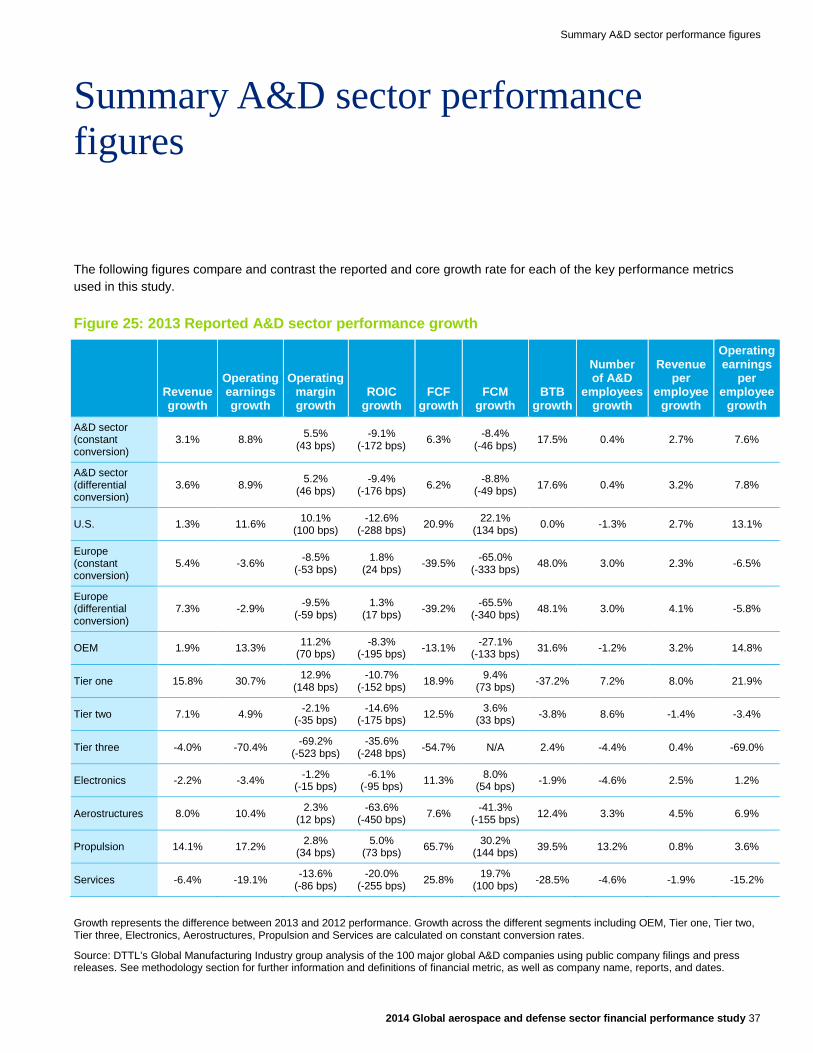
Summary A&D sector performance figures
2014 Global aerospace and defense sector financial performance study 37
Summary A&D sector performance figures
The following figures compare and contrast the reported and core growth rate for each of the key performance metrics used in this study.
Figure 25: 2013 Reported A&D sector performance growth
Revenue growth
Operating earnings growth
Operating margin growth
ROIC growth
FCF growth
FCM growth
BTB growth
Number of A&D
employees growth
Revenue per
employee growth
Operating earnings
per employee
growth
A&D sector (constant conversion)
3.1% 8.8% 5.5% (43 bps)
-9.1% (-172 bps) 6.3% -8.4%
(-46 bps) 17.5% 0.4% 2.7% 7.6%
A&D sector (differential conversion)
3.6% 8.9% 5.2% (46 bps)
-9.4% (-176 bps) 6.2% -8.8%
(-49 bps) 17.6% 0.4% 3.2% 7.8%
U.S. 1.3% 11.6% 10.1% (100 bps)
-12.6% (-288 bps) 20.9% 22.1%
(134 bps) 0.0% -1.3% 2.7% 13.1%
Europe (constant conversion)
5.4% -3.6% -8.5% (-53 bps)
1.8% (24 bps) -39.5% -65.0%
(-333 bps) 48.0% 3.0% 2.3% -6.5%
Europe (differential conversion)
7.3% -2.9% -9.5% (-59 bps)
1.3% (17 bps) -39.2% -65.5%
(-340 bps) 48.1% 3.0% 4.1% -5.8%
OEM 1.9% 13.3% 11.2% (70 bps)
-8.3% (-195 bps) -13.1% -27.1%
(-133 bps) 31.6% -1.2% 3.2% 14.8%
Tier one 15.8% 30.7% 12.9% (148 bps)
-10.7% (-152 bps) 18.9% 9.4%
(73 bps) -37.2% 7.2% 8.0% 21.9%
Tier two 7.1% 4.9% -2.1% (-35 bps)
-14.6% (-175 bps) 12.5% 3.6%
(33 bps) -3.8% 8.6% -1.4% -3.4%
Tier three -4.0% -70.4% -69.2% (-523 bps)
-35.6% (-248 bps) -54.7% N/A 2.4% -4.4% 0.4% -69.0%
Electronics -2.2% -3.4% -1.2% (-15 bps)
-6.1% (-95 bps) 11.3% 8.0%
(54 bps) -1.9% -4.6% 2.5% 1.2%
Aerostructures 8.0% 10.4% 2.3% (12 bps)
-63.6% (-450 bps) 7.6% -41.3%
(-155 bps) 12.4% 3.3% 4.5% 6.9%
Propulsion 14.1% 17.2% 2.8% (34 bps)
5.0% (73 bps) 65.7% 30.2%
(144 bps) 39.5% 13.2% 0.8% 3.6%
Services -6.4% -19.1% -13.6% (-86 bps)
-20.0% (-255 bps) 25.8% 19.7%
(100 bps) -28.5% -4.6% -1.9% -15.2%
Growth represents the difference between 2013 and 2012 performance. Growth across the different segments including OEM, Tier one, Tier two, Tier three, Electronics, Aerostructures, Propulsion and Services are calculated on constant conversion rates.
Source: DTTL’s Global Manufacturing Industry group analysis of the 100 major global A&D companies using public company filings and press releases. See methodology section for further information and definitions of financial metric, as well as company name, reports, and dates.
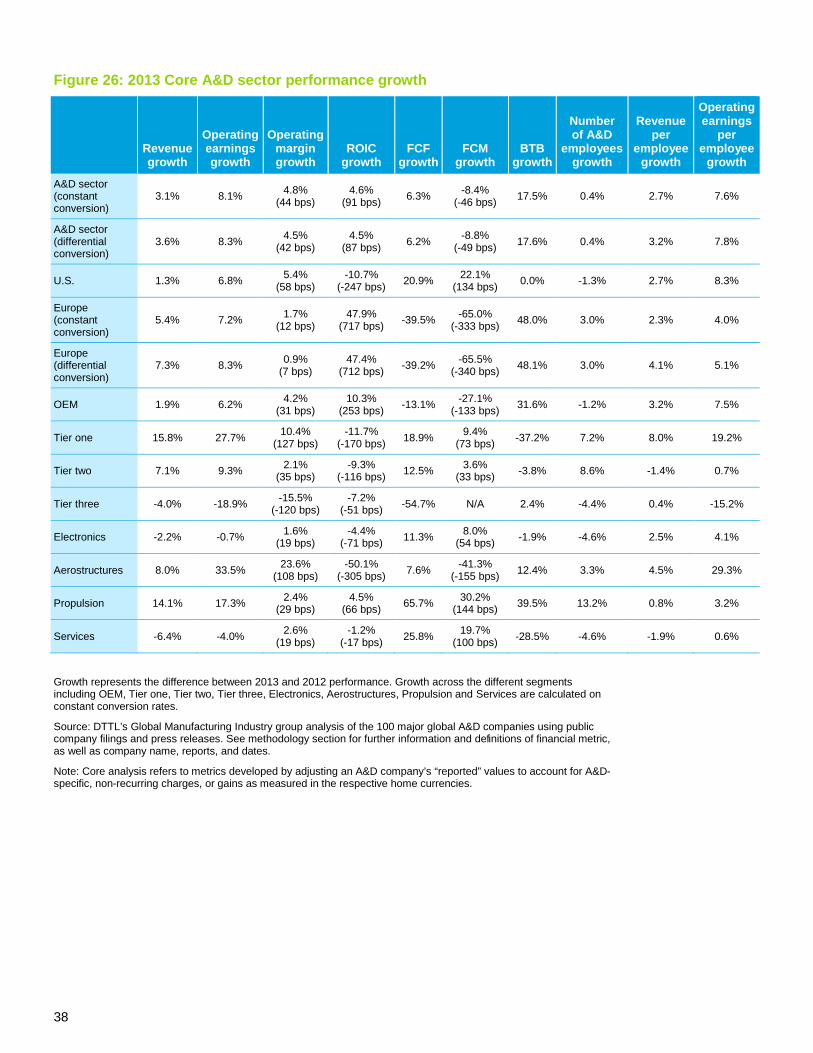
38
Figure 26: 2013 Core A&D sector performance growth
Revenue growth
Operating earnings growth
Operating margin growth
ROIC growth
FCF growth
FCM growth
BTB growth
Number of A&D
employees growth
Revenue per
employee growth
Operating earnings
per employee
growth
A&D sector (constant conversion)
3.1% 8.1% 4.8% (44 bps)
4.6% (91 bps) 6.3% -8.4%
(-46 bps) 17.5% 0.4% 2.7% 7.6%
A&D sector (differential conversion)
3.6% 8.3% 4.5% (42 bps)
4.5% (87 bps) 6.2% -8.8%
(-49 bps) 17.6% 0.4% 3.2% 7.8%
U.S. 1.3% 6.8% 5.4% (58 bps)
-10.7% (-247 bps) 20.9% 22.1%
(134 bps) 0.0% -1.3% 2.7% 8.3%
Europe (constant conversion)
5.4% 7.2% 1.7% (12 bps)
47.9% (717 bps) -39.5% -65.0%
(-333 bps) 48.0% 3.0% 2.3% 4.0%
Europe (differential conversion)
7.3% 8.3% 0.9% (7 bps)
47.4% (712 bps) -39.2% -65.5%
(-340 bps) 48.1% 3.0% 4.1% 5.1%
OEM 1.9% 6.2% 4.2% (31 bps)
10.3% (253 bps) -13.1% -27.1%
(-133 bps) 31.6% -1.2% 3.2% 7.5%
Tier one 15.8% 27.7% 10.4% (127 bps)
-11.7% (-170 bps) 18.9% 9.4%
(73 bps) -37.2% 7.2% 8.0% 19.2%
Tier two 7.1% 9.3% 2.1% (35 bps)
-9.3% (-116 bps) 12.5% 3.6%
(33 bps) -3.8% 8.6% -1.4% 0.7%
Tier three -4.0% -18.9% -15.5% (-120 bps)
-7.2% (-51 bps) -54.7% N/A 2.4% -4.4% 0.4% -15.2%
Electronics -2.2% -0.7% 1.6% (19 bps)
-4.4% (-71 bps) 11.3% 8.0%
(54 bps) -1.9% -4.6% 2.5% 4.1%
Aerostructures 8.0% 33.5% 23.6% (108 bps)
-50.1% (-305 bps) 7.6% -41.3%
(-155 bps) 12.4% 3.3% 4.5% 29.3%
Propulsion 14.1% 17.3% 2.4% (29 bps)
4.5% (66 bps) 65.7% 30.2%
(144 bps) 39.5% 13.2% 0.8% 3.2%
Services -6.4% -4.0% 2.6% (19 bps)
-1.2% (-17 bps) 25.8% 19.7%
(100 bps) -28.5% -4.6% -1.9% 0.6%
Growth represents the difference between 2013 and 2012 performance. Growth across the different segments including OEM, Tier one, Tier two, Tier three, Electronics, Aerostructures, Propulsion and Services are calculated on constant conversion rates.
Source: DTTL’s Global Manufacturing Industry group analysis of the 100 major global A&D companies using public company filings and press releases. See methodology section for further information and definitions of financial metric, as well as company name, reports, and dates.
Note: Core analysis refers to metrics developed by adjusting an A&D company’s “reported” values to account for A&D-specific, non-recurring charges, or gains as measured in the respective home currencies.
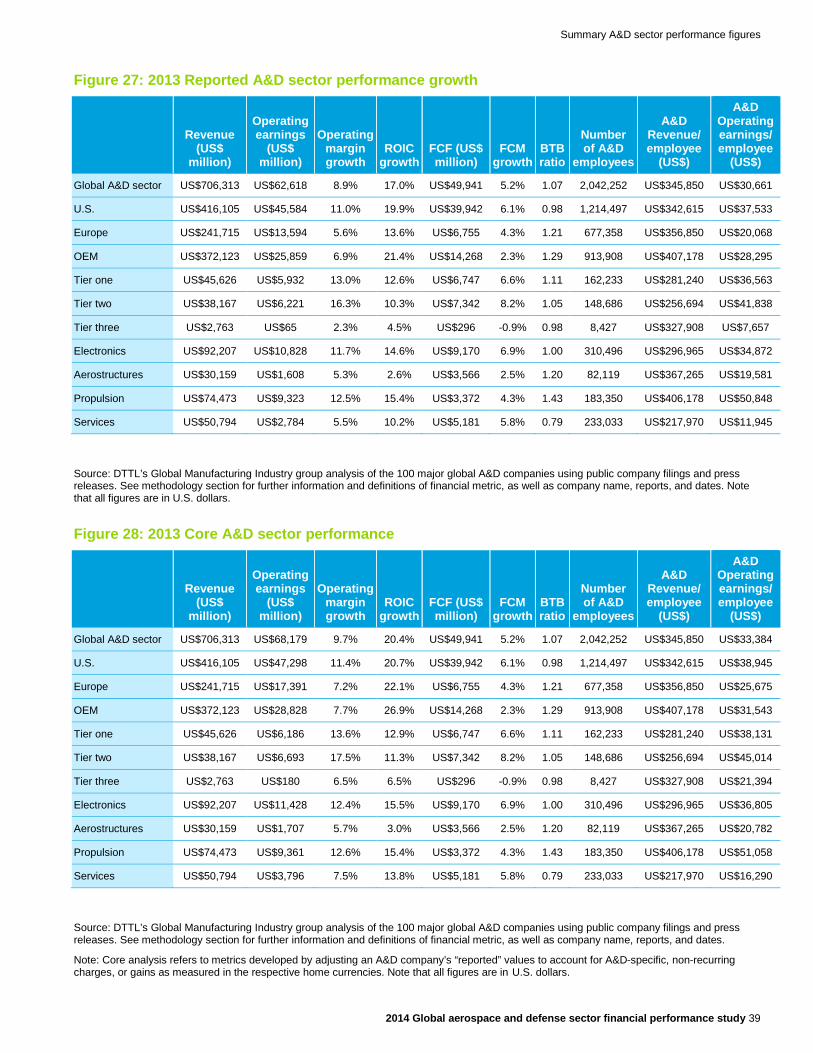
Summary A&D sector performance figures
2014 Global aerospace and defense sector financial performance study 39
Figure 27: 2013 Reported A&D sector performance growth
Revenue (US$
million)
Operating earnings
(US$ million)
Operating margin growth
ROIC growth
FCF (US$ million)
FCM growth
BTB ratio
Number of A&D
employees
A&D Revenue/ employee
(US$)
A&D Operating earnings/ employee
(US$)
Global A&D sector US$706,313 US$62,618 8.9% 17.0% US$49,941 5.2% 1.07 2,042,252 US$345,850 US$30,661
U.S. US$416,105 US$45,584 11.0% 19.9% US$39,942 6.1% 0.98 1,214,497 US$342,615 US$37,533
Europe US$241,715 US$13,594 5.6% 13.6% US$6,755 4.3% 1.21 677,358 US$356,850 US$20,068
OEM US$372,123 US$25,859 6.9% 21.4% US$14,268 2.3% 1.29 913,908 US$407,178 US$28,295
Tier one US$45,626 US$5,932 13.0% 12.6% US$6,747 6.6% 1.11 162,233 US$281,240 US$36,563
Tier two US$38,167 US$6,221 16.3% 10.3% US$7,342 8.2% 1.05 148,686 US$256,694 US$41,838
Tier three US$2,763 US$65 2.3% 4.5% US$296 -0.9% 0.98 8,427 US$327,908 US$7,657
Electronics US$92,207 US$10,828 11.7% 14.6% US$9,170 6.9% 1.00 310,496 US$296,965 US$34,872
Aerostructures US$30,159 US$1,608 5.3% 2.6% US$3,566 2.5% 1.20 82,119 US$367,265 US$19,581
Propulsion US$74,473 US$9,323 12.5% 15.4% US$3,372 4.3% 1.43 183,350 US$406,178 US$50,848
Services US$50,794 US$2,784 5.5% 10.2% US$5,181 5.8% 0.79 233,033 US$217,970 US$11,945
Source: DTTL’s Global Manufacturing Industry group analysis of the 100 major global A&D companies using public company filings and press releases. See methodology section for further information and definitions of financial metric, as well as company name, reports, and dates. Note that all figures are in U.S. dollars.
Figure 28: 2013 Core A&D sector performance
Revenue (US$
million)
Operating earnings
(US$ million)
Operating margin growth
ROIC growth
FCF (US$ million)
FCM growth
BTB ratio
Number of A&D
employees
A&D Revenue/ employee
(US$)
A&D Operating earnings/ employee
(US$)
Global A&D sector US$706,313 US$68,179 9.7% 20.4% US$49,941 5.2% 1.07 2,042,252 US$345,850 US$33,384
U.S. US$416,105 US$47,298 11.4% 20.7% US$39,942 6.1% 0.98 1,214,497 US$342,615 US$38,945
Europe US$241,715 US$17,391 7.2% 22.1% US$6,755 4.3% 1.21 677,358 US$356,850 US$25,675
OEM US$372,123 US$28,828 7.7% 26.9% US$14,268 2.3% 1.29 913,908 US$407,178 US$31,543
Tier one US$45,626 US$6,186 13.6% 12.9% US$6,747 6.6% 1.11 162,233 US$281,240 US$38,131
Tier two US$38,167 US$6,693 17.5% 11.3% US$7,342 8.2% 1.05 148,686 US$256,694 US$45,014
Tier three US$2,763 US$180 6.5% 6.5% US$296 -0.9% 0.98 8,427 US$327,908 US$21,394
Electronics US$92,207 US$11,428 12.4% 15.5% US$9,170 6.9% 1.00 310,496 US$296,965 US$36,805
Aerostructures US$30,159 US$1,707 5.7% 3.0% US$3,566 2.5% 1.20 82,119 US$367,265 US$20,782
Propulsion US$74,473 US$9,361 12.6% 15.4% US$3,372 4.3% 1.43 183,350 US$406,178 US$51,058
Services US$50,794 US$3,796 7.5% 13.8% US$5,181 5.8% 0.79 233,033 US$217,970 US$16,290
Source: DTTL’s Global Manufacturing Industry group analysis of the 100 major global A&D companies using public company filings and press releases. See methodology section for further information and definitions of financial metric, as well as company name, reports, and dates.
Note: Core analysis refers to metrics developed by adjusting an A&D company’s “reported” values to account for A&D-specific, non-recurring charges, or gains as measured in the respective home currencies. Note that all figures are in U.S. dollars.
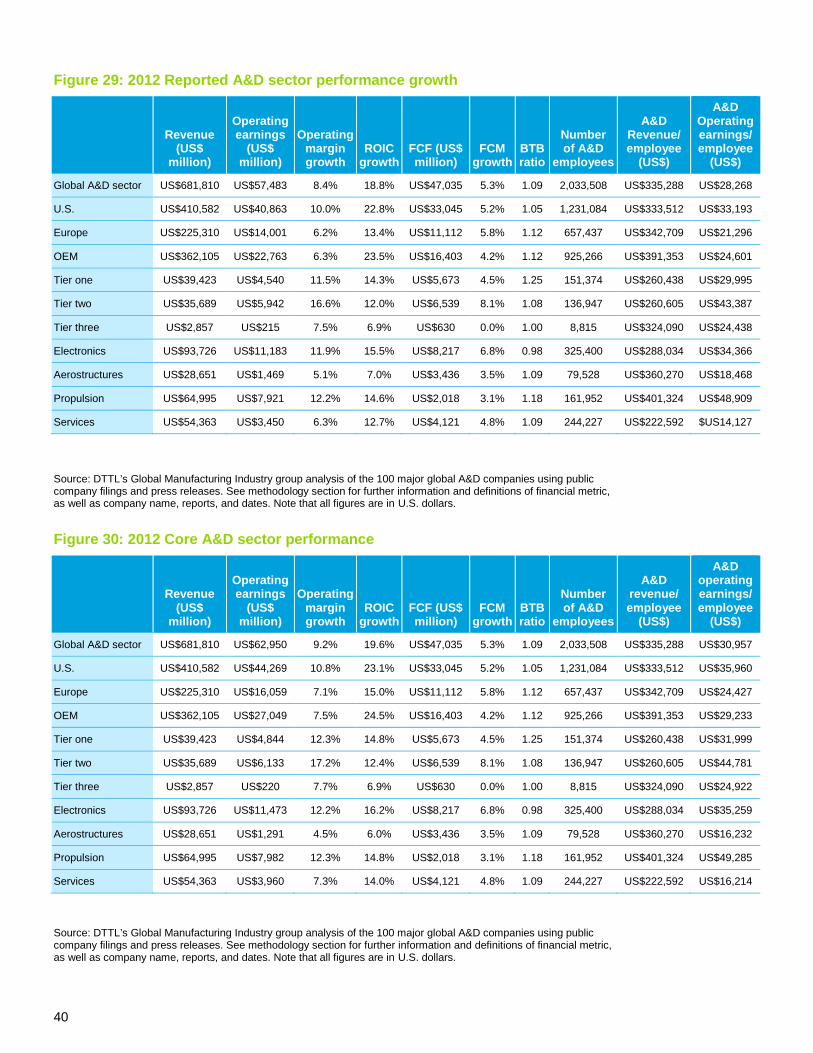
40
Figure 29: 2012 Reported A&D sector performance growth
Revenue (US$
million)
Operating earnings
(US$ million)
Operating margin growth
ROIC growth
FCF (US$ million)
FCM growth
BTB ratio
Number of A&D
employees
A&D Revenue/ employee
(US$)
A&D Operating earnings/ employee
(US$)
Global A&D sector US$681,810 US$57,483 8.4% 18.8% US$47,035 5.3% 1.09 2,033,508 US$335,288 US$28,268
U.S. US$410,582 US$40,863 10.0% 22.8% US$33,045 5.2% 1.05 1,231,084 US$333,512 US$33,193
Europe US$225,310 US$14,001 6.2% 13.4% US$11,112 5.8% 1.12 657,437 US$342,709 US$21,296
OEM US$362,105 US$22,763 6.3% 23.5% US$16,403 4.2% 1.12 925,266 US$391,353 US$24,601
Tier one US$39,423 US$4,540 11.5% 14.3% US$5,673 4.5% 1.25 151,374 US$260,438 US$29,995
Tier two US$35,689 US$5,942 16.6% 12.0% US$6,539 8.1% 1.08 136,947 US$260,605 US$43,387
Tier three US$2,857 US$215 7.5% 6.9% US$630 0.0% 1.00 8,815 US$324,090 US$24,438
Electronics US$93,726 US$11,183 11.9% 15.5% US$8,217 6.8% 0.98 325,400 US$288,034 US$34,366
Aerostructures US$28,651 US$1,469 5.1% 7.0% US$3,436 3.5% 1.09 79,528 US$360,270 US$18,468
Propulsion US$64,995 US$7,921 12.2% 14.6% US$2,018 3.1% 1.18 161,952 US$401,324 US$48,909
Services US$54,363 US$3,450 6.3% 12.7% US$4,121 4.8% 1.09 244,227 US$222,592 $US14,127
Source: DTTL’s Global Manufacturing Industry group analysis of the 100 major global A&D companies using public company filings and press releases. See methodology section for further information and definitions of financial metric, as well as company name, reports, and dates. Note that all figures are in U.S. dollars.
Figure 30: 2012 Core A&D sector performance
Revenue (US$
million)
Operating earnings
(US$ million)
Operating margin growth
ROIC growth
FCF (US$ million)
FCM growth
BTB ratio
Number of A&D
employees
A&D revenue/ employee
(US$)
A&D operating earnings/ employee
(US$)
Global A&D sector US$681,810 US$62,950 9.2% 19.6% US$47,035 5.3% 1.09 2,033,508 US$335,288 US$30,957
U.S. US$410,582 US$44,269 10.8% 23.1% US$33,045 5.2% 1.05 1,231,084 US$333,512 US$35,960
Europe US$225,310 US$16,059 7.1% 15.0% US$11,112 5.8% 1.12 657,437 US$342,709 US$24,427
OEM US$362,105 US$27,049 7.5% 24.5% US$16,403 4.2% 1.12 925,266 US$391,353 US$29,233
Tier one US$39,423 US$4,844 12.3% 14.8% US$5,673 4.5% 1.25 151,374 US$260,438 US$31,999
Tier two US$35,689 US$6,133 17.2% 12.4% US$6,539 8.1% 1.08 136,947 US$260,605 US$44,781
Tier three US$2,857 US$220 7.7% 6.9% US$630 0.0% 1.00 8,815 US$324,090 US$24,922
Electronics US$93,726 US$11,473 12.2% 16.2% US$8,217 6.8% 0.98 325,400 US$288,034 US$35,259
Aerostructures US$28,651 US$1,291 4.5% 6.0% US$3,436 3.5% 1.09 79,528 US$360,270 US$16,232
Propulsion US$64,995 US$7,982 12.3% 14.8% US$2,018 3.1% 1.18 161,952 US$401,324 US$49,285
Services US$54,363 US$3,960 7.3% 14.0% US$4,121 4.8% 1.09 244,227 US$222,592 US$16,214
Source: DTTL’s Global Manufacturing Industry group analysis of the 100 major global A&D companies using public company filings and press releases. See methodology section for further information and definitions of financial metric, as well as company name, reports, and dates. Note that all figures are in U.S. dollars.
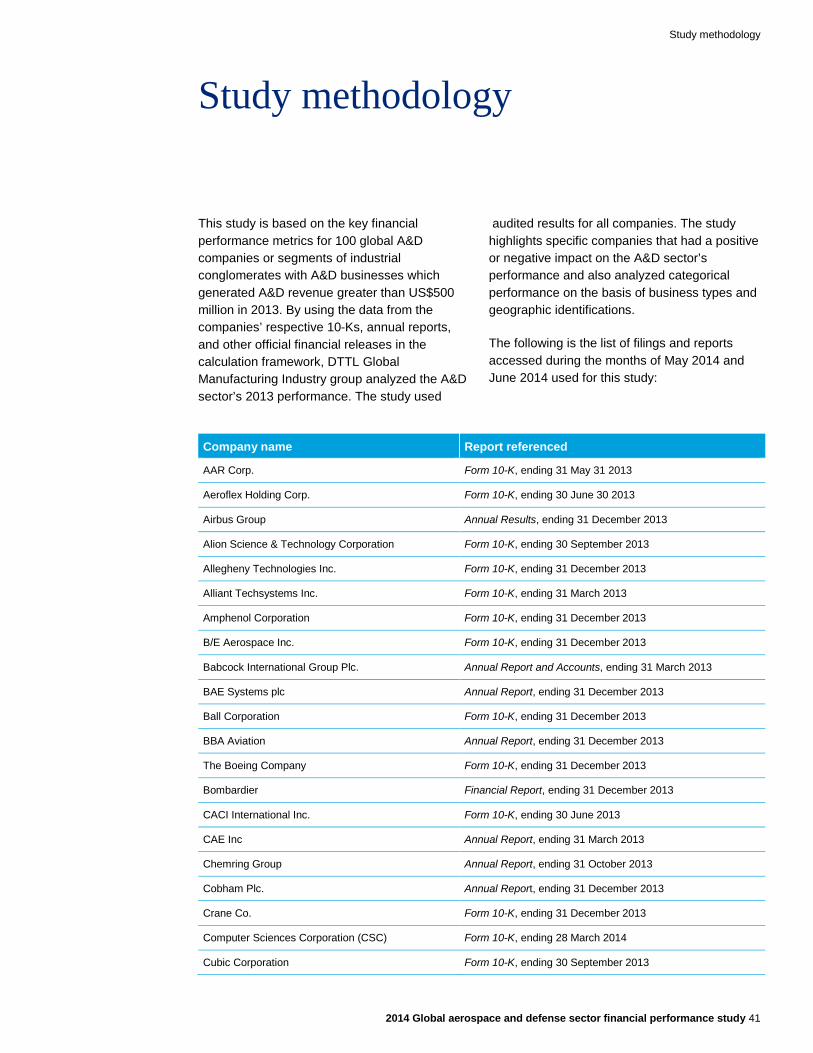
Study methodology
2014 Global aerospace and defense sector financial performance study 41
Study methodology
This study is based on the key financial performance metrics for 100 global A&D companies or segments of industrial conglomerates with A&D businesses which generated A&D revenue greater than US$500 million in 2013. By using the data from the companies’ respective 10-Ks, annual reports, and other official financial releases in the calculation framework, DTTL Global Manufacturing Industry group analyzed the A&D sector’s 2013 performance. The study used
audited results for all companies. The study highlights specific companies that had a positive or negative impact on the A&D sector’s performance and also analyzed categorical performance on the basis of business types and geographic identifications.
The following is the list of filings and reports accessed during the months of May 2014 and June 2014 used for this study:
Company name Report referenced
AAR Corp. Form 10-K, ending 31 May 31 2013
Aeroflex Holding Corp. Form 10-K, ending 30 June 30 2013
Airbus Group Annual Results, ending 31 December 2013
Alion Science & Technology Corporation Form 10-K, ending 30 September 2013
Allegheny Technologies Inc. Form 10-K, ending 31 December 2013
Alliant Techsystems Inc. Form 10-K, ending 31 March 2013
Amphenol Corporation Form 10-K, ending 31 December 2013
B/E Aerospace Inc. Form 10-K, ending 31 December 2013
Babcock International Group Plc. Annual Report and Accounts, ending 31 March 2013
BAE Systems plc Annual Report, ending 31 December 2013
Ball Corporation Form 10-K, ending 31 December 2013
BBA Aviation Annual Report, ending 31 December 2013
The Boeing Company Form 10-K, ending 31 December 2013
Bombardier Financial Report, ending 31 December 2013
CACI International Inc. Form 10-K, ending 30 June 2013
CAE Inc Annual Report, ending 31 March 2013
Chemring Group Annual Report, ending 31 October 2013
Cobham Plc. Annual Report, ending 31 December 2013
Crane Co. Form 10-K, ending 31 December 2013
Computer Sciences Corporation (CSC) Form 10-K, ending 28 March 2014
Cubic Corporation Form 10-K, ending 30 September 2013
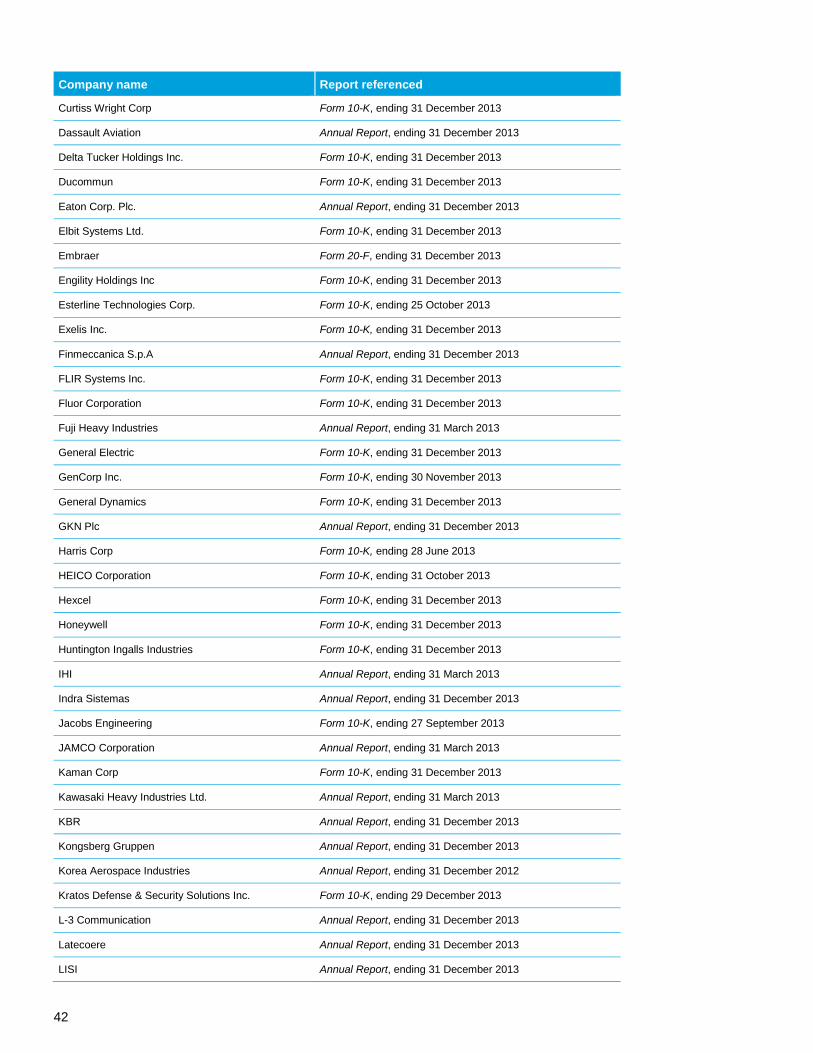
42
Company name Report referenced
Curtiss Wright Corp Form 10-K, ending 31 December 2013
Dassault Aviation Annual Report, ending 31 December 2013
Delta Tucker Holdings Inc. Form 10-K, ending 31 December 2013
Ducommun Form 10-K, ending 31 December 2013
Eaton Corp. Plc. Annual Report, ending 31 December 2013
Elbit Systems Ltd. Form 10-K, ending 31 December 2013
Embraer Form 20-F, ending 31 December 2013
Engility Holdings Inc Form 10-K, ending 31 December 2013
Esterline Technologies Corp. Form 10-K, ending 25 October 2013
Exelis Inc. Form 10-K, ending 31 December 2013
Finmeccanica S.p.A Annual Report, ending 31 December 2013
FLIR Systems Inc. Form 10-K, ending 31 December 2013
Fluor Corporation Form 10-K, ending 31 December 2013
Fuji Heavy Industries Annual Report, ending 31 March 2013
General Electric Form 10-K, ending 31 December 2013
GenCorp Inc. Form 10-K, ending 30 November 2013
General Dynamics Form 10-K, ending 31 December 2013
GKN Plc Annual Report, ending 31 December 2013
Harris Corp Form 10-K, ending 28 June 2013
HEICO Corporation Form 10-K, ending 31 October 2013
Hexcel Form 10-K, ending 31 December 2013
Honeywell Form 10-K, ending 31 December 2013
Huntington Ingalls Industries Form 10-K, ending 31 December 2013
IHI Annual Report, ending 31 March 2013
Indra Sistemas Annual Report, ending 31 December 2013
Jacobs Engineering Form 10-K, ending 27 September 2013
JAMCO Corporation Annual Report, ending 31 March 2013
Kaman Corp Form 10-K, ending 31 December 2013
Kawasaki Heavy Industries Ltd. Annual Report, ending 31 March 2013
KBR Annual Report, ending 31 December 2013
Kongsberg Gruppen Annual Report, ending 31 December 2013
Korea Aerospace Industries Annual Report, ending 31 December 2012
Kratos Defense & Security Solutions Inc. Form 10-K, ending 29 December 2013
L-3 Communication Annual Report, ending 31 December 2013
Latecoere Annual Report, ending 31 December 2013
LISI Annual Report, ending 31 December 2013
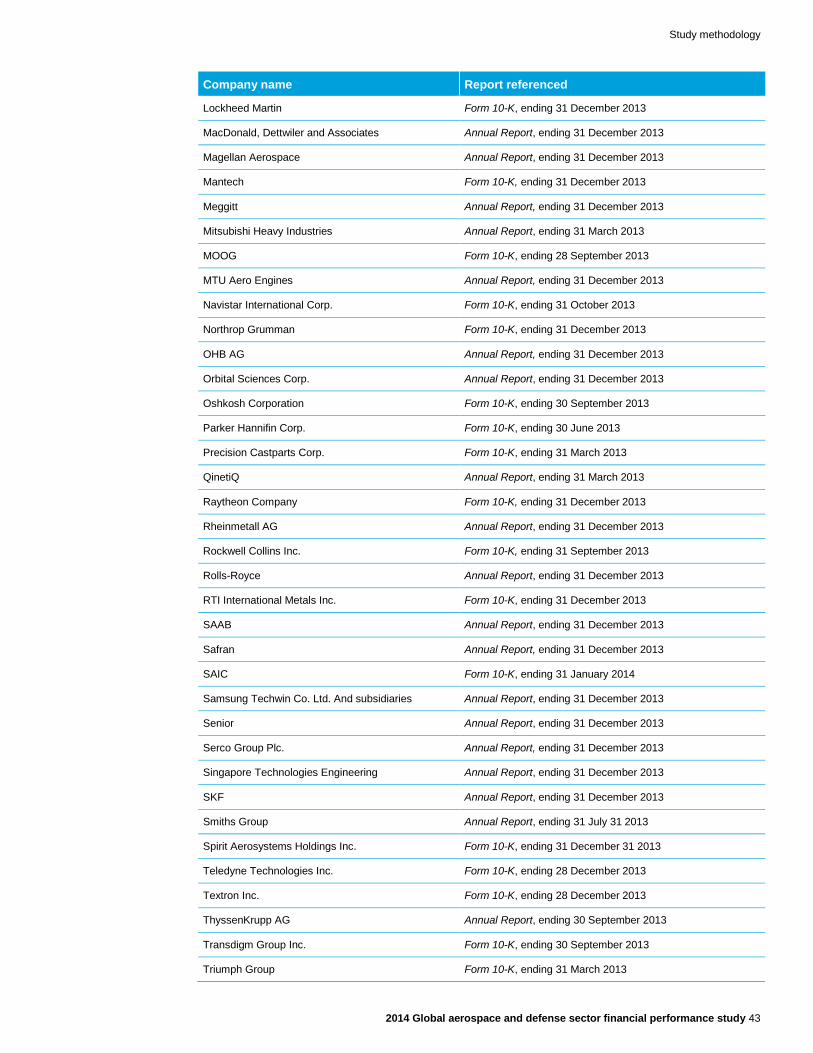
Study methodology
2014 Global aerospace and defense sector financial performance study 43
Company name Report referenced
Lockheed Martin Form 10-K, ending 31 December 2013
MacDonald, Dettwiler and Associates Annual Report, ending 31 December 2013
Magellan Aerospace Annual Report, ending 31 December 2013
Mantech Form 10-K, ending 31 December 2013
Meggitt Annual Report, ending 31 December 2013
Mitsubishi Heavy Industries Annual Report, ending 31 March 2013
MOOG Form 10-K, ending 28 September 2013
MTU Aero Engines Annual Report, ending 31 December 2013
Navistar International Corp. Form 10-K, ending 31 October 2013
Northrop Grumman Form 10-K, ending 31 December 2013
OHB AG Annual Report, ending 31 December 2013
Orbital Sciences Corp. Annual Report, ending 31 December 2013
Oshkosh Corporation Form 10-K, ending 30 September 2013
Parker Hannifin Corp. Form 10-K, ending 30 June 2013
Precision Castparts Corp. Form 10-K, ending 31 March 2013
QinetiQ Annual Report, ending 31 March 2013
Raytheon Company Form 10-K, ending 31 December 2013
Rheinmetall AG Annual Report, ending 31 December 2013
Rockwell Collins Inc. Form 10-K, ending 31 September 2013
Rolls-Royce Annual Report, ending 31 December 2013
RTI International Metals Inc. Form 10-K, ending 31 December 2013
SAAB Annual Report, ending 31 December 2013
Safran Annual Report, ending 31 December 2013
SAIC Form 10-K, ending 31 January 2014
Samsung Techwin Co. Ltd. And subsidiaries Annual Report, ending 31 December 2013
Senior Annual Report, ending 31 December 2013
Serco Group Plc. Annual Report, ending 31 December 2013
Singapore Technologies Engineering Annual Report, ending 31 December 2013
SKF Annual Report, ending 31 December 2013
Smiths Group Annual Report, ending 31 July 31 2013
Spirit Aerosystems Holdings Inc. Form 10-K, ending 31 December 31 2013
Teledyne Technologies Inc. Form 10-K, ending 28 December 2013
Textron Inc. Form 10-K, ending 28 December 2013
ThyssenKrupp AG Annual Report, ending 30 September 2013
Transdigm Group Inc. Form 10-K, ending 30 September 2013
Triumph Group Form 10-K, ending 31 March 2013
44
Company name Report referenced
Ultra Electronics Annual Report, ending 31 December 2013
United Technologies Corp. Form 10-K, ending 31 December 2013
URS Corp. Form 10-K, ending 3 January 2014
Wesco Aircraft Holdings Inc. Form 10-K, ending 30 September 2013
Woodward Inc. Form 10-K, ending 30 September 2013
Zodiac Aerospace Annual Report, ending 31 August 2013
The presentation of the companies’ 2013 financial performance data is based on the companies’ respective 2013 fiscal year (ending between 1 February 2012 and 31 January 2013), unless otherwise identified in the methodology. Similar treatment applies to the presentation of the companies’ 2012 financial performance data. The analysis included 7 companies’ 2012 data and for 1 company 2011 data, as 2013 results as their financial results were not available by the 28 May 2013 cut-off date. Prior year’s reports were used to supply 2012 and 2011 data.43
Where metrics were referenced as “reported”, the analysis included metrics using the standard methodology discussed below. Where metrics were referred to as “core”, the analysis included metrics by adjusting their “reported” values to account for A&D-specific non-recurring charges or gains as measured in the respective home currencies. In the study, “charges” is an umbrella term to reflect non-recurring program-related A&D related write-offs (such as cancellations and terminations), restructuring charges, asset impairment charges, acquisition-related expenses, loss on disposal of businesses, and litigation charges. Similarly, “gains” is an umbrella term to reflect non-recurring business disposal-related gains, pension curtailment gains, insurance settlements, etc. The treatment for calculating core performance across the affected metrics (operating earnings, operating margin, operating earnings/employee, and ROIC) is detailed below.
Certain companies were excluded from the analysis including government-controlled entities, private companies that do not release public filings, or public companies that do not report A&D segment information. Additionally,
certain companies from the previous year’s study were excluded likely due to conformance with study criteria; i.e., lower threshold of US$500 million in revenues, companies that were acquired, and companies going private.
All data in this study is presented in U.S. dollar currency. Approximately 43 percent of the 100 companies under analysis in this study are headquartered in countries other than the United States. For such companies, the study applied a dual foreign currency conversion method to calculate A&D sector aggregate figures in U.S. dollar. The study applied the appropriate fiscal year end conversion rate to a non-U.S. company’s “static” data such as backlogs. For “flow” data, such as revenue and earnings, a 365-day daily average conversion rate was applied corresponding to the company’s fiscal year. The conversion rates used for Euro/US$ include 2013 average conversion rate of 1.3280,44 2012 average conversion rate of 1.2858, 2011 average conversion rate of 1.3943, 2013 end conversion rate of 1.3766, 2012 end conversion rate of
Study methodology
2014 Global aerospace and defense sector financial performance study 45
1.3215, and 2011 end conversion rate of 1.2949.
Embraer, Elbit Systems, BBA Aviation, and Bombardier Aerospace are four non-U.S. companies that report financials in U.S. dollars. The study used the standard constant approach to eliminate the effect of significant currency fluctuations from year to year. Where the study explicitly refers to the growth rate of a non-U.S. company’s “flow” data, such as revenue, the growth rate stated is based on home currency data values, so as to assess the pure performance of the company and mitigate the impact of currency conversions.
In the commercial versus defense subsector section, the study compares and contrasts the performance of the 100 global A&D companies analyzed in the study. Revenues, operating earnings, and operating margins have been calculated for commercial and defense businesses of these companies.
Most of the companies provided their commercial versus defense revenues. However, there were only a few companies which explicitly stated commercial versus defense operating earnings; in absence of explicit detail, the study used the commercial and defense percentage of revenue as a proxy to estimate the respective operating earnings. Most companies published information around their current commercial versus defense splits.
1. A&D sector revenue:
• To calculate the A&D revenue for a company, the percentage of revenue associated with A&D activities was determined. In calculating this percentage, it was first checked to see if the company explicitly stated an A&D revenue figure. In such a case, the explicitly stated percentage was directly used. If the percentage was not explicitly stated, the company’s various business segments or end-markets were analyzed and considered only those, which were related to A&D in estimating the revenue percentage.
• Once A&D revenue percentages were assigned to the companies, they put them into two categories: those companies that
derived less than 60 percent of their respective revenue from A&D and those companies that derived equal to or greater than 60 percent of their respective revenue from A&D. If a company derived less than 60 percent of its revenue from A&D, only the revenue generated by the A&D part were included. However, if the company derived equal to or greater than 60 percent of its revenue from A&D, total revenue for the company was used.
• MOOG changed to more than 60 percent share in 2013, while Teledyne Tech changed to less than 60 percent share in this study. MOOG’s revenue increased to over 60 percent so the entire company’s revenue was used. Conversely, for Teledyne Tech, the A&D revenue was more than 60 percent in 2012; however, it fell below 60 percent in 2013. The revenue from the A&D segments for 2013 and 2012 was used to ensure a fair comparison of its performance in both of the years for both the companies.
• In determining A&D sector revenue, a calculated summation of the revenue was included of the constituent 100 companies.
2. Operating earnings/margin:
• In calculating the A&D operating earnings, a two-pronged approach was used (same as above), which states that if a company derived less than 60 percent of its revenue from A&D, the analysis factored only the operating earnings clearly associated with the A&D part. However, if the company derived equal to or more than 60 percent of its revenue from A&D, the total operating earnings for the company were used.
• In the cases of companies including Alleghany Technologies. Amphenol, CSC, Curtiss Wright, FLIR Government Systems, Indra Sistemas, Jacobs Engineering Group, KBR, Navistar, Serco Defence, SKF, ThyssenKrupp Marine Systems, and URS Federal Sector, these companies derive less than 60 percent of their respective revenues from A&D. It was not possible to clearly assign operating earnings to the A&D part. In these cases, the companies’ respective A&D operating earnings were
46
derived by multiplying the companies’ respective A&D revenue by the companies’ respective total operating earnings.
• Examined in the study were the operating earnings as stated, if reported by the company. If the operating earnings were not published by the company, they were calculated as the following: Operating earnings = Sales – Cost of goods sold – SG&A expenses – Research and development expenses – Restructuring/acquisition costs – Impairments/amortizations.
• Core operating earnings/margin for a company was calculated by adding back the company’s A&D-related charges or subtracting the non-recurring A&D-related gains in home currencies to the reported operating earnings of the company for 2013 and 2012, as applicable. In cases where the companies do not clearly assign charges/gains to their A&D businesses, estimated in the study were the company’s A&D-related charges/gains as a percentage of total company charges/gains. This could be the same as the company’s A&D revenue percentage of total revenue. This was the case for companies including Amphenol, CSC, Curtiss Wright, Eaton Aerospace, Fluor Government Group, GKN Aerospace, Indra Sistemas, LISI Aerospace, Navistar, Samsung Techwin - Engine & Turbo Machinery and Defense Machinery, Serco Defence, SKF, United Technologies Corporation, and Woodward Aerospace.
• The companies’ respective A&D operating margins were calculated by dividing their respective A&D operating earnings by their respective A&D revenues.
• Operating earnings for the A&D sector (reported and core) is a summation of operating earnings of the constituent companies.
• Operating margin for the A&D sector (reported and core) was calculated as the total sector operating earnings as a percentage of total sector revenue.
3. ROIC:
• ROIC was calculated for the entire company, as companies report it at the company level and not at the segmental level. ROIC was calculated based on component values in home currencies to eliminate the impact of currency conversion.
• The ROIC value included if it was reported by the company. Babcock International, BBA Aviation, GE Aviation, General Dynamics, GKN Aerospace, and Kawasaki Aerospace, Gas Turbine and Machinery published their ROIC values and the same were incorporated into the study. GE Aviation states that ROIC excluding GECS (General Electric Capital Services). GE’s ROIC was analyzed excluding GECS, as inclusion of GECS could have had a distorting effect on GE Aviation’s ROIC performance. GenCorp was excluded from ROIC calculations because its ROIC figure would skew the A&D sector figures. GenCorp’s total shareholders’ equity was negative in 2012 because the calculations showed the company’s ROIC as a large number.
• If the ROIC value was not published by the company, it was calculated as the following: ROIC = (Net operating earnings after tax)/(average shareholder equity + average net financial debt).
– Net operating earnings after tax (NOPAT) is calculated as: NOPAT = Net income from continuing operations + ((1– country’s prevailing tax rate)*(non-operating expenses)).
– A company’s 2013 average shareholder equity is calculated as the simple averages of its 2013 and 2012 fiscal year end shareholder equity values. A company’s 2012 average shareholder equity is calculated as the simple averages of its 2012 and 2011 fiscal year end shareholder equity values. Analogous treatment applies to the calculation of a company’s 2013 and 2012 average net financial debt values.
– Net financial debt is calculated as: Net financial debt = Short-term interest-bearing liabilities + long-term interest-
Study methodology
2014 Global aerospace and defense sector financial performance study 47
bearing liabilities – ((0.8*(cash and cash equivalents)).
– 80 percent of cash and cash equivalents is used in the calculation of net financial debt and assumed that 20 percent of a company’s cash is reserved for running the operations of the company and, thus, not available for investment, for the purposes of this study.
• In order to calculate the core ROIC for a company, certain ROIC components were adjusted depending on the nature of the one-time A&D-related charges/gains for 2013 and 2012, as applicable.
• ROIC for the A&D sector (reported and core) is a revenue, weighted average. It was calculated as the following: A&D sector ROIC = Σ (Company ROIC*Company A&D revenue)/Total A&D sector A&D revenue. ROIC stated in the study differs from ROCE (Return on capital employed).
• Some companies publish their ROCE. Despite this fact, for purposes of this study, a calculation of these companies’ ROIC was made. A company’s ROCE was not compared with its ROIC for the purposes of this study.
4. FCF/FCM:
• FCF was calculated for the entire company, as it is not practical to allocate cash flows to a company’s A&D and non-A&D segments.
• If the FCF value was published by the company, it was used directly as in the cases of Airbus Group, Babcock International, BAE Systems plc, Ball Aerospace, BBA Aviation, Bombardier Aerospace, CAE Inc., Chemring, Cobham, CSC, Embraer, Fuji Aerospace, GenCorp, General Dynamics, GKN Aerospace, Hexcel, Huntington Ingalls, IHI Aero Engine, Kaman Aerospace, Kawasaki Aerospace, Gas Turbine and Machinery, LISI Aerospace, MTU Aero Engines, Northrop Grumman, Rheinmetall Defence, Safran, Senior Plc, Serco Defence, Singapore Technologies Engineering, Smiths Detection, Teledyne Tech, ThyssenKrupp
Marine Systems, Ultra Electronics, and Woodward Aerospace.
• If the FCF value was not published by the company, it was calculated as: FCF = Operating cash flow – net capital expenditures.
– Net capital expenditures are calculated as: Net capital expenditure = purchases of PP&E – proceeds from the sale PP&E.
– A&D sector FCF was calculated as a summation of the FCFs of the constituent companies.
– FCM was calculated for the entire company, analogous to FCF. FCM for a company was calculated as: Company FCM = Company FCF/Company revenue.
– FCM for the A&D sector is a revenue-weighted average. It was calculated as: A&D sector FCM = Σ(Company FCM*Company A&D revenue)/total A&D sector revenue.
– FCF and FCM for Korea Aerospace was not included in the analysis because of data unavailability. In addition, the FCF and FCM of GE Aviation were excluded as inclusion would have had a distorting effect on the calculation of A&D sector FCF and FCM, respectively.
5. BTB ratio
• BTB ratio was taken as stated if reported by the company, such as in cases of Bombardier Aerospace, CAE Inc., Cobham, Indra Sistemas, and Kongsberg Gruppen Defence and Protech Systems.
• If the BTB ratio was not published by the company, it was calculated as BTB = 1+ ((Current fiscal year total backlog - previous fiscal year total backlog)/(current fiscal year revenue)).
• In calculating BTB ratio, a two-pronged approach was used which states that if a company derived less than 60 percent of its revenue from A&D, taking a look at the backlog and revenue of the A&D part, however, if the company derived equal to or
48
more than 60 percent of its revenue from A&D, backlog and revenue were taken for the entire company.
• There were cases in which the company derived less than 60 percent of its revenue from A&D, but calculations were based off of BTB ratio on backlog and revenue for the entire company. Such was made necessary by the lack of A&D segmental backlog information. Examples of such companies include CSC, Precision Castparts Corp., Babcock International, Honeywell Aerospace, and Kawasaki Aerospace, Gas Turbine and Machinery.
• The BTB ratio for the A&D sector is a revenue-weighted average. It was calculated as the following: A&D sector BTB = Σ (Company BTB*Company A&D revenue)/total sector A&D revenue.
• BTB ratio was calculated based on component values as reported in home currencies to eliminate the impact of currency conversion.
• BTB ratios for services firms, such as BBA Aviation and Wesco Aircraft were not included in the calculation of the A&D sector BTB ratio for lack of backlog data. The 2013 and/or 2012 BTB of certain other companies could not be calculated for lack of backlog data. Examples of such companies include GKN Aerospace, ThyssenKrupp Marine Systems, Hexcel, Fuji Aerospace, Smiths Detection, JAMCO Corporation, etc.
6. Number of A&D employees:
• The 60 percent approach was applied in assessing A&D employees of companies, such that if a company derives 60 percent or more of its total revenue from A&D, the analysis used is total number of employees. However, if the company derives less than 60 percent of its total revenue from A&D, only the employees associated specifically with the A&D business were considered of a company.
• If a company derives less than 60 percent revenue from A&D, and it explicitly states the number of employees associated with its A&D activities, the stated number was
used. Examples of such companies include Rheinmetall Defence, ThyssenKrupp Marine Systems, Serco Defence, GKN Aerospace, Kongsberg Gruppen Defence and Protech Systems, Smiths Detection, Bombardier Aerospace, etc.
• If a company derives less than 60 percent revenue from A&D, however, and it does not explicitly state the number of employees associated with its A&D business, the company’s A&D employees were examined as a percentage of total employees. This may likely be the same as the company’s A&D revenue percentage of total revenue. The approach was used for companies such as United Technologies Corporation, GE Aviation, Honeywell Aerospace, FLIR Government Systems, Kawasaki Aerospace, Gas Turbine and Machinery, URS Federal Sector, among others, as they do not explicitly state the workforce aligned to their A&D-related businesses and derive less than 60 percent of their total revenue from A&D.
• Where stated, the average employee numbers for the respective fiscal years were used. If average employee numbers were not available, employee figures were factored in as of the end of the respective fiscal years.
7. Employee productivity:
• Employee productivity was measured for individual companies and the A&D sector including A&D operating earnings per employee.
• If a company derives more than 60 percent of its revenue from A&D, the metric is calculated as the following: A&D operating earnings per employee = Company’s total operating earnings/Total number of employees. If, however, the company derives less than 60 percent from A&D, the metric is calculated as the following: A&D operating earnings per employee = Company’s A&D operating earnings/Estimated employees associated with the A&D business.
• The number of employees associated with the A&D business was used as reported by the company if so stated explicitly.
Study methodology
2014 Global aerospace and defense sector financial performance study 49
However, if the same is not explicitly stated, the number of employees associated with the A&D business is estimated as described above.
• Core A&D operating earnings per employee for a company were calculated by adding back the one-time A&D-related charges or subtracting the one-time A&D related gains to the reported operating earnings of the company, divided by the company’s number of A&D employees, for 2013 and 2012, as applicable.
• Operating earnings per employee (reported and core) for the sector are calculated as: Operating earnings per employee in the A&D sector = Total operating earnings of the sector/Total number of employees in the sector.

50
Contact
Tom Captain Global Aerospace & Defense Sector Leader Deloitte Touche Tohmatsu Limited Tel: +1 206 716 6452 Email: [email protected]
Acknowledgements
Thank you to Aijaz Shaik Hussain and Amit Dugar, from Deloitte Support Services India Private Limited, Prema Graper from Deloitte United States (Deloitte Services LP), and Jennifer McHugh from Deloitte Touche Tohmatsu Limited for their contributions.
2014 Global aerospace and defense sector financial performance study 51
References
1. The World Bank, “Developing economies need robust blueprints to sustain growth,” 14 January 2014, http://www.worldbank.org/en/news/feature/2014/01/14/developing-economies-need-robust-blueprints-to-sustain-growth.
2. Deloitte Touche Tohmatsu Limited (DTTL) Global Manufacturing Industry group analysis of the global aerospace and defense (A&D) industry, June 2014.
3. Stockholm International Peace Research Institute (SIPRI), “SIPRI Military Expenditure Database Excel File,” accessed in June 2014, http://www.sipri.org/research/armaments/milex/milex_database.
4. DTTL Global Manufacturing Industry group analysis of the global A&D industry, June 2014.
5. Airbus Group, “Airbus orders and deliveries,” accessed in January 2014, http://www.airbus.com/company/market/orders-deliveries/; The Boeing Company, “Boeing orders and deliveries,” accessed in January 2014, http://active.boeing.com/commercial/orders/index.cfm?content=timeperiodselection.cfm&pageid=m15523.
6. DTTL Global Manufacturing Industry group analysis of the global A&D industry, June 2014.
7. Ibid.
8. DTTL Global Manufacturing Industry group analysis of data from Bloomberg and Capital IQ, accessed in June 2014.
9. Ibid.
10. DTTL Global Manufacturing Industry group analysis of the global A&D industry, June 2014.
11. The World Bank, “Developing economies need robust blueprints to sustain growth,” 14 January 2014, http://www.worldbank.org/en/news/feature/2014/01/14/developing-economies-need-robust-blueprints-to-sustain-growth.
12. DTTL Global Manufacturing Industry group analysis of the global A&D industry, June 2014.
13. DTTL Global Manufacturing Industry group analysis of the global A&D industry, June 2014; Deloitte Development LLC, Global Aerospace & Defense Industry Financial Performance Study (2012), June 2013; and DTTL Global Manufacturing Industry group, 2011 Global Aerospace & Defense Industry performance wrap-up, July 2012.
14. DTTL Global Manufacturing Industry group analysis of the global A&D industry, June 2014.
15. Ibid.
16. The World Bank, “Developing economies need robust blueprints to sustain growth,” 14 January 2014, http://www.worldbank.org/en/news/feature/2014/01/14/developing-economies-need-robust-blueprints-to-sustain-growth.
17. Airbus Group, “Airbus orders and deliveries,” accessed in January 2014, http://www.airbus.com/company/market/orders-deliveries/; The Boeing Company, “Boeing orders and deliveries,” accessed in January 2014, http://active.boeing.com/commercial/orders/index.cfm?content=timeperiodselection.cfm&pageid=m15523.
18. DTTL Global Manufacturing Industry group analysis of the global A&D industry, June 2014.
19. Airbus Group, “Airbus orders and deliveries,” accessed in January 2014, http://www.airbus.com/company/market/orders-deliveries/; The Boeing Company, “Boeing orders and deliveries,” accessed in January 2014, http://active.boeing.com/commercial/orders/index.cfm?content=timeperiodselection.cfm&pageid=m15523.
20. Ibid.
21. Lockheed Martin, 2013 10-K, 14 February 2014.
22. DTTL Global Manufacturing Industry group analysis of the global A&D industry, June 2014.
23. Navistar, 2013 10-K, 20 December 2013.
24. Lockheed Martin, 2013 10-K, 14 February 2014.
25. Bloomberg.com, “United Technologies to Buy Goodrich for $16.5 Billion as Plane Orders Jump,” 22 September 2011, http://www.bloomberg.com/news/2011-09-22/united-technologies-to-buy-goodrich-for-16-5-billion-plans-to-sell-stock.html.
52
26. Allegheny Technologies, 2013 10-K, 27 February 2014.
27. Finmeccanica S.p.A, 2013 Annual Report, 20 March 2014.
28. Airbus Group, Annual result 2013, 26 February 2014 and Annual results 2012, 27 February 2013.
29. SAAB, 2013 Annual Report, 7 March 2014.
30. Ibid.
31. Mantech, 2013 10-K, 21 February 2014.
32. DTTL Global Manufacturing Industry group analysis of data from Bloomberg and STOXX, accessed in June 2014, http://www.stoxx.com/indices/index_information.html?sy.
33. Ibid.
34. DTTL Global Manufacturing Industry group analysis of the global A&D industry, June 2014.
35. DTTL Global Manufacturing Industry group analysis of data from Bloomberg and STOXX, accessed in June 2014, http://www.stoxx.com/indices/index_information.html?sy.
36. Lockheed Martin, 2013 10-K, 14 February 2014.
37. United Technologies Corporation, 2013 10-K, 6 February 2014.
38. Navistar, 2013 10-K, 20 December 2013.
39. Chemring, 2013 Annual Report, 23 January 2014.
40. Airbus Group, “Airbus orders and deliveries,” accessed in January 2014, http://www.airbus.com/company/market/orders-deliveries/; The Boeing Company, “Boeing orders and deliveries,” accessed in January 2014, http://active.boeing.com/commercial/orders/index.cfm?content=timeperiodselection.cfm&pageid=m15523.
41. The Boeing Company, Boeing Current Market Outlook, 2013 – 2032, June 2013.
42. DTTL Global Manufacturing Industry group analysis of the global A&D industry, June 2014; Deloitte Development LLC, Global Aerospace & Defense Industry Financial Performance Study (2012), June 2013; and DTTL Global Manufacturing Industry group, 2011 Global Aerospace & Defense Industry performance wrap-up, July 2011.
43. Deloitte Development LLC, Global Aerospace & Defense Industry Financial Performance Study (2012), June 2013; and DTTL Global Manufacturing Industry group, 2011 Global Aerospace & Defense Industry performance wrap-up, July 2011.
44. OANDA, “Currency,” accessed in June 2014, http://www.oanda.com/currency/historical-rates/.
About Deloitte Deloitte refers to one or more of Deloitte Touche Tohmatsu Limited, a UK private company limited by guarantee (“DTTL”), its network of member firms, and their related entities. DTTL and each of its member firms are legally separate and independent entities. DTTL (also referred to as “Deloitte Global”) does not provide services to clients. Please see www.deloitte.com/about for a more detailed description of DTTL and its member firms. Deloitte provides audit, tax, consulting, and financial advisory services to public and private clients spanning multiple industries. With a globally connected network of member firms in more than 150 countries and territories, Deloitte brings world-class capabilities and high-quality service to clients, delivering the insights they need to address their most complex business challenges. Deloitte’s more than 200,000 professionals are committed to becoming the standard of excellence.
DTTL Global Manufacturing Industry group The DTTL Global Manufacturing Industry group is comprised of around 2,000 member firm partners and over 13,000 industry professionals in over 45 countries. The group’s deep industry knowledge, service line experience, and thought leadership allows them to solve complex business issues with member firm clients in every corner of the globe. Deloitte member firms attract, develop, and retain the very best professionals and instill a set of shared values centered on integrity, value to clients, and commitment to each other and strength from diversity. Deloitte member firms provide professional services to 78 percent of the manufacturing industry companies on the Fortune Global 500®. For more information about the Global Manufacturing Industry group, please visit www.deloitte.com/manufacturing.
Disclaimer This communication contains general information only, and none of Deloitte Touche Tohmatsu Limited, its member firms, or their related entities (collectively, the “Deloitte Network”) is, by means of this communication, rendering professional advice or services. No entity in the Deloitte network shall be responsible for any loss whatsoever sustained by any person who relies on this communication.
© 2014. For more information, contact Deloitte Touche Tohmatsu Limited.