wp3 – n – - dvb-t2 network planning
TRANSCRIPT

B21C – CELTIC project CP4-004
WP3 – Network & Channels
Deliverable D11-3
©B21C Project WP3 - Deliverable XX Page : 1 (36)
WP3 – NETWORK & CHANNELS –
DELIVERABLE D11-PART 3 -
DVB-T2 NETWORK PLANNING

B21C – CELTIC project CP4-004
WP3 – Network & Channels
Deliverable D11-3
©B21C Project WP3 – Deliverable D11-3 Page : 2 (36)
Participants in project B21C are:
• Åbo Akademi University (ABO) - Finland • Agilent - Belgium • Alcatel-Lucent - France • BBC - UK • DiBcom- France • Digita OY - Finland • Elektrobit Corporation – Finland • Ecole Nationale Supérieure des Télécommunications (ENST) - France • Fraunhofer Gesellschaft zur Förderung der angewandten Forschung e.V. (FhG) – Germany • France Telecom R&D – France • Hispasat - Spain • Institut d’Electronique et de télécommunications de Rennes (IETR) - France • Mier Comunicaciones S.A. • Nokia Corporation - Finland • NXP Semiconductors -france • Radio Televisione Italiana (RAI) - Italy • Retevisión (Abertis Telecom group) - Spain • Rohde & Schwarz - Germany • Robotiker - Spain • SIDSA – Spain • Sony – UK • Space Hellas - Greece • Tampere University of Technology (TUT) • TeamCast - France • Télédiffusion de France (TDF) - France • Telefonica – Spain • Spectracom (formerly Temex Sync) – France • Technical University Braunschweig, Institut für Nachrichtentechnik - Germany • Teracom – Sweden • Thomson Grass Valley (formerly Thales Broadcast & Multimedia) - France • Turku University of Applied Science (TUAS) – Finland • Universitat ramon Lull – Spain • University of Bologna – Italy • University of Surrey – UK • University of Turku - Finland
B21C – Broadcast for the 21st Century - Project coordinator: Gérard Faria TeamCast
CELTIC published project result
© 2007 CELTIC participants in project B21C
Disclaimer
This document contains material, which is copyright of certain CELTIC PARTICIPANTS and may not be reproduced or copied without permission. The information contained in this document is the proprietary confidential information of certain CELTIC PARTICIPANTS and may not be disclosed except in accordance with the regulations agreed in the Project Consortium Agreement (PCA). The commercial use of any information in this document may require a licence from the proprietor of that information. Neither the PARTICIPANTS nor the CELTIC Initiative warrant that the information

B21C – CELTIC project CP4-004
WP3 – Network & Channels
Deliverable D11-3
©B21C Project WP3 – Deliverable D11-3 Page : 3 (36)
contained in this document is capable of use, or that use of the information is free from risk, and accept no liability for loss or damage suffered by any person using the information.

B21C – CELTIC project CP4-004
WP3 – Network & Channels
Deliverable D11-3
©B21C Project WP3 – Deliverable D11-3 Page : 4 (36)
EEXXEECCUUTTIIVVEE SSUUMMMMAARRYY
DVB-T2 is a new standard for digital terrestrial television broadcasting, offering significant benefits compared to DVB-T and new possibilities for network planning. It includes many new techniques not previously used in the DVB standards.
The main reason to use DVB-T2 instead of DVB-T is the considerably increased transmitting capacity. Also it makes possible to build very large single frequency (SFN) networks because of much longer guard intervals (GI) then in DVB-T. By using MISO and TFS options it is possible to increase the coverage areas in certain types of networks.
DVB-T2 is compared to DVB-T especially in the network planning point of view. The possibilities for very large SFN networks are explained. The MISO Alamouti scheme makes it possible to extend the coverage area in portable and mobile single frequency network (SFN). With time frequency slicing (TFS) the capacity can be increased using statistical multiplexing and coverage area can be increased by transmitting each service on several frequencies.
MISO Alamouti planning exercises made by NXP and TUAS are presented. In these exercises the SFN-network of four existing transmitter was used. MISO Alamouti coverage is compared to normal SFN-coverage and the increase of coverage is more than 25 % in portable and mobile networks.
Large area SFN planning studies was made in Digita. The influence of SFN self-interference is presented and coverage predictions were made on VHF-band for whole Finland with different guard interval values. The conclusion is that very large, even country wide SFN networks are possible on DVB-T2 16K and 32K modes and long guard intervals. Large SFN areas make it possible to improve spectrum efficiency and increase the number of networks (services).
Teracom has made a lot of outdoor and indoor field strength measurements on different frequencies. The summary of the studies is in this document, detailed information is available in separate annex.
DVB-T2 lab- and field tests were performed on Helsinki 26.-30.10.2009. The field measurement will be compared with simulated results.
B21C – CELTIC project CP4-004
WP3 – Network & Channels
Deliverable D11-3
©B21C Project WP3 – Deliverable D11-3 Page : 5 (36)
LLIISSTT OOFF AAUUTTHHOORRSS // DDOOCCUUMMEENNTT HHIISSTTOORRYY
Version Date Author(s) Comment
v1 11.11.2009 Esko Huuhka (Digita Editor
v1 11.11.2009 Pierre-Jean Bouvet (NXP) B21c – 20612V0
v1 11.11.2009 Jörg Robert (TU-BS) B21c – 20612V0
v1 13.11.2009 Erik Stare (Teracom)
v1 13.11.2009 Staffan Bergsmark (Teracom) B21C – D11 Part3_TFS_annex.zip

B21C – CELTIC project CP4-004
WP3 – Network & Channels
Deliverable D11-3
©B21C Project WP3 – Deliverable D11-3 Page : 6 (36)
TTAABBLLEE OOFF CCOONNTTEENNTT
1 Introduction .................................................................... 7
2 DVB-T2 compared to DVB-T ............................................ 8
2.1 Modes/Capacity ............................................................................. 8
2.2 Single Frequency Networks (SFN) ............................................... 10
2.3 Multiple Input, Single Output (MISO) ......................................... 11
2.4 Time Frequency Slicing (TFS) ...................................................... 11
3 Link Budget ................................................................... 13
4 DVB-T2 Network Planning Studies ............................... 15
4.1 MISO Alamouti Planning Exercises .............................................. 15
4.2 SFN/MFN Planning Exercises ...................................................... 25
5 Summary of TFS Studies ............................................... 33
6 DVB-T2 Field Tests ........................................................ 35
6.1 Field Test Measurements ............................................................. 35
Bibliography .............................................................................. 36

B21C – CELTIC project CP4-004
WP3 – Network & Channels
Deliverable D11-3
©B21C Project WP3 – Deliverable D11-3 Page : 7 (36)
11 IINNTTRROODDUUCCTTIIOONN DVB-T2 is a new standard for digital terrestrial television broadcasting, offering significant benefits compared to DVB-T and new possibilities for network planning. It includes many new techniques not previously used in the DVB standards.
The focus of this document is to compare DVB-T2 to DVB-T in the network planning point of view. There are several options in DVB-T2 which require different network planning tools than DVB-T. In section 2. these differences are explained. The link budget which is needed to define the required field strength value for network planning is shown in section 3. Examples of MISO and large area SFN network planning exercises are shown in section 4. Field strength measurements and analyses which show the possible advantages of TFS are explained in section 5.
DVB-T2 test transmissions were done at the end of October 2009 in Helsinki. The results and some comparisons between measured aand simulated values will be added to section 6.

B21C – CELTIC project CP4-004
WP3 – Network & Channels
Deliverable D11-3
©B21C Project WP3 – Deliverable D11-3 Page : 8 (36)
22 DDVVBB--TT22 CCOOMMPPAARREEDD TTOO DDVVBB--TT DVB-T2 is a standard for digital terrestrial television broadcasting, offering significant benefits compared to DVB-T.
DVB-T2 includes many new techniques not previously used in the DVB standards.
DVB-T2 standard allows a large number of options and combinations. Flexibility has been deliberately retained in standard to allow optimisation as more experience and expertise is gained. However, the implementations are expected to use a small subset of the possible combinations.
The main reason to use DVB-T2 instead of DVB-T is the considerably increased transmitting capacity. Also it makes possible to build very large single frequency (SFN) networks because of much longer guard intervals (GI) then in DVB-T. Table 1 shows possible capacity increase of DVB-T2 [1].
DVB-T mode T2Modulation 64-QAM 256-QAM FFT size 8K 32K Guard Interval ¼ 1/16 FEC 2/3CC + RS 3/5LDPC + BCH Scattered Pilots 8.3% 4.2% Continual Pilots 2.0% 0.39% L1 overhead 1.0% 0.65% Carrier mode Standard Extended Capacity 19.9 Mbit/s 33.2 Mbit/s
Table 1. DVB-T2 capacity increase of 67 %
22..11 MMOODDEESS//CCAAPPAACCIITTYY DVB-T2 normal mode occupies the same RF-spectrum than DVB-T. The bit rate can be increased about 2.5 % by using extended mode, which still is in accordance with the required spectrum mask on 8 MHz UHF TV-channel. Figure 1 show the spectrums of normal and extended modes [1].
Figure 1, DVB-T2 8 MHz normal and extended mode

B21C – CELTIC project CP4-004
WP3 – Network & Channels
Deliverable D11-3
©B21C Project WP3 – Deliverable D11-3 Page : 9 (36)
Tables 2 and 3 show the bitrates for DVB-T and DVB T2.
Net bit rate (Mbit/s)
System
variant
Modulation Code R D/TU =1/4
D/TU =1/8
D/TU =1/16
D/TU =1/32
A1 QPSK 1/2 4.98 5.53 5.85 6.03
A2 QPSK 2/3 6.64 7.37 7.81 8.04
A3 QPSK 3/4 7.46 8.29 8.78 9.05
A5 QPSK 5/6 8.29 9.22 9.76 10.05
A7 QPSK 7/8 8.71 9.68 10.25 10.56
B1 16-QAM
(M1 **)
1/2 9.95 11.06 11.71 12.06
B2 16-QAM 2/3 13.27 14.75 15.61 16.09
B3 16-QAM 3/4 14.93 16.59 17.56 18.10
B5 16-QAM 5/6 16.59 18.43 19.52 20.11
B7 16-QAM 7/8 17.42 19.35 20.49 21.11
C1 64-QAM
(M2 **)
1/2 14.93 16.59 17.56 18.10
C2 64-QAM
(M3 **)
2/3 19.91 22.12 23.42 24.13
C3 64-QAM 3/4 22.39 24.88 26.35 27.14
C5 64-QAM 5/6 24.88 27.65 29.27 30.16
C7 64-QAM 7/8 26.13 29.03 30.74 31.67
(**) System modes adopted by ITU-R as representative for protection ratio assessments
Table 2. DVB-T bitrates, 8 MHz

B21C – CELTIC project CP4-004
WP3 – Network & Channels
Deliverable D11-3
©B21C Project WP3 – Deliverable D11-3 Page : 10 (36)
Modulation Code rate
Absolute maximum bit-rate Recommended configuration
Bitrate Mbit/s
Frame length LF
FEC blocks per
frame Bitrate Mbit/s
Frame length LF
FEC blocks per
frame
QPSK
1/2 7.49255
62 52
7.4442731
60 50
3/5 9.003747 8.9457325
2/3 10.01867 9.9541201
3/4 11.27054 11.197922
4/5 12.02614 11.948651
5/6 12.53733 12.456553
16-QAM
1/2 15.03743
60 101
15.037432
60 101
3/5 18.07038 18.07038
2/3 20.10732 20.107323
3/4 22.6198 22.619802
4/5 24.13628 24.136276
5/6 25.16224 25.162236
64-QAM
1/2 22.51994
46 116
22.481705
60 151
3/5 27.06206 27.016112
2/3 30.11257 30.061443
3/4 33.87524 33.817724
4/5 36.1463 36.084927
5/6 37.68277 37.618789
256-QAM
1/2 30.08728
68 229
30.074863
60 202
3/5 36.15568 36.140759
2/3 40.23124 40.214645
3/4 45.25828 45.239604
4/5 48.29248 48.272552
5/6 50.34524 50.324472
Table 3. DVB-T2 bitrates, 8 MHz extended mode and the shortest GI
22..22 SSIINNGGLLEE FFRREEQQUUEENNCCYY NNEETTWWOORRKKSS ((SSFFNN)) DVB-T already made it possible to build SFN networks. The longest GI was however only 224 µs and that limited the size of the SFN network. In DVB-T2 16 and 32K modes it is possible to have much longer GI’s (see table 3) which makes it possible to build very large SFN networks. In section 5.2 some examples are shown.
Guard-interval fraction FFT size 1/128 1/32 1/16 19/256 1/8 19/128 1/4
32K 28 112 224 266 448 532 N/A 16K 14 56 112 133 224 266 448 8K 7 28 56 66.5 112 133 224 4K N/A 14 28 N/A 56 N/A 112 2K N/A 7 14 N/A 28 N/A 56 1K N/A N/A 7 N/A 14 N/A 28
Table 3. DVB-T2 Guard Intervals (µs), 8 MHz channel

B21C – CELTIC project CP4-004
WP3 – Network & Channels
Deliverable D11-3
©B21C Project WP3 – Deliverable D11-3 Page : 11 (36)
22..33 MMUULLTTIIPPLLEE IINNPPUUTT,, SSIINNGGLLEE OOUUTTPPUUTT ((MMIISSOO)) DVB-T2 supports Single-Frequency Networks (SFNs), but the presence of similar-strength signals from two transmitters in a network may cause a significant loss of margin because the resulting channel can have deep "notches". This may happen in portable reception, in fixed reception the receiving antenna is pointed towards the strongest station and the other signals are normally much weaker.
DVB-T2 incorporates the option of using the Alamouti technique with a pair of transmitters (Figure 2). Alamouti is an example of a Multiple Input, Single Output (MISO) system, in which every constellation point is transmitted by each transmitter, but the second transmitter (Tx2 in the figure) transmits a slightly modified version of each pair of constellations, and in the reverse order in frequency. The technique gives performance equivalent to diversity reception in the sense that the operations performed by the receiver result in an optimum combination of the two signals; the resulting signal-to-noise ratio is as though the powers of the two signals had combined in the air. The extra complexity required in the receiver includes a few extra multipliers for the Alamouti processing, and also some parts of the channel estimation need to be duplicated. There is a significant overhead increase in the sense that the density of scattered pilots needs to be doubled for a given Guard Interval fraction.
RX TX1
TX2
So, S1 -S1* S0
*h1 h2
Figure 2: MISO scheme
22..44 TTIIMMEE FFRREEQQUUEENNCCYY SSLLIICCIINNGG ((TTFFSS)) DVB DVB-T2 introduces an optional time-frequency slicing (TFS) transmission scheme to increase the flexibility of service multiplexing. Utilizing statistical multiplexing (StatMux) in conjunction with TFS is expected to provide a high performance for the broadcast system in terms of resource utilization and quality of service.
In the TFS transmission scheme, the service data is transmitted as time-frequency slices, that is, time-slice frames that are transmitted by parallel radio channels. The time slices have durations of about a few hundred milliseconds (typically 180 milliseconds) and a number of maximum 6 RF channels can be used for transmission of time-sliced data. There is a time shift between the services in different RF channels to enable frequency hopping at the receiver. At the beginning of each frame, two synchronizing symbols are inserted (shown as P1 and P2 in the figure). The synchronization symbols allow a receiver to rapidly detect the presence of DVB-T2 signal, as well as to synchronize to the frame. Data related to a number of different services can be statistically multiplexed over the two dimensions of time and frequency. Performance of StatMux in DVB-T2 depends on the bandwidth of the coherent transmission channel, the number of multiplexed services, and the statistical properties of service traffics. A set of comprehensive simulations were performed to evaluate the performance of StatMux of HDV services over DVB-T2.

B21C – CELTIC project CP4-004
WP3 – Network & Channels
Deliverable D11-3
©B21C Project WP3 – Deliverable D11-3 Page : 12 (36)
Figure 4: Example of a TFS frame for 4 RF channels and 15 services

B21C – CELTIC project CP4-004
WP3 – Network & Channels
Deliverable D11-3
©B21C Project WP3 – Deliverable D11-3 Page : 13 (36)
33 LLIINNKK BBUUDDGGEETT The link budget is required for planning to specify the minimum field strength required in the reception point and the minimum median equivalent field strength to be used in planning.
The minimum field strength and minimum median equivalent field strength values calculated using the following equations:
Pn = F + 10 log (k T0 B)
Ps min = C/N + Pn
Aa = G + 10 log (1.64λ2/4 π)
φmin = Ps min – Aa + Lf
Emin = φmin + 120 + 10 log (120 π)
= φmin + 145.8
Emed = Emin + Pmmn + Cl for roof top level fixed reception
Emed = Emin + Pmmn + Cl for portable outdoor and mobile reception
Emed = Emin + Pmmn + Cl + Lb for portable indoor and mobile hand-held reception
Cl = µ ⋅ σt
σt = 22mb σ+σ
where:
Pn : receiver noise input power (dBW)
F : receiver noise figure (dB)
k : Boltzmann’s constant (k = 1.38 × 10⁻²³ (J/K))
T0 : absolute temperature (T0 = 290 (K))
B : receiver noise bandwidth (B = 7.61 × 10⁶ (Hz))
Ps min : minimum receiver input power (dBW)
C/N : RF S/N at the receiver input required by the system (dB)
Aa : effective antenna aperture (dBm2)
G : antenna gain related to half dipole (dBd)
λ : wavelength of the signal (m)
φmin : minimum pfd at receiving place (dB(W/m2))
Lf : feeder loss (dB)
Emin : equivalent minimum field strength at receiving place (dB(µV/m))
Emed : minimum median equivalent field strength, planning value (dB(µV/m))

B21C – CELTIC project CP4-004
WP3 – Network & Channels
Deliverable D11-3
©B21C Project WP3 – Deliverable D11-3 Page : 14 (36)
Pmmn : allowance for man-made noise (dB)
Lb : building or vehicle entry loss (dB)
Cl : location correction factor (dB)
σt : Total standard deviation (dB)
σm : standard deviation macro-scale (dB)
σb : standard deviation building entry loss (dB)
µ : distribution factor being 0.52 for 70%, 1.28 for 90%, 1.64 for 95% and 2.33 for 99%.
In practice it is useful to make an excel table to use the above formulas (Table 1.). Note that the minimum median equivalent field strength for planning is given at the height of 1.5 meters from the ground level, the height loss calculation is included in the prediction method.
DVB-T2 Fixed reception Link budget (Ricean channel), 256QAM
Appr. Unit Mode Code Rate CR 1/2 3/5 2/3 3/4 4/5 Channel Ch 8 8 8 8 8 Frequency Fr MHz 199 199 199 199 199
Noise floor Pn dBm -106 -106 -106 -106 -106 Rx Noise Figure F dBm 7 7 7 7 7 C/N C/N dBm 14 17 19 21 22 Min Rx input power Ps min dBm -85 -82 -80 -78 -77 Rx antenna gain G dBd 9 9 9 9 9 Antenna aperture Aa dBm2 4 4 4 4 4
Manmade Noise Pmmn dB 5 5 5 5 5 Minimum Field Strength Emin dBµV/m 32 35 37 39 40 Location variation Cl dB 9 9 9 9 9 Building loss Lb dB 0 0 0 0 0 Emin in planning Emed dBµV/m 41 44 46 48 49
Table 4, Example of DVB-T2 Link Budget
The location correction value is historically based on standard deviation of 5.5 dB. It is probably the combination of field strength location variation and prediction error.

B21C – CELTIC project CP4-004
WP3 – Network & Channels
Deliverable D11-3
©B21C Project WP3 – Deliverable D11-3 Page : 15 (36)
44 DDVVBB--TT22 NNEETTWWOORRKK PPLLAANNNNIINNGG SSTTUUDDIIEESS MISO and large area SFN planning exercises were done in B21C project.
44..11 MMIISSOO AALLAAMMOOUUTTII PPLLAANNNNIINNGG EEXXEERRCCIISSEESS
No figures were available for the application of Alamouti if more than two transmitters are used. Also no figures were available or in terms of coverage increase with Alamouti scheme. Therefore coverage predictions have been made in NXP and TUBS [2].
Distributed Alamouti (different Alamouti codes on the different transmitters within an SFN) allows for application of diversity transmission without an upgrade of the existing aerials.
Gain of Alamouti largely depends on the difference in the reception level between the two possible Alamouti codes. Large gain, if the two sequences are received with low difference, no gain, if the difference in the reception level is high, e.g. reception of a single transmitter only.
Tx1
Tx2
Figure 5, MISO transmitting scheme
The parameters of the existing Hanover/Braunschweig SFN have been used for the predictions. Network is initially planned for portable reception.
Current DVB-T network parameters are:
• 8K FFT; 16QAM; Coderate 2/3; Guard Interval ¼ • 4 transmitters mounted on top of tall buildings • Transmitter power from 5-20kW EIRP for each channel
The landscape is mainly flat in the northern part of the network, but gets hilly in the southern part.
The coverage predictions are based on the BMCO figures [3]. Alamouti gain is added onto the link budget. Loss due to higher pilot density is included in the coverage predictions (0.8dB)
Figure x shows the network used in the coverage predictions.

B21C – CELTIC project CP4-004
WP3 – Network & Channels
Deliverable D11-3
©B21C Project WP3 – Deliverable D11-3 Page : 16 (36)
Figure 6, Network used in MISO coverage predictions
Three prediction scenarios were used in exercises:
• Distributed Alamouti mobile car reception o Example for mobile in-car reception
• Distributed Alamouti light indoor o Example for indoor portable reception o Antenna placed near the window
• Distributed Alamouti deep indoor o Example for indoor portable reception o Antenna placed on top of TV set o Employed simulation tool takes structure of the landscape into account o Built up areas, fields, woods, hills, …
Simulations were based on cell size of 50x50m.
Gain due to Alamouti largely depends on the difference between the reception levels of the two Alamouti codes. Therefore the prediction was made to estimate the difference (K-factor) between the received signals. In estimation of Alamouti gain the following simulated values were used.
Simulation results Double Ricean channel
B21C – CELTIC project CP4-004
WP3 – Network & Channels
Deliverable D11-3
©B21C Project WP3 – Deliverable D11-3 Page : 17 (36)
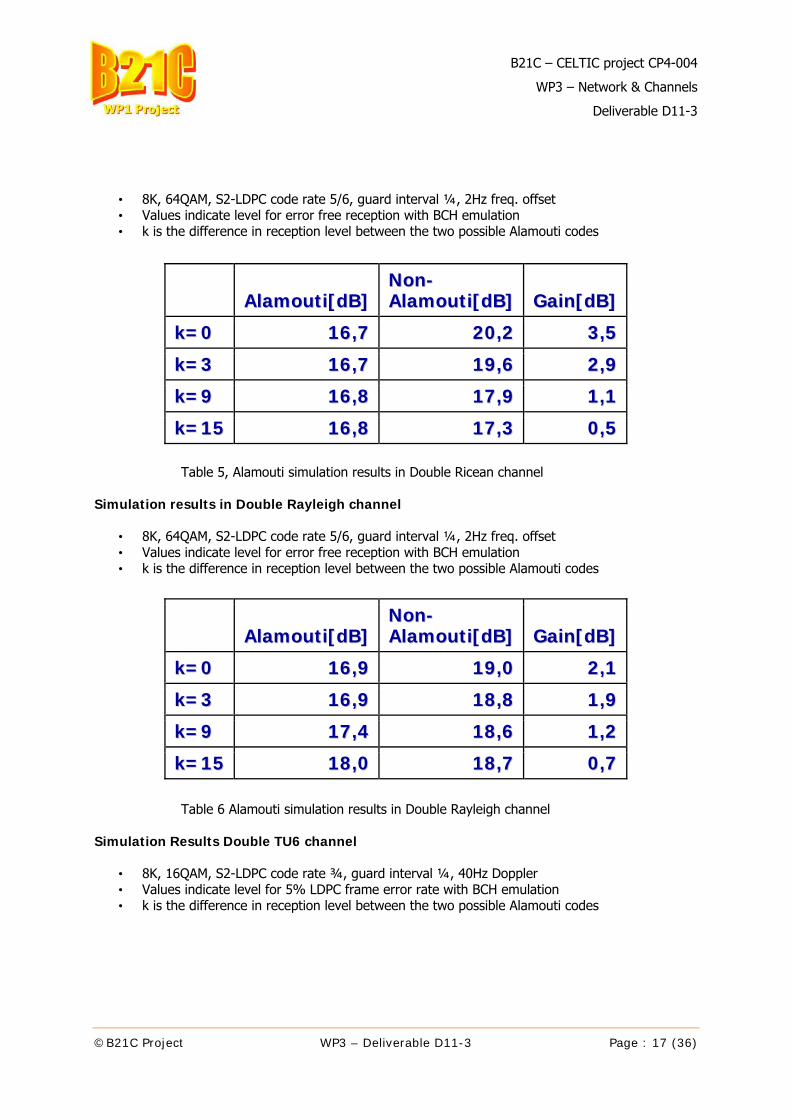
• 8K, 64QAM, S2-LDPC code rate 5/6, guard interval ¼, 2Hz freq. offset • Values indicate level for error free reception with BCH emulation • k is the difference in reception level between the two possible Alamouti codes
Table 5, Alamouti simulation results in Double Ricean channel Simulation results in Double Rayleigh channel
• 8K, 64QAM, S2-LDPC code rate 5/6, guard interval ¼, 2Hz freq. offset • Values indicate level for error free reception with BCH emulation • k is the difference in reception level between the two possible Alamouti codes
Table 6 Alamouti simulation results in Double Rayleigh channel Simulation Results Double TU6 channel
• 8K, 16QAM, S2-LDPC code rate ¾, guard interval ¼, 40Hz Doppler • Values indicate level for 5% LDPC frame error rate with BCH emulation • k is the difference in reception level between the two possible Alamouti codes
AAllaammoouuttii[[ddBB]]NNoonn--AAllaammoouuttii[[ddBB]] GGaaiinn[[ddBB]]
kk==00 1166,,77 2200,,22 33,,55 kk==33 1166,,77 1199,,66 22,,99 kk==99 1166,,88 1177,,99 11,,11 kk==1155 1166,,88 1177,,33 00,,55
AAllaammoouuttii[[ddBB]]NNoonn--AAllaammoouuttii[[ddBB]] GGaaiinn[[ddBB]]
kk==00 1166,,99 1199,,00 22,,11 kk==33 1166,,99 1188,,88 11,,99 kk==99 1177,,44 1188,,66 11,,22 kk==1155 1188,,00 1188,,77 00,,77

B21C – CELTIC project CP4-004
WP3 – Network & Channels
Deliverable D11-3
©B21C Project WP3 – Deliverable D11-3 Page : 18 (36)
Table 7, Alamouti Simulation Results in Double TU6 channel Reception level difference prediction
Figure 7, Reception level difference in dB
The prediction shows that that there are big reception difference (>15dB) between the two Alamouti codes only close the transmitters. Large regions have big Alamouti gain because of low difference between the two codes. Gain due to Alamouti is reached especially in the regions where it is required (distant to the transmitter). Mobile reception
AAllaammoouuttii[[ddBB]]
NNoonn--AAllaammoouuttii[[ddBB]] GGaaiinn[[ddBB]]
kk==00 1155,,11 2200,,11 55,,00 kk==33 1155,,44 1199,,77 44,,33 kk==99 1166,,55 1199,,55 33,,00 kk==1155 1177,,55 1188,,77 11,,22

B21C – CELTIC project CP4-004
WP3 – Network & Channels
Deliverable D11-3
©B21C Project WP3 – Deliverable D11-3 Page : 19 (36)
Coverage prediction scenario:
• Reception antenna placed on top of car • Parameters: 8K, 16QAM, LDPC-coderate ¾, Double TU-6 with 40Hz Doppler • Alamouti gain depends on difference in reception level between the two sequences • Link Budget calculation:
BMCO Reception Class C o Mobile roof-top o 1.5m above ground
• Max. 130km/h
Figure 8, Signal levels in dBm
B21C – CELTIC project CP4-004
WP3 – Network & Channels
Deliverable D11-3
©B21C Project WP3 – Deliverable D11-3 Page : 20 (36)
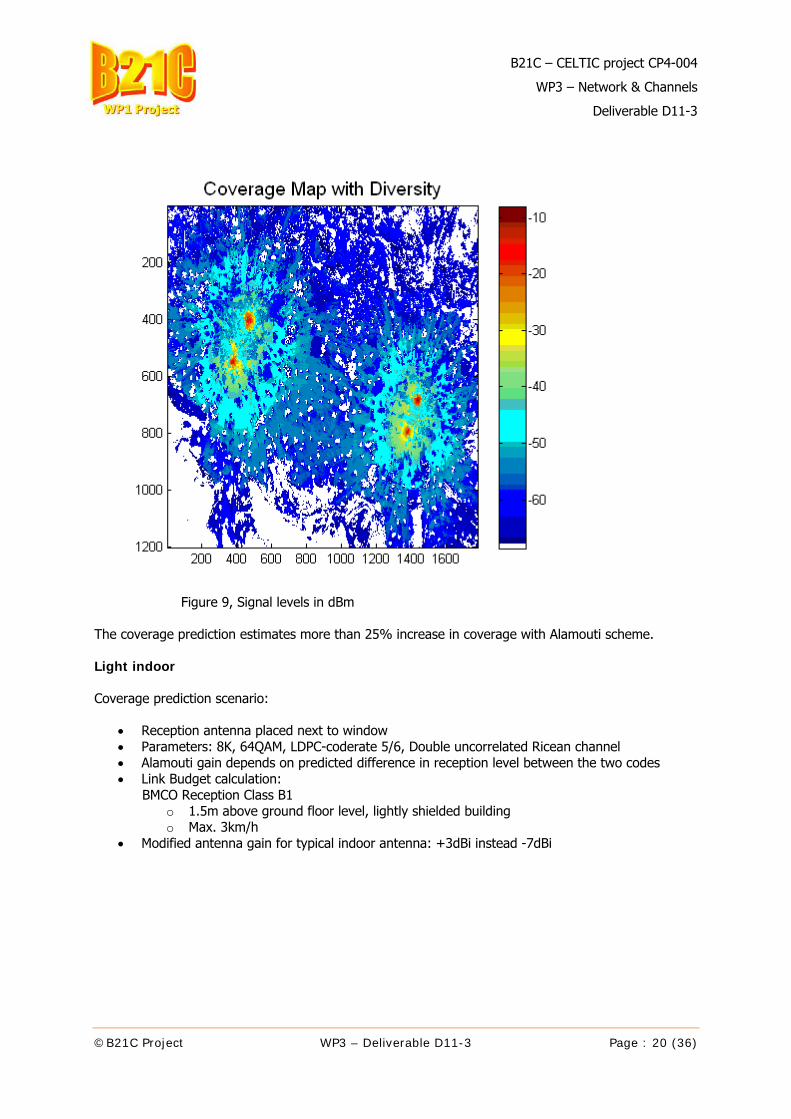
Figure 9, Signal levels in dBm
The coverage prediction estimates more than 25% increase in coverage with Alamouti scheme. Light indoor Coverage prediction scenario:
• Reception antenna placed next to window • Parameters: 8K, 64QAM, LDPC-coderate 5/6, Double uncorrelated Ricean channel • Alamouti gain depends on predicted difference in reception level between the two codes • Link Budget calculation:
BMCO Reception Class B1 o 1.5m above ground floor level, lightly shielded building o Max. 3km/h
• Modified antenna gain for typical indoor antenna: +3dBi instead -7dBi

B21C – CELTIC project CP4-004
WP3 – Network & Channels
Deliverable D11-3
©B21C Project WP3 – Deliverable D11-3 Page : 21 (36)
Figure 10, Signal levels in dBm

B21C – CELTIC project CP4-004
WP3 – Network & Channels
Deliverable D11-3
©B21C Project WP3 – Deliverable D11-3 Page : 22 (36)
Figure 11, Signal levels in dBm
The coverage prediction estimates more than 28% increase in coverage with Alamouti scheme.
Deep indoor Coverage prediction scenario:
• Reception antenna placed on top of TV set • Parameters: 8K, 64QAM, LDPC-coderate 5/6, Double uncorrelated Rayleigh channel • Alamouti gain depends on predicted difference in reception level between the two codes • Link Budget calculation:
BMCO Reception Class B2 o 1.5m above ground floor level, highly shielded building o Max. 3km/h
• Modified antenna gain for typical indoor antenna placed on top of TV set: +3dBi instead -7dBi

B21C – CELTIC project CP4-004
WP3 – Network & Channels
Deliverable D11-3
©B21C Project WP3 – Deliverable D11-3 Page : 23 (36)
Figure 12, Signal levels in dBm

B21C – CELTIC project CP4-004
WP3 – Network & Channels
Deliverable D11-3
©B21C Project WP3 – Deliverable D11-3 Page : 24 (36)
Figure 13, Signal levels in dBm
The coverage prediction estimates more than 24% increase in coverage with Alamouti scheme. Conclusions The coverage prediction study came to following conclusions: o The difference in the reception level between the two Alamouti codes is interestingly low in large
regions of the network
o No Alamouti gain is obtained in the areas close to the transmitters, where it is not required
o The Alamouti gain is especially obtained in the interesting regions, i.e. in the areas distant to the transmitters
o The Alamouti scheme also works with more than two transmitters
o The coverage area is increased significantly
o The higher robustness compensates the effects of the higher pilot density

B21C – CELTIC project CP4-004
WP3 – Network & Channels
Deliverable D11-3
©B21C Project WP3 – Deliverable D11-3 Page : 25 (36)
44..22 SSFFNN//MMFFNN PPLLAANNNNIINNGG EEXXEERRCCIISSEESS Large area SFN coverage prediction studies are made in Digita. The DVB-T/H planning tool was modified for DVB-T2, the main difference is longer guard intervals in DVB-T2 than DVB-T/H.
The coverage prediction program has three steps. First the field strength calculations for all stations in the network are performed. In the second step the coverage areas are calculated taking into account the receiving antenna gains and specified guard interval. In the third step the coverage MapInfo files are created and results plotted on map.
Field Strength Calculations
• Radial calculation to given max. distance for each stations (CRC [4] or ITU370) o Calculation is done for 50 % (wanted signal) and selected time % (Interfering signal)
• Conversion of Field Strengths (wanted and interfering) to grid of ”pixels”
Coverage Prediction
• Whole calculation area is specified (must be larger than coverage area) • Field Strengths are sorted in each ”pixel” in descending order • Receiving antenna is pointed towards the strongest station • If noise limited reception is >= 70 % combined self-interference and S/I is calculated
o Power sum of co-channel signals out of guard interval taking into account antenna directivity
• Reception probability is calculated • If probability is < 95 % receiving antenna is pointed towards the 2nd strongest station • If probability is still < 95 % the strongest other frequency station (if any) is selected • The station giving highest reception probability is selected
Coverage Maps
• Grid file (DVBT2SMF.MIF) is written using reception probability (70 and 95 %) • Info file (DVBT2SMF.MID) is written including:
o Coverage Probability, Field Strength of wanted and combined interference and population in ”pixel”
• Overall population, coverage probability of 70% and 95%, is calculated
Example of SFN self-interference Figure x1 shows two stations SFN the self-interference when the GI is shorter than the distance between the stations. In Figure x2 the GI is larger than the distance between stations and no self-interference exists.

B21C – CELTIC project CP4-004
WP3 – Network & Channels
Deliverable D11-3
©B21C Project WP3 – Deliverable D11-3 Page : 26 (36)
Figure 14. Espoo-Anjalankoski SFN, distance 144 km, GI 256 µs (85 km)
Figure 15. Espoo-Anjalankoski SFN, distance 144 km, GI 512 µs (170 km)
Large area SFN network This exercise was done on VHF-band using Digitas existing stations and GE06 VHF allotment areas. The GE06 VHF plan was extended by making very large SFN areas. The network and VHF-channels used in the exercise is shown in figure y.

B21C – CELTIC project CP4-004
WP3 – Network & Channels
Deliverable D11-3
©B21C Project WP3 – Deliverable D11-3 Page : 27 (36)
The exercise was done CRC propagation model with three different GI’s, 256, 512 and 608 µs (7MHz channel). The coverage was calculated µs also by using old ITU370 model with GI 512 µs.
Figure 16. VHF network used in the exercise

B21C – CELTIC project CP4-004
WP3 – Network & Channels
Deliverable D11-3
©B21C Project WP3 – Deliverable D11-3 Page : 28 (36)
Coverage, CRC model, GI 256 µs
Figure 17, CRC model, GI 256 µs
Calculation parameters and results ERP: 10 kW Emin: 40 dBµV/m Interference: 1% of time Prediction: CRC Yellow: 70% of locations Red: 95% of locations Population Coverage
• 70%: 4756000 • 95%: 3217000

B21C – CELTIC project CP4-004
WP3 – Network & Channels
Deliverable D11-3
©B21C Project WP3 – Deliverable D11-3 Page : 29 (36)
Coverage, CRC model, GI 512 µs
Figure 18. CRC model, GI 512 µs
Calculation parameters and results ERP: 10 kW Emin: 40 dBµV/m Interference: 1% of time Prediction: CRC Yellow: 70% of locations Red: 95% of locations Population Coverage
• 70%: 5150000 • 95%: 4806000

B21C – CELTIC project CP4-004
WP3 – Network & Channels
Deliverable D11-3
©B21C Project WP3 – Deliverable D11-3 Page : 30 (36)
Coverage, CRC model, GI 608 µs
Figure 19. CRC model, GI 608 µs
Calculation parameters and results ERP: 10 kW Emin: 40 dBµV/m Interference: 1% of time Prediction: CRC Yellow: 70% of locations Red: 95% of locations Population Coverage
• 70%: 5176000 • 95%: 4982000

B21C – CELTIC project CP4-004
WP3 – Network & Channels
Deliverable D11-3
©B21C Project WP3 – Deliverable D11-3 Page : 31 (36)
Coverage, CRC model, GI 608 µs
Figure y. CRC model, GI 608 µs
Calculation parameters and results ERP: 10 kW Emin: 40 dBµV/m Interference: 10% of time Prediction: CRC Yellow: 70% of locations Red: 95% of locations Population Coverage
• 70%: 5183000 • 95%: 5056000
B21C – CELTIC project CP4-004
WP3 – Network & Channels
Deliverable D11-3
©B21C Project WP3 – Deliverable D11-3 Page : 32 (36)
Conclusions
Very large, even country wide SFN networks are possible on DVB-T2 16K and 32K modes and long guard intervals. The exercise in this report is done on VHF-band but they are also valid for UHF band. Large SFN areas make it possible to improve spectrum efficiency and increase the number of networks (services).

B21C – CELTIC project CP4-004
WP3 – Network & Channels
Deliverable D11-3
©B21C Project WP3 – Deliverable D11-3 Page : 33 (36)
55 SSUUMMMMAARRYY OOFF TTFFSS SSTTUUDDIIEESS The B21C project has made very significant contributions to the development of the DVB-T2 specification, including the Time Frequency Slicing (TFS) option defined by the standard. TFS allows for much more efficient statistical multiplexing of HDTV services, thereby allowing about 20% more HD services than non-TFS. Even more interesting TFS allows for very significant advantages for network planning and coverage, which will be dealt with in more detail below.
In contrast to what is often believed the received signal level of different DTT multiplexes varies significantly in a given reception point even when the transmitter ERP is the same. The reasons for these variations are many: the antenna diagram is frequency dependent. Other frequency-dependent parts of the link budget are: propagation loss, multi-path characteristics, received field-strength dependency with height, receiver antenna gain.
For an individual reception point this may result in large level differences between received DTT multiplexes. Because of this one multiplex may e.g. be lost, because of too low a field strength, while other multiplexes may have more than enough margin.
A similar effect is interference from other DTT signals. In this case not only does the wanted signal strength vary depending on location and frequency, but also the unwanted interferer. This causes even larger variations in the received C/I (since both the nominator and denominator have a statistical variation) depending on frequency.
Thanks to the very significant additional frequency diversity offered by TFS the coverage of a set of DTT multiplexes is limited not by the signal level of the weakest multiplex, but rather on the average received level. In this way a coverage gain is obtained by TFS, often referred to as the TFS gain. The TFS gain is defined as the difference (in dB) between the average level and the level of the weakest multiplex. So thanks to TFS one or more DTT multiplexes may have a level that is lower than what could normally be used for DTT reception, provided there are a few multiplexes that have levels which exceed this. This gives a very significant general increase of DTT coverage. The coverage gain can however be partly or fully traded for increased capacity by choosing a somewhat weaker code rate. If. e.g. a code rate of 3/4 is chosen instead of 3/5 (costs about 4 dB in C/N, assumed to be regained by the TFS gain) this provides a capacity increase of 25% (in addition to the statmux gain). In the case of interference the coverage gain effect is even higher, due to the larger variation of the C/I.
Within B21C large sets of measurement data from four operational DTT networks in six areas in Sweden have been analysed from the point of view of the signal level differences between multiplexes. The results show that at individual reception points there are very significant level differences between multiplexes. The statistical distribution of the TFS gain was found to be “Rayleigh-like” with an average value of 4.5 dB for the six areas.
This large set of measurement data had been done outdoor with an omni-directional antenna at 3m height. To check to what extent these results were also applicable to roof-top reception at 10 m height with a directional antenna a limited amount of additional measurements were made. The conclusion of these measurements was that the variations at 10 m height were in fact of about the same size as those at 3m. This suggested therefore that the established high values of TFS gain derived at 3m could also be applicable for reception at 10 m with a directional antenna, i.e. the most common type of DTT reception.
The expected gain of TFS for portable in-door reception is even larger due to a more severe echo environment. To position an indoor antenna in an optimum way even for one DTT multiplex is a complex task, taking also into account the time varying nature of the channel caused e.g. by moving people. With many multiplexes it is almost inevitable that at least one multiplex is significantly

B21C – CELTIC project CP4-004
WP3 – Network & Channels
Deliverable D11-3
©B21C Project WP3 – Deliverable D11-3 Page : 34 (36)
attenuated compared to the average level, thereby requiring an additional margin. However with TFS the antenna positioning should be much less critical due to the frequency diversity causing the average level to be much less dependent on the precise antenna position.
A limited series of detailed measurements performed within B21C confirmed this expectation, showing very large signal strength variations. As expected the TFS gain increased with the frequency spread of the RF channels and was in many cases much larger than for outdoor reception. However, even for a small spread there was a significant TFS gain (2.5 dB with only six RF channels total separation). The measurement results were in addition evaluated for 90% reception probability, in which case the TFS gain increases. When all DTT multiplexes are to be received with 90% probability a larger margin is required to compensate for the increased probability that some multiplex is severely attenuated. The average measured TFS gain (at 90%) from the four flats was 5.5 dB.
A series of computer simulation of TFS performance, using the so-called Common Simulation Platform (CSP) have been performed. The CSP simulations used a simplified model with one PLP in one RF channel, but where the N RF channels of TFS where modelled by the single RF channel being divided into N equally-sized slots. The general level of each slot was set individually but each slot was flat, i.e. there was no multipath. It is believed that the performance obtained with this simplified model should closely match the expected performance results from a full-scale TFS simulation fully in line with the DVB-T2 specification.
The simulation results confirmed the expected general behaviour of TFS, and even exceeded this thanks to the use of the rotated-constellation feature of the DVB-T2 specification. One RF channel may e.g. be fully lost, provided there is at least one more with strong enough signal level (i.e. with 2 RF signals one may be fully lost!). Thanks to rotated constellation good reception was demonstrated in cases where reception would have been theoretically impossible without rotated constellation: where the proportion of lost RF channels exceeds the percentage redundancy of the applied code. Depending on the total number (2-6) of RF channels there was a corresponding penalty on the C/N performance, due to the frequency selectivity of the channel. This penalty decreases with the number of RF channels.
In one study the effects of TFS on interference-limited coverage was studied. Both the general mechanisms and a concrete example area in Sweden were studied. The results show general mechanisms offering improved interference-limited coverage thanks to TFS as well concrete gains in the example area partly due to the fact that the TFS frequencies used in the area (following the Geneva’06 frequency plan) were subject to interference from different sets of sites depending on frequency, i.e. TFS frequencies could be expected to have very different levels of interference. This is another case where one RF channel could be completely lost (in this case due to interference) while reception of all services are still possible.
Detailed information of TFS studies are in the annex: B21C – D11 Part3_TFS.annex.zip.

B21C – CELTIC project CP4-004
WP3 – Network & Channels
Deliverable D11-3
©B21C Project WP3 – Deliverable D11-3 Page : 35 (36)
66 DDVVBB--TT22 FFIIEELLDD TTEESSTTSS To be extended later
66..11 FFIIEELLDD TTEESSTT MMEEAASSUURREEMMEENNTTSS To be extended later

B21C – CELTIC project CP4-004
WP3 – Network & Channels
Deliverable D11-3
©B21C Project WP3 – Deliverable D11-3 Page : 36 (36)
BBIIBBLLIIOOGGRRAAPPHHYY 1. Draft ETSI TR 102 831, DVB-T2 Implementation guidelines
2. B21C_-_20612v0_-_TUBS_-_PCC05_-_Distributed_Alamouti_Coverage_Predictions.ppt
3. BMCO forum White Paper: ”Mobile Broadcast Technologies: Link Budgets”, January 2007, available at www.bmcoforum.org
4. B21C D11-Par1, DVB-H Network Planning