dvb-t2 transmitter measurements for acceptance ... · for complex dvb-t2 signals, the dvb-t2...
TRANSCRIPT

DVB-T2 Transmitter Measurements for Acceptance, Commissioning and Monitoring Application Note
Products:
ı R&S®ETL
ı R&S®ETC
The terrestrial television standard DVB-T2 is gaining in significance as a result of the growing scarcity of available frequencies. New systems are being tested in many countries around the world. Other countries have already completed the introductory phase for DVB-T2. Broadcasting transmitters are subject to particularly stringent standards with respect to broadcast signal quality, because even small faults can lead to service disruptions for many viewers or even disrupt adjacent channels.
A single instrument, the R&S®ETL TV analyzer, performs all required DVB-T2 transmitter measurements, from the initial acceptance testing for the transmitter, to measurements performed during commissioning and preventive maintenance.
Chr
istia
ne K
lau
s
11.2
014
– 7B
M10
6_0E
App
licat
ion
Not
e

Table of Contents
7BM106_0E Rohde & Schwarz DVB-T2 Transmitter Measurements for Acceptance, Commiss ioning and Monitoring
2
Table of Contents
1 Overview .......................................... .................................................... 4
2 Comparison of DVB-T and DVB-T2 .................... ............................... 5
3 Preparing for the Measurements .................... ................................... 6
3.1 Required Equipment ................................ .................................................................... 6
3.2 Test Setup ........................................ ............................................................................. 7
3.3 Transmitter Operating Mode ........................ ............................................................... 7
3.3.1 DVB-T2 Standard Conformance Check......................................................................... 9
3.4 Protection against Destructive Input Power ........ ..................................................... 9
3.5 Default Configuration and Leveling on the R&S ®ETL ............................................10
4 Measurements ...................................... ............................................. 12
4.1 Power ............................................. .............................................................................13
4.1.1 Transmitter Output Level .............................................................................................13
4.1.2 Crest Factor .................................................................................................................15
4.2 Modulator Characteristics ......................... ...............................................................18
4.2.1 I/Q Errors .....................................................................................................................18
4.2.2 Amplitude Frequency Response and Group Delay .....................................................20
4.3 Out-Of-Band Emissions ............................. ...............................................................22
4.3.1 Shoulder Attenuation and Adjacent Channel Emissions .............................................22
4.3.2 Harmonics ....................................................................................................................27
4.4 Signal Quality .................................... .........................................................................28
4.4.1 L1 Pre- and Post-Signaling ..........................................................................................28
4.4.2 Frequency Accuracy ....................................................................................................30
4.4.3 Modulation Error Ratio .................................................................................................31
4.4.4 Constellation Diagram .................................................................................................33
4.4.5 Bit Error Ratio ..............................................................................................................35
5 Abbreviations ..................................... ............................................... 38
6 References ........................................ ................................................ 39
7 Auxiliary Information ............................. ........................................... 39
8 Ordering Information .............................. .......................................... 40

Table of Contents
7BM106_0E Rohde & Schwarz DVB-T2 Transmitter Measurements for Acceptance, Commiss ioning and Monitoring
3
8.1 R&S®ETL & Power Sensor ................................ ........................................................40
8.2 R&S®ETC ....................................................................................................................41
A Transport Stream Generation Using the R&S ®ETL ................................................42
B Reverse Power Measurement Uncertainty ............. .................................................43
C Recording a Filter Frequency Response in a Transduc er File .............................45
D Automated Measurements with R&S ®TxCheck ........................................... ...........47

Overview
Required Equipment
7BM106_0E Rohde & Schwarz DVB-T2 Transmitter Measurements for Acceptance, Commiss ioning and Monitoring
4
1 Overview
The terrestrial television standard DVB-T2 is gaining in significance as a result of the growing scarcity of available frequencies. New systems are being tested in many countries around the world. Other countries have already completed the introductory phase for DVB-T2. Broadcasting transmitters are subject to particularly stringent standards with respect to broadcast signal quality, because even small faults can lead to service disruptions for many viewers or even disrupt adjacent channels.
A single instrument, the R&S®ETL TV analyzer, performs all required DVB-T2 transmitter measurements, from the initial acceptance testing for the transmitter, to measurements performed during commissioning and preventive maintenance.
The measurements described here satisfy many country-specific and customer-specific test specifications. Users need only set the limit values accordingly.
Section 2 DVB-T2 provides a brief comparison with the predecessor DVB-T. Section 3 covers the preparations for testing. That includes information on the necessary test equipment and setup, the transmitter operating mode and the steps required to protect the T&M equipment against destructively high input power. This is followed by a description of typical default configurations for the R&S®ETL.
Section 4 lists the various measurements. For every reserve system in the transmitter, these measurements should be repeated at least once during acceptance testing. Maintenance measurements, on the other hand, can initially be limited to power, MER and BER and then expanded only as needed.
Because preventive maintenance does not require a repetition of all measurements, as a cost-efficient alternative to the R&S®ETL, Rohde & Schwarz also offers the R&S®ETC (see Fig. 1-1). This compact TV analyzer can perform most of the measurements described here with a high degree of accuracy.
Fig. 1-1: R&S ®ETL (left) and R&S ®ETC (right).
Appendix D describes how these measurements can be automated using the R&S®TxCheck software provided with the R&S®ETL.
Additional background information on this topic can be found in the book "Digital Video and Audio Broadcasting Technology" by Walter Fischer [1].

Comparison of DVB-T and DVB-T2
Required Equipment
7BM106_0E Rohde & Schwarz DVB-T2 Transmitter Measurements for Acceptance, Commiss ioning and Monitoring
5
2 Comparison of DVB-T and DVB-T2
The data rate for DVB-T2 is 30 % to 50 % greater than that of its predecessor DVB-T; this is made possible primarily by a greater QAM order and the use of extended carrier mode. The maximum net data rate for DVB-T2 is over 50 Mbit/s. This permits a greater number of programs and/or improved program quality at the same bandwidth. DVB-T2 is significantly more complex than DVB-T, even though similar measurement parameters are evaluated during transmitter acceptance testing.
Like DVB-T, DVB-T2 provides an outer and an inner error correction. In the case of DVB-T2, a combination of Bose-Chaudhuri-Hocquenghem code (BCH) and Low Density Parity Check (LDPC) is used. The calculation in the receiver required for the LDPC algorithm requires significantly more processing power than the Reed-Solomon (RS) error protection used for DVB-T. Therefore, the LDPC algorithm, developed in the mid-90s, will not be used until the second generation transmission standards.
Comparison of DVB-T and DVB-T2
DVB-T DVB-T2
Channel bandwidth 5 MHz, 6 MHz, 7 MHz, 8 MHz 1.7 MHz, 5 MHz, 6 MHz, 7 MHz, 8 MHz, 10 MHz
FFT order 2k, 4k, 8k 1k, 2k, 4k, 8k, 8k extended, 16k, 16k extended, 32k, 32k extended
Modulation QPSK, 16QAM, 64QAM QPSK, 16QAM, 64QAM, 256QAM
Error protection and code rate
Convolutional Coding & Reed Solomon
1/2, 2/3, 3/4, 5/6, 7/8
LDPC & BCH
1/2, 3/5, 2/3, 3/4, 4/5, 5/6
Guard interval 1/4, 1/8, 1/16, 1/32 1/4, 19/128, 1/8, 19/256, 1/16, 1/32, 1/128
As an alternative to the MPEG-2 transport streams (TS) used for DVB-T, a generic stream can be fed to the transmitter via the DVB-T2 modulator interface (T2-MI). A T2-MI stream can contain multiple transport streams (TS). A physical layer pipe (PLP) is present for each transport stream. Each PLP can contain one or more services. The optional common PLP contains data required by several other PLPs. PLPs permit services having varying degrees of robustness to be transmitted in one channel by varying the code rate and modulation (variable coding and modulation – VCM). This permits audio, video and data service to be provided to mobile, portable and stationary devices. The T2-MI stream is generated by the DVB-T2 gateway. The DVB-T2 gateway inserts signaling information for the transmitter (e.g. modulation, code rate) and combines the transport streams. The generated T2-MI stream is split for broadcasting to multiple transmitter sites. The T2-MI feed must be used to enable multi-PLP or single-frequency networks (SFN).

Preparing for the Measurements
Required Equipment
7BM106_0E Rohde & Schwarz DVB-T2 Transmitter Measurements for Acceptance, Commiss ioning and Monitoring
6
3 Preparing for the Measurements
3.1 Required Equipment
Basic configuration
R&S®ETL TV analyzer with:
options as needed (see Chapter 8)
current firmware (available at no cost at www.rohde-schwarz.com/product/ETL.html)
Application- or measurement-specific configurations
Transmitter operation without signal broadcasting f or transmitter acceptance testing or commissioning Dummy antenna
For Transmitter Output Level (4.1.1) with a measure ment uncertainty of < 0.1 dB Additional power sensor, e.g. R&S®NRP-Z91
For Shoulder Attenuation and Adjacent Channel Emiss ions measurements (4.3.1) using the variant "after mask filter" Notch filter to attenuate the wanted signal by 40 dB or more
For Harmonics measurements (4.3.2) Highpass filter with at least 40 dB wanted signal attenuation or more

Preparing for the Measurements
Test Setup
7BM106_0E Rohde & Schwarz DVB-T2 Transmitter Measurements for Acceptance, Commiss ioning and Monitoring
7
3.2 Test Setup
Fig. 3-1: Test setup.
For transmitter acceptance measurements, the transmitter output is connected to a dummy antenna. During commissioning, the measurements are initially performed using a dummy antenna, before the broadcast signal is applied to the antenna diplexer. As a result, the test port at the antenna combiner (M4) is available as an additional measurement point. During maintenance measurements, the signal is similarly applied to the antenna combiner for broadcasting.
For acceptance testing, the transmitter can be fed an MPEG-2 TS. This can be generated using an R&S®ETL TS generator, for example (see Appendix A). For commissioning and maintenance, the transmitter is fed with the T2-MI stream or MPEG-2 TS available at the transmitter site.
3.3 Transmitter Operating Mode
The DVB-T2 baseband interface feed can be in any of various formats:
ı MPEG-2 transport stream (TS): fixed packed length (188 Byte)
ı Generic continuous stream (GCS): no packet structure
ı Generic fixed packetized stream (GFPS): fixed packed length
ı Generic stream encapsulation (GSE): variable packet length
The parameters can be defined directly on the transmitter as long as the network is not to be operated as an SFN and as long as the transmit signal contains only one PLP

Preparing for the Measurements
Transmitter Operating Mode
7BM106_0E Rohde & Schwarz DVB-T2 Transmitter Measurements for Acceptance, Commiss ioning and Monitoring
8
and uses neither the future extension frames (FEF), input stream synchronizer (ISSY), null packet deletion (NPD) or T2Lite. In this case, the transmitter is operated in mode A and fed with an MPEG-2 TS.
For complex DVB-T2 signals, the DVB-T2 modulator must be configured via the T2-MI stream (ETSI TS 102 773 modulator interface). In this case, the Layer 1 (L1) parameters and the individual PLP parameters are defined in the T2-MI gateway instead of on the transmitter. This operating mode is called mode B and is a requirement for an SFN. At present, predominantly SFNs (mode B) with one PLP are in use.
The MPEG-2 TS or the T2-MI stream can be output by the R&S®ETL TS generator, for example (see Appendix A).
The measurements described in this document are based on the following transmitter operating parameters:
Framing & OFDM:
ı 8 MHz channel bandwidth
ı FFT mode = 32k extended
ı Guard interval (GI) = 1/128
ı Pilot Pattern = PP7
T2 system:
ı L1 Post Modulation: 64QAM1
Network settings:
ı Peak to Average Power Ratio (PAPR): Off
ı Future Extension Frames (FEF): Off
Bit-interleaved coding and modulation (BICM):
ı Single PLP: PLP ID 0
ı FEC Frame: Normal
ı Code rate = 2/3
ı PLP constellation order: 256QAM
ı Constellation rotation On
1 It makes sense to select the modulation for the L1 data one order lower than the modulation for the PLPs. In the case of a single PLP, signaling data are rarely transmitted, which is why in practice the lowest modulation order can be selected.

Preparing for the Measurements
Protection against Destructive Input Power
7BM106_0E Rohde & Schwarz DVB-T2 Transmitter Measurements for Acceptance, Commiss ioning and Monitoring
9
3.3.1 DVB-T2 Standard Conformance Check
As a result of the many parameterization options for DVB-T2, the defined parameters do not always comply with the DVB-T2 standard. This can lead to many receivers not being able to decode the signal. Compliance with the standard must therefore be checked. This takes place in the transmitter when a MPEG-2 TS is used. When a T2-MI stream is used, the standard conformance check can take place at the gateway or at the transmitter.
Fig. 3-2: Standard conformance check with an R&S ®TCE900.
3.4 Protection against Destructive Input Power
The R&S®ETL allows maximum input power peaks of 36 dBm (short-term, < 3 s), while the recommended, separate R&S®NRP-Z91 power sensor can handle up to 23 dBm.
It is therefore recommended that additional attenuators be used as needed to limit the average total power at the individual test ports to a range from –10 dBm to +10 dBm. This range provides adequate protection against short-term power peaks, while having a negligible effect on the instrument accuracy.

Preparing for the Measurements
Default Configuration and Leveling on the R&S®ETL
7BM106_0E Rohde & Schwarz DVB-T2 Transmitter Measurements for Acceptance, Commiss ioning and Monitoring
10
3.5 Default Configuration and Leveling on the R&S ®ETL
The following conventions are used in these procedures:
ı Terms in all caps refer to key labels, e.g. "FREQ" for
ı Bulleted lists (for example, TV Standard: OFDM DVB-T2) identify settings made in the currently displayed configuration dialog box
ı All other terms refer to the softkeys that are currently displayed along the right-hand side of the screen. Arrows (→) separate the keys to be pressed in sequence.
The following default settings apply to the R&S®ETL unless explicitly stated otherwise:
Default configuration for "Spectrum Analyzer"
SETUP→Reference Ext: Use the external 10 MHz reference frequency
MODE→Spectrum Analyzer
FREQ→Center: Set to center frequency at mid-channel
SPAN→Span Manual: Set to 20 MHz
TRACE→Detector Manual Select→Detector RMS
BW→Res BW Manual: Set to 30 kHz
SWEEP→Sweeptime Manual: Set to 2 s
AMPT→More→Preselector: Off1
AMPT→RF Atten Manual: Select the lowest possible setting without overloading2
AMPT→Ref Level: Set the reference level so that the entire signal is clearly visible; if necessary, go to AMPT→Range Log and change the grid scale
1 Only if a preselector is available on the device
2 Overload warnings appear centered at the top of the display as "IFovl" or "Ovld".

Preparing for the Measurements
Default Configuration and Leveling on the R&S®ETL
7BM106_0E Rohde & Schwarz DVB-T2 Transmitter Measurements for Acceptance, Commiss ioning and Monitoring
11
Default configuration for "TV/Radio Analyzer/Receiv er"
SETUP→Reference Ext: Use the external 10 MHz reference frequency
MODE→TV/Radio Analyzer/Receiver
MEAS→Digital TV Settings • TV Standard: OFDM DVB-T2 • Channel Bandwidth: Select 1.7 MHz, 5 MHz, 6 MHz, 7 MHz or 8 MHz
FREQ→Channel RF: Select based on the transmit frequency
MEAS→Special Settings→System Opt.→Slow/Laboratory1
Leveling for "TV/Radio Analyzer/Receiver"
MENU→Adjust Attenuation2
AMPT→Preamp: Off
AMPT→More→Preselector: Off3
AMPT→RF Atten Manual: Select the lowest possible setting without overloading4
1 Optimizes the receiver for stationary reception
2 For rough level adjustment.
3 The preselector is used only if adjacent channels are present. This is the case when measuring the antenna combiner, for example.
4 Overload warnings appear centered at the top of the display as "IFovl" or "Ovld".

Measurements
Default Configuration and Leveling on the R&S®ETL
7BM106_0E Rohde & Schwarz DVB-T2 Transmitter Measurements for Acceptance, Commiss ioning and Monitoring
12
4 Measurements
As a quick check, all measurements involving a demodulated signal include a notation in the footer indicating whether the demodulation was possible and whether synchronization to a PLP was successful. The footer line also displays the key parameters level, BER and MER (see Fig. 4-1).
An initial check of the signal quality can be made in overview mode. When using the "Overview" menu, it is possible to select the unit of measurement and set the predefined limits from the table via MEAS→Overview→Edit Table (see Fig. 4-1). Measured values that are not within the set limits are displayed in red. To ensure that values lying outside the limits are recognized quickly – even on black-and-white printouts – these values are additionally marked with an asterisk (*). If all measured values lie within the defined limits, the overview limits (OLim) signaling is displayed along the left edge of the screen. If one of the measured values does not lie within these limits, OLim is displayed in red. This signaling is displayed on all test screens – with the exception of the spectral analysis – and always references the measured values in overview mode.
Fig. 4-1: "TV/Radio Analyzer/Receiver" mode, MEAS →Overview→Edit Table menu: Selecting the unit of measurement for the level results.

Measurements
Power
7BM106_0E Rohde & Schwarz DVB-T2 Transmitter Measurements for Acceptance, Commiss ioning and Monitoring
13
4.1 Power
4.1.1 Transmitter Output Level
The average power is constant for digital television, and not dependent on the picture contents, like it is in analog television. Because the mask filter attenuates the output power between 0.1 dB and 0.6 dB behind the transmitter output, measurements should be taken before and after the mask filter. Note that as a default, the displayed power includes only the power that is decoupled by the directional coupler. The coupling attenuation can be input using the Ref Level Offset function on the R&S®ETL, and is then automatically calculated into the displayed value.
The R&S®ETL can measure the signal level directly via the RF input with an accuracy of 1 dB. Using a separate power sensor makes it possible to achieve an accuracy of 0.1 dB.
Procedure
In each case, perform these steps at the test port: • M1, for forward power before the mask filter • M2, for reverse power (for a discussion of measurement uncertainty, see
Appendix B) before the mask filter • M3, for forward power after the mask filter
Variant "TV/Radio Analyzer/Receiver"
Variant Power sensor
Check to ensure that the max. input power is not exceeded, see Section 3.4
AMPT→More→Ref Level Offset: Set to the full coupling attenuation at the test port for immediate compensation
Feed a signal into the RF input on the R&S®ETL (IN1)
Connect the power sensor (IN2), which is connected to the R&S®ETL via USB or sensor input, to the test port
Define the "TV/Radio Analyzer/Receiver" default settings as described in Section 3.5
Define the spectrum analyzer default settings as described in Section 3.5
FREQ→Center: Set to center frequency at mid-channel MEAS→Overview
Adjust the "TV/Radio Analyzer/Receiver" level as described in Section 3.5
MENU→Power Meter→Frequency Coupling: • Center
MENU→Power Meter→Power Meter→On
Read the measured value; see Fig. 4-2 Read the measured value; see Fig. 4-3

Measurements
Power
7BM106_0E Rohde & Schwarz DVB-T2 Transmitter Measurements for Acceptance, Commiss ioning and Monitoring
14
Fig. 4-2: "TV/Radio Analyzer/Receiver" mode, MEAS →Overview menu: The level can be read in the first table row, in the status bar on the measureme nt screen or in the zoomed view (MEAS→Overview →Zoom).
Fig. 4-3: Spectrum analyzer mode: DVB-T2 spectrum w ith integrated reading from the power sensor displayed at the top right.

Measurements
Power
7BM106_0E Rohde & Schwarz DVB-T2 Transmitter Measurements for Acceptance, Commiss ioning and Monitoring
15
4.1.2 Crest Factor
It is important to know the crest factor so that the components that follow the transmitter – such as the mask filter, the antenna combiner, the coaxial cable and the antenna – can be adequately dimensioned.
The crest factor (CF) defines the relationship between the highest occurring amplitude of the modulated carrier signal (UPeak) and the RMS voltage (URMS) of a signal:
CF = 20 ∙
More recently, however, a new way of defining the crest factor has become prevalent, in which a ratio is formed from the peak envelope power (PEP) and the average power. A crest factor calculated in this way is smaller by an amount equal to the crest factor of the sinus carrier, i.e. 3.01 dB. [3]
Orthogonal frequency division multiplex (OFDM) signals exhibit a very high crest factor because in extreme cases, all carriers could be constructively overlaid or even eliminated at any given moment. In practice, the maximum value is typically between 12 dB to 15 dB, and the transmitters are limited to around 13 dB. In the case of DVB-T2, the peak-to-average-power ratio (PAPR) reduction defines two methods for reducing the crest factor and thus increasing the effectiveness of the transmitter headends. One method, active constellation extension (ACE), can be used only when the constellation diagram is not tilted. For crest factor reduction, the carrier amplitudes of the outermost constellation points are adjusted appropriately. This is possible because the outermost constellation points can be shifted outwards without affecting the demodulation. The other method of crest factor reduction is tone reservation (TR). This involves the reservation of certain carrier ranges, which are then no longer available for user data or pilot tones. The DVB-T2 modulator can set the amplitude and phase of these special carriers as needed in order to reduce the crest factor.
Long observation periods are needed to ensure a representative measurement. This is why the complementary cumulative distribution function (CCDF) includes the statistical probability that a signal peak will occur. The measurement takes place in the time domain with a stopped oscillator. The CCDF method determines the peak envelope power, which is why the calculated value must be corrected by a factor of √2 or 3.01 dB. [4]
The mask filter at the transmitter output removes intermodulation products lying outside of the useful band. However, this filtering results in a deformation of the envelope, which then increases the crest factor. This is why, when measuring the crest factor, it is important to distinguish between the crest factor of the transmitter and the crest factor of the bandwidth-limited signal (e.g. after the mask filter).

Measurements
Power
7BM106_0E Rohde & Schwarz DVB-T2 Transmitter Measurements for Acceptance, Commiss ioning and Monitoring
16
Using the R&S®ETL, the transmitter crest factor is measured in spectrum analyzer mode directly at the transmitter test port (M1).
The crest factor of the bandwidth-limited signal can be measured with the R&S®ETL in spectrum analyzer mode at the test port after the mask filter (M3). Alternatively, the measurement can be made at the transmitter test port (M1) by selecting "TV/Radio Analyzer/Receiver" mode. This mode limits the channel bandwidth (e.g. 8 MHz), simulating a mask filter.
Procedure: Transmitter crest factor
Check that the max. input power is not exceeded, see Section 3.4
Connect the R&S®ETL (IN1) to the test port before the mask filter (M1)
Define the spectrum analyzer default settings as described in Section 3.5
MEAS→More→CCDF→Res BW: 10 MHz
MEAS→More→CCDF→# of Samples: 1.000.000.000
Wait until sample values are available: A running measurement is indicated by a red rectangle with an asterisk ( ) at the top-left corner of the screen. Once this indicator disappears, a valid measurement result is available.
MEAS→More→CCDF→Scaling→y-Axis Min Value: 1.0e-9
Read crest factor and add 3.01 dB
Procedure: Crest factor of bandwidth-limited signal
Check that the max. input power is not exceeded, see Section 3.4
Connect the R&S®ETL (IN1) to the test port before or after the mask filter (M1 / M3)
MEAS→Modulation Analysis→CCDF
Define the default settings for "TV/Radio Analyzer/Receiver" and adjust the level as described in Section 3.5
MEAS→Modulation Analysis→# of Samples: 1.000.000.000
Wait until sample values are available: A running measurement is indicated by a red rectangle with an asterisk ( ) at the top-left corner of the screen. Once this indicator disappears, a valid measurement result is available.
MEAS→More→CCDF→Scaling→y-Axis Min Value: 1.0e-9
Read crest factor, see Fig. 4-5 and add 3.01 dB

Measurements
Power
7BM106_0E Rohde & Schwarz DVB-T2 Transmitter Measurements for Acceptance, Commiss ioning and Monitoring
17
Fig. 4-4: Spectrum analyzer mode, MEAS →More→CCDF menu: View with the calculated crest factor for the transmitter at the bottom right.
Fig. 4-5: "TV/Radio Analyzer/Receiver" mode, MEAS →Modulation Analysis →CCDF menu: View with the calculated crest factor for the bandwidth-limit ed signal at the bottom right.

Measurements
Modulator Characteristics
7BM106_0E Rohde & Schwarz DVB-T2 Transmitter Measurements for Acceptance, Commiss ioning and Monitoring
18
4.2 Modulator Characteristics
4.2.1 I/Q Errors
DVB-T2 modulators are essentially an IFFT signal processing block followed by an I/Q modulator. This I/Q modulator can be either digital or analog. If a DVB-T2 modulator uses direct modulation, then the I/Q modulator is analog. In this case, it must be aligned cleanly to minimize the following influencing factors:
ı Amplitude imbalance
ı Quadrature error
ı Carrier suppression
Poor carrier suppression is recognizable as a notch directly at mid-band on MER(f) and results in a contorted and compressed constellation diagram in mid-band. Amplitude imbalance and quadrature error negatively affect the MER of all COFDM carriers. The carriers above the DVB-T2 mid-band relate to the carriers under mid-band and vice versa.
Procedure
Check to ensure that the max. input power is not exceeded, see Section 3.4
Connect the R&S®ETL (IN1) to the test port before or after the mask filter (M1 / M3)
Define the "TV/Radio Analyzer/Receiver" default settings as described in Section 3.5
MEAS→Modulation Analysis→Modulation Errors
Adjust the "TV/Radio Analyzer/Receiver" level as described in 3.5
Read the measured values, see Fig. 4-6

Measurements
Modulator Characteristics
7BM106_0E Rohde & Schwarz DVB-T2 Transmitter Measurements for Acceptance, Commiss ioning and Monitoring
19
Fig. 4-6: "TV/Radio Analyzer/Receiver" mode, MEAS →Modulation Errors menu: Amplitude imbalance, quadrature error and carrier suppression in lines 8 , 10 and 11.

Measurements
Modulator Characteristics
7BM106_0E Rohde & Schwarz DVB-T2 Transmitter Measurements for Acceptance, Commiss ioning and Monitoring
20
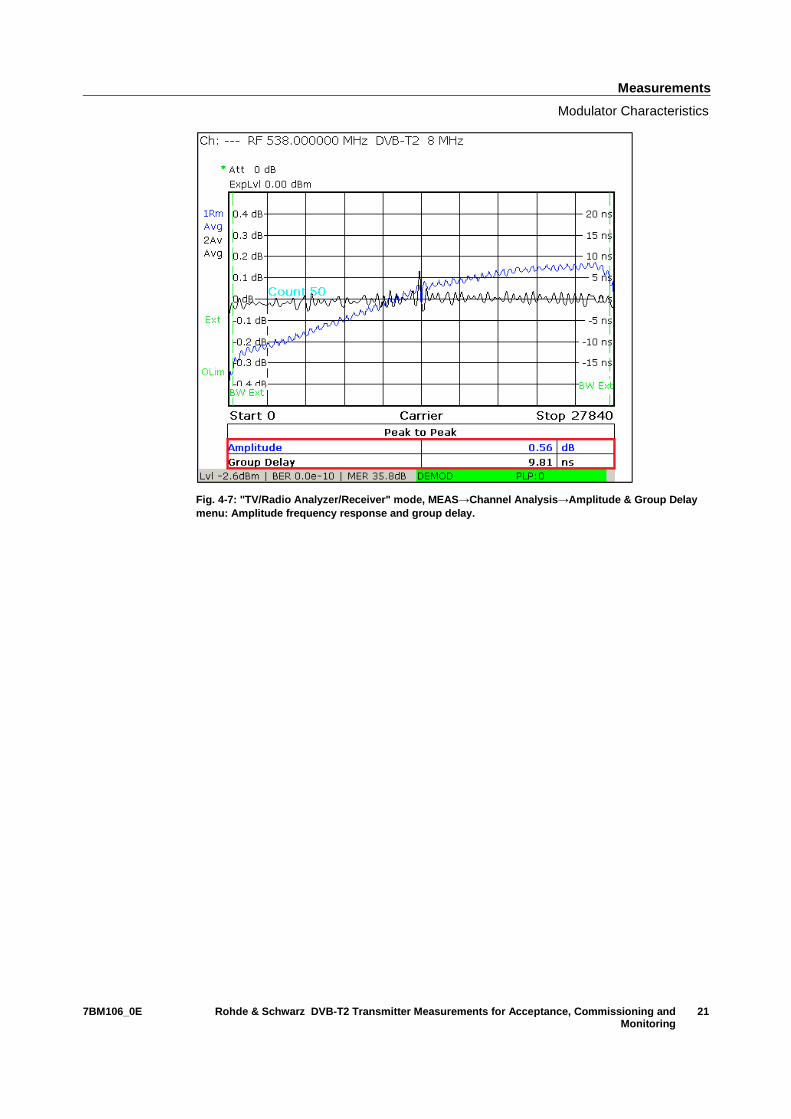
4.2.2 Amplitude Frequency Response and Group Delay
In analog televisions, amplitude frequency response and group delay were important parameters for a transmission path between the transmitter output and the receiver input. Because of the channel correction in the DVB-T2 receiver, significantly larger tolerances can now be permitted without noticeable reductions in quality. The mask filter and antenna combiners cause linear distortions. These linear distortions can be compensated by a precorrector within the transmitter. As a result, however, the linear distortions reappear reversed directly at the transmitter output.
Therefore, the preferred method is to measure amplitude frequency response and group delay after all filter stages at the test port (M4) in the antenna combiner. Of course, the results will differ at the various measurement points.
Procedure
Check to ensure that the max. input power is not exceeded, see Section 3.4
If available, connect the R&S®ETL (IN1) to the test port (M4) on the antenna combiner, or else to (M3) after the mask filter
Define the "TV/Radio Analyzer/Receiver" default settings as described in Section 3.5
MEAS→Channel Analysis→Amplitude & GroupDelay
Adjust the "TV/Radio Analyzer/Receiver" level as described in Section 3.5
TRACE→Trace: Select Trace 1
TRACE→Trace Mode: Average
TRACE→Detector Manual: RMS
TRACE→Trace: Select Trace 2
TRACE→Trace Mode: Average
TRACE→Detector Manual: Average
TRACE→Sweep Count: 50
MEAS→Channel Analysis→Amplitude & GroupDelay→Auto Range
Use PRINT to print the test screen; see Fig. 4-7
Use the R&S®ETL to additionally measure the phase response. The frequency-differentiated phase response corresponds to the group delay. A check of the phase response is therefore not absolutely necessary.
Measurements
Modulator Characteristics
7BM106_0E Rohde & Schwarz DVB-T2 Transmitter Measurements for Acceptance, Commiss ioning and Monitoring
21
Fig. 4-7: "TV/Radio Analyzer/Receiver" mode, MEAS →Channel Analysis →Amplitude & Group Delay menu: Amplitude frequency response and group delay.

Measurements
Out-Of-Band Emissions
7BM106_0E Rohde & Schwarz DVB-T2 Transmitter Measurements for Acceptance, Commiss ioning and Monitoring
22
4.3 Out-Of-Band Emissions
DVB-T2 transmitters include very linear AB amplifiers. The transmitted signal is further linearized by a digital precorrection stage in the modulator. In spite of these, some residual nonlinearities remain. These cause intermodulation products to form from the many COFDM carriers.
On the one hand, these additional, unwanted frequency components appear in the channel itself. There, they act as additional disturbance power and therefore reduce the signal quality. On the other hand, the intermodulation products also occur outside of the channel, and can negatively impact the signal quality of other channels. There are several distinct components:
ı Shoulder attenuation Describes the power of the noise components in the near field of the channel boundary
ı Adjacent channel emissions Components within several MHz of the channel boundaries
ı Harmonics Components at multiples of the transmit frequency
4.3.1 Shoulder Attenuation and Adjacent Channel Emi ssions
The mask filter is used to reduce these unwanted out-of-band emissions. Critical mask filters are used when an adjacent channel requires protection, making more stringent requirements for attenuation of out-of-band emissions necessary. All other mask filters are uncritical.
The values used for DVB-T in line with ETSI EN 302 296 are frequently also used for DVB-T2. In accordance with this standard, the following minimum attenuations must be targeted for 7 MHz and 8 MHz channel bandwidth:
frel [MHz] at 7 MHz channel band- width
frel [MHz] at 8 MHz channel band- width
Attenuation [dB] compared to total channel
power at 4 kHz reference bandwidth
Attenuation [dB] at 7 MHz
channel bandwidth
Attenuation [dB] at 8 MHz
channel bandwidth
Uncritical mask
Critical mask
Uncritical
mask Critical mask
Uncritical mask
Critical mask
Uncritical mask
Critical mask
+/–3.4 +/–3.81 –32.2 (7 MHz) –32.8 (8 MHz)
0 0
+/–3.7 +/–4.2 –73 –83 –40.8 –50.8 –40.2 –50.2
+/–5.25 +/–6.0 –85 –95 –52.8 –62.8 –52.2 –62.2
+/–10.5 +/–12.0 –110 –120 –77.8 –87.8 –77.2 –87.2
+/–13.85 +/–11.75 – –126 –93.8 –
Table 4-1: Tolerance masks in line with ETSI EN 302 296 for transmitters with an output power of ≥ 25 W

Measurements
Out-Of-Band Emissions
7BM106_0E Rohde & Schwarz DVB-T2 Transmitter Measurements for Acceptance, Commiss ioning and Monitoring
23
In spite of the typical dynamic range of 58 dB on the R&S®ETL, which is very high for spectrum analyzers, the high dynamic range of the signal after the mask filer means that it is not directly possible to determine whether the mask has been violated. This is why an adjustable notch filter is typically used to reduce the useful band power. Before the measurement, the tracking generator on the R&S®ETL records the frequency response of the notch filter so that its influence on the measurement results after the mask filter can automatically be taken into consideration using the transducer function.
Another option is to use the tracking generator to log the frequency response of the mask filter itself before the measurement so that its influence can be calculated into the spectrum analysis results before the mask filter using the transducer function.
Procedure
After mask filter using a notch filter Before mask filter
Record the frequency response of the adjustable notch filter in a transducer file; see Appendix C
Record the frequency response of the mask filter in a transducer file; see Appendix C
Connect the R&S®ETL (IN1) to the test port after the mask filter (M3) and then add the notch filter at the auxiliary filter insertion point
Connect the R&S®ETL (IN1) to the test port before the mask filter (M1)
4.3.1.1 Shoulder attenuation
One cause for the shoulders is the superposition of the residual orthogonal single carriers. These are reduced to the extent possible in the modulator by means of digital filters. DVB-T2 defines FFT modes 1K, 2K, 4K, 8K, 16K and 32K. As a rule, 1K mode has higher shoulders than 32K mode because the residual individual carriers decrease more rapidly. A guard band is located at the upper and lower edge of the channel, in between the useful signal spectrum and the start of the adjacent channel, in order to protect the adjacent channels. This guard band is up to about 200 kHz wide. DVB-T2 transmitters can be operated in either normal carrier mode or extended carrier mode. The wider useful spectrum and thus the higher data rate afforded by the extended carrier mode is available effective with the 8K mode. The measurement points and limit values are not dependent on the carrier mode.

Measurements
Out-Of-Band Emissions
7BM106_0E Rohde & Schwarz DVB-T2 Transmitter Measurements for Acceptance, Commiss ioning and Monitoring
24
The shoulder attenuation can be measured on the R&S®ETL, as frequently used in practical applications, by means of cursor measurements in spectrum analyzer mode (recommended for experts only). Alternatively, the R&S®ETL also supports fully automated measurements using the “tangent method” as defined in the DVB measurement guidelines [2].
Both methods are supported by the R&S®ETL and have practical uses; however, because of their different definitions, they do not lead to the same result.
Procedure
Cursor measurement Tangent method
Check to ensure that the max. input power is not exceeded, see Section 3.4
Follow the procedure defined in 4.3.1
Go to SETUP→Transducer to enable the previously generated transducer file
Define the spectrum analyzer default settings as described in Section 3.5
Define the "TV/Radio Analyzer/Receiver" default settings as described in Section 3.5
MKR→Marker 1: Set to center MEAS→Spectrum→Shoulder Attenuation
MKR→Marker 2: Set to +4.2 MHz1 Adjust the "TV/Radio Analyzer/Receiver" level as described in 3.5
MKR→More→Marker 3: Set to -4.2 MHz1 If needed2: TRACE→Sweep Count: 100
Read the marker delta values; see Fig. 4-8 Read the measured value; see Fig. 4-9
Use PRINT to generate a printout, if desired
SETUP→Transducer→Active Off: Disable the transducer file
Asymmetric shoulders indicate poor signal quality.
1 8 MHz channel bandwidth. For 7 MHz/6 MHz/1.7 MHz channels, the value is 3.7 MHz/3.2 MHz/0.97 MHz, respectively.
2 In the tangent method, the measured value sometimes varies significantly depending on the definition. To prevent this, multiple measurements can be averaged; however, this is not compliant with the standard.

Measurements
Out-Of-Band Emissions
7BM106_0E Rohde & Schwarz DVB-T2 Transmitter Measurements for Acceptance, Commiss ioning and Monitoring
25
Fig. 4-8: Spectrum analyzer mode: Measuring the sho ulder attenuation using the cursor method with active transducer file at +/– 4.2 MHz in the 8 MHz DVB-T channel.
Fig. 4-9: "TV/Radio Analyzer/Receiver" mode, MEAS →Spectrum →Shoulder Atten menu: Measuring the shoulder attenuation using the tangent method w ith active transducer file in accordance with DVB measurement guidelines. [2]

Measurements
Out-Of-Band Emissions
7BM106_0E Rohde & Schwarz DVB-T2 Transmitter Measurements for Acceptance, Commiss ioning and Monitoring
26
4.3.1.2 Adjacent channel emissions
Emissions can be measured over a range of several MHz in the vicinity of the channel, again either by using cursor measurements or fully automatically with the R&S®ETL "Out of Band Emission" function.
The “Out of Band Emission” measurement function supports compliance with all masks defined in ETSI EN 300 744 (Critical, G-Pal/Nicam, G-Pal/A2, I-Pal/Nicam, KSecam/K-Pal, L-Secam/Nicam).
Procedure
Variant Cursor measurement
Variant Out-of-band emission function
Check to ensure that the max. input power is not exceeded, see Section 3.4
Follow the procedure defined in 4.3.1
Go to SETUP→Transducer to enable the previously generated transducer file
Define the spectrum analyzer default settings as described in Section 3.5
Define the "TV/Radio Analyzer/Receiver" default settings as described in Section 3.5
MKR→Marker 1: Set to center MEAS→Spectrum→OutOfBand Emission
The following three settings must be repeated for each defined measurement point
Go to MEAS→Spectrum→OutOfBand Emission→Out of Band Emission Setup Select the mask type
MKR→Marker 2: Set to measurement point MEAS→Spectrum→Adjust Attenuation
MKR→More→Marker 3: Set to the next measurement point
If averaging is desired: TRACE→Trace Mode: Average TRACE→Sweep Count: 100
Read the marker delta values; see Fig. 4-8. Use PRINT to generate a printout as needed
Use PRINT to print the results; see Fig. 4-10
SETUP→Transducer→Active Off: Disable the transducer file
Fig. 4-10: "TV/Radio Analyzer/Receiver" mode, MEAS →Spectrum →OutOfBandEmission menu: Adjacent channel emissions checked with critical ma sk and active transducer file.

Measurements
Out-Of-Band Emissions
7BM106_0E Rohde & Schwarz DVB-T2 Transmitter Measurements for Acceptance, Commiss ioning and Monitoring
27
4.3.2 Harmonics
The harmonics filter is used to reduce these unwanted out-of-band emissions. This filter is typically already part of the transmitter. The R&S®ETL TV analyzer can be used to measure harmonics in spectrum analyzer mode. Because the mask filter does not suppress these harmonics, but rather affects only the channel near range, the harmonics can be measured directly at the test port (M1) on the transmitter output.
The high dynamic range of the signal means that a suitable highpass filter must be used to attenuate the useful channel by at least 40 dB. Notch filters have the disadvantage that they do not attenuate in just the useful band, but rather are "repeated" at multiples of the useful band. The frequency response of the highpass filter should be documented before the measurement using the tracking generator and then applied during the measurement using the transducer function.
Procedure
Check to ensure that the max. input power is not exceeded, see Section 3.4
Assess the highpass filter and save the result as a transducer file, see Appendix C
Connect the R&S®ETL (IN1) to the test port before the mask filter (M1) and add the highpass filter at the auxiliary filter insertion point
Define the spectrum analyzer default settings as described in Section 3.5
FREQ→Center: Set to 1.5 GHz
SPAN→Span Manual: Set to 3 GHz
Go to SETUP→Transducer to enable the previously generated transducer file for the highpass filter
Go to MKR→Marker 1 and use the marker functions to study the range around the multiples of the transmit frequency; see Fig. 4-11
Fig. 4-11: Spectrum analyzer mode: Useful channel a ttenuated using the highpass filter; the harmonics, which can be assessed using the marker f unction, are clearly visible.

Measurements
Signal Quality
7BM106_0E Rohde & Schwarz DVB-T2 Transmitter Measurements for Acceptance, Commiss ioning and Monitoring
28
4.4 Signal Quality
4.4.1 L1 Pre- and Post-Signaling
As with DVB-T, in DVB-T2 the currently selected transmission parameters are signaled. The structure for the DVB-T2 frame begins with a P1 symbol, followed by one or more P2 symbols. These are followed by the actual data symbols, i.e. the user data for the PLPs. The P2 symbols contain the L1 signaling data for the receiver.
The L1 pre-signaling data is fixed with BPSK modulation and includes a constant error protection. Different transmission parameters are used for the L1 post-signaling data. The L1 pre-signaling data therefore includes the transmission parameters for the L1 post-signaling data.
Procedure
Check to ensure that the max. input power is not exceeded, see Section 3.4
Connect the R&S®ETL (IN1) to the test port before or after the mask filter (M1 / M3)
Define the "TV/Radio Analyzer/Receiver" default settings as described in Section 3.5
MEAS→Overview→L1 Analysis→L1-pre Signalling
Adjust the "TV/Radio Analyzer/Receiver" level as described in Section 3.5
Use PRINT to print the test screen; see Fig. 4-12
MEAS→Overview→L1 Analysis→L1-post Signalling
Use PRINT to print the test screen; see Fig. 4-13

Measurements
Signal Quality
7BM106_0E Rohde & Schwarz DVB-T2 Transmitter Measurements for Acceptance, Commiss ioning and Monitoring
29
Fig. 4-12: "TV/Radio Analyzer/Receiver" mode, MEAS →Overview →L1 Analysis →L1-pre Signalling menu: Display of the pre-signaling data for the P2 symbol.
Fig. 4-13: "TV/Radio Analyzer/Receiver" mode, MEAS →Overview →L1 Analysis →L1-post Signalling menu: Display of the post-signaling data for the P2 symbol.

Measurements
Signal Quality
7BM106_0E Rohde & Schwarz DVB-T2 Transmitter Measurements for Acceptance, Commiss ioning and Monitoring
30
4.4.2 Frequency Accuracy
The level of precision at which the frequency accuracy can be measured depends on how long it has been since the last time the T&M instrument was calibrated. In general, it is safe to assume that an external reference is required in order to measure at an accuracy > 10–5.
Single-frequency networks (SFNs), in particular, place very stringent requirements on the frequency accuracy of a DVB-T2 transmitter of less than 10–9. The carrier frequency offset is measured using the R&S®ETL in "TV/Radio Analyzer/Receiver" mode at the test port (M1) of the transmitter output.
Procedure
Check to ensure that the max. input power is not exceeded, see Section 3.4
Connect the R&S®ETL (IN1) to the test port before the mask filter (M1)
Define the "TV/Radio Analyzer/Receiver" default settings as described in Section 3.5
MEAS→Overview
Adjust the "TV/Radio Analyzer/Receiver" level as described in Section 3.5
Note the carrier frequency offset reading; see Fig. 4-14
Fig. 4-14: "TV/Radio Analyzer/Receiver" mode, MEAS →Overview menu: The frequency accuracy can be read in the 5th table row, as well as in the zoo med view (MEAS →Overview →More→Zoom).

Measurements
Signal Quality
7BM106_0E Rohde & Schwarz DVB-T2 Transmitter Measurements for Acceptance, Commiss ioning and Monitoring
31
4.4.3 Modulation Error Ratio
The modulation error ratio (MER) is the most important quality parameter for a DVB-T2 transmitter. It is a measure of the sum of all interference that affects a digital TV signal. The deviation of the points in the constellation diagram from their theoretical position is recorded. This makes a quantitative assessment of the signal quality possible. The MER is typically expressed in dB as a logarithmic ratio between the RMS value of the signal amplitude and the error vector magnitude:
=–20∑ (| _"#$ |)²–'()
*+,- [dB]
A high MER value indicates good signal quality. In practice, MER values of only a few dB up to approximately 35 dB occur in terrestrial transmission. A good DVB-T2 transmitter has a MER in the range of approximately 35 dB. A larger MER value would be technically feasible, but is not being pursued for reasons of energy efficiency. The maximum MER value for a decoded signal depends on the modulation order, the code rate and the receiver. At a code rate of ½ and a modulation order of 256QAM or 64QAM, the R&S®ETL decodes the signal to approx. 15.5 dB, or 11 dB MER. In general, it is safe to assume that DVB-T2 signals received over a roof antenna with gain will exhibit a MER of 18 dB to 30 dB at the antenna box. Values between 12 dB and 20 dB are expected for portable receivers with a room antenna.
DVB-T2 distinguishes between the MER for L1 and the MER for the individual PLPs. When the signal quality is good, the MER values will be the same. The MER of the PLPs is usually checked in order to provide a broader set of data. However, if the signal quality is very bad, a better approach is to use the MER for L1 as the basis. Otherwise, the more frequent limit violations (assignment to the individual decision fields) will result in a MER that appears to be better.
If ACE is used to reduce the crest factor, the measured MER value degrades because the outermost constellation points are shifted outward. The reduced MER value therefore does not necessarily equate to a worse signal quality. The constellation diagram (see 4.4.4) is used to analyze this.

Measurements
Signal Quality
7BM106_0E Rohde & Schwarz DVB-T2 Transmitter Measurements for Acceptance, Commiss ioning and Monitoring
32
The MER can be expressed as an averaged value over all COFDM subcarriers or as MER(f) in a graph over the DVB-T2 channel.
Procedure
Check to ensure that the max. input power is not exceeded, see Section 3.4
Connect the R&S®ETL (IN1) to the test port before or after the mask filter (M1 / M3)
Define the "TV/Radio Analyzer/Receiver" default settings as described in Section 3.5
MEAS→Modulation Analysis→MER(f)
Adjust the "TV/Radio Analyzer/Receiver" level as described in Section 3.5
SPAN→Full Span
Use PRINT to print the test screen; see Fig. 4-15
High-efficiency transmitters can cause the MER(f) to display a slight distortion after the equalizer.
Fig. 4-15: "TV/Radio Analyzer/Receiver" mode, MEAS →Modulation Analysis →MER(f) menu: MER as a function of the frequency, and integrations of the MER averaged over the channel (RMS).

Measurements
Signal Quality
7BM106_0E Rohde & Schwarz DVB-T2 Transmitter Measurements for Acceptance, Commiss ioning and Monitoring
33
4.4.4 Constellation Diagram
The constellation diagram makes it possible to display all the signal states that occurred in quadrature modulation at discrete time intervals at the same time. The constellation diagram is a graphical representation of the in-phase and quadrature components of the QAM signal in the x- and y-axes. In the case of modulation with multiple carriers, the constellation diagram typically forms the sum of the signal states of all the carriers. A noisy or disrupted DVB-T2 signal will exhibit cloud-like effects. The smaller the resulting points on the constellation diagram, the better the signal quality. When making measurements directly on the transmitter, only fine constellation points should be visible.
There are four possible constellation orders for DVB-T2: QPSK, 16QAM, 64QAM and 256QAM. In order to improve decoding even when the reception is disrupted, DVB-T2 uses a rotated constellation diagram in conjunction with Q-shift. Q-shift refers to the transmission of the I and Q components of an I/Q sample on different carriers.
Procedure
Check to ensure that the max. input power is not exceeded, see Section 3.4
Connect the R&S®ETL (IN1) to the test port before or after the mask filter (M1 / M3)
Define the "TV/Radio Analyzer/Receiver" default settings as described in Section 3.5
MEAS→Modulation Analysis→Const Diagram→Const Select: Select the I/Q source, e.g. PLP Cells before Derotation, see Fig. 4-16
Adjust the "TV/Radio Analyzer/Receiver" level as described in Section 3.5
SPAN→Full Span
Use PRINT to print the constellation diagram; see Fig. 4-17

Measurements
Signal Quality
7BM106_0E Rohde & Schwarz DVB-T2 Transmitter Measurements for Acceptance, Commiss ioning and Monitoring
34
Fig. 4-16: "TV/Radio Analyzer/Receiver" mode, MEAS →Modulation Analysis →Const Diagram →Const Select menu: Selecting the I/Q source for the DVB-T 2 constellation diagram.
Fig. 4-17: "TV/Radio Analyzer/Receiver" mode, MEAS →Modulation Analysis →Const Diagram menu: DVB-T2 constellation diagram (256QAM) before derota tion with approx. 36 dB MER.

Measurements
Signal Quality
7BM106_0E Rohde & Schwarz DVB-T2 Transmitter Measurements for Acceptance, Commiss ioning and Monitoring
35
4.4.5 Bit Error Ratio
In the case of DVB-T2, a combination of Bose-Chaudhuri-Hocquenghem code (BCH) and Low Density Parity Check (LDPC) is used. LDPC is an iterative block code method that iteratively reduces the number of faulty bits. The transition between the point at which the received and corrected signal is error free and the point at which the signal can no longer be reconstructed (fall-of-the-cliff effect) is very narrow (only a few tenths of a dB, typically about 0.2 dB). With LDPC, data rates near the maximum channel capacity (Shannon limit) are achieved. Of course, there is a limit to the number of errors that can be corrected per packet with LDPC. The more time allotted to the LDPC algorithm increases the number of iterations, thereby increasing the number of errors that can be corrected. The LDPC algorithm stops as soon as all errors are corrected. The number of iterations required to correct all errors provides a method to assess the signal quality. It must be noted that the number of iterations is dependent on the implementation, and therefore values measured for different receivers cannot be compared to one another.
BCH is capable of correcting any residual errors arising as a result of the LDPC principle.
The following measurement parameters are used for DVB-T2:
ı BER before LDPC
ı BER after LDPC = BER before BCH
ı BBFRAME Error Ratio: Specifies how many frames could not be corrected
ı Errored Second Ratio: Specifies, as a percentage, how many of the last 20 seconds had at least one BBFRAME error
Of course, the FEC requires a certain data overhead, and so reduces the net data rate. In order to keep the overhead for error correction as low as possible while remaining as resistant to errors as possible, a baseband scrambling is performed before the FEC and a code spreading (= bit interleaving) is performed after the FEC. This ensures that bit errors are distributed as evenly as possible. To do this, the data bits are interleaved so that related data and the associated error protection are not transmitted contiguously. This is done because interference usually either affects only a narrow frequency range or occurs very briefly (burst errors).
The BER is measured separately for each of the different PLPs, since a different code rate and a different modulation order can be selected for every PLP.

Measurements
Signal Quality
7BM106_0E Rohde & Schwarz DVB-T2 Transmitter Measurements for Acceptance, Commiss ioning and Monitoring
36
All interference on an DVB-T2 transmission path can be expressed as bit error ratios (BER). In the case of a functional DVB-T2 transmitter, only the BER before LDPC can differ from null. It will lie in the range of 10–9 or less. With small BERs, it is necessary to select correspondingly long measurement times. For acceptance tests, this will be hours, while it will be minutes for monitoring tests.
Procedure
Check to ensure that the max. input power is not exceeded, see Section 3.4
Connect the R&S®ETL (IN1) to the test port before or after the mask filter (M1 / M3)
MEAS→Overview
Define the default settings for "TV/Radio Analyzer/Receiver" and adjust the level as described in Section 3.5
MEAS→Overview→Decoded PLP Man: Select the PLP to be checked
Open the MEAS→Measure Log→Configure dialog, see Fig. 4-18: • Select Enable Measurement Log • Select the Time Span to define the measurement time Select the measurement parameters to be displayed1 • Trace 1: Select BER before LDPC • Trace 2: Select BER before BCH
MEAS→Measure Log→Clear
Allow the test – lasting from several minutes to several hours – to run completely
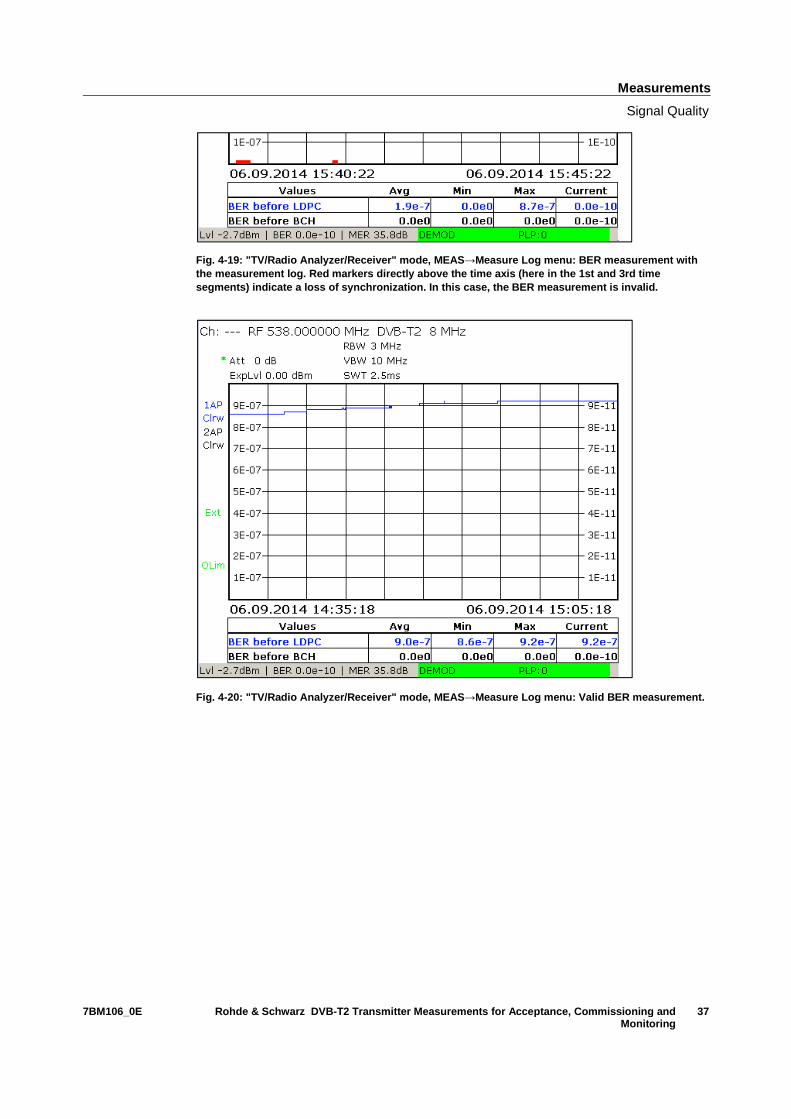
Check the validity of the measurement: There must not be any serious signal faults indicating a loss of synchronization; see Fig. 4-19.
If the measurement is valid: MEAS→Measure Log→Auto Range
If the measurement is valid: Record the Max value and then use PRINT to print the results, if desired; see Fig. 4-20.
Repeat the measurement steps for all PLPs
Fig. 4-18: "TV/Radio Analyzer/Receiver" mode, MEAS →Measure Log →Configure menu: Configuration for the BER measurement.
1The measurement documents all available measurement parameters, but displays a maximum of two curve traces. Go to MEAS→Measure Log→Export to write the measured values to a csv file.
Measurements
Signal Quality
7BM106_0E Rohde & Schwarz DVB-T2 Transmitter Measurements for Acceptance, Commiss ioning and Monitoring
37
Fig. 4-19: "TV/Radio Analyzer/Receiver" mode, MEAS →Measure Log menu: BER measurement with the measurement log. Red markers directly above the time axis (here in the 1st and 3rd time segments) indicate a loss of synchronization. In th is case, the BER measurement is invalid.
Fig. 4-20: "TV/Radio Analyzer/Receiver" mode, MEAS →Measure Log menu: Valid BER measurement.
Abbreviations
7BM106_0E Rohde & Schwarz DVB-T2 Transmitter Measurements for Acceptance, Commiss ioning and Monitoring
38
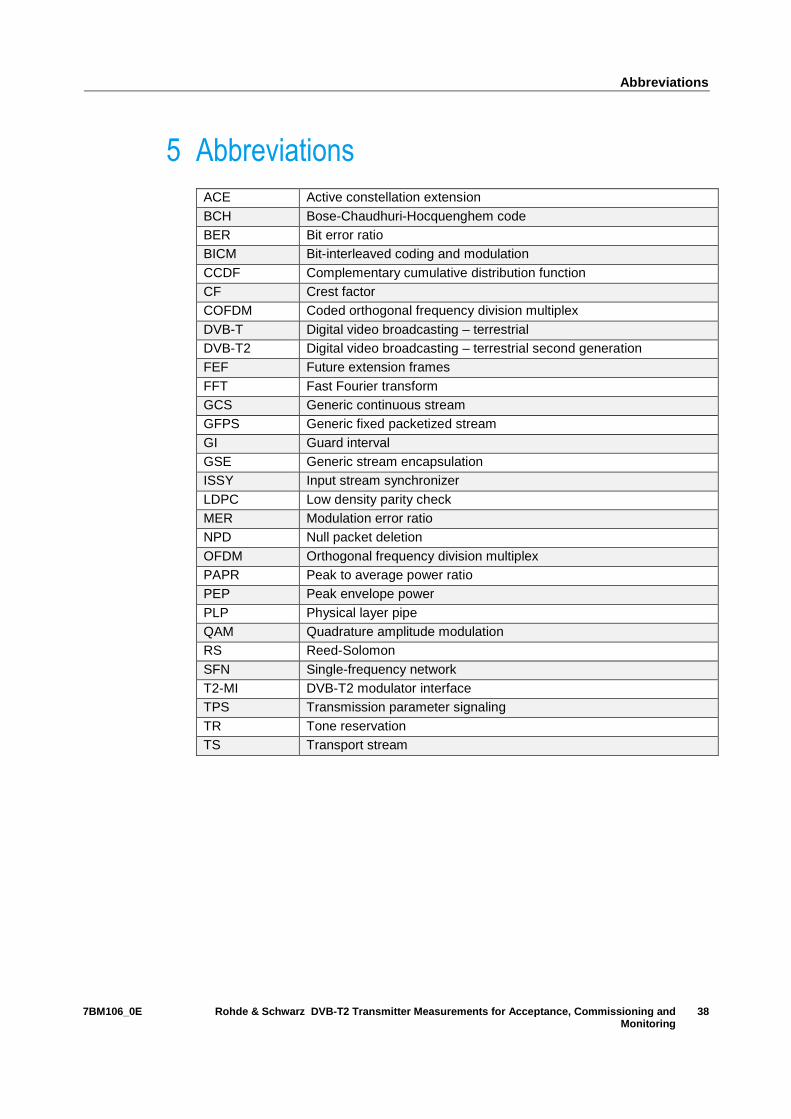
5 Abbreviations
ACE Active constellation extension BCH Bose-Chaudhuri-Hocquenghem code BER Bit error ratio BICM Bit-interleaved coding and modulation CCDF Complementary cumulative distribution function CF Crest factor COFDM Coded orthogonal frequency division multiplex DVB-T Digital video broadcasting – terrestrial DVB-T2 Digital video broadcasting – terrestrial second generation FEF Future extension frames FFT Fast Fourier transform GCS Generic continuous stream GFPS Generic fixed packetized stream GI Guard interval GSE Generic stream encapsulation ISSY Input stream synchronizer LDPC Low density parity check MER Modulation error ratio NPD Null packet deletion OFDM Orthogonal frequency division multiplex PAPR Peak to average power ratio PEP Peak envelope power PLP Physical layer pipe QAM Quadrature amplitude modulation RS Reed-Solomon SFN Single-frequency network T2-MI DVB-T2 modulator interface TPS Transmission parameter signaling TR Tone reservation TS Transport stream

References
7BM106_0E Rohde & Schwarz DVB-T2 Transmitter Measurements for Acceptance, Commiss ioning and Monitoring
39
6 References
[1] "Digital Video and Audio Broadcasting Technology", Walter Fischer, Springer Verlag, 2010, ISBN: 978-3-642-11611-7
[2] "Measurement guidelines for DVB systems", ETSI TR 101 290
[3] Application Note 7TS02
[4] Determining the CCDF – A comparison of two methods", Christoph Balz, NEWS from Rohde & Schwarz, Volume 172 (2001/III), pp. 52 – 53
7 Auxiliary Information
Our application notes are regularly revised and updated. Check for any changes at http://www.rohde-schwarz.com.
Please send any comments or suggestions about this application note to

Ordering Information
7BM106_0E Rohde & Schwarz DVB-T2 Transmitter Measurements for Acceptance, Commiss ioning and Monitoring
40
8 Ordering Information
8.1 R&S®ETL & Power Sensor
Designation Type Order No. Instrument
TV Analyzer, 500 kHz to 3 GHz, with tracking generator R&S®ETL 2112.0004.13
Average Power Sensor; 9 kHz to 6 GHz, 200 mW
R&S®NRP-Z91 1168.8004.02
Required options
One of the following three power sensor interfaces
Additional interfaces R&S®FSL-B5 1300.6108.02
Active USB Adapter R&S®NRP-Z3 1146.7005.02
Passive USB Adapter R&S®NRP-Z4 1146.8001.02
Power Sensor Support with NRP R&S®FSL-K9 1301.9530.02
DVB-T2 Firmware R&S®ETL-K340 2112.0527.02
Measurement Log for DTV R&S®ETL-K208 2112.0579.02
Required hardware option for DVB-T2
FPGA Extension Board R&S®ETL-B300 2112.0385.02
OR
FPGA Extension Board, High SNR FM R&S®ETL-B310 2112.0340.02
RF Preselector R&S ETL-B203 model .03 2112.0327.03
Recommended options
For generation of the MPEG2-TS:
80 Gbyte HD (part of the base unit starting with SN 101500)
R&S®ETL-B209 2112.0291.02
MPEG Processing Board R&S®ETL-B280 2112.0362.02
MPEG TS Generator/ Recorder R&S®ETL-K280 2112.0591.02
Single-frequency network offset
DVB-T2 Frequency Offset R&S®ETL-K341 2115.1682.02
Picture display
Video and Audio HW Decoder R&S®ETL-B281 2112.0356.02
HDTV and Dolby Upgrade R&S®ETL-K281 2112.0604.02
MPEG analysis
MPEG Analysis/Monitoring R&S®ETL-K282 2112.0610.02
In-Depth Analysis R&S®ETL-K283 2112.0627.02
Data Broadcast Analysis R&S®ETL-K284 2112.0633.02
DVB T2-MI Extension R&S®ETL-K382 2115.1701.02

Ordering Information
7BM106_0E Rohde & Schwarz DVB-T2 Transmitter Measurements for Acceptance, Commiss ioning and Monitoring
41
8.2 R&S®ETC
Designation Type Order No.
Instrument
Compact TV Analyzer, up to 3.6 GHz Compact TV Analyzer, up to 8 GHz
R&S®ETC 2116.5000.04 2116.5000.08
FPGA Extension Board R&S®ETC-B300 2116.5230.02
Required options
DVB-T2 Analysis R&S®ETC-K240 2116.5123.02
Software application tool
Automatic Transmitter Measurement, TxCheck R&S®ETC-K940 2116.5152.02

Appendix
Transport Stream Generation Using the R&S®ETL
7BM106_0E Rohde & Schwarz DVB-T2 Transmitter Measurements for Acceptance, Commiss ioning and Monitoring
42
Appendix
A Transport Stream Generation Using the R&S ®ETL
The MPEG TS generator / recorder on the R&S®ETL outputs a DVB-compliant MPEG-2 TS or a compliant T2-MI stream. The stream is applied to the transmitter van a 75 Ω cable connected to the TS ASI OUT output (at the rear of the R&S®ETL). A full complement of transport stream files are available for DVB (such as "Diver.gts"), which can be played back without interruption in an endless loop. The following settings are required on the R&S®ETL:
TS generator settings
MODE→TS Generator / Recorder
MEAS→TS Generator→Source: Select the appropriate TS (see Fig. 8-1)
MEAS→TS Generator→Start
Fig. 8-1: TS generator mode: Generating a transport stream.

Appendix
Reverse Power Measurement Uncertainty
7BM106_0E Rohde & Schwarz DVB-T2 Transmitter Measurements for Acceptance, Commiss ioning and Monitoring
43
B Reverse Power Measurement Uncertainty
Measurement uncertainty occurs during scalar measurements of reverse power as a result of the directivity of measurement couplers. This directivity is an indicator of undesirable forward crosstalk on the reverse power that is being measured. The better the directivity, the less undesirable forward crosstalk is present. A typical directivity value for directional couplers is about −35 dB.
The phase of the overlapping signals must be known in order to measure reverse power exactly. This is possible only with a vector power measurement. However, the scalar measurement offered by the R&S®ETL can also be used to perform the necessary assessment. Instead of determining the precise reverse power value, the R&S®ETL ensures that the reverse power is low enough that the transmitter station self-protect function does not shut down the station. This can be determined using a scalar measurement as long as the ratio of the directional coupler directivity to the maximum permissible reverse power is large enough.
During a scalar measurement of the reverse power, the theoretical worst-case measurement errors would be from about +6 dB to −∞ dB, see Fig. 8-2. In other words, the reverse power in a scalar measurement can be up to 6 dB too high or else much too low. The measurement uncertainty is dependent on the insertion loss, the directivity and the reverse power. To simplify the evaluation, the insertion loss should be disregarded because its influence in practice is negligible.
Fig. 8-2: Measurement uncertainty of the scalar mea surement, dependent on the ratio of the directional coupler directivity to the reverse powe r (insertion loss of the directional coupler is disregarded).

Appendix
Reverse Power Measurement Uncertainty
7BM106_0E Rohde & Schwarz DVB-T2 Transmitter Measurements for Acceptance, Commiss ioning and Monitoring
44
For example, assume that the ratio of the directional coupler directivity to the reverse power is 0 dB (worst case). In this situation, the theoretical maximum measurement error would be between +6 dB and −∞ dB. However, as long as a 6 dB greater value is acceptable, it is not necessary to determine the actual value.
In another example, assume that the difference between the directional coupler directivity and the reverse power is 20 dB. In this case, the theoretical maximum measurement error would be between 0.83 dB and −0.92 dB. In other words, if the decoupled reverse power is −15 dBm, for example, and the directional coupler directivity is −35 dB, values of between –14.17 dBm and −15.92 dBm can occur at the test instrument. In this case, the measurement uncertainty varies in a range of ±1 dB. As a result, a scalar measurement would detect the critical case of a large reverse power.
The following diagram (Fig. 8-3) can be used to determine the maximum actually reversed power based on the measurement value that is displayed.
Fig. 8-3: Maximum actually reversed power based on measured reverse power.
In summary, a scalar measurement is sufficient as long as the maximum actually reversed power from the measured line is at an acceptable value.

Appendix
Recording a Filter Frequency Response in a Transducer File
7BM106_0E Rohde & Schwarz DVB-T2 Transmitter Measurements for Acceptance, Commiss ioning and Monitoring
45
C Recording a Filter Frequency Response in a Transd ucer File
In practice, there are two methods for assessing signals that exceed the dynamic range offered by spectrum analyzers: ı Method 1: The frequency components having the highest power are selectively
attenuated using auxiliary filters, such as adjustable notch filters or a highpass filter. This reduces the dynamic range enough that the signals can be measured after the auxiliary filter. In order to display the actual dynamic range automatically, a transducer file is used to compensate by mathematically subtracting the frequency response of the auxiliary filter, which was previously assessed in a separate step.
ı Method 2: If the high dynamic range of the signal is achieved by using a specific filter (for example, the mask filter on a transmitter), auxiliary filters are not absolutely required. Instead, the frequency response of the specific filter can be recorded separately as a transducer file. This transducer file is then enabled during the measurement before the filter by adding the filter frequency response, and thus automatically calculating the actual dynamic range.
The transducer file can be created directly using the tracking generator function on the R&S®ETL as long as the frequency response of the filter does not exceed the measurable dynamic range11:
Generating a transducer file
MODE→Spectrum Analyzer
FREQ→Center: Set to center frequency at mid-channel
SPAN→Span Manual: Set to 30 MHz
TRACE→Detector Manual Select→More→Detector Average
BW→Res BW Manual: Set to 30 kHz
SWEEP→Sweeptime Manual: Set to 2 s
MENU→Tracking Generator→Source On
MENU→Tracking Generator→Source Power: Set to 0 dBm
Connect the cables to be used for the measurement from the Gen Out 50 Ω output on the R&S®ETL to the RF IN 50 Ω input on the R&S®ETL, see Fig. 8-4
AMPT→Ref Level: Set to –30 dBm
11 The frequency response provided in the data sheet can also be entered into the transducer file manually (SETUP→Transducer)

Appendix
Recording a Filter Frequency Response in a Transducer File
7BM106_0E Rohde & Schwarz DVB-T2 Transmitter Measurements for Acceptance, Commiss ioning and Monitoring
46
Generating a transducer file
R&S®ETL with preselector 12 R&S®ETL without preselector
AMPT→RF Atten Manual: Set to 15 dB AMPT→RF Atten Manual: Set to 0 dB
If an overload occurs13, go to AMPT→RF Atten Manual and increase the attenuation by 5 dB.
MENU→Tracking Generator→Source Cal→Cal Trans
MENU→Tracking Generator→Source Cal→Normalize
Using the previously assessed cables, connect the filter to be assessed from the Gen Out 50 Ω output on the R&S®ETL to the RF IN 50 Ω input on the R&S®ETL, see Fig. 8-5
Method 1 (reduce the dynamic range using
auxiliary filters)
Method 2 (assess before increasing the dynamic
range) MENU→Tracking Generator→Source Cal→More→Save As Neg Trd Factor
MENU→Tracking Generator→Source Cal→More→Save As Pos Trd Factor
Specify a file name and save the transducer file
Go to SETUP→Transducer→Active On to enable the transducer file
Fig. 8-4: Connection setup to regulate the cable.
Fig. 8-5: Connection setup to assess the frequency response of a mask filter.
12 If a preselector is provided in the instrument, the Preselector setting is available under AMPT→More. The preselector is enabled by default.
13 Overload warnings appear centered at the top of the display as "IFovl" or "Ovld".

Appendix
Automated Measurements with R&S®TxCheck
7BM106_0E Rohde & Schwarz DVB-T2 Transmitter Measurements for Acceptance, Commiss ioning and Monitoring
47
D Automated Measurements with R&S ®TxCheck
The R&S®TxCheck software application is available free of charge on every R&S®ETL14. This software makes it possible to run measurements automatically, and includes the generation of a weighted report of the results.
This Application Note includes the TxCheck profile "7BM106.ETLtxi". Opening this file in R&S®TxCheck configures the software to perform the following measurements on the transmitter:
ı Transmitter Output Level (4.1.1, "TV/Radio Analyzer/Receiver" )
ı Crest Factor (4.1.2, crest factor of the bandwidth-limited signal)
ı I/Q Errors (4.2.1)
ı Amplitude Frequency Response and Group Delay (4.2.2)
ı L1 Pre- and Post-Signaling (4.4.1)
ı Frequency Accuracy (4.4.2)
ı Modulation Error Ratio (4.4.3)
ı Constellation Diagram (4.4.4)
One-time configuration of TxCheck
Copy the file 7BM106.ETLtxi to the R&S®ETL
MODE→TxCheck
In the R&S®TxCheck application, go to File/Open Profile (*.ini) and select the previously copied profile "7BM106.ETLtxi"
On the "Settings" tab, adjust the frequency and bandwidth, see Fig. 8-6
In the "Measurements" tab, adjust the limits for the individual measurement parameters and add or remove measurement parameters as needed.
Go to "File/Save Profile (*.ini)" to save the generated profile
14 The software can also be run on an external PC, see more information in the TxCheck menu item
"Help→Installation Info…"

Appendix
Automated Measurements with R&S®TxCheck
7BM106_0E Rohde & Schwarz DVB-T2 Transmitter Measurements for Acceptance, Commiss ioning and Monitoring
48
Using TxCheck to perform the measurement
Check to ensure that the max. input power is not exceeded, see Section 3.4
If available, connect the R&S®ETL (IN1) to the test port (M4) on the antenna combiner, or else to (M3) after the mask filter
MODE→TxCheck
Go to "File/Open Profile (*.ini)" to open the prepared profile
Press "Write Settings to ETL" to save the configuration
MODE→TV/Radio Analyzer/Receiver
Manually adjust "TV/Radio Analyzer/Receiver" as described in Section 3.5
MODE→TxCheck
Go to "Measurement→Start Measurement" to start the measurement, see Fig. 8-7
After the measurements are complete, go to "File/Save' to save the results and then use "File/Export (*csv) …" to export the results as needed
Fig. 8-6: R&S ®TxCheck user interface, "Settings" tab.

Appendix
Automated Measurements with R&S®TxCheck
7BM106_0E Rohde & Schwarz DVB-T2 Transmitter Measurements for Acceptance, Commiss ioning and Monitoring
49
Fig. 8-7: R&S ®TxCheck user interface, "Measurements" tab.

About Rohde & Schwarz
Rohde & Schwarz is an independent group of companies specializing in electronics. It is a leading supplier of solutions in the fields of test and measurement, broadcasting, radiomonitoring and radiolocation, as well as secure communications. Established more than 75 years ago, Rohde & Schwarz has a global presence and a dedicated service network in over 70 countries. Company headquarters are in Munich, Germany.
Regional contact
Europe, Africa, Middle East +49 89 4129 12345 [email protected] North America 1-888-TEST-RSA (1-888-837-8772) [email protected] Latin America +1-410-910-7988 [email protected] Asia/Pacific +65 65 13 04 88 [email protected]
China +86-800-810-8228 /+86-400-650-5896 [email protected]
Environmental commitment
ı Energy-efficient products
ı Continuous improvement in environmental sustainability
ı ISO 14001-certified environmental management system
This application note and the supplied programs may only be used subject to the conditions of use set forth in the download area of the Rohde & Schwarz website.
R&S® is a registered trademark of Rohde & Schwarz GmbH & Co. KG; Trade names are trademarks of the owners.
Rohde & Schwarz GmbH & Co. KG Mühldorfstraße 15 | D - 81671 München Phone + 49 89 4129 - 0 | Fax + 49 89 4129 – 13777 www.rohde-schwarz.com
PA
D-T
-M:
/0D
/EN
/