dvb-t and dvb-t2 transmitter test challenges - … and dvb-t2... · dvb-t and dvb-t2 transmitter...
TRANSCRIPT

DVB-T and DVB-T2 Transmitter Test Challenges
Application Note
IntroductionOver the past 10 years, DVB-T has become the most widely adopted and deployed terrestrial digital video standard. It is now well established and the prices of DVB receivers have dropped over time as the technology has matured. Due to its successful development and deployment, DVB-T has come to serve as a sort of benchmark for the development of other terrestrial digital video standards.
Due to increasing scarcity of spectrum and requirements for high transmission capacity in recent years, an updated standard with more spectral efficiency is required to replace DVB-T. The DVB-T2 system is capable of meeting these requirements, due to its increased capacity, robustness, and the ability to reuse existing reception antennas. The regions which previously adopted DVB-T sys-tems, primarily countries in Europe and Asia, will be migrating to DVB-T2, while many new countries and regions began the process of adopting DVB-T2 directly since the first version of the standard was published in 2009.
With the advanced technologies used in DVB-T2 to achieve high performance levels, measurement challenges face both transmitter and receiver developers. In this application note, we will focus on the transmitter test measurement challenges.

2
Overview of the DVB-T and DVB-T2 Standards and Transmitter Structures
DVB-T and DVB-T2 standards overview
Both DVB-T and DVB-T2 use the OFDM modulation scheme, which provides various options for bandwidth, modulation, FEC (forward error correction) rates, number of carriers, and guard intervals, making it flexible enough to meet the needs of different transmission environments and operators.
The key features of the DVB-T and DVB-T2 technologies are listed side by side in Table 1.
The combination of the parameters in Table 1 can result in numerous test cases. DVB-T2 provides more options than DVB-T, enabling higher efficiency and flexibility, and supports more advanced technologies, such as multiple PLPs, LDPC coding, and MISO, resulting in increased signal and test complexity, especially for a MISO configuration. Overall, while there are similarities between the two systems, the broader set of features in the DVB-T2 system allows it to offer both a much higher data rate than DVB-T and a much more robust signal.
Table 1. Comparison of the key features of the DVB-T and DVB-T2 systems
Features DVB-T DVB-T2FEC Convolutional coding + RS:1 /2, 2/3, 3 /4, 5/6, 7 /8 LDPC + BCH: 1 /2, 3/5, 2/3, 3 /4, 4/5, 5/6Modulation QPSK, 16QAM, 64QAM QPSK, 16QAM, 64QAM, 256QAM with constellation
rotationGuard interval 1 /4, 1 /8, 1/16, 1/32 1 /4, 19/128, 1 /8, 19/256, 1/16, 1/32, 1/128FFT size 2 k, 4 k, 8 k 1 k, 2 k, 4 k, 8 k, 16 k, 32 kScattered pilots 8% of total 1%, 2%, 4%, 8% of totalContinual pilots 2.0% of total 0.4% - 2.4%Bandwidth 5, 6, 7, 8 MHz 1.7, 5, 6, 7, 8, 10 MHzTypical data rate 24 Mbit/s 40 Mbit/sMax. data rate (@ 20 dB C/N) 31.7 Mbit/s 45.5 Mbit/s
3
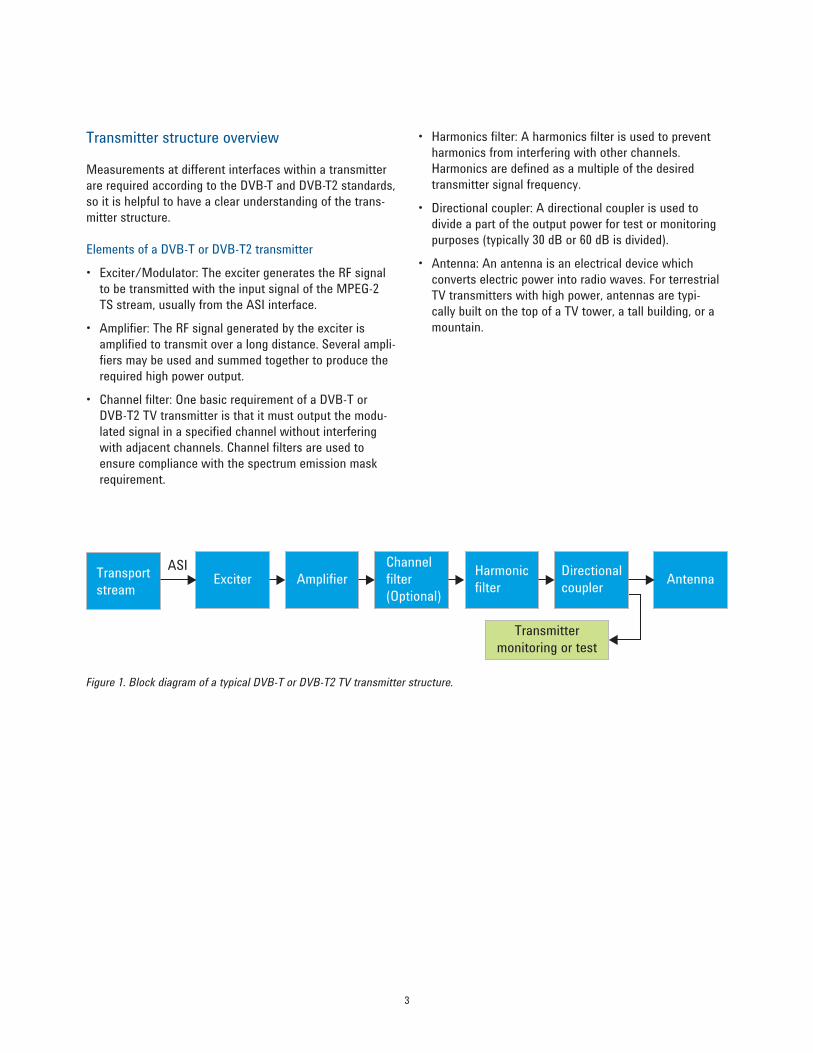
Transmitter structure overview
Measurements at different interfaces within a transmitter are required according to the DVB-T and DVB-T2 standards, so it is helpful to have a clear understanding of the trans-mitter structure.
Elements of a DVB-T or DVB-T2 transmitter
• Exciter/Modulator: The exciter generates the RF signal to be transmitted with the input signal of the MPEG-2 TS stream, usually from the ASI interface.
• Amplifier: The RF signal generated by the exciter is amplified to transmit over a long distance. Several ampli-fiers may be used and summed together to produce the required high power output.
• Channel filter: One basic requirement of a DVB-T or DVB-T2 TV transmitter is that it must output the modu-lated signal in a specified channel without interfering with adjacent channels. Channel filters are used to ensure compliance with the spectrum emission mask requirement.
• Harmonics filter: A harmonics filter is used to prevent harmonics from interfering with other channels. Harmonics are defined as a multiple of the desired transmitter signal frequency.
• Directional coupler: A directional coupler is used to divide a part of the output power for test or monitoring purposes (typically 30 dB or 60 dB is divided).
• Antenna: An antenna is an electrical device which converts electric power into radio waves. For terrestrial TV transmitters with high power, antennas are typi-cally built on the top of a TV tower, a tall building, or a mountain.
Figure 1. Block diagram of a typical DVB-T or DVB-T2 TV transmitter structure.
Transportstream
ASIExciter Amplifier
Channelfilter(Optional)
Harmonicfilter
Directionalcoupler Antenna
Transmittermonitoring or test

4
DVB-T and DVB-T2 Transmitter Test Challenges
Shoulder attenuation
Test purpose
In broadcast system transmitter testing, a simplified measurement, known as shoulder attenuation, is used to evaluate the linearity characterization of an OFDM signal, rather than using the more complex spectrum emission mask measurement.
Test challenges
One challenge presented by the shoulder attenuation test arises from that fact that while detector mode is not clearly defined, it is actually quite important. Detector mode should be set up according to the same method as is in the Spectrum Emission Mask (SEM) measurement, which is used to determine the maximum value of the spectrum. The max hold detector is recommended for use in the shoulder attenuation test. If other than the max hold detec-tor is used, detector type information should be provided so that the results can be compared.
Another challenge of the shoulder attenuation test method is that it defines a range from 300 kHz to 700 kHz for drawing the spectrum line, but it cannot be measured directly using just a spectrum analyzer. Either a dedicated measurement or a post-processing method should be used to determine the shoulder attenuation value. For a quick overview, the value at 500 kHz can be measured directly provided that coherent interferers are not present.
SEM measurement
Test purpose
The SEM measurement includes both in-band and out-of-band spurious emissions, which makes it more complicated than the shoulder attenuation measure-ment. It is defined as the power contained in a specified frequency bandwidth at certain offsets, relative to the total carrier power. It can also be expressed as a ratio of power spectral densities between the carrier and the specified offset frequency band.
Test challenges
The dynamic range of the RF output of a real DVB-T or DVB-T2 transmitter typically exceeds that of the analyzer. Therefore, if you measure the spectrum emission mask of the RF output directly, the measurement result will be “FAIL”, which does not reflect the real RF output. There are two methods of measuring the spectrum emission mask of the transmitter’s RF output, as defined in TR290[1], which can help you overcome this challenge:
• When the DVB-T or DVB-T2 transmitter has an output filter that can be disconnected, you can measure the SEM result without using the output filter and then you can apply the output filter response by post-processing, as is done with amplitude correction.
• When the transmitter doesn’t have an output filter that can be disconnected, an external filter such as a band-block filter should be measured with frequency response and then you can apply the negative of the filter’s frequency response to get the transmitter’s SEM performance.
Figure 2. Diagram of the SEM measurement on a DVB-T or DVB-T2 transmitter with an output filter.
Inputsignal RF out
DVB-T/H/T2 transmitter
ACOFDMexciter
Poweramplifier
Outputfilter
Signal analyzer Attenuator

5
Phase noise of local oscillators (LO) measurement
Test purpose
In an OFDM system, phase noise can cause a Common Phase Error (CPE) which affects all carriers simultaneously, and which can be minimized or corrected by using the continual pilots. However, Inter-Carrier Interference (ICI) is noise-like and cannot be corrected. The effects of CPE are similar to any single carrier system and the phase noise, outside the loop bandwidth of the carrier recovery circuit, leads to a circular smearing of the constellation points in the I/Q plane, which reduces the operating margin (noise margin) of the system and may directly increase the BER. The effects of ICI are particular to OFDM and cannot be corrected for, which must be taken into account as part of the total noise of the system. Before measuring the modu-lation quality of the DVB-T or DVB-T2 signal, adding phase noise is recommended to make sure that high MER results can be reached with the pre-defined phase noise limit.
Test challenge
A variety of measurement techniques have been developed to meet the various requirements for phase noise measure-ments. However, manually performing phase noise mea-surements with a signal analyzer can be tedious and time consuming and it is typically recommended that a dedicat-ed signal analyzer be used. The three most widely adopted techniques for performing phase noise measurements are: direct spectrum, phase detector, and two channel cross-correlation. Among these, the direct spectrum technique is the simplest, and perhaps the oldest, technique for making phase noise measurements. The most obvious advantage of using the direct spectrum technique for phase noise measurements is that it can be accomplished with a general-purpose signal/spectrum analyzer. However, the analyzer’s settings, such as resolution bandwidth (RBW) and internal phase noise optimization loops, will need to be adjusted based on the offset frequency to achieve the highest levels of measurement accuracy and speed.
Historically, the most widely used phase noise unit of measurement has been total single sideband power, within a one hertz bandwidth at a frequency (f) away from the carrier referenced to the carrier frequency power. This unit of measurement is represented as L(f) in units of dBc/Hz. One example from the AC106 VALIDATE Project and taken from the DTG D book, shows a recommended mask for phase noise measurements that is valid for local oscillators and is considered to cover safe limits for both CPE and ICI phase errors in the 2k mode of DVB-T. The following values are recommended.
The far-end phase noise is much lower than the near-end phase noise. The middle range phase noise between points B and C contributes most to the DVB-T and DVB-T2 MER noise floor because the FFT size can be configured from 1 K to 32 K. With a transmitter with an 8 MHz channel band-width, the subcarrier spacing can range from 250 Hz to 8000 Hz, which correlates to the middle-range phase noise. The phase noise level is critical when using the 32 k FFT mode and the 256QAM constellation, as defined in DVB-T2. So a pre-defined phase noise limit test could be important and valuable to achieve confidence in MER results for exciter or transmitter test.
Figure 3. Sample phase noise mask. Note that the axes are not to scale. See Table 2 for values.
Table 2. Example of frequency offsets for phase noise measurements
fa fb fc fdFrequency 10 Hz 100 Hz 3 kHz 1 MHzLimits La to Ld
–55 dBc/Hz –85 dBc/Hz –85 dBc/Hz –130 dBc/Hz

6
Modulation quality analysis measurement
Test purpose
Measuring modulation accuracy and quality are necessary in order to perform DVB-T and DVB-T2 standard-defined tests and to ensure proper operation of the transmitters or exciters. This measurement takes into account all pos-sible error mechanisms in the entire transmission chain, including baseband filtering, I/Q modulation anomalies, filter amplitude and phase non-linearities, and power amplifier distortion, providing an overall indication of the performance level of the transmitter of the UUT.
The DVB-T/T2 modulation accuracy measurement provides information on the performance of the transmitter’s modu-lation circuitry. In a digitally modulated signal, it is possible to predict what the ideal magnitude and phase of the car-rier should be at any time, based on the transmitted data sequence. The transmitter’s modulated signal is compared to an ideal signal vector. The difference between these two vectors is sampled and processed using DSP.
• EVM (Error Vector Magnitude) – EVM is a modulation quality metric widely used in digital broadcast systems. It is defined as:
where N is the number of data points in the measure-ment samples and Smax is the magnitude of the vector to the outermost state of the constellation.
• MER (Modulation Error Ratio) – MER is a power ratio expressed in dB of the sum of squares of the magnitude of the ideal symbol vectors to the sum of the squares of the magnitudes of the symbol error vectors. MER results reflect the quality of digital video signals directly. It indi-cates the signal deterioration even before the BER result turns bad. The MER is calculated as shown below:
MER is the single “figure of merit” analysis calculation typically defined in the broadcasting industry. EVM is the “figure of merit” analysis typically defined in wire-less industry. MER and EVM are closely related and can generally be computed by using the other, as in the following equation:
There are various influences that deteriorate signal modulation quality as measured by the MER result. The following influences/parameters are defined to quantify the different error contributions and to help trouble-shoot and improve transmitter modulation qual-ity to ensure that high-quality signals can be correctly received by the DVB-T and DVB-T2 receivers.
• Magnitudeerror: Indicates the difference in amplitude between the I/Q measured signal and the I/Q reference signal.
• Phaseerror: Indicates the difference in phase between the I/Q reference signal and the I/Q measured signal for a composite signal.
• Frequencyerror: Indicates the signal carrier frequency-error relative to the reference signal’s center frequency. This parameter is displayed in Hz and is the amount of frequency shift from the reference signal’s center fre-quency. Errors in RF frequency, LO frequency, or digitizer clock rate could all appear as carrier frequency error.
• Quadratureerror: Indicates the orthogonal error between I and Q signals.
• Amplitudeimbalance: Indicates the QAM distortions resulting from gain imbalance of I and Q signals.
• Clockerror: Indicates the difference between the sam-ple clock of the input signal and the reference signal.
( )2 2
12
max
1 N
j ji
NEVM 100%
I QSδ δ
=
+= ×
∑
( )( )
N 22
j jj=1
10 N 2 2
j jj=1
+ MER = 10log dB
+
QI
I Qδ δ
∑
∑
where V is the peak to mean ratio of PAPR
1 , MER V
EVMv =×

7
Test challenge
The following list represents a variety of elements of the modulation analysis quality measurement which can prove challenging:
• Equalization: It should be noted that the channel estimation/channel correction mechanism can have an impact on the measurement results. This is particularly true for measurements in the field or for simulating realistic reception conditions. For measurements taken at the output of a transmitter, the impact of the channel estimation/channel correction mechanism is negligible. For comparison of measurement results, information on the character of the channel estimation/channel correction mechanism should be provided. Typically a transmitter should be measured with data equalization off, but field or standard receiver simulation measure-ments should be done with data equalization turned on.
• Frequencyerror: SFN networks have very strict require-ments for frequency errors, which must typically be less than 1 Hz. Therefore, it is important for test equipment to have the capabilities of locking the same LO source, usually from a GPS clock, or of locking the LO and the transmitter together. The test equipment internal frequency error should also be low enough to make the frequency error measurement.
• MERfloor: In all cases, the MER floor of the test equipment limits the measurement floor for an exciter or transmitter under test. The test equipment setup and operation needs to be optimized to ensure that the exciter or transmitter is being accurately measured and not degraded by the residual MER of the test equipment. Typically, it is recommended that the exciter MER should be more than 40 dB, the transmitter MER should be more than 36 dB, and the test equipment MER floor should be at least 3 dB better.
• MERvs.frequencyorsubcarriernumber: Displaying MER values as a function of the frequency or subcarrier number can be very helpful in troubleshooting the root cause of MER deterioration. For example, a subcarrier MER result worse than 0 means that there is a large DC offset. MER results for subcarriers far from the center frequency are lower than those that are near the center and may have increased MER result values due to a clock error problem. MER results that are worse at specified subcarriers may be increased by interference at that frequency.
• MERvs.subcarriertype: With an OFDM symbol, there are different subcarrier modulation types defined by subcarrier group, such as scattered pilot subcarriers, continuous pilot subcarriers, data subcarriers (data sub-carriers may have several different modulation types for DVB-T2 signals in a Multi PLP configuration and each PLP has an individual modulation type from QPSK to 256 QAM). By default the MER result measures all of the received symbols including all of the subcarriers to rep-resent an exciter or transmitter performance result. For trouble-shooting purposes, the MER result by subcarrier group is helpful in locating the root cause of the MER noise contribution from different subcarrier groups.

8
Single frequency network measurement
Test purpose
Single Frequency Network (SFN) broadcasting has been widely implemented, especially for OFDM-based systems like DVB-T and DVB-T2, due to its high frequency efficiency and simple frequency planning. But ensuring good cover-age through efficient transmitter deployment is challeng-ing. In an SFN system, several transmitters transmit thesame signal on the same frequency simultaneously. Also, repeaters are used to guarantee good signal coverage. As a result, a receiver may receive signals with echoes. Echo scenarios in an SFN system in the real world are variable, and will generally be one of the following: Pre-echoes, post-echoes, pre-echoes and post-echoes.
Test challenges
It is important for operators to be familiar with network characteristics at different locations in order to guarantee good reception. For example, the existence of echo power or delay spread at a particular location can significantly affect the ability of the receiver to recover the desired data. In order to get an accurate echo pattern, the SFN analyzer should not only find the best FFT window position for demodulation and analysis, but should also provide the flexibility to adjust the FFT window to see the effect using different FFT window positions.
Figure 6 shows a scenario with one pre-echo and one post-echo to explain how to adjust FFT window position. The FFT start position, as shown in Figure 6, is set as the start point of the FFT window. In order to measure the echo pattern accurately, the FFT window should be set to make sure a minimum of inter-symbol interference (ISI) is introduced and to include as many echoes as possible. “No ISI range” means that if the FFT start position is set in this range, there is no overlap with the preceding and subsequent symbols of different echoes.
Figure 5. Pre-echoes and post-echoes scenario.
Figure 4. SFN Network.
Figure 6. FFT window selection for a DVB-T or DVB-T2 SFN test.
Echoes in SFN systems without optimization may not conform to the echo masks defined by MBRAI/NorDig. So the capability to detect echoes that violate the masks is very important.

9
DVB-T2 MISO measurement
Test purpose
MIMO systems are based on signal processing with multiple antennas on both the transmitter side and the receiver side. The DVB-T2 standard describes a transmit diversity method with two antennas on only the transmitter side, which is called multiple-input single-output (MISO) and is based on a modified Alamouti coding scheme. See Figure 7. The encoding scheme is performed on pairs of the OFDM payload cells ([a0,b0] for the first pair). Next, [a0,b0] is sent to the first antenna and [-b0*, a0*] is sent to the second one, where * denotes the complex conjugation operation. Note that the encoding process is not applied to preamble symbol P1, so the content of the P1 symbol should be identical on the two antennas.
The key benefit of a MISO SFN system is reduced degrada-tion in terms of the minimum amount of receiver input power required in order to improve the coverage and robustness of SFN network reception. It is typical for there to be degradation of several dB in a SISO-SFN as a result of fading effects that lead to spectral cancellations.
Test challenges
The DVB-T2 MISO test is challenging because it requires a solution that:
• Enables a quick and accurate means of performing a combined two channel RF test
• Has the ability to look at both channels individually as well as the inter-relationships between the channels
Figures 8 and 9 contain simplified block diagrams for DVB-T2 MISO measurements. To validate MISO SFN transmitter performance, transmitter group Tx1 or group Tx2 can be measured separately. The test method and test elements are the same as in the SISO SFN transmitter test.
After the performance of each transmitter is validated, the combined signal from transmitter groups Tx1 and Tx2 should be measured. The MISO group power ratio should also be measured and calibrated. Additionally, the channel impulse response, with combined signals from Tx1 and Tx2, should also be measured and calibrated to optimize system performance under a MISO SFN configuration.
Figure 7. DVB-T2 MISO encoding process for OFDM payload cells.
Figure 8. Simplified block diagram of a DVB-T2 MISO measurement with a single Tx signal.
Figure 9. Simplified block diagram of a DVB-T2 MISO measurement with combined signals.
TX1 or TX2 Single Tx measurement
TX1
TX2
Combined signalmeasurement
OFDMpayload cells
Tx1...a0b0a1b1......a0b0a1b1...
...-b0•a0
•-b1•a1
•... Tx2
ModifiedAlamouti encoder

10
DVB-T and DVB-T2 transmitter tests, which include RF measurements, modulation quality measurements, SFN tests, and DVB-T2 MISO tests, in addition to others discussed in this document, are very challenging. To meet the transmitter test requirements, understanding and knowing how to apply the correct test methods is critical to success, as is using good test equipment with high performance capabilities such as high dynamic range, high accuracy, and a low MER floor. Additionally, trouble-shooting capabilities are necessary in order to meet the full transmitter performance test requirements.
Reference
[1] ETSI TR 101 290 V1.2.1, “Digital Video Broadcasting (DVB); Measurement guidelines for DVB systems”, 2001-05.
[2] DVB Document A14-2, “Digital Video Broadcasting (DVB); Measurement guidelines for DVB systems; Amend-ment for DVB-T2 System”, July 2012.
[3] ETSI EN 300 744: Digital Video Broadcasting (DVB); Frame structure, channel coding and modulation for digital terrestrial television
[4] ETSI EN 302 755: Digital Video Broadcasting (DVB); Frame structure channel coding and modulation for a second generation digital terrestrial television broadcasting system (DVB-T2)
[5] Agilent DVB-T/H with T2 X-Series Measurement Application N6153A & W6153A Technical Overview, 5990-3569EN, Oct 2012
[6] Agilent Addressing the Challenges of Deploying Single Frequency Networks for DVB-T and DVB-T2 application note, 5991-1362EN, Nov 2012
Conclusion Web
Related Literature
www.agilent.com/find/digitalvideowww.agilent.com/find/digital_video_solution
DVB-T and DVB-T2 Receiver Test Challenges, Application Note, Literature Number 5991-1869ENAddressing the Challenges of Deploying Single Frequency Networks DVB-T & DVB-T2, Application Note, Literature Number 5991-1362ENConduct DVB-T/H Conformance Tests with Agilent’s Real-Time DVB-T/H Digital Video Solution, Literature Number 5990-5722EN

www.agilent.com
www.lxistandard.orgLAN eXtensions for Instruments puts the power of Ethernet and the Webinside your test systems. Agilent is a founding member of the LXI consortium.
AgilentChannelPartnerswww.agilent.com/find/channelpartnersGet the best of both worlds: Agilent’s measurement expertise and product breadth, combined with channel partner convenience.
For more information on Agilent Technologies’ products, applications or services, please contact your local Agilent office. The complete list is available at:www.agilent.com/find/contactus
AmericasCanada (877) 894 4414 Brazil (11) 4197 3600Mexico 01800 5064 800 United States (800) 829 4444
AsiaPacificAustralia 1 800 629 485China 800 810 0189Hong Kong 800 938 693India 1 800 112 929Japan 0120 (421) 345Korea 080 769 0800Malaysia 1 800 888 848Singapore 1 800 375 8100Taiwan 0800 047 866Other AP Countries (65) 375 8100
Europe&MiddleEastBelgium 32 (0) 2 404 93 40 Denmark 45 45 80 12 15Finland 358 (0) 10 855 2100France 0825 010 700* *0.125 €/minuteGermany 49 (0) 7031 464 6333 Ireland 1890 924 204Israel 972-3-9288-504/544Italy 39 02 92 60 8484Netherlands 31 (0) 20 547 2111Spain 34 (91) 631 3300Sweden 0200-88 22 55United Kingdom 44 (0) 118 927 6201For other unlisted countries: www.agilent.com/find/contactusRevised: January 6, 2012
Product specifications and descriptions in this document subject to change without notice.
© Agilent Technologies, Inc. 2013Published in USA, February 27, 20135991-1923EN
www.agilent.com/find/myagilentA personalized view into the information most relevant to you.
myAgilentmyAgilent
www.agilent.com/quality
Agilent Advantage Services is committed to your success throughout your equip-ment’s lifetime. To keep you competitive, we continually invest in tools and processes that speed up calibration and repair and reduce your cost of ownership. You can also use Infoline Web Services to manage equipment and services more effectively. By sharing our measurement and service expertise, we help you create the products that change our world.
www.agilent.com/find/advantageservices