workshop report - cbd · the report of the workshop will be submitted to the secretariat of the cbd...
TRANSCRIPT
UNEP/WCMC/Post-2010/0709/10
Support for the workshop provided by the following:
International Expert Workshop on the 2010 Biodiversity
Indicators and Post-2010 Indicator Development
A workshop convened by the UNEP World Conservation Monitoring Centre (UNEP-WCMC)
In cooperation with the Secretariat of the Convention on Biological Diversity (SCBD)
Hosted by the UK Department for Environment, Food and Rural Affairs (Defra), with funding provided by the
European Commission (EC), the UK Joint Nature Conservation Committee (JNCC), and the United Nations
Environment Programme (UNEP)
Innovation Centre, Reading, United Kingdom of Great Britain and Northern Ireland
6-8 July 2009
Workshop Report
Post-2010 Biodiversity Indicators Workshop Report – Reading, UK, July 2009
Page | 2
TABLE OF CONTENTS
EXECUTIVE SUMMARY 3
INTRODUCTION 4
THE 2010 FRAMEWORK OF TARGETS AND INDICATORS AND THE
2010 BIODIVERSITY INDICATORS PARTNERSHIP 4
THE EMERGING POST-2010 AGENDA 6
BACKGROUND TO, AND PREPARATION FOR, THE WORKSHOP 7
PROGRAMME OF THE WORKSHOP 7
DISCUSSION 8
A. The development of the global 2010 biodiversity indicators 8
B. The uptake of biodiversity indicators at the regional scale 10
C. The uptake of biodiversity indicators at the national scale 11
D. Sufficiency of the 2010 biodiversity indicator set 12
E. Scientific rigour of the 2010 biodiversity indicator set 13
F. Policy relevance of the 2010 biodiversity indicator set 14
G. Communication of the 2010 biodiversity indicator set 15
SUMMARY OF KEY LESSONS 15
A. Framework logic and content 16
B. Indicator development 16
C. Communication 16
CONCLUSIONS AND RECOMMENDATIONS 17
A. Principal recommendations for the post-2010 targets and indicators 17
B. Additional recommendations and action points 18
C. Next steps 19
ANNEXES
1. Additional action points raised at the workshop 20
2. Proposed revised indicator framework 23
3. List of participants 30
4. Workshop agenda 35
5. What do the 2010 biodiversity indicators tell us? 37
6. Comments compiled from the online stakeholder consultation 45
This report has been compiled by UNEP-WCMC, with the input of all participants. Suggested citation:
UNEP-WCMC (2009) International Expert Workshop on the 2010 Biodiversity Indicators and
Post-2010 Indicator Development. UNEP-WCMC, Cambridge, UK, 65 pages.
For further information please contact:
Dr Matt Walpole, UNEP-WCMC, 219c Huntingdon Rd, Cambridge CB3 0DL, UK
Tel: +44 (0)1223 277314. Email: [email protected]
Post-2010 Biodiversity Indicators Workshop Report – Reading, UK, July 2009
Page | 3
EXECUTIVE SUMMARY
In 2010, Parties to the Convention on Biological Diversity (CBD) will review the extent to which progress has
been made in meeting the global biodiversity target, and will develop a new, post-2010 strategic plan and
associated target(s). Progress towards the 2010 target is being tracked using a framework of indicators and the
extent to which policy-makers and society will be able to assess their achievements, and identify suitable
responses, is largely dependent upon the information provided by such indicators.
In July 2009, the Secretariat of the Convention on Biological Diversity (SCBD) and the UN Environment
Programme-World Conservation Monitoring Centre (UNEP-WCMC) jointly convened a meeting to review the
use and effectiveness of the 2010 biodiversity indicators and to consider the implications for the development
of post-2010 targets and indicators. The meeting was hosted by the UK Department for Environment, Food
and Rural Affairs (Defra), whilst additional financial support was provided by UNEP, the European Commission
(EC) and the UK Joint Nature Conservation Committee (JNCC). The workshop brought together over 70
participants including government nominated experts and representatives of biodiversity-related conventions,
UN agencies, academic and research institutions and other relevant international, intergovernmental and non-
governmental organizations.
The meeting crafted a series of recommendations of which the following were voted the most important:
A. A small set (10-15) of broad headline indicators, clearly linked to the main target and sub-targets and
underscored by more specific sub-indicators/ measures, should be maintained/ developed, in order to
communicate the indicator set through key storylines and clear, policy relevant messages, while
maintaining a flexible framework to cater for national/ regional needs.
B. The current framework of global indicators should be modified and simplified into four ‘focal areas’:
Threats to Biodiversity; State of Biodiversity; Ecosystem services; and Policy Responses. Existing indicators
should be re-aligned with the new framework, as appropriate, in order to maintain continuity and
enhance their use. The relationships between the focal areas and between indicators and targets should
be clearly explained and documented, including their scientific basis and assumptions.
C. Some additional measures on threats to biodiversity, status of diversity, ecosystem extent and condition,
ecosystem services and policy responses should be developed to provide a more complete and flexible set
of indicators to monitor progress towards a post-2010 target and to clearly link actions and biodiversity
outcomes to benefits for people.
D. National capacity for framework application, indicator development, data collection and information
management should be further developed and properly resourced in order to strengthen countries’ ability
to develop, monitor and communicate indicators in a participatory, sustained and integrated way and to
link with other processes, such as multilateral environmental agreements, at all levels.
E. Priority must be given to developing a communication strategy for the post-2010 targets and indicators in
order to inform policy discussions and ensure effective communication of messages coming from the
indicators into all sectors (including delivering stories relevant to human well-being, identifying
champions, promoting a regular reporting process, etc).
F. A flexible and inclusive process/ partnership for post-2010 indicator development should be maintained
and adequately resourced in order to increase collaboration in the development, quality control,
implementation and communication of indicators at all levels, including the sharing of experience and the
building of capacity.
A series of additional recommendations and action points were also captured. The report of the workshop will
be submitted to the Secretariat of the CBD for inclusion as an information document at SBSTTA-14, and as a
contribution to other events in the process of developing a post-2010 CBD strategic plan. The workshop is
expected to stimulate additional activities, including further elaboration of proposed indicator frameworks.
Post-2010 Biodiversity Indicators Workshop Report – Reading, UK, July 2009
Page | 4
INTRODUCTION
1. In 2010, Parties to the Convention on Biological Diversity (CBD) will review the extent to
which progress has been made in meeting the global biodiversity target, and to develop a new, post-
2010 strategic plan and associated target/s. Progress towards the 2010 target is being tracked using
a framework of indicators, and the extent to which policy-makers and society will be able to assess
their achievements, and identify suitable responses, is largely dependent upon the information
provided by such indicators.
2. In July 2009, the Secretariat of the Convention on Biological Diversity (SCBD) and the UNEP
World Conservation Monitoring Centre jointly convened a meeting to review the use and
effectiveness of the 2010 biodiversity indicators and to consider the implications for the
development of post-2010 targets and indicators. This is the report of that meeting. The meeting
was hosted by the UK Department for Environment, Food and Rural Affairs (Defra), whilst additional
financial support was provided by the United Nations Environment Programme (UNEP), the
European Commission (EC) and the UK Joint Nature Conservation Committee (JNCC). The workshop
brought together over 70 participants including Government nominated experts and representatives
of biodiversity-related conventions, UN agencies, academic and research institutions and other
relevant international, inter-governmental and non-governmental organizations. A list of
participants is provided in annex 3.
THE 2010 FRAMEWORK OF TARGETS AND INDICATORS AND THE 2010 BIODIVERSITY
INDICATORS PARTNERSHIP
3. At its sixth meeting in 2002, the Conference of the Parties (COP) to the Convention on
Biological Diversity (CBD) adopted a Strategic Plan, with the mission ‘to achieve, by 2010, a
significant reduction of the current rate of biodiversity loss at the global, regional and national level,
as a contribution to poverty alleviation and to the benefit of all life on Earth’ (decision VI/26). This
2010 target was subsequently endorsed by the Heads of State and Government at the 2002 World
Summit on Sustainable Development (WSSD) in Johannesburg, South Africa, and was incorporated
as a new target under the Millennium Development Goals (Target 7b).
4. Although indicators for biodiversity had been considered in the Convention since the second
meeting of the COP in 1995, it was only at the seventh meeting of the COP in 2004, that global
indicators were first identified. At that meeting, the COP developed a framework of goals and
targets, and identified provisional indicators within a set of seven focal areas for evaluating
biodiversity status and trends (decision VII/30) in order to assess progress towards the 2010
biodiversity target. Based on the findings of an Ad Hoc Technical Expert Group, the CBD Subsidiary
Body on Scientific, Technical and Technological Advice (SBSTTA) reviewed the use of the indicators
and further developed the set of indicators (recommendation X/5). Subsequently, the COP, at its
eighth meeting in 2006, further refined the 2010 indicators and allocated them to the targets under
each goal (decision VIII/15) (Table 1).
Post-2010 Biodiversity Indicators Workshop Report – Reading, UK, July 2009
Page | 5
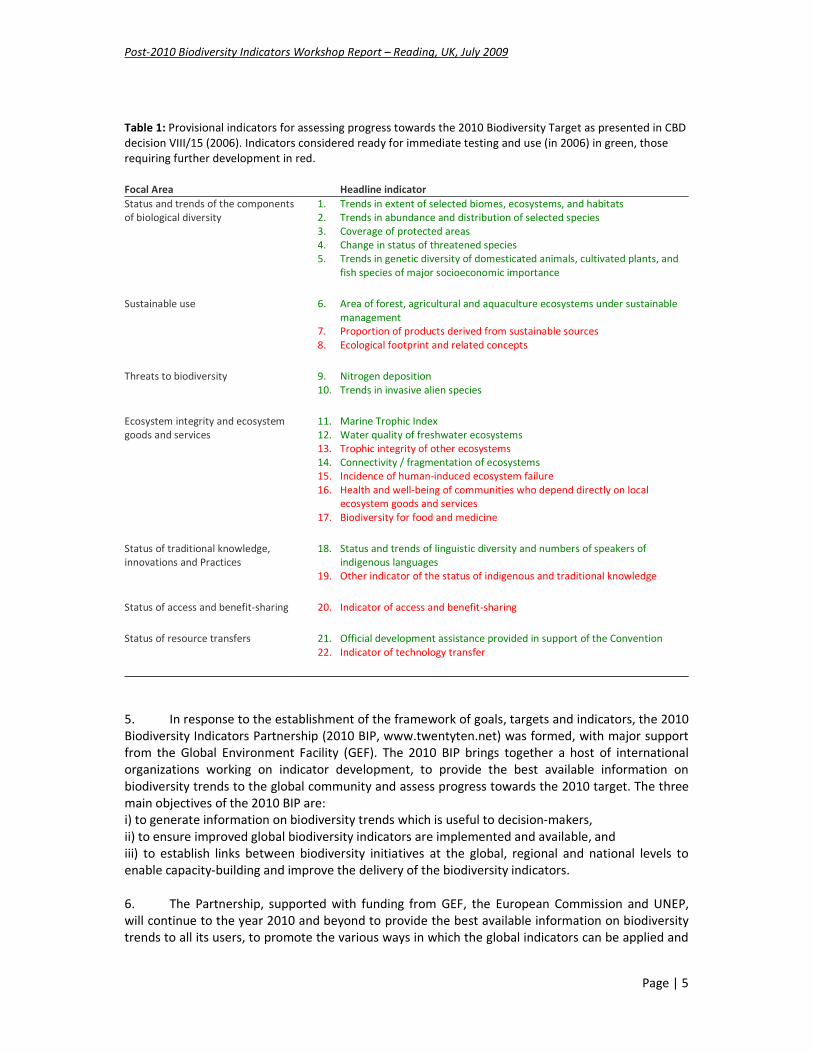
Table 1: Provisional indicators for assessing progress towards the 2010 Biodiversity Target as presented in CBD
decision VIII/15 (2006). Indicators considered ready for immediate testing and use (in 2006) in green, those
requiring further development in red.
Focal Area Headline indicator
Status and trends of the components
of biological diversity
1. Trends in extent of selected biomes, ecosystems, and habitats
2. Trends in abundance and distribution of selected species
3. Coverage of protected areas
4. Change in status of threatened species
5. Trends in genetic diversity of domesticated animals, cultivated plants, and
fish species of major socioeconomic importance
Sustainable use 6. Area of forest, agricultural and aquaculture ecosystems under sustainable
management
7. Proportion of products derived from sustainable sources
8. Ecological footprint and related concepts
Threats to biodiversity 9. Nitrogen deposition
10. Trends in invasive alien species
Ecosystem integrity and ecosystem
goods and services
11. Marine Trophic Index
12. Water quality of freshwater ecosystems
13. Trophic integrity of other ecosystems
14. Connectivity / fragmentation of ecosystems
15. Incidence of human-induced ecosystem failure
16. Health and well-being of communities who depend directly on local
ecosystem goods and services
17. Biodiversity for food and medicine
Status of traditional knowledge,
innovations and Practices
18. Status and trends of linguistic diversity and numbers of speakers of
indigenous languages
19. Other indicator of the status of indigenous and traditional knowledge
Status of access and benefit-sharing 20. Indicator of access and benefit-sharing
Status of resource transfers 21. Official development assistance provided in support of the Convention
22. Indicator of technology transfer
5. In response to the establishment of the framework of goals, targets and indicators, the 2010
Biodiversity Indicators Partnership (2010 BIP, www.twentyten.net) was formed, with major support
from the Global Environment Facility (GEF). The 2010 BIP brings together a host of international
organizations working on indicator development, to provide the best available information on
biodiversity trends to the global community and assess progress towards the 2010 target. The three
main objectives of the 2010 BIP are:
i) to generate information on biodiversity trends which is useful to decision-makers,
ii) to ensure improved global biodiversity indicators are implemented and available, and
iii) to establish links between biodiversity initiatives at the global, regional and national levels to
enable capacity-building and improve the delivery of the biodiversity indicators.
6. The Partnership, supported with funding from GEF, the European Commission and UNEP,
will continue to the year 2010 and beyond to provide the best available information on biodiversity
trends to all its users, to promote the various ways in which the global indicators can be applied and

Post-2010 Biodiversity Indicators Workshop Report – Reading, UK, July 2009
Page | 6
communicated, and to support uptake of the indicators at national and regional levels. The eighth
meeting of the COP in 2006 noted ‘the progress made in establishing the 2010 Biodiversity Indicators
Partnership’ (decision VIII/15).
7. Indicators have been discussed and developed in some of the other biodiversity-related
conventions as well. The Ramsar Convention on Wetlands, at the ninth meeting of its COP in 2005,
developed an initial set of eight ecological outcome-oriented indicators for assessing the
effectiveness of selected aspects of the Convention’s implementation (the so-called first tranche of
indicators) (resolution IX.1). The tenth meeting of the COP in 2008, through resolution X.10,
requested the Scientific and Technical Review Panel (STRP) to operationalise the first tranche and to
develop a second tranche of indicators.
8. In Resolution 8.7, the eighth meeting of the Conference of the Parties to the Convention on
Migratory Species (CMS) requested the CMS Secretariat and the Scientific Council to continue
working towards the adoption of suitable indicators to measure the achievement of the 2010 Target.
Two existing indices were selected as a basis for further work towards developing specific indicators
for migratory species: the IUCN Red List Index and the Living Planet Index.
9. Through decision 14.1, the Conference of the Parties to the Convention on International
Trade in Endangered Species of Wild Fauna and Flora (CITES) requested the Standing Committee to
develop indicators for each of the objectives contained in the CITES Strategic Vision 2008-2013,
based upon the work of the Strategic Vision Working Group convened at COP 14 (2007).
Subsequently, the Standing Committee, at its 57th meeting in 2008, adopted a set of indicators for
the objectives of the CITES Strategic Vision 2008-2013.
THE EMERGING POST-2010 AGENDA
10. The ninth meeting of the CBD COP, in 2008, recalled COP decision VIII/15, in which the COP
had decided to consider at its ninth meeting the process for revising and updating the Strategic Plan,
with a view to adopting a revised Strategic Plan at its tenth meeting. The COP requested the Working
Group on Review of Implementation (WGRI) to draft a revised and updated Strategic Plan, including
a revised biodiversity target, for the period 2011-2022 (decision IX/9). WGRI was requested to draw
upon an examination, to be undertaken by SBSTTA, of the outcome-oriented goals and targets and
associated indicators, with a view to recommending adjustments.
11. In preparation for the task for SBSTTA and WGRI, the Secretariat invited Parties and
organizations to submit views on the updating and revision of the Strategic Plan. In addition, the
Secretariat established an electronic forum on the same subject. The third meeting of WGRI as well
as the 14th meeting of SBSTTA, which will undertake the tasks requested by COP 9, are both
scheduled for May 2010. They are expected to adopt recommendations for COP 10, which is
scheduled for October 2010.
12. As Parties to the CBD begin to consider revisions to the Strategic Plan, there is a question as
to whether, and to what extent, the current biodiversity indicator framework should be extended or
modified, or whether a completely new set of indicators will be required. This technical expert
workshop has been organised to assist the CBD in answering this question. It is anticipated,
therefore, that the results of this expert workshop will inform both the SBSTTA and WGRI
discussions in May 2010 as well as other upcoming international dialogues on the post-2010 target.
Post-2010 Biodiversity Indicators Workshop Report – Reading, UK, July 2009
Page | 7
BACKGROUND TO, AND PREPARATION FOR, THE WORKSHOP
13. The need for the workshop was identified during a 2010 BIP meeting hosted by the CBD
Secretariat in Montreal in June 2008. The CBD Secretariat suggested that UNEP-WCMC, as part of its
support to GBO-3, undertake an 'analysis of the use and effectiveness of the indicators and sub
indicators in the 2010 framework and recommendations for post-2010 targets and indicators'. In
discussion with the CBD Secretariat it was proposed that this would involve a review, consultation
and expert stakeholder workshop on the science and use of the biodiversity indicators in the context
of the 2010 target, implemented and convened by UNEP-WCMC during 2009, with a view to
preparing a report for the CBD secretariat and SBSTTA 14 to support the revision of the CBD
Strategic Plan.
14. Prior to the workshop, a review and consultation process was undertaken to provide
background information and highlight key points for discussion at the workshop. A report of the
review and consultation process was prepared by UNEP-WCMC, including discussion of i) the
development of the 2010 biodiversity indicators, ii) the national use of biodiversity indicators, and iii)
the views of biodiversity stakeholders regarding the 2010 indicators and the post-2010 indicator
framework.
15. Three sources of evidence were used in the review:
a. The ongoing progress reports and submissions to the CBD for the third edition of the
Global Biodiversity Outlook (GBO-3) from the 2010 BIP Key Indicator Partners
responsible for delivering the 2010 indicators at a global scale. This provided the most
up-to-date picture of the status of development of the full suite of biodiversity indicators
together with an overview of current trends revealed by the indicators.
b. An analysis of the reporting of indicators in the CBD 3rd National Reports (3NR, 2005,
146 Parties submitted) and 4th National Reports (4NR, 2009, 45 Parties submitted as of
15 June 2009) using data publicly available on the CBD website. The CBD report analyser
(www.cbd.int/reports/analyzer.shtml) was used where appropriate, together with a
more in-depth reviewing and cross-referencing of the content of individual Party’s
reports.
c. An online stakeholder consultation undertaken by UNEP-WCMC from 16 March to 16
May 2009. A notification to CBD Parties by the Executive Secretary drew their attention
to the consultation, and an invitation to contribute was widely circulated among
biodiversity stakeholders. A total of 119 responses, equally spread between
governmental, academic, intergovernmental, non-governmental, and commercial
sectors, were collected using a web-based survey. Questions aimed to address the
following four themes regarding the 2010 biodiversity indicators: sufficiency, scientific
rigour, policy-relevance and communication. Respondents were also asked for their
views on possible amendments and additions for a post-2010 indicator framework.
Open questions provided respondents the opportunity to submit their own thoughts and
comments.
PROGRAMME OF THE WORKSHOP
16. The overall objective of the workshop was to review the use and effectiveness of the 2010
biodiversity indicators with a view to providing guidance for the development of a robust post-2010
indicators framework. Specifically, the workshop considered:

Post-2010 Biodiversity Indicators Workshop Report – Reading, UK, July 2009
Page | 8
a. Whether the set of 2010 indicators are sufficient to provide information on achieving
the CBD 2010 goals and targets;
b. The extent to which the set of 2010 indicators are scientifically rigorous, logical and
comprehensive;
c. The extent to which the 2010 indicators have been policy-relevant and taken up by the
policy community;
d. Whether the 2010 indicators are being communicated effectively individually and in
combination;
e. The need, from a technical perspective, for revised targets and indicators post-2010 and
their possible structure; and
f. The different needs and capacities for development and application of indicators at the
global, regional and national scales.
17. The workshop was expected to produce an output document, containing a critical evaluation
of the 2010 biodiversity indicators framework and recommendations for the development of
indicators for the post-2010 regime. The output document will inform the third edition of the Global
Biodiversity Outlook, in particular the chapter on status and trends of biodiversity. It will also be
made available to SBSTTA 14 and WGRI 3, with a view to informing the consideration of the post-
2010 biodiversity target and indicators. Through SBSTTA and WGRI, the workshop will inform the
10th meeting of the CBD COP.
18. Following a half-day session to introduce participants to the aims of the meeting and provide
a focus and context of the key issues for discussion, the greater part of the meeting was devoted to
discussions in four working groups focused around four key themes: sufficiency, scientific rigour,
policy relevance and communication. On day 1 the workshop identified the lessons learned from the
current 2010 indicator framework. On days 2 and 3 the workshop discussed the possible structure of
a global post-2010 indicator framework and developed a series of recommendations. This report is
based on the outcomes of the working group discussions, as well as key issues that emerged from
the plenary presentations and discussions. A copy of the agenda is presented in annex 4.
DISCUSSION
19. The discussions in the working groups on day 1 yielded a range of perspectives and lessons
from the 2010 indicators process for each of the four working group themes (sufficiency, scientific
rigour, policy relevance and communication), and these are reflected here after some initial
perspectives on progress at the global, regional and national scales taken from the background
review and the plenary presentations on the morning of day 1. The discussion of post-2010
recommendations on days 2 and 3 yielded some overlap between the working groups, and so these
recommendations were re-grouped in plenary into four key issues (target, framework, indicators
and process). The presentation of these discussions and recommendations in this report reflects this
re-grouping.
A. The development of the global 2010 biodiversity indicators
20. Since CBD COP decision VIII/15 and the establishment of the 2010 BIP, progress has been
made in developing the global biodiversity indicators. Of those considered ready for testing and use,
all have developed further in terms of data coverage and updating. Of the nine headline indicators
Post-2010 Biodiversity Indicators Workshop Report – Reading, UK, July 2009
Page | 9
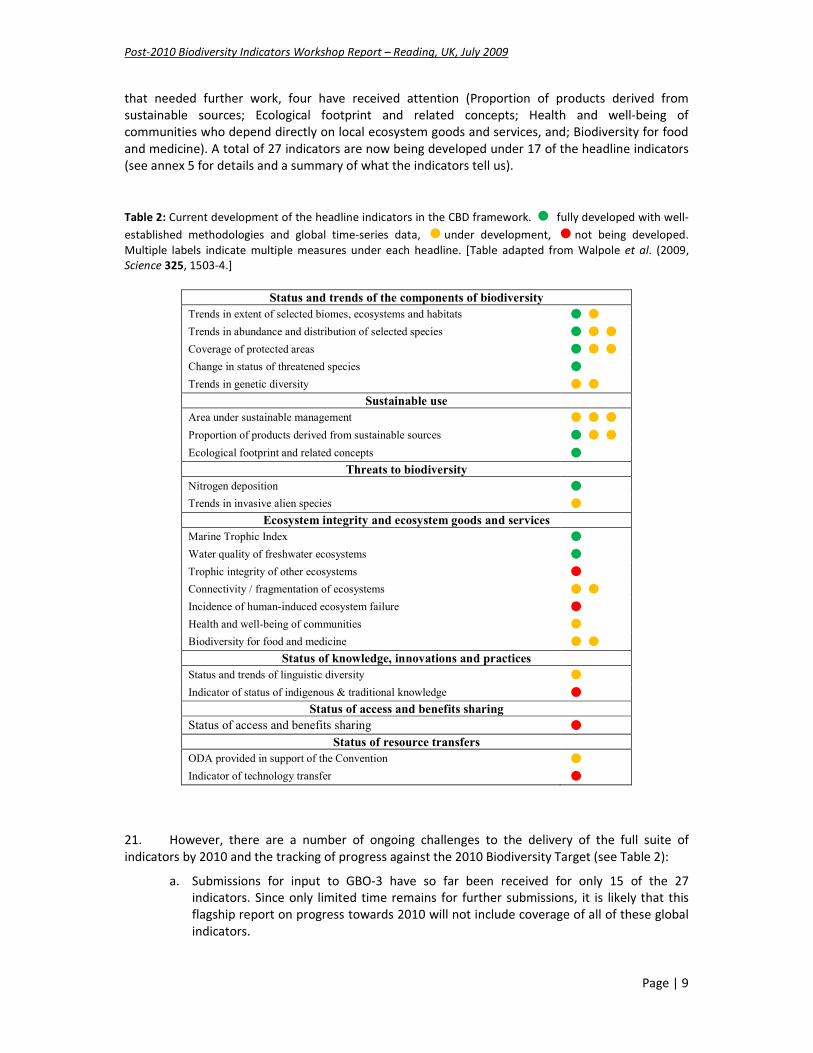
that needed further work, four have received attention (Proportion of products derived from
sustainable sources; Ecological footprint and related concepts; Health and well-being of
communities who depend directly on local ecosystem goods and services, and; Biodiversity for food
and medicine). A total of 27 indicators are now being developed under 17 of the headline indicators
(see annex 5 for details and a summary of what the indicators tell us).
Table 2: Current development of the headline indicators in the CBD framework. � fully developed with well-
established methodologies and global time-series data, �under development, �not being developed.
Multiple labels indicate multiple measures under each headline. [Table adapted from Walpole et al. (2009,
Science 325, 1503-4.]
Status and trends of the components of biodiversity Trends in extent of selected biomes, ecosystems and habitats �� Trends in abundance and distribution of selected species ��� Coverage of protected areas ��� Change in status of threatened species � Trends in genetic diversity ��
Sustainable use Area under sustainable management ��� Proportion of products derived from sustainable sources ��� Ecological footprint and related concepts �
Threats to biodiversity Nitrogen deposition � Trends in invasive alien species �
Ecosystem integrity and ecosystem goods and services Marine Trophic Index � Water quality of freshwater ecosystems � Trophic integrity of other ecosystems � Connectivity / fragmentation of ecosystems �� Incidence of human-induced ecosystem failure � Health and well-being of communities � Biodiversity for food and medicine ��
Status of knowledge, innovations and practices Status and trends of linguistic diversity � Indicator of status of indigenous & traditional knowledge �
Status of access and benefits sharing Status of access and benefits sharing �
Status of resource transfers ODA provided in support of the Convention � Indicator of technology transfer �
21. However, there are a number of ongoing challenges to the delivery of the full suite of
indicators by 2010 and the tracking of progress against the 2010 Biodiversity Target (see Table 2):
a. Submissions for input to GBO-3 have so far been received for only 15 of the 27
indicators. Since only limited time remains for further submissions, it is likely that this
flagship report on progress towards 2010 will not include coverage of all of these global
indicators.
Post-2010 Biodiversity Indicators Workshop Report – Reading, UK, July 2009
Page | 10
b. Five headline indicators are not receiving any attention under the 2010 BIP (Trophic
integrity of other ecosystems; Incidence of human-induced ecosystem failure; Other
indicators of the status of indigenous and traditional knowledge; Indicator of access and
benefit-sharing, and; Indicator of technology transfer). One of the seven focal areas
(Status of access and benefit-sharing) has no indicators under development.
c. Many of the indicators have patchy coverage, either geographically or in terms of
content. For example, the data within relatively well-developed species indicators tend
to be biased towards certain taxonomic groups. Likewise comprehensive global data on
the extent of very few ecosystems other than forests is available.
d. For indicators compiled from sub-global (often national) datasets, data consistency
across different sources can be an issue.
e. Due in part to time and resource constraints, most of the indicators being developed
within the 2010 framework are being compiled from existing datasets which may not
have been collected or compiled for tracking biodiversity change, and which are
therefore imperfect proxies.
f. Few of the global indicators have been subjected to independent and transparent peer
review.
B. The uptake of biodiversity indicators at the regional scale
22. In CBD decision VII/30 on future evaluation of progress of the implementation of the
Strategic Plan, it was considered that the biodiversity indicators should be identified and developed
in such a way as to be usable at global, regional, national and local levels, where so desired by
Parties. A number of regional indicator initiatives have since been established to promote indicator
monitoring and reporting, the most developed of which is the European initiative Streamlining
European Biodiversity Indicators for 2010 (SEBI 2010).
23. A presentation on the progress and lessons from the SEBI 2010 process was delivered at the
workshop. The aim of this initiative is to develop a European set of biodiversity indicators, drawing
on the CBD set, to assess and inform about progress towards the European 2010 targets. SEBI 2010
does not create new monitoring or reporting obligations for countries, but tries to ensure
consistency between biodiversity indicator sets at national and international levels. SEBI 2010 relies
on the contribution of more than 120 experts from across the region and from international
intergovernmental organisations and NGOs.
24. The SEBI 2010 initiative was considered a breakthrough – agreeing on a small suite of
indicators that collectively helps countries to monitor progress towards a common biodiversity
target. It was recognised that the transparent way in which the indicators were chosen, and the
multi-stakeholder engagement in that process, was very positive. Ensuring national buy-in, and
relevance to the national level, was key to this success. Several of the 26 indicators (chosen from a
pool of 70) are well-developed and a comprehensive progress report has been presented in 2009.
However some challenges remain, which are likely to be relevant to other regional initiatives:
a. Geographic coverage is patchy, or biased towards certain countries
b. Some focal areas are underrepresented, as are some taxonomic groups within the focal
area of components of biodiversity
c. Dataflow between countries and the regional overview can be limited – this needs
Post-2010 Biodiversity Indicators Workshop Report – Reading, UK, July 2009
Page | 11
stronger links with countries
d. The indicators were mostly based on existing datasets, and were not specifically
designed to track progress towards the target
e. It was difficult to assess policy performance (no baseline).
C. The uptake of biodiversity indicators at the national scale
25. In CBD decision VII/30 it was recognised that the application of a universal common
indicator suite at national level would in many cases aid the compilation of global indicators.
However it was also recognised that the framework of goals, targets and indicators would be a
flexible framework that could and should be tailored to specific national priorities. Thus Parties were
invited to use or develop their own national indicators that would be most relevant to national
priorities. As a result, global and national indicator processes are not fully aligned.
26. A review of the available 3rd and 4th National Reports to the CBD suggests that national
indicators have been adopted using the CBD framework as a guide, but designed to fit the specific
context of the individual country. There is widespread recognition of the importance of national
indicators and reference is made in both 3rd and 4th National Reports to a very wide range of
indicators These span all seven focal areas, although overall there is a greater reference to indicators
under three focal areas: status and trends of the components of biodiversity; threats to biodiversity,
and; ecosystem integrity and ecosystem goods and services.
27. A more detailed review of the currently available 4th National Reports suggests that:
a. Parties are in different stages as far as the use of national indicators to specifically
measure progress towards the 2010 target is concerned. Some indicated that they do
not have national indicators; some indicated that indicators are being developed, some
mentioned indicators in their report but no further detail or data were provided, some
alluded to indicators in the report and presented information showing trends in status of
biodiversity and ecosystems. Few Parties provided evidence-based reports.
b. Nine Parties (21% of the sample) mentioned they have not developed national
biodiversity indicators. Reasons for this include a lack of administrative and technical
capacity, inadequate funding available to the government, and political instability
meaning routinely monitoring indicators was not feasible.
c. The majority of Parties listed indicators that were in development. Quantitative
indicator data was not often presented as evidence of change. Some Parties used simple
(qualitative) scoring to show if there has been progress, no change or negative trends
with regard to specific global 2010 indicators.
d. The majority of developing countries blamed their failure to routinely apply indicators
on lack of capacity, lack of consistent trend data, absence of ecological baselines against
which change is measured and lack of established monitoring systems. “Marginalisation”
of environmental ministries and limited knowledge on the definition of indicators to
measure progress towards the 2010 CBD target also hinders progress.
e. Although there is often a vast body of data available on various aspects of biodiversity
many of the data sets are “one-off” studies, often covering only a portion of a country.
As a result, it has been a challenge to find ways of integrating different data sets and
making them comparable to produce time series statistics.
f. A lack of institutional responsibility and accountability for biodiversity survey and
Post-2010 Biodiversity Indicators Workshop Report – Reading, UK, July 2009
Page | 12
monitoring makes it very difficult for some countries to establish and verify biodiversity
trends. Data ownership and management were common problems. Many government
institutions “do not have data management structures in place so that data and
information is often ‘person-bound’ rather than ‘institution-bound’” (quote taken from
one 4th National Report).
g. Sustaining good biodiversity monitoring systems over time is a major challenge in some
cases, particularly after donors exit.
28. A presentation on the experience of Brazil in developing national biodiversity indicators
showed it has made significant progress including the creation of a series of quantifiable national
targets, and there are monitoring systems in place for specific areas. It emphasised the
importance of both national and sub-national indicators to ensure most relevance to policy
makers and to have the greatest policy impact within a country. However, challenges to national
level indicator development include:
a. A lack of long-term baseline data
b. Insufficient knowledge of natural variation in ecosystems resulting in a difficulty in
interpreting trends
c. Insufficient knowledge to be able to link causes to effects
d. A lack of understanding by the public and policy-makers of links between biodiversity
and ecosystem goods and services, among other uncertainties
e. Different resolutions of data, and difficulties in reconciling data from a wide range of
different sources – official versus non official sources, federal versus state agency, NGO,
public versus private data
f. Differences in reporting across a range of national, regional and global reporting
initiatives
D. Sufficiency of the 2010 biodiversity indicator set
29. In answer to the online consultation question “Is the set of 2010 Indicators sufficient to
provide information on achieving the CBD 2010 Goals and Targets?” 35% of respondents said the
indicators were sufficient, and 65% said they were insufficient. Respondents commented on (i) a lack
of evenness in indicator coverage across the framework focal areas, (ii) a lack of baseline and (iii) a
lack of data. Those who were more positive highlighted the lack of data as inevitable and
emphasised the need for more systematic data collection. Several suggestions for additional
indicators were proposed. A selection of respondents’ comments on this question is included in
annex 6.
30. The ‘sufficiency’ working group at the workshop felt that the indicator set was sufficient in
its design (as a tool for tracking progress against CBD sub-targets) but not in its implementation
(which has been under-developed and in which the focus has shifted from sub-targets to the overall
2010 biodiversity target), although there was considerable discussion of the meaning of sufficiency.
The topic of sufficiency also arose in other working groups. The key issues identified were:
a. The framework that we have to measure progress towards the 2010 target is poorly
understood and has not been well communicated. An important gap exists in
demonstrating how the indicators link to tell a story. For example, there is a disconnect

Post-2010 Biodiversity Indicators Workshop Report – Reading, UK, July 2009
Page | 13
in messages: status has been declining while processes are improving. The suite also
needs to be better linked to human well-being.
b. The current framework and indicators are heavily oriented towards the CBD objectives.
It was noted that the indicator suite aligns more directly with the sub-targets of the CBD
strategic plan than with the overall 2010 biodiversity target that they are now being
asked to measure progress against. The number of sub-targets and the lack of clear
logical links between the sub-targets and the overall 2010 biodiversity target make it
difficult to tell a coherent story.
c. The framework needs a clearer and better-documented logical structure, which could
usefully be based on an overarching conceptual framework such as the driver-pressure-
state-impact-response (DPSIR) framework, emphasising benefits to people separately.
d. The indicator set is particularly lacking in several areas: process indicators (e.g. access
and benefit sharing, technology transfer); sustainable use; threats; links to human well-
being; quality of ecosystems/biomes; indigenous and local knowledge, and; ecosystem
services. The lack of ecosystem service indicators was of particular note.
e. The taxonomic, ecosystem and geographic coverage of many indicators is incomplete.
Moreover, more attention to baselines is necessary and long term data are required.
f. Linkages between global/regional/national/local indicators need to be better
considered.
E. Scientific Rigour of the 2010 biodiversity indicator set
31. In answer to the online consultation question “To what extent is the set of 2010 Indicators
scientifically rigorous, logical and comprehensive?” 72% of respondents said they were logical, 62%
said they were comprehensive, but only 43% said they were scientifically rigorous. It was highlighted
that there has been limited communication of methodologies of the indicators to date, with notable
exceptions that are published in peer reviewed journals. Requests for peer review of all indicators
were made. A concern over the lack of a clear time-defined baseline and therefore criteria for
“success” was also raised. A selection of respondents’ comments on this question is included in
annex 6.
32. The scientific rigour working group identified the following challenges:
a. There is no clear process or criteria for evaluating scientific rigour, e.g. peer review is not
universal and is of variable standard, and assessment of certainty/ rigour is often lacking.
The indicators and their methodologies and metadata are not sufficiently described or
documented – publication of data could help.
b. Representativeness / adequacy of underlying data needs to be clarified and improved.
The majority view is captured in the following quote from the online consultation: “We
do not have meaningful indicators of biodiversity loss, now, at less than global and low
resolution, because THERE ARE NO DATA. Before trying to invent more indicators, lacking
data, we need to address the issue of why it is that developing countries mostly do not
monitor the components of biodiversity. Establish one steady, high-resolution monitoring
effort and then you can construct indicators on top of those data. No data, no existing
indicators, only theoretical lists of them”
c. Current indicators lack reference values and other ways of quantifying the significance of
Post-2010 Biodiversity Indicators Workshop Report – Reading, UK, July 2009
Page | 14
changes. One of the issues is that the 2010 biodiversity target is rather loosely defined,
without a clear baseline or success criteria – it is not a SMART (strategic, measurable,
achievable, realistic and time-bound) target, but rather an aspirational goal. The current
suite of global biodiversity indicators are not all designed for directly measuring progress
towards this target, but it would in any case be difficult to design indicators without a
more tightly framed target or sub-targets.
33. In considering future indicator development, the idea that a single (or small group of)
headline aggregate index would suffice was not favoured – such indices can be a useful
communications tool but for management and decision-making more detailed metrics are required.
Aggregate indicators also risk masking uncertainty. It was agreed that a smaller set of story-telling
’headline’ indicators was required on which to base communication efforts, whilst the focus of
development should be on a broader range of more specific measures or ‘sub-indicators’ for
monitoring and decision-making.
F. Policy relevance of the 2010 biodiversity indicator set
34. In answer to the online consultation question “To what extent have the 2010 Indicators
been useful and policy-relevant?” 74% of respondents said that the indicators were useful and 63%
said they were policy relevant. The responses were more positive in this theme than any other with
a majority of comments referring to the widespread use of biodiversity indicators by government
reporting mechanisms. In addition, it was suggested that the CBD indicator framework has drawn
much-needed attention to the lack of relevant data sets from which indicators can be calculated. A
selection of respondents’ comments on this question is included in annex 6.
35. The ‘policy relevance’ working group at the workshop first explored the question ‘what
makes indicators policy relevant?’ and identified the following characteristics: ability to inform
decision-makers whether progress is being made towards targets; ability to help link cause and
effect, thereby enabling decision-makers to take informed action; ability to hold decision-makers to
account, and; relevance to a range of sectors beyond biodiversity - the indicators should reflect the
utility of biodiversity to those who have impacts on it. Not all indicators will be relevant to all policy
makers, however the ability to disaggregate to the national level (and beyond?) is important to
reach the level at which many decisions are made. This is not currently possible with all of the global
indicators.
36. The group also noted that it is still very early to evaluate the policy relevance of the indicator
framework, that it was developed as a global framework but it was intended to be flexible to enable
national adoption, and that in many ways it reflects what was possible at the time rather than an
ideal solution. It was noted that there are growing efforts at the national level to develop indicators
in line with this framework, and as such that it has growing relevance to national level decision-
makers.
37. The group noted some positive outcomes of the indicator framework and its development,
namely its flexibility, its adoption at the political level, a focus on outcome indicators rather than
process, the use of the entire framework to communicate the concept of biodiversity, and the fact
that using evidence about changes in biodiversity has focused minds & spurred interest.
Post-2010 Biodiversity Indicators Workshop Report – Reading, UK, July 2009
Page | 15
38. However they also noted some challenges:
a. Many indicators are still being developed
b. It can be difficult to see the big picture / overall message when focusing on individual
indicators
c. Problems with policy makers (mis-)understanding biodiversity, and the framework
d. Lack of clarity on how indicators relate to each other and tell a coherent story
e. Mismatch between the development of targets & goals and the indicator framework
f. Involvement of other sectors is under-developed
g. Lack of common values of biodiversity between sectors means biodiversity indicators
have different meaning to those sectors
G. Effective communication of the 2010 biodiversity indicator set
39. In answer to the online consultation question “Are the 2010 indicators being communicated
effectively individually and in combination?” only a minority of respondents said that the indicators
were being effectively communicated individually (36%) and in combination (35%). The
overwhelming consensus is of a lack of communication, in particular outside of the scientific
community. A selection of respondents’ comments on this question is included in annex 6. These
highlight the view that public engagement and awareness of biodiversity indicators, both individually
and in combination, is currently deficient and in need of improvement.
40. The ‘communications’ working group at the workshop identified the following issues:
a. There was never any explicit mandate given by COP to communicate the indicators;
therefore no systematic communications effort was made.
b. Given weak datasets, there was little to communicate in the first place.
c. What communication took place was ad hoc, opportunistic, and possibly more focused
on reporting than communicating.
d. The nature of the audience will influence the content and delivery strategy of the
message.
e. Unless positive stories can be found we are asking governments to communicate on
their failures.
f. Indicators are a technical tool, designed for internal monitoring / reporting, not for
general public consumption. Scientific rigor could be sacrificed in focusing on messages
to the public. Yet at the same time if the public are not interested then neither will the
policy-makers be. This highlights the difference between headline indicators and more
detailed ‘sub-indicators’, and the need for both.
g. The absence of clear quantitative targets for indicators to track progress towards may be
a barrier to communication.
SUMMARY OF KEY LESSONS FROM THE 2010 BIODIVERSITY INDICATORS PROCESSES
41. The following are the summarised key lessons identified at the workshop after working
group discussions on the first day. They fall roughly into three categories: lessons regarding the
Post-2010 Biodiversity Indicators Workshop Report – Reading, UK, July 2009
Page | 16
framework (paragraphs 42-47), lessons regarding the indicators themselves (paragraphs 48-52), and
lessons regarding communication (paragraphs 53-55).
A. Framework logic and content
42. The flexibility of the framework, which enables its implementation at a variety of scales, has
facilitated its political adoption, which, in turn, has boosted support for developing the detail of the
indicators under the framework.
43. The framework is comprehensive, and can be mapped to other frameworks (such as DPSIR),
but there have been problems showing how it fits together to integrate the indicators into a
coherent story.
44. The framework is primarily structured around CBD priorities, but its relevance to other
sectors / MEA processes is less clear, thereby hindering its uptake and use, beyond the CBD.
45. The parallel development of the CBD targets and goals, and the indicator framework, has led
to a disconnect which was not intended.
46. The complexity of biodiversity, and of the framework, is a continuing problem in terms of
communicating to disparate audiences.
47. The current indicator set is incomplete in a number of areas; e.g. wild genetic resources,
ecosystem quality, ecosystem services, sustainable use, human well-being, ABS and indigenous local
knowledge, and both threats and responses more broadly.
B. Indicator development
48. There is a tension between scientific rigour and communicating the results of the indicators
to a variety of audiences. Both are needed.
49. Some indicators are well developed, but others are still under-developed (see Table 2)
50. The representativeness and adequacy of the data underlying the indicators needs to be
transparently documented, and their geographic / taxonomic / temporal coverage needs to be
improved.
51. Methods for assessing the significance of change, and distance to target are
underdeveloped.
52. There is no clear process or criteria for evaluating the scientific rigour of the indicators.
C. Communication
53. Focussing on outcomes has focussed minds and spurred engagement, but the absence of
clear targets and awareness raising is a barrier to arousing public interest.
54. The communication that has taken place has been ad-hoc, opportunistic, and more focussed
on reporting than a systematic effort to convey the lessons from the indicators; there is an especial
challenge of communicating ‘bad news’.
Post-2010 Biodiversity Indicators Workshop Report – Reading, UK, July 2009
Page | 17
55. Biodiversity means different things to different sectors – the messages from individual
indicators, and the set as a whole, do not take this fully into account.
CONCLUSIONS AND RECOMMENDATIONS
56. The choice of indicators for the post-2010 period will depend on the target(s) adopted by
the CBD. However these targets must be measurable, which in turn depends on our scientific
capability to develop and deliver the appropriate indicators to track progress. Thus, the
development of targets and indicators must be undertaken in tandem through an iterative process.
57. Without knowing exactly where the debate over post-2010 targets will lead, it is difficult to
make recommendations regarding specific indicators. However, the workshop did consider the kinds
of indicators that a generic indicator framework might encompass, building on the existing indicators
and taking account of the gaps identified. This is presented in annex 2, although this is a work in
progress; further work is anticipated to develop the content of this framework.
58. The two sections below present the unified recommendations and action points developed,
discussed and agreed during the workshop.
A. Principal recommendations for the post-2010 targets and indicators
59. The workshop crafted a series of recommendations of which the following were voted the
most important:
a. A small set of (10-15) broad headline indicators, clearly linked to the main target and
sub-targets and underscored by more specific sub-indicators/measures, should be
maintained/developed, in order to communicate the indicator set through key storylines
and clear, policy relevant messages, while maintaining a flexible framework to cater for
national/regional needs.
b. The current framework of global indicators should be modified and simplified into four
‘focal areas’: Threats to Biodiversity; State of Biodiversity; Ecosystem services, and;
Policy responses. Existing indicators should be re-aligned with the new framework, as
appropriate, in order to maintain continuity and enhance their use (see annex 2). The
relationships between the focal areas and between indicators and targets should be
clearly explained and documented, including their scientific basis and assumptions.
c. Some additional measures on threats to biodiversity, status of diversity, ecosystem
extent and condition, ecosystem services and policy responses should be developed in
order to provide a more complete and flexible set of indicators to monitor progress
towards a post-2010 target and to clearly link actions and biodiversity outcomes to
benefits for people.
d. National capacity for framework application, indicator development, data collection and
information management should be further developed and properly resourced in order
to strengthen countries’ ability to develop, monitor and communicate indicators in a
participatory, sustained and integrated way and to link with other processes, e.g. MEAs,
at all levels.

Post-2010 Biodiversity Indicators Workshop Report – Reading, UK, July 2009
Page | 18
e. Priority must be given to developing a communication strategy for the post-2010 targets
and indicators in order to inform policy discussions and ensure effective communication
of messages coming from the indicators into all sectors (including inter alia delivering
stories relevant to human well-being, identifying champions, promoting a regular
reporting process, etc).
f. A flexible and inclusive process/partnership for post-2010 indicator development should
be maintained and adequately resourced in order to increase collaboration in the
development, quality control, implementation and communication of indicators at all
levels, including the sharing of experience and the building of capacity.
B. Additional recommendations and action points
60. The following additional recommendations were made in relation to the target, the
framework, the indicators and the process:
a. The post-2010 target should take account of biodiversity, ecosystem services and human
well-being, recognising the linkages between them, in order to communicate effectively
and improve understanding of their interdependence.
b. The target timeframe should incorporate a long enough period required to improve the
state of biodiversity as well as interim milestones that satisfy the more rapid reporting
required for policy relevance.
c. The target should be formulated in terms of a level or change rather than rate of change
(e.g. maintain and restore levels rather than reduce the rate of loss), in order to facilitate
reporting and communication of all indicators.
d. Target-setting should take into account, but not be constrained by, data availability,
baselines and scales, in order to allow the development of meaningful indicators.
e. The process of indicator development should follow best available scientific practices
that would allow the development of a clear and credible set of indicators, and that each
indicator has a clearly documented, peer-reviewed, published methodology; with access
to underlying data; data quality control; subject to initial testing and periodic
independent review of results, in order to obtain meaningful, scientifically sound
indicator results.
f. Among existing indicators, those where there is little prospect of collecting data and
their continuing importance/relevance is low should be dropped, in order to focus the
use of limited financial and human resources.
g. Synergies in indicator use across MEAs should be sought, using the best available and
established information methods, networks and data sets, in order to streamline
reporting processes thereby increasing efficiency and cost effectiveness.
h. A high priority should be given to expanding the taxonomic, biome and geographic
coverage of existing indicators (especially biodiversity status indicators), e.g. through
increased funding of in-field data collection (and capacity building) especially in
biodiversity rich regions, through a coordinated global biodiversity monitoring strategy,
Post-2010 Biodiversity Indicators Workshop Report – Reading, UK, July 2009
Page | 19
in order to provide a more robust, reliable and representative assessment of the status
of biodiversity, threats to it, and actions being taken.
i. Indicators within the “threats” focal area should be expanded to include additional
direct and indirect drivers (or threats) as they apply or relate to biodiversity, ecosystem
services and human well being, taking advantage where possible of already collected
data (e.g. world bank, climate change etc). Such threat indicators should be closely
linked to appropriate biodiversity measures so that it can be clear to policy-makers how
actions to reduce threats affect biodiversity change.
j. Individual indicators should be capable of disaggregation, for example into functional
groups, taxonomic groups, biome and geographic areas in order to allow the
identification of trends and priorities for action at meaningful scales.
k. A wide ranging, but cost-effective process for review, (including independent inputs) of
the indicator suite, at appropriate intervals (taking account of the need for stability as
far as possible) should be adopted at the outset, to allow adaptation to new needs and
lessons learned from experience, in order to keep the indicators fit for purpose.
61. In addition, a range of action points were captured, but not discussed, during the final stages
of the workshop. These are listed in annex 1:
C. Next steps
62. This report of the workshop considerations and conclusions will be submitted to the
Secretariat of the CBD for inclusion as an information document at SBSTTA-14, and as a contribution
to other events in the process of developing a post-2010 CBD strategic plan. Its findings will also be
distributed more widely for use by other MEAs, by related initiatives (such as TEEB), and by regional
and national indicator processes.
63. The workshop is expected to stimulate additional follow-on activities, including further
development and elaboration of proposed indicator frameworks. As far as possible these will be
tracked by the 2010BIP Secretariat at UNEP-WCMC and reported through the 2010BIP website.

Post-2010 Biodiversity Indicators Workshop Report – Reading, UK, July 2009
Page | 20
Annex 1. ‘Actions’ captured in penultimate session in plenary hall:
‘Targets’:
1. Make available at SBSTTA and COP10 a summary on data constraints, availability, baseline and
scales for each headline indicator
2. Prepare a document on indicators currently being implemented at national and regional levels,
based on national reports, to be utilised at regional preparatory meetings for WGRI and COP10
3. National reports should include a new/permanent section on indicators which will form the basis
for decisions and actions at global level to support implementation at national and regional
levels (new mechanisms needed)
Other action-oriented notes from ‘target’ wall:
• Create a clear simple message – what does biodiversity do for you?
• Create opportunities to broadcast the message – e.g. press conferences, workshops,
internet
• Engage relevant communications professionals at CBD and national level
• Create a ‘brand’ for the biodiversity target
• We recommend clarifying the process involved in drafting the post-2010 target – including a
transparent roadmap to and through SBSTTA
‘Framework’:
1. SBSTTA/WGRI/other relevant processes, with support from the 2010BIP, leading up to COP10
should:
• map existing indicators to the new framework
• provide an explanation of how the revised framework will support tracking progress and
informing policy
• Formally recommend to COP to adopt the framework
2. The CBD secretariat should provide examples of indicators that countries can use, in addition to
or in place of the global indicators, in order to help countries identify and adopt locally available
and relevant indicators. As part of this, the indicators from a number of regions/countries should
be presented (as examples?) within the new framework
3. Leading up to the formulation of the new framework and adoption of revised indicators, the CBD
secretariat should integrate indicators and lessons from other MEAs, sectoral processes and
other parties:
• For human well-being indicators, through liaison with UNDP, PEI, etc
Post-2010 Biodiversity Indicators Workshop Report – Reading, UK, July 2009
Page | 21
• Utilise or catalyse the Biodiversity Liaison Group and intergovernmental processes to
provide knowledge of indicators being used in other MEAs and sectoral processes that
could populate the new elements of the framework
4. As part of capacity-building the CBD Secretariat should catalyse an electronic data tool to:
• Provide interactive information management for countries to upload documents and
data, present their indicators within the revised framework, and feed monitoring data
into policy processes.
• Support data sharing between MEAs to streamline reporting
• Provide a forum for exchanging expertise and experience in building national level
indicators, integrating indicators into other sectors, and ultimately populating them with
data
Other action-oriented notes from ‘framework’ wall:
• Form an expert group to develop the framework hand in hand with targets and indicators
• Urgent to have the framework and guidelines developed to transmit to Parties
‘Indicators’:
1. Form an expert group to review current indicators, recommend new ones and design a process
for testing, etc.
a. Who? CBD Secretariat/2010 BIP
b. When? When new target and strategy (almost) agreed
2. Review existing national indicators and ways in which to incorporate these in new expanded set.
a. Who? Above group
b. When? As soon as possible
c. During elaboration of new indicators, consideration should be given to those already
developed by other processes to reduce duplication and reporting burden
3. Raise awareness of targets and indicators at local, national and global levels
Other action-oriented notes from ‘indicator’ wall:
• Empower experts group to streamline indicators, based on their assessment of indicator
feasibility
• Share success stories of indicator usage
• Make data/information available and accessible to all interested parties
• The process to develop targets and indicators should allow for assessment of scientific rigour
of agreed targets, sub-targets and their indicators
• Create guidelines for implementing the headline indicators at regional and national levels
• Increase funding and capacity-building (especially in biodiversity-rich regions) to implement
the guidelines, including regional use.
Post-2010 Biodiversity Indicators Workshop Report – Reading, UK, July 2009
Page | 22
‘Process’:
1. (P2) The CBD Parties, through SBSTTA, to develop ToRs for an Indicator Review Process, involving
a range of stakeholders and (right holders?)
2. (P4) The CBD CEPA Informal Advisory Committee to provide guidance to the Executive Secretary
for the development of the post-2010 targets and indicators communications strategy
3. (P4) SBSTTA/WGRI to draft a communications strategy, incorporating the importance of the
framework for Parties, and in the longer term to communicate the results of the framework, and
making links to processes in other MEAs
4. (P4) COP10 to make provisions for sufficient funding for implementing the communications
strategy
5. (P5) 2010BIP to develop a plan for follow up, which could include:
• Draft decision for SBSTTA/WGRI/COP to mandate a continuation or revised future
partnership
• Options for future financing, e.g., further GEF funding (supported by COP request)
6. (P5)UNEP to establish a process to support coordination of indicator development across MEAs,
supported as appropriate by recommendations to GEF
7. (P5) Funding must be allocated inter alia to capacity building, governmental engagement, and
communication skills training among indicator developers
Additional action-oriented comments on ‘process’ wall:
• Convey local stories that are relevant to local people (P4)
• ‘Live’ widespread communication of indicator stories (P4)
• Create harmonised, consistent national messages across MEAs (P4)
• Nurture NGO-Govt dialogue at national level (P1 /P4)
• Build biodiversity knowledge amongst media and commercial sectors (P4)
Post-2010 Biodiversity Indicators Workshop Report – Reading, UK, July 2009
Page | 23
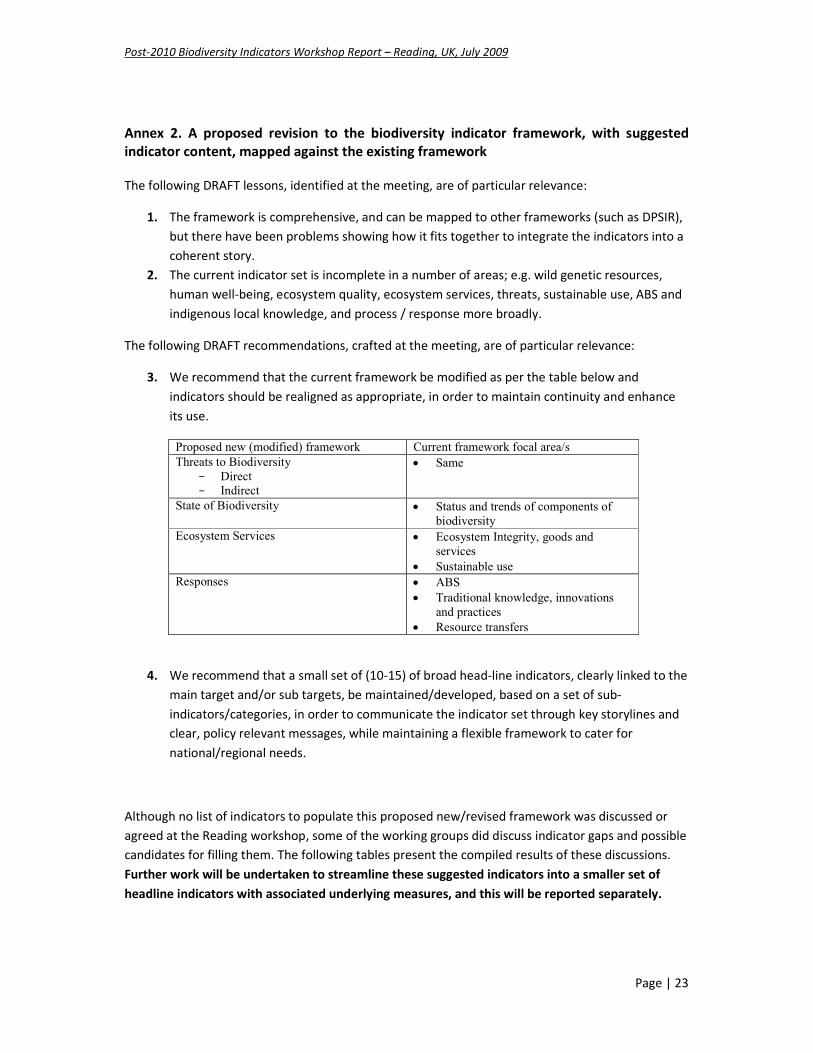
Annex 2. A proposed revision to the biodiversity indicator framework, with suggested
indicator content, mapped against the existing framework
The following DRAFT lessons, identified at the meeting, are of particular relevance:
1. The framework is comprehensive, and can be mapped to other frameworks (such as DPSIR),
but there have been problems showing how it fits together to integrate the indicators into a
coherent story.
2. The current indicator set is incomplete in a number of areas; e.g. wild genetic resources,
human well-being, ecosystem quality, ecosystem services, threats, sustainable use, ABS and
indigenous local knowledge, and process / response more broadly.
The following DRAFT recommendations, crafted at the meeting, are of particular relevance:
3. We recommend that the current framework be modified as per the table below and
indicators should be realigned as appropriate, in order to maintain continuity and enhance
its use.
Proposed new (modified) framework Current framework focal area/s
Threats to Biodiversity
- Direct
- Indirect
• Same
State of Biodiversity • Status and trends of components of
biodiversity
Ecosystem Services • Ecosystem Integrity, goods and
services
• Sustainable use
Responses • ABS
• Traditional knowledge, innovations
and practices
• Resource transfers
4. We recommend that a small set of (10-15) of broad head-line indicators, clearly linked to the
main target and/or sub targets, be maintained/developed, based on a set of sub-
indicators/categories, in order to communicate the indicator set through key storylines and
clear, policy relevant messages, while maintaining a flexible framework to cater for
national/regional needs.
Although no list of indicators to populate this proposed new/revised framework was discussed or
agreed at the Reading workshop, some of the working groups did discuss indicator gaps and possible
candidates for filling them. The following tables present the compiled results of these discussions.
Further work will be undertaken to streamline these suggested indicators into a smaller set of
headline indicators with associated underlying measures, and this will be reported separately.
Post-2010 Biodiversity Indicators Workshop Report – Reading, UK, July 2009
Page | 24
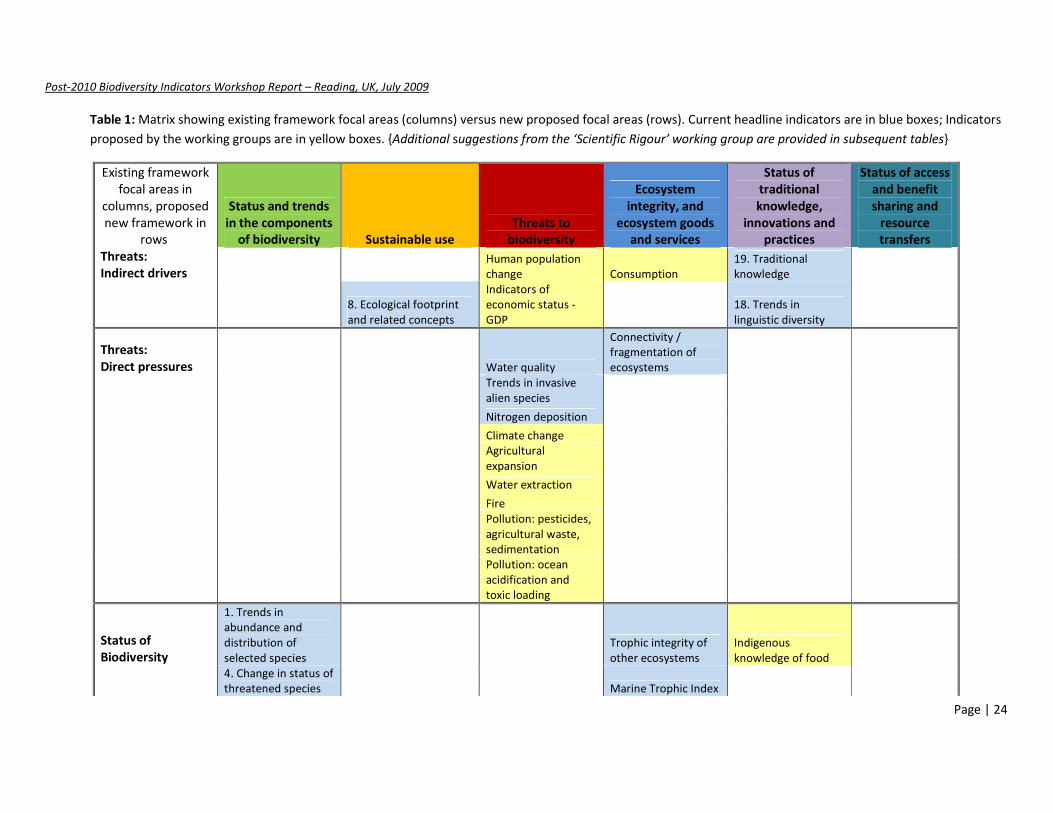
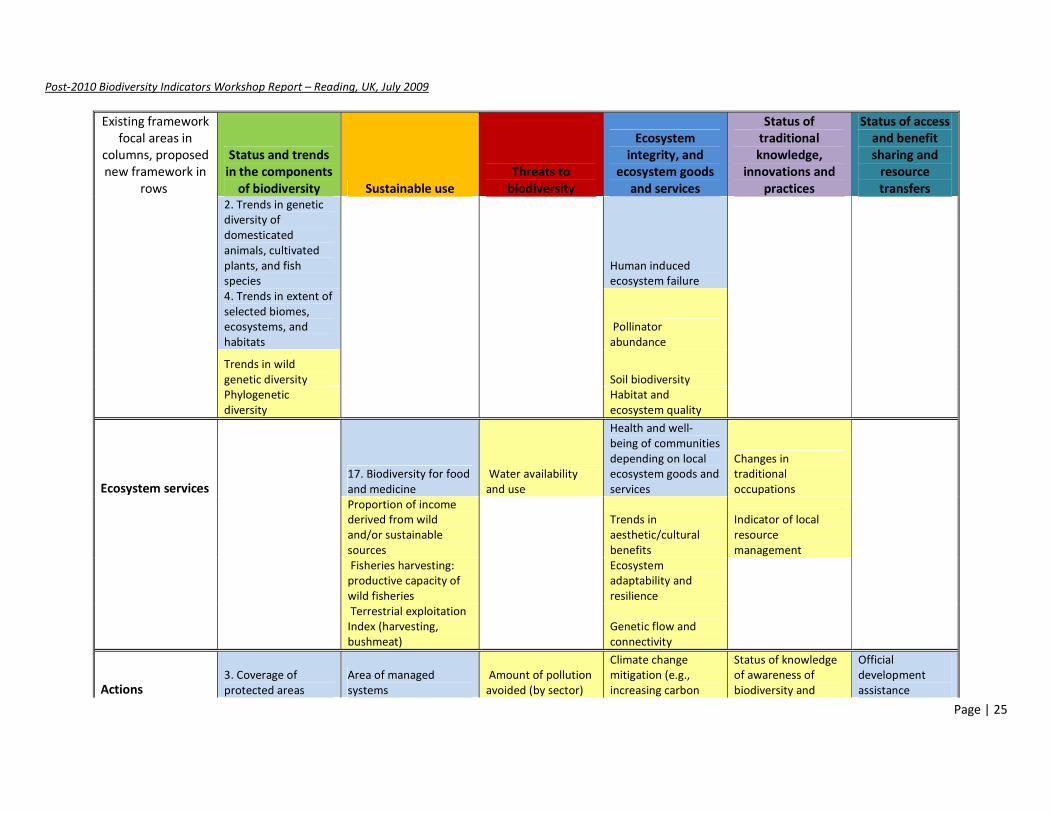
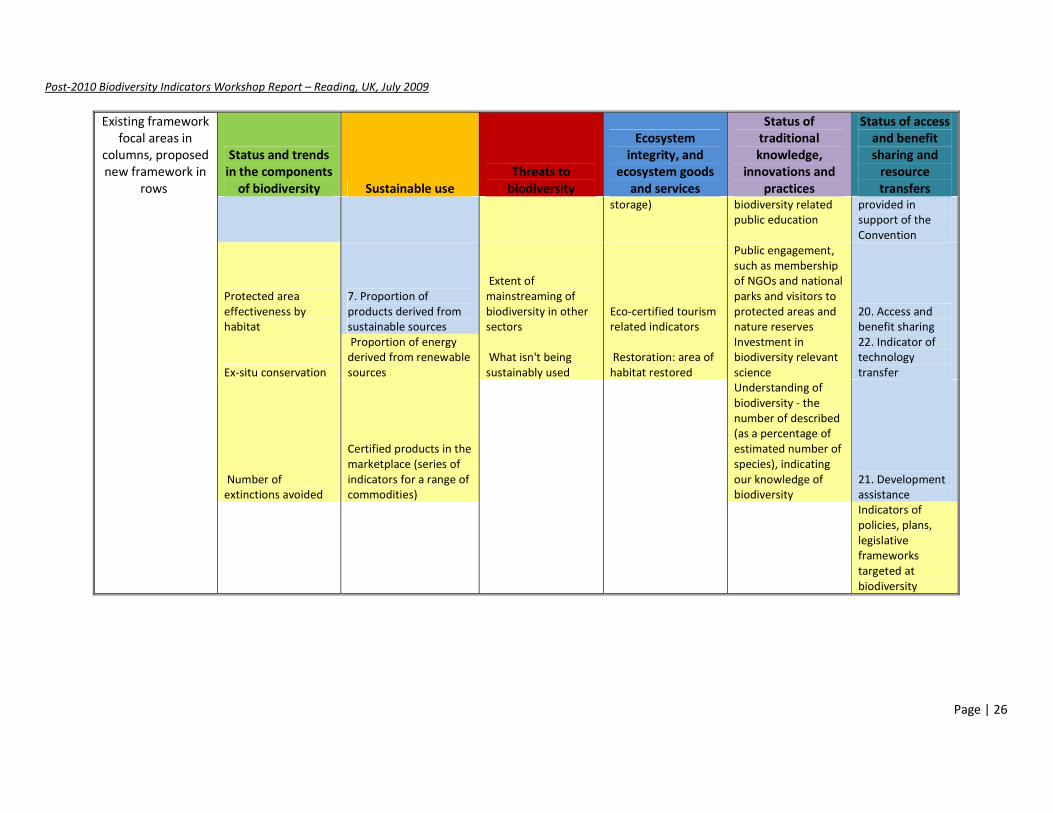
Table 1: Matrix showing existing framework focal areas (columns) versus new proposed focal areas (rows). Current headline indicators are in blue boxes; Indicators
proposed by the working groups are in yellow boxes. {Additional suggestions from the ‘Scientific Rigour’ working group are provided in subsequent tables}
Existing framework
focal areas in
columns, proposed
new framework in
rows
Status and trends
in the components
of biodiversity Sustainable use
Threats to
biodiversity
Ecosystem
integrity, and
ecosystem goods
and services
Status of
traditional
knowledge,
innovations and
practices
Status of access
and benefit
sharing and
resource
transfers
Threats:
Indirect drivers
Human population
change Consumption
19. Traditional
knowledge
8. Ecological footprint
and related concepts
Indicators of
economic status -
GDP
18. Trends in
linguistic diversity
Threats:
Direct pressures Water quality
Connectivity /
fragmentation of
ecosystems
Trends in invasive
alien species
Nitrogen deposition
Climate change
Agricultural
expansion
Water extraction
Fire
Pollution: pesticides,
agricultural waste,
sedimentation
Pollution: ocean
acidification and
toxic loading
Status of
Biodiversity
1. Trends in
abundance and
distribution of
selected species
Trophic integrity of
other ecosystems
Indigenous
knowledge of food
4. Change in status of
threatened species Marine Trophic Index
Post-2010 Biodiversity Indicators Workshop Report – Reading, UK, July 2009
Page | 25
Existing framework
focal areas in
columns, proposed
new framework in
rows
Status and trends
in the components
of biodiversity Sustainable use
Threats to
biodiversity
Ecosystem
integrity, and
ecosystem goods
and services
Status of
traditional
knowledge,
innovations and
practices
Status of access
and benefit
sharing and
resource
transfers
2. Trends in genetic
diversity of
domesticated
animals, cultivated
plants, and fish
species
Human induced
ecosystem failure
4. Trends in extent of
selected biomes,
ecosystems, and
habitats
Pollinator
abundance
Trends in wild
genetic diversity Soil biodiversity
Phylogenetic
diversity
Habitat and
ecosystem quality
Ecosystem services
17. Biodiversity for food
and medicine
Water availability
and use
Health and well-
being of communities
depending on local
ecosystem goods and
services
Changes in
traditional
occupations
Proportion of income
derived from wild
and/or sustainable
sources
Trends in
aesthetic/cultural
benefits
Indicator of local
resource
management
Fisheries harvesting:
productive capacity of
wild fisheries
Ecosystem
adaptability and
resilience
Terrestrial exploitation
Index (harvesting,
bushmeat)
Genetic flow and
connectivity
Actions 3. Coverage of
protected areas
Area of managed
systems
Amount of pollution
avoided (by sector)
Climate change
mitigation (e.g.,
increasing carbon
Status of knowledge
of awareness of
biodiversity and
Official
development
assistance
Post-2010 Biodiversity Indicators Workshop Report – Reading, UK, July 2009
Page | 26
Existing framework
focal areas in
columns, proposed
new framework in
rows
Status and trends
in the components
of biodiversity Sustainable use
Threats to
biodiversity
Ecosystem
integrity, and
ecosystem goods
and services
Status of
traditional
knowledge,
innovations and
practices
Status of access
and benefit
sharing and
resource
transfers
storage) biodiversity related
public education
provided in
support of the
Convention
Protected area
effectiveness by
habitat
7. Proportion of
products derived from
sustainable sources
Extent of
mainstreaming of
biodiversity in other
sectors
Eco-certified tourism
related indicators
Public engagement,
such as membership
of NGOs and national
parks and visitors to
protected areas and
nature reserves
20. Access and
benefit sharing
Ex-situ conservation
Proportion of energy
derived from renewable
sources
What isn't being
sustainably used
Restoration: area of
habitat restored
Investment in
biodiversity relevant
science
22. Indicator of
technology
transfer
Number of
extinctions avoided
Certified products in the
marketplace (series of
indicators for a range of
commodities)
Understanding of
biodiversity - the
number of described
(as a percentage of
estimated number of
species), indicating
our knowledge of
biodiversity
21. Development
assistance
Indicators of
policies, plans,
legislative
frameworks
targeted at
biodiversity
Post-2010 Biodiversity Indicators Workshop Report – Reading, UK, July 2009
Page | 27
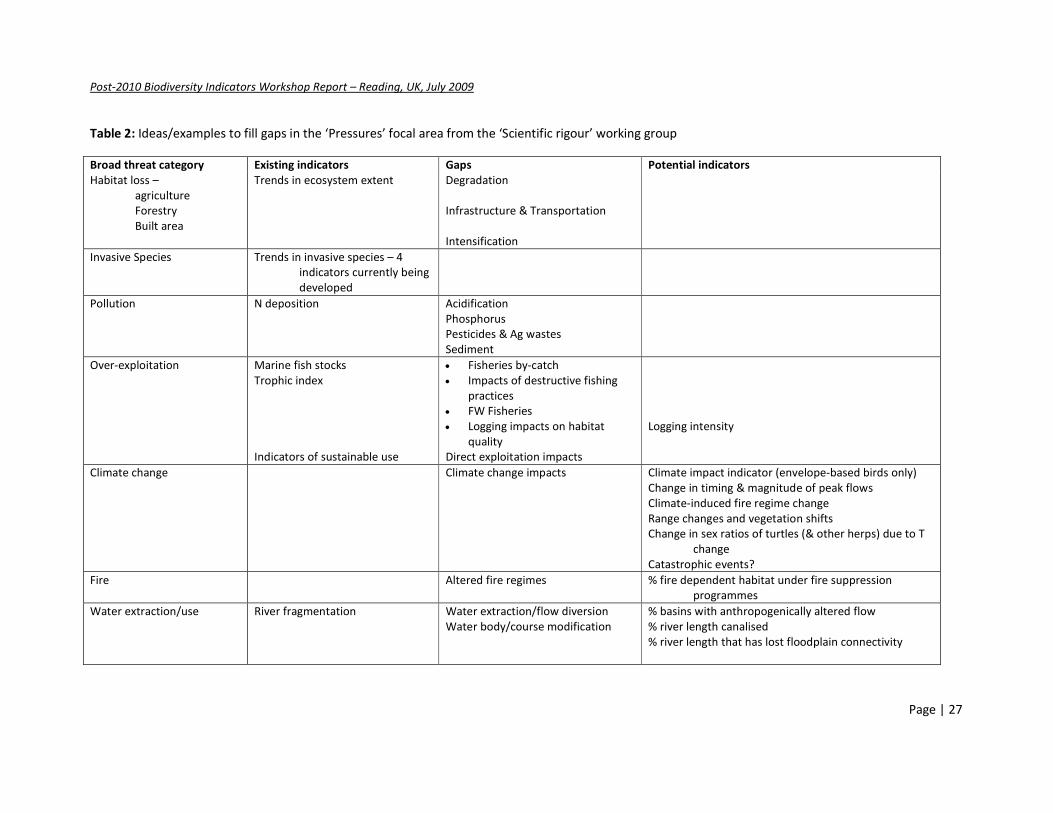
Table 2: Ideas/examples to fill gaps in the ‘Pressures’ focal area from the ‘Scientific rigour’ working group
Broad threat category Existing indicators Gaps Potential indicators
Habitat loss –
agriculture
Forestry
Built area
Trends in ecosystem extent Degradation
Infrastructure & Transportation
Intensification
Invasive Species Trends in invasive species – 4
indicators currently being
developed
Pollution N deposition Acidification
Phosphorus
Pesticides & Ag wastes
Sediment
Over-exploitation Marine fish stocks
Trophic index
Indicators of sustainable use
• Fisheries by-catch
• Impacts of destructive fishing
practices
• FW Fisheries
• Logging impacts on habitat
quality
Direct exploitation impacts
Logging intensity
Climate change Climate change impacts
Climate impact indicator (envelope-based birds only)
Change in timing & magnitude of peak flows
Climate-induced fire regime change
Range changes and vegetation shifts
Change in sex ratios of turtles (& other herps) due to T
change
Catastrophic events?
Fire Altered fire regimes % fire dependent habitat under fire suppression
programmes
Water extraction/use River fragmentation Water extraction/flow diversion
Water body/course modification
% basins with anthropogenically altered flow
% river length canalised
% river length that has lost floodplain connectivity

Post-2010 Biodiversity Indicators Workshop Report – Reading, UK, July 2009
Page | 28
Table 3: Ideas/examples for ‘state’ indicators from the ‘Scientific rigour’ working group
Desired state
Proposed indicator
Pollinators sufficiently abundant to maximize
pollination services
1. Pollinator abundance and distribution
2. Replacement cost for lost wild pollinators
Minimum damage caused by Invasive Alien Species Economic damage from IAS
Biosequestration enhanced Carbon stored in ecosystems
Populations of wild species with enough genetic
diversity to retain adaptive capacity
Genetic variation at appropriate loci
Soil biodiversity sufficient to maintain full nutrient
cycling
Soil process assessment
Species and landscapes at levels and qualities to
maximize aesthetic/cultural benefits
Tourism revenues linked to biodiversity
Tasty wild fish at pre-industrial fishing levels Productive capacity of wild capture fisheries
Diversity of wild crop relatives maintained Abundance of wild crop relatives
Ecological and functional types at appropriate level RLI and LPI
Ecosystems sufficiently diverse to maintain
resilience
Ability of ecosystems to withstand small
perturbations
Genetic exchange within meta-populations
(connectivity
Genetic diversity and exchange

Post-2010 Biodiversity Indicators Workshop Report – Reading, UK, July 2009
Page | 29
Table 4: Ideas/examples for ‘Response (Actions)’ indicators from the ‘Scientific rigour’ working group
Existing Proposed
22.Indicator of Technology transfer Area of each Biome/habitats in PA of various
effectiveness categories
3. Coverage of Protected Area Coverage of biome-dependent species by PA
21. Official development assistance provided in
support of the Convention
PA coverage of key sites of biodiversity
6. Area of forest, agricultural+ aquaculture
ecosystems under sustainable management
Trend in public awareness and understanding of
biodiversity
Certification of marketed goods of fisheries,
forestry, agriculture and aquaculture
Number of extinctions avoided
Extent to which agri-schemes take account of
biodiversity
Broader range of agricultural products available
to consumers
Area of habitat restored
Recovery /Action Plans for global and national
Red List species- numbers and money spent
Water allocations set
- environment flows
Number of fish stocks under sustainable
management –
(a) marine
(b) freshwater
CITES Enforcement level
Avoided pollution by nitrogen by sector:
Agriculture, transport….
Control programmes for invasives
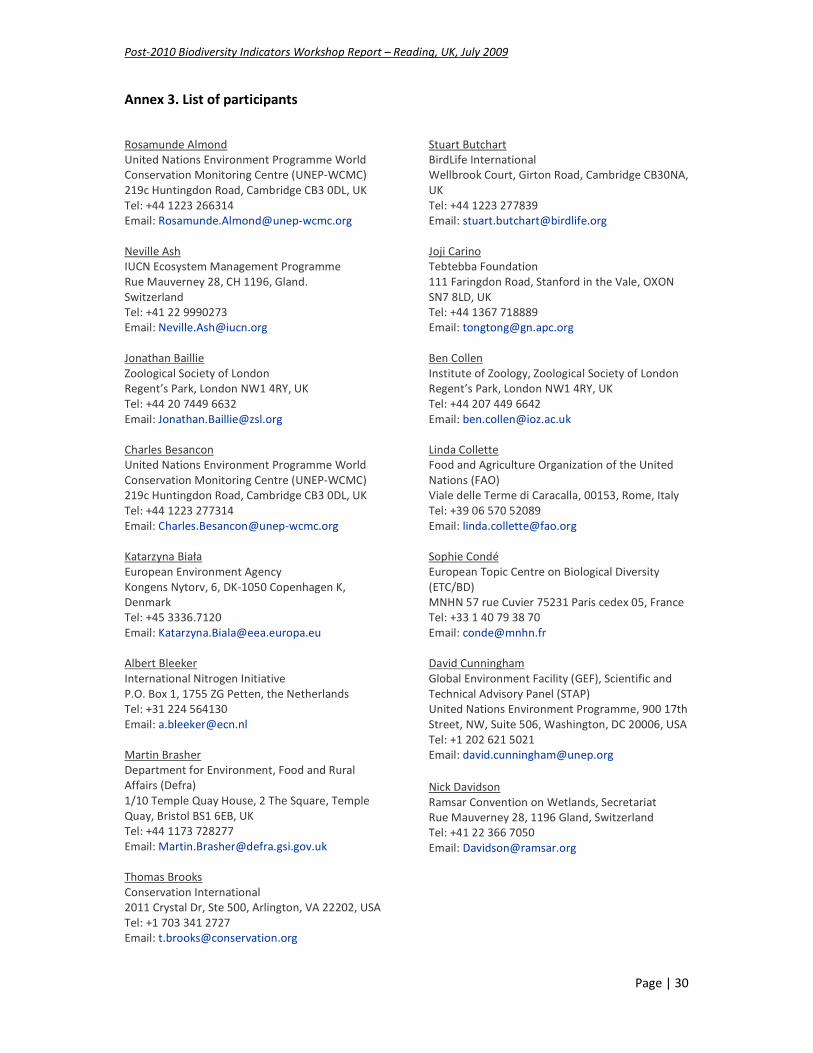
Post-2010 Biodiversity Indicators Workshop Report – Reading, UK, July 2009
Page | 30
Annex 3. List of participants
Rosamunde Almond
United Nations Environment Programme World
Conservation Monitoring Centre (UNEP-WCMC)
219c Huntingdon Road, Cambridge CB3 0DL, UK
Tel: +44 1223 266314
Email: [email protected]
Neville Ash
IUCN Ecosystem Management Programme
Rue Mauverney 28, CH 1196, Gland.
Switzerland
Tel: +41 22 9990273
Email: [email protected]
Jonathan Baillie
Zoological Society of London
Regent’s Park, London NW1 4RY, UK
Tel: +44 20 7449 6632
Email: [email protected]
Charles Besancon
United Nations Environment Programme World
Conservation Monitoring Centre (UNEP-WCMC)
219c Huntingdon Road, Cambridge CB3 0DL, UK
Tel: +44 1223 277314
Email: [email protected]
Katarzyna Biała
European Environment Agency
Kongens Nytorv, 6, DK-1050 Copenhagen K,
Denmark
Tel: +45 3336.7120
Email: [email protected]
Albert Bleeker
International Nitrogen Initiative
P.O. Box 1, 1755 ZG Petten, the Netherlands
Tel: +31 224 564130
Email: [email protected]
Martin Brasher
Department for Environment, Food and Rural
Affairs (Defra)
1/10 Temple Quay House, 2 The Square, Temple
Quay, Bristol BS1 6EB, UK
Tel: +44 1173 728277
Email: [email protected]
Thomas Brooks
Conservation International
2011 Crystal Dr, Ste 500, Arlington, VA 22202, USA
Tel: +1 703 341 2727
Email: [email protected]
Stuart Butchart
BirdLife International
Wellbrook Court, Girton Road, Cambridge CB30NA,
UK
Tel: +44 1223 277839
Email: [email protected]
Joji Carino
Tebtebba Foundation
111 Faringdon Road, Stanford in the Vale, OXON
SN7 8LD, UK
Tel: +44 1367 718889
Email: [email protected]
Ben Collen
Institute of Zoology, Zoological Society of London
Regent’s Park, London NW1 4RY, UK
Tel: +44 207 449 6642
Email: [email protected]
Linda Collette
Food and Agriculture Organization of the United
Nations (FAO)
Viale delle Terme di Caracalla, 00153, Rome, Italy
Tel: +39 06 570 52089
Email: [email protected]
Sophie Condé
European Topic Centre on Biological Diversity
(ETC/BD)
MNHN 57 rue Cuvier 75231 Paris cedex 05, France
Tel: +33 1 40 79 38 70
Email: [email protected]
David Cunningham
Global Environment Facility (GEF), Scientific and
Technical Advisory Panel (STAP)
United Nations Environment Programme, 900 17th
Street, NW, Suite 506, Washington, DC 20006, USA
Tel: +1 202 621 5021
Email: [email protected]
Nick Davidson
Ramsar Convention on Wetlands, Secretariat
Rue Mauverney 28, 1196 Gland, Switzerland
Tel: +41 22 366 7050
Email: [email protected]
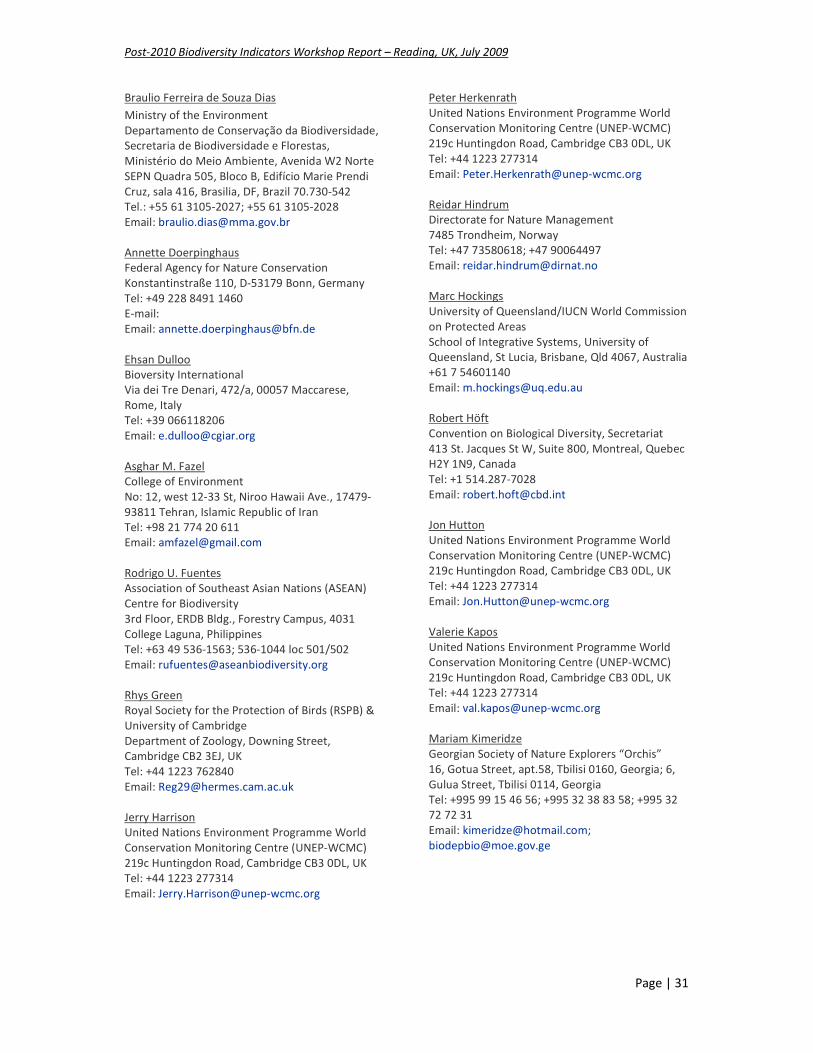
Post-2010 Biodiversity Indicators Workshop Report – Reading, UK, July 2009
Page | 31
Braulio Ferreira de Souza Dias
Ministry of the Environment
Departamento de Conservação da Biodiversidade,
Secretaria de Biodiversidade e Florestas,
Ministério do Meio Ambiente, Avenida W2 Norte
SEPN Quadra 505, Bloco B, Edifício Marie Prendi
Cruz, sala 416, Brasilia, DF, Brazil 70.730-542
Tel.: +55 61 3105-2027; +55 61 3105-2028
Email: [email protected]
Annette Doerpinghaus
Federal Agency for Nature Conservation
Konstantinstraße 110, D-53179 Bonn, Germany
Tel: +49 228 8491 1460
E-mail:
Email: [email protected]
Ehsan Dulloo
Bioversity International
Via dei Tre Denari, 472/a, 00057 Maccarese,
Rome, Italy
Tel: +39 066118206
Email: [email protected]
Asghar M. Fazel
College of Environment
No: 12, west 12-33 St, Niroo Hawaii Ave., 17479-
93811 Tehran, Islamic Republic of Iran
Tel: +98 21 774 20 611
Email: [email protected]
Rodrigo U. Fuentes
Association of Southeast Asian Nations (ASEAN)
Centre for Biodiversity
3rd Floor, ERDB Bldg., Forestry Campus, 4031
College Laguna, Philippines
Tel: +63 49 536-1563; 536-1044 loc 501/502
Email: [email protected]
Rhys Green
Royal Society for the Protection of Birds (RSPB) &
University of Cambridge
Department of Zoology, Downing Street,
Cambridge CB2 3EJ, UK
Tel: +44 1223 762840
Email: [email protected]
Jerry Harrison
United Nations Environment Programme World
Conservation Monitoring Centre (UNEP-WCMC)
219c Huntingdon Road, Cambridge CB3 0DL, UK
Tel: +44 1223 277314
Email: [email protected]
Peter Herkenrath
United Nations Environment Programme World
Conservation Monitoring Centre (UNEP-WCMC)
219c Huntingdon Road, Cambridge CB3 0DL, UK
Tel: +44 1223 277314
Email: [email protected]
Reidar Hindrum
Directorate for Nature Management
7485 Trondheim, Norway
Tel: +47 73580618; +47 90064497
Email: [email protected]
Marc Hockings
University of Queensland/IUCN World Commission
on Protected Areas
School of Integrative Systems, University of
Queensland, St Lucia, Brisbane, Qld 4067, Australia
+61 7 54601140
Email: [email protected]
Robert Höft
Convention on Biological Diversity, Secretariat
413 St. Jacques St W, Suite 800, Montreal, Quebec
H2Y 1N9, Canada
Tel: +1 514.287-7028
Email: [email protected]
Jon Hutton
United Nations Environment Programme World
Conservation Monitoring Centre (UNEP-WCMC)
219c Huntingdon Road, Cambridge CB3 0DL, UK
Tel: +44 1223 277314
Email: [email protected]
Valerie Kapos
United Nations Environment Programme World
Conservation Monitoring Centre (UNEP-WCMC)
219c Huntingdon Road, Cambridge CB3 0DL, UK
Tel: +44 1223 277314
Email: [email protected]
Mariam Kimeridze
Georgian Society of Nature Explorers “Orchis”
16, Gotua Street, apt.58, Tbilisi 0160, Georgia; 6,
Gulua Street, Tbilisi 0114, Georgia
Tel: +995 99 15 46 56; +995 32 38 83 58; +995 32
72 72 31
Email: [email protected];
Post-2010 Biodiversity Indicators Workshop Report – Reading, UK, July 2009
Page | 32
Nick King
Global Biodiversity Information Facility (GBIF)
Universitetsparken 15, 2100 Copenhagen,
Denmark
Tel: +45-35321471
Email: [email protected]
Christian Layke
World Resources Institute
10 G. St. NE, Suite 800, Washington DC 20002, USA
Tel: +1 202 729 7764
Email: [email protected]
Harold Levrel
Institut Français de Recherche pour l'Exploitation
de la Mer (IFREMER)
IFREME Centre de Brest, DEM, Pointe du Diable,
29280 Plouzané, France
Tel: +33 0 2 29 00 85 27
Email: [email protected]
Jonathan Loh
WWF International
c/o Institute of Zoology, Regent's Park, London
NW1 4RY, UK
Tel: +44 1730 892518
Email: [email protected]
Mette Loyche Wilkie
Food and Agriculture Organization of the United
Nations (FAO)
Viale delle Terme di Caracalla, 00153 Rome, Italy
Tel: +39065705-2091
Email: [email protected]
Georgina Mace
Imperial College London
NERC Centre for Population Biology, Imperial
College London, Silwood Park, Ascot, Berks SL5
7PY, UK.
Tel: +44 (0)20 7594 2354
Email: [email protected]
Paul Matiku
Nature Kenya
P.O. Box 44486, 00100, Nairobi, Kenya
Tel: +254-20-3749957
Email: [email protected];
Sharon McAuslan
Department for Environment, Food and Rural
Affairs (Defra)
Nobel House, 17 Smith Square, London SW1P 3JR,
UK
Tel: +44 20 7238 5257
Email: [email protected]
Maria Miñana
United Nations Educational, Scientific and Cultural
Organization (UNESCO)
1 rue Miollis 75015 Paris, France
Tel: +33 1 45 68 44 16
Email: [email protected]
Szabolcs Nagy
Wetlands International
Horapark 9, 6717 LZ Ede, the Netherlands
Tel: +31 318 660935
Email: [email protected]
Naoko Nakajima
Global Biodiversity Strategy Office
Ministry of the Environment of Japan, 1-2-2
Kasumigaseki Chiyoda-ku, Tokyo 100-8975, Japan
Tel: +81-3-5521-8275
Email: [email protected]
Oscar E. Natale
Instituto Nacional del Agua (INA)
Autopista Jorge Newbery km. 1.62, Ezeiza (Buenos
Aires), Argentina
Tel: +54-11 4480 4500 (Ext. 2389)
Email: [email protected]
Alfred A. Oteng-Yeboah
Council for Scientific and Industrial Research (CSIR)
Ghana
CSIR, P.O. Box MB 32, Accra, Ghana
Tel: +233 244 77 22 56
Email: [email protected]
Marc Patry
United Nations Educational, Scientific and Cultural
Organization (UNESCO) World Heritage Centre
7 Place de Fontenoy, 75007 Paris, France
Tel: +33 1-45-68-17-88
Email: [email protected]
Jan Plesnik
Agency for Nature Conservation and Landscape
Protection
Nuselska 39, CZ-140 00 Praha 4, Czech Republic
Tel: +420 241 082 114
Email: [email protected];
Caroline Pollock
IUCN Red List Programme
219c Huntingdon Road, Cambridge CB3 0DL, UK
Tel: +44 1223 277966
Email: [email protected]

Post-2010 Biodiversity Indicators Workshop Report – Reading, UK, July 2009
Page | 33
Dave Pritchard
Ramsar Convention on Wetlands, Scientific and
Technical Review Panel (STRP)
c/o Ramsar Secretariat, Rue Mauverney 28, CH-
1196 Gland, Switzerland
Tel: +41 22 999 0170
Email: [email protected]
Carmen Revenga
The Nature Conservancy
4245 N Fairfax Drive, Suite 100, Arlington VA
22206, USA
Tel: +1 703-841-4513
Email: [email protected]
Delia B. Rodriguez-Amaya
University of Campinas
Department of Food Science, Faculty of Food
Engineering, University of Campinas, 13083-862
Campinas, SP, Brazil
Tel: +55 19 3521 4013
Email: [email protected]
Christian Schlatter
Federal Office of Environment
Worblentalstrasse 68, 3063 Ittigen, Switzerland
Tel: +41 31 324 76 61
Email: [email protected]
Frederik Schutyser
European Environment Agency
6 Kongens Nytorv, 1050 Copenhagen K, Denmark
Tel: +45 3336 7280
Email: [email protected]
Sarah Simons
Global Invasive Species Programme
ICRAF Complex, United Nations Avenue, P.O. Box
633-00621, Nairobi, Kenya
Tel: +254-20-7224461
Email: [email protected]
Ashbindu Singh
United Nations Environment Programme
UNEP Division of Early Warning & Assessment -
North America
900 17th Street N.W, Suite 506
Washington, D.C. 20006, USA
Tel: +1 (202) 785 0465; +1 (202) 974 1305
Email: [email protected]
Risa Smith
Environment Canada
401 Burrard St., Ste 201, Vancouver, British
Columbia V6C 3S5, Canada
Tel: +1 604 664 9303
Email: [email protected]
Damon Stanwell-Smith
United Nations Environment Programme World
Conservation Monitoring Centre (UNEP-WCMC)
219c Huntingdon Road, Cambridge CB3 0DL, UK
Tel: +44 1223 277314
Email: [email protected]
Mark Stevenson
Department for Environment, Food and Rural
Affairs (Defra)
Natural Environment Science Team,
Defra, c/o Natural England Office, Victoria House,
Cross Lanes, Guildford, Surrey GU1 1UJ, UK
Tel: +44 1483 307718
Email: [email protected]
Andrew Stott
Joint Nature Conservation Committee (JNCC)
Monkstone House, City Road, Peterborough PE1
1EY, UK
Tel: +44 1733 866885
Email: [email protected]
Simon N. Stuart
IUCN, Species Survival Commission Chair
The Innovation Centre, University of Bath,
Carpenter House, First Floor, Broad Quay, Bath,
BA1 1UD, UK
Tel: +44 (1225) 388 501
Email: [email protected]
Andy Swash
Biodiversity & Landscape Science Unit,
Department for Environment, Food and Rural
Affairs (Defra)
1/10 Temple Quay House, 2 The Square, Temple
Quay, Bristol BS1 6EB, UK
Tel: +44 1173 726 274
Email: [email protected]
Anne Teller
European Commission, Environment Directorate-
General (DG ENV)
Avenue de Beaulieu, 9, 1160 – Auderghem,
Brussels, Belgium
Tel: +32.2.299.11.11
Email: [email protected]
Ben ten Brink
Netherlands Environmental Assessment Agency
(PBL)
PO Box 303, 3720AH Bilthoven, Netherlands
Tel: +31 30 274 2210
Email: [email protected]
Post-2010 Biodiversity Indicators Workshop Report – Reading, UK, July 2009
Page | 34
Thingnganing Longvah
National Institute of Nutrition
Jamai Osmania PO, Hyderabad – 500 007, AP India
Tel: +91 40 27197216; +91 40 65228271
Email: [email protected];
Spencer Thomas
Convention on Biological Diversity, Subsidiary Body
on Scientific, Technical and Technological Advice
(SBSTTA) Chair
PO Box 341, St. George’s, Grenada
+1 473 407 5765
Email: [email protected]
Graham Tucker
Institute for European Environmental Policy
15 Queen Anne's Gate, London SW1H 9AB, UK
Tel: +44 20 7340 2688
Email: [email protected]
Stephen Twomlow
United Nations Environment Programme (UNEP)
Division of GEF Coordination, UNEP, PO Box 30552
(00100), Nairobi, Kenya
Tel: +254 20 7625076
Email: [email protected]
Tristan Tyrrell
United Nations Environment Programme World
Conservation Monitoring Centre (UNEP-WCMC)
219c Huntingdon Road, Cambridge CB3 0DL, UK
Tel: +44 1223 277314
Email: [email protected]
Tania Urquiza Haas
Commission for the knowledge and use of
biodiversity (CONABIO)
Av. Liga Periférico - Insurgentes Sur, Núm. 4903.,
Col. Parques del Pedregal, Delegación Tlalpan, C.P.
14010, México, D.F., México
Tel: +52 55 50045016
Email: [email protected]
Matt Walpole
United Nations Environment Programme World
Conservation Monitoring Centre (UNEP-WCMC)
219c Huntingdon Road, Cambridge CB3 0DL, UK
Tel: +44 1223 277314
Email: [email protected]
Tony Whitten
The World Bank
1818 H Street, NW, Washington, DC 20433, USA
Tel: +1 202 458 2253
Email: [email protected]
James Williams
Joint Nature Conservation Committee (JNCC)
Monkstone House, City Road, Peterborough PE1
1JY, UK
Tel: +44 1733 866868
Email: [email protected]
Rawson Piniel Yonazi
President’s Office State House – Cabinet
Secretariat
Cabinet Secretariat Building, Magogoni Road, P.O.
Box 9120, Dar es Salaam, Tanzania
Tel: +255 22 2121893; +255 786518842
Email: [email protected]; [email protected]
Mark Zimsky
Global Environment Facility, Secretariat
Global Environment Facility, G-6 602, 1818 H
Street, NW, Washington, DC 20433, USA
Tel: +1 202-473-7855
Email: [email protected]

Post-2010 Biodiversity Indicators Workshop Report – Reading, UK, July 2009
Page | 35
Annex 4. Workshop agenda
Monday 6 July
Chair: L. Spencer Thomas, CBD SBSTTA Chair
From 8.30 Registration
9.30 Welcome addresses:
• Jon Hutton, UNEP-WCMC
• Robert Höft, SCBD
9.45 Introduction to workshop – background, objectives,
outputs, agenda, house-keeping
Matt Walpole, UNEP-WCMC
SESSION 1: Lessons learned from the 2010 indicators framework
10.00 Plenary presentation: What are the 2010
biodiversity indicators telling us – lessons from the
2010 Biodiversity Indicators Partnership, the 2010
indicators consultation, CBD national reports and
other sources
Damon Stanwell-Smith, 2010
Biodiversity Indicators
Partnership
10.30 Tea & Coffee
11.00 UK Government: 2010 and beyond? Huw Irranca-Davies MP,
Minister for the Natural and
Marine Environment, Wildlife
and Rural Affairs, UK
11.15 Plenary presentation: Lessons from national use of
biodiversity indicators – the Brazilian experience
Braulio Ferreira de Souza
Dias, Brazil
11.45 Plenary presentation: Lessons from regional use of
biodiversity indicators – the SEBI2010 project
Frederik Schutyser, European
Environment Agency (EEA)
12.15 Briefing for working groups Steering Group (of the
workshop)
12.30 Lunch
14.00 Working groups – Looking back
(To include input presentations):
1. Sufficiency (Is the set of 2010 indicators
sufficient to provide information on achieving
the CBD 2010 goals and targets?)
2. Scientific rigour (To what extent is the set of
2010 indicators scientifically rigorous, logical
and comprehensive?)
3. Policy relevance (To what extent have the 2010
indicators been policy-relevant?)
4. Effective communication (Are the 2010
indicators being communicated effectively
individually and in combination?)
Facilitators
15.30 Tea & Coffee
15.45 Working groups (continued) (including market place
15.45-16.30)
18.00 End of day

Post-2010 Biodiversity Indicators Workshop Report – Reading, UK, July 2009
Page | 36
Tuesday, 7 July 2009
Chair: Martin Brasher, Defra
9.00 Plenary: Initial reports from the working groups and
identification of any issues overlooked
SESSION 2: A global post-2010 indicators framework
10.00
Plenary presentation: Where are we with the post-
2010 agenda – summary of current thinking and
recent meetings
Robert Höft, CBD
10.30 Biodiversity scenarios: What do they tell us and how
can they be used
Matt Walpole, UNEP-WCMC
10.45 Tea & Coffee
11.15 Briefing for working groups Steering Group
11.30 Working groups – Looking forward
Group compositions as Day 1, using four themes
from yesterday’s sessions as guidance.
(To include input presentations)
Facilitators
12.30 Lunch
14.00 Working groups (continued) (including market place
15.00-15.45)
15.45 Tea & Coffee
16.00 Working groups (continued)
17.00 Plenary: Reports from the working groups and
discussion
18.00 End of day
Wednesday, 8 July 2009
Chair: Andrew Stott, JNCC
9.00 Where to go from here – summary of progress, and
introduction to what still needs resolving – briefing
for working groups
Steering Group
9.30 Working groups (continued/as agreed)
10.30 Tea & Coffee
11.00 Working groups (continued)
12.00 Plenary: Reports from working groups
12.30 Lunch
14.00 Plenary: Discussion
15.30 Tea & Coffee
16.00 Final plenary: Outputs and recommendations
17.15 Concluding remarks Robert Höft, SCBD
Jon Hutton, UNEP-WCMC
Andrew Stott, JNCC
17.30 Departure
Post-2010 Biodiversity Indicators Workshop Report – Reading, UK, July 2009
Page | 37
Annex 5: What do the 2010 biodiversity indicators tell us? - The status of indicators
A summary of the current status of each of the CBD framework indicators is tabulated below. In
addition factsheets on each of the indicators are available at the 2010 BIP website
(www.twentyten.net).
The CBD Conference of the Parties, through decision IX/10, requested the Executive Secretary to
invite the 2010 BIP partners to make available the latest scientific information on the 2010 indicators
for the Global Biodiversity Outlook. The deadline for submission of GBO-3 indicator storylines,
graphics and case studies to the 2010 BIP Secretariat was subsequently set as 31 March 2009;
however to date only 15 of 27 indicators are represented, indicating the challenges to implement
several of the indicators. The delays are the result of data limitations and a development schedule
originally designed around assessing progress by 2010 rather than a year earlier.
Each indicator trend is presented in Appendix 1, where it has been possible to summarise from the
submissions. In addition a “traffic light” system highlights the trend for each indicator for which
information is available. Where data are not yet available, or the indicator as yet represents a
baseline only, no trend can be ascertained.
The highlights of the preliminary results can be summarised as follows:
• Not all indicators have trend data. A total of 18 indicators had trend data for one or both of
the pre-2000 and the post-2000 periods.
• From the data available, it can be summarised that, although responses (mainly in terms of
funding and the establishment of protected areas) are increasing, so too are threats. Use of
biodiversity is increasingly unsustainable and status and trends data indicates that
biodiversity itself continues to decline.
• Of those indicators for which global data are available, the following indicate negative trends
for both periods: Trends in the extent of selected biomes, ecosystems, and habitats (forest);
Trends in the extent of selected biomes, ecosystems, and habitats (corals reefs, sea-grass
and mangroves); Living Planet Index; Red List Index; Proportion of fish stocks within safe
biological limits; Wild Commodities Index; Ecological footprint and related concepts; Invasive
alien species; Marine Trophic Index; Biodiversity for food and medicine, and; Status and
trends of linguistic diversity and numbers of speakers of indigenous languages.
• The following indicators show positive trends: coverage of protected areas; area of forest
under sustainable management (certification), and; official development assistance provided
in support of the CBD.
• For those indicators with global trend data available for at least one of the two periods, the
outlook for most suggests that biodiversity loss is not being reduced; ten are in ‘red’, while
three are in ‘green’ and five are in ‘amber’. The overall picture therefore points to a
continuous downward trend; there are no signs of a ‘significant’ reduction in the rate of
biodiversity loss at the global level.
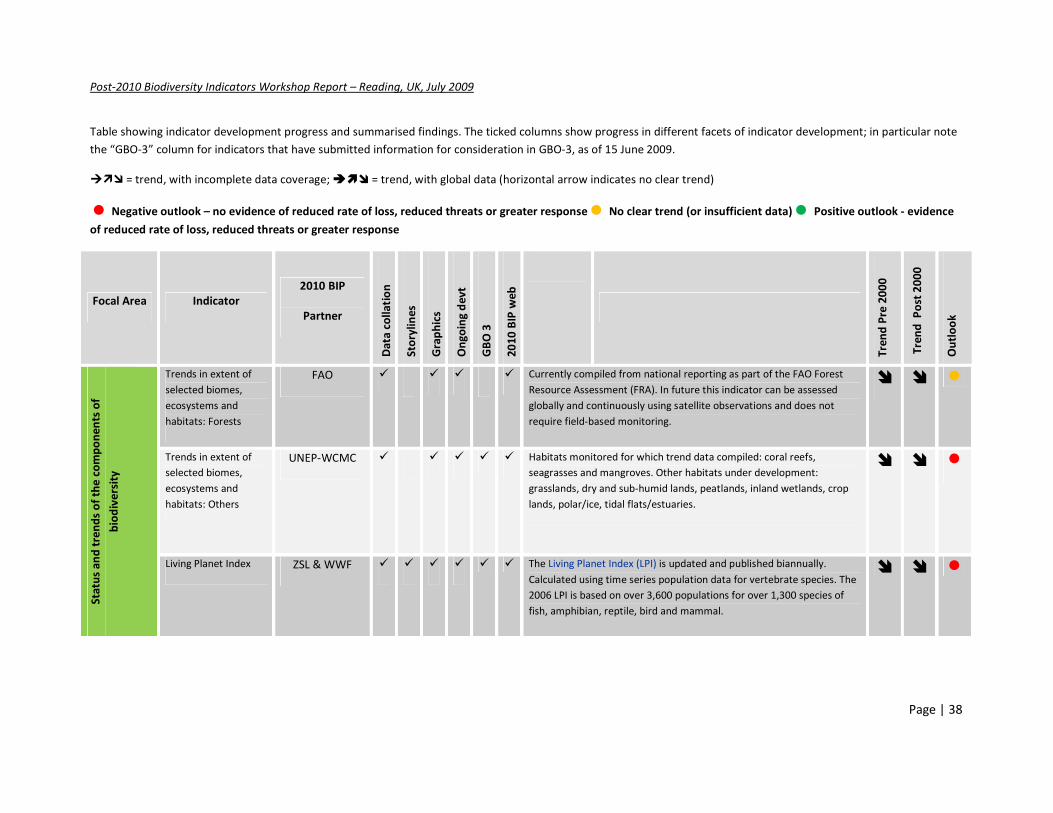
Post-2010 Biodiversity Indicators Workshop Report – Reading, UK, July 2009
Page | 38
Focal Area Indicator
2010 BIP
Partner
Da
ta c
oll
ati
on
Sto
ryli
ne
s
Gra
ph
ics
On
go
ing
de
vt
GB
O 3
20
10
BIP
we
b
Tre
nd
Pre
20
00
Tre
nd
P
ost
20
00
Ou
tlo
ok
Sta
tus
an
d t
ren
ds
of
the
co
mp
on
en
ts o
f
bio
div
ers
ity
Trends in extent of
selected biomes,
ecosystems and
habitats: Forests
FAO � � � � Currently compiled from national reporting as part of the FAO Forest
Resource Assessment (FRA). In future this indicator can be assessed
globally and continuously using satellite observations and does not
require field-based monitoring.
� � �
Trends in extent of
selected biomes,
ecosystems and
habitats: Others
UNEP-WCMC � � � � � Habitats monitored for which trend data compiled: coral reefs,
seagrasses and mangroves. Other habitats under development:
grasslands, dry and sub-humid lands, peatlands, inland wetlands, crop
lands, polar/ice, tidal flats/estuaries.
� � �
Living Planet Index ZSL & WWF � � � � � � The Living Planet Index (LPI) is updated and published biannually.
Calculated using time series population data for vertebrate species. The
2006 LPI is based on over 3,600 populations for over 1,300 species of
fish, amphibian, reptile, bird and mammal.
� � �
Table showing indicator development progress and summarised findings. The ticked columns show progress in different facets of indicator development; in particular note
the “GBO-3” column for indicators that have submitted information for consideration in GBO-3, as of 15 June 2009.
��� = trend, with incomplete data coverage; ��� = trend, with global data (horizontal arrow indicates no clear trend)
� Negative outlook – no evidence of reduced rate of loss, reduced threats or greater response� No clear trend (or insufficient data)� Positive outlook - evidence
of reduced rate of loss, reduced threats or greater response
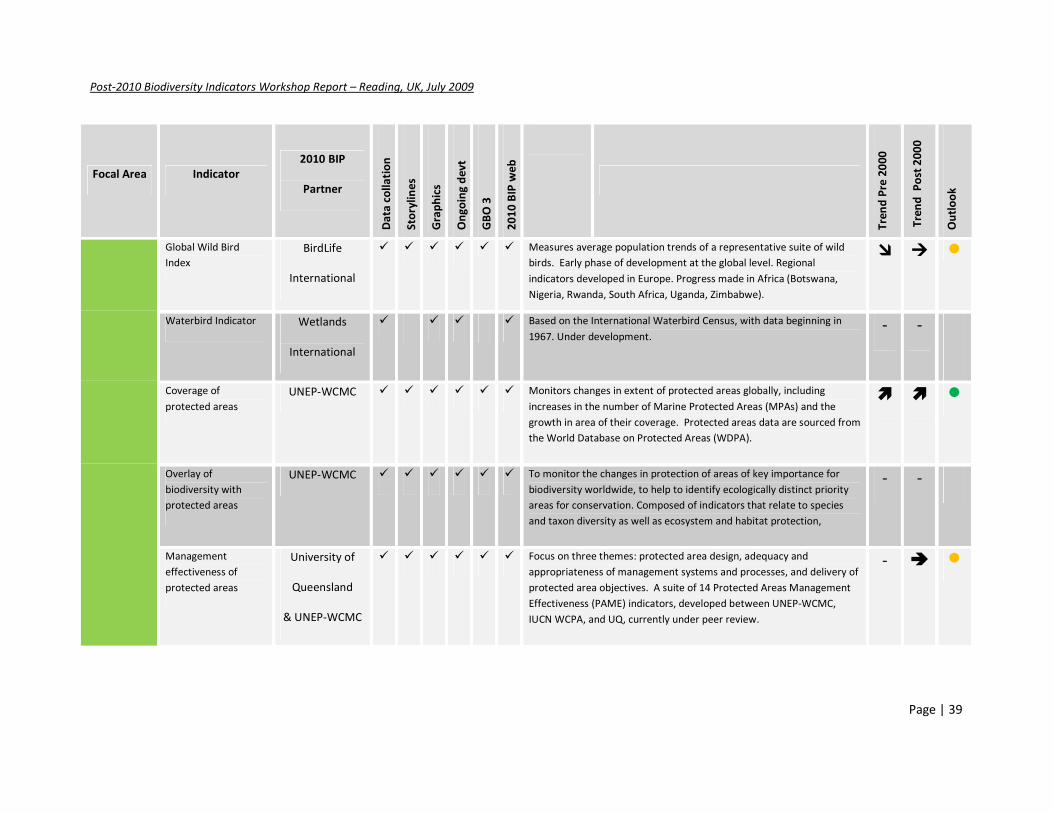
Post-2010 Biodiversity Indicators Workshop Report – Reading, UK, July 2009
Page | 39
Focal Area Indicator
2010 BIP
Partner
Da
ta c
oll
ati
on
Sto
ryli
ne
s
Gra
ph
ics
On
go
ing
de
vt
GB
O 3
20
10
BIP
we
b
Tre
nd
Pre
20
00
Tre
nd
P
ost
20
00
Ou
tlo
ok
Global Wild Bird
Index
BirdLife
International
� � � � � � Measures average population trends of a representative suite of wild
birds. Early phase of development at the global level. Regional
indicators developed in Europe. Progress made in Africa (Botswana,
Nigeria, Rwanda, South Africa, Uganda, Zimbabwe).
� � �
Waterbird Indicator Wetlands
International
� � � � Based on the International Waterbird Census, with data beginning in
1967. Under development. - -
Coverage of
protected areas
UNEP-WCMC � � � � � � Monitors changes in extent of protected areas globally, including
increases in the number of Marine Protected Areas (MPAs) and the
growth in area of their coverage. Protected areas data are sourced from
the World Database on Protected Areas (WDPA).
� � �
Overlay of
biodiversity with
protected areas
UNEP-WCMC � � � � � � To monitor the changes in protection of areas of key importance for
biodiversity worldwide, to help to identify ecologically distinct priority
areas for conservation. Composed of indicators that relate to species
and taxon diversity as well as ecosystem and habitat protection,
- -
Management
effectiveness of
protected areas
University of
Queensland
& UNEP-WCMC
� � � � � � Focus on three themes: protected area design, adequacy and
appropriateness of management systems and processes, and delivery of
protected area objectives. A suite of 14 Protected Areas Management
Effectiveness (PAME) indicators, developed between UNEP-WCMC,
IUCN WCPA, and UQ, currently under peer review.
- � �
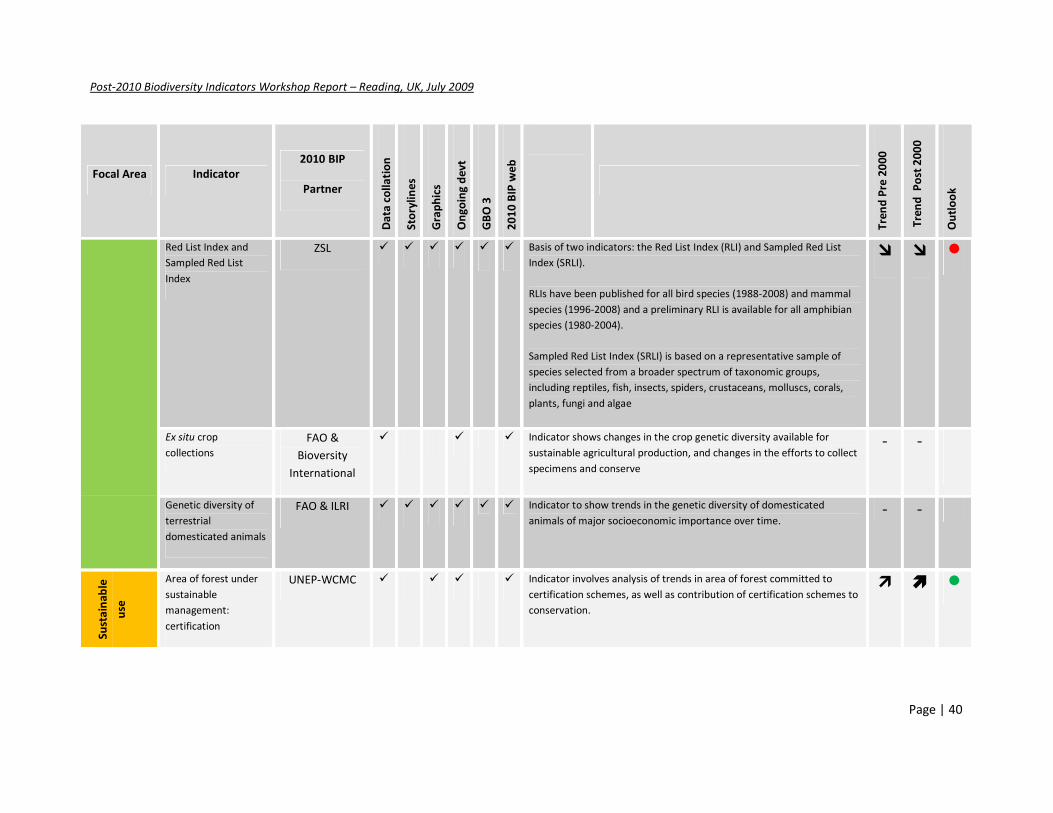
Post-2010 Biodiversity Indicators Workshop Report – Reading, UK, July 2009
Page | 40
Focal Area Indicator
2010 BIP
Partner
Da
ta c
oll
ati
on
Sto
ryli
ne
s
Gra
ph
ics
On
go
ing
de
vt
GB
O 3
20
10
BIP
we
b
Tre
nd
Pre
20
00
Tre
nd
P
ost
20
00
Ou
tlo
ok
Red List Index and
Sampled Red List
Index
ZSL � � � � � � Basis of two indicators: the Red List Index (RLI) and Sampled Red List
Index (SRLI).
RLIs have been published for all bird species (1988-2008) and mammal
species (1996-2008) and a preliminary RLI is available for all amphibian
species (1980-2004).
Sampled Red List Index (SRLI) is based on a representative sample of
species selected from a broader spectrum of taxonomic groups,
including reptiles, fish, insects, spiders, crustaceans, molluscs, corals,
plants, fungi and algae
� � �
Ex situ crop
collections
FAO &
Bioversity
International
� � � Indicator shows changes in the crop genetic diversity available for
sustainable agricultural production, and changes in the efforts to collect
specimens and conserve
- -
Genetic diversity of
terrestrial
domesticated animals
FAO & ILRI � � � � � � Indicator to show trends in the genetic diversity of domesticated
animals of major socioeconomic importance over time. - -
Su
sta
ina
ble
use
Area of forest under
sustainable
management:
certification
UNEP-WCMC � � � � Indicator involves analysis of trends in area of forest committed to
certification schemes, as well as contribution of certification schemes to
conservation.
� � �

Post-2010 Biodiversity Indicators Workshop Report – Reading, UK, July 2009
Page | 41
Focal Area Indicator
2010 BIP
Partner
Da
ta c
oll
ati
on
Sto
ryli
ne
s
Gra
ph
ics
On
go
ing
de
vt
GB
O 3
20
10
BIP
we
b
Tre
nd
Pre
20
00
Tre
nd
P
ost
20
00
Ou
tlo
ok
Area of forest under
sustainable
management:
degradation and
deforestation
FAO � � � � Indicator will combine satellite observation data with information on
growing stock (available for over 150 countries) and additional
information from FRA to capture degradation and deforestation in
forests.
- -
Area of agricultural
ecosystems under
sustainable
management
FAO � � � The four indices are: (i) Development and adoption of policies,
strategies, and plans that support and promote the sustainable use of
agriculture, (ii) Adoption of best agricultural practices and technologies
by farmers and herders (iii) Status and trends of agricultural biodiversity
and ecosystem services (iv) Status and trends in sustaining agricultural
livelihoods
- -
Proportion of fish
stocks in safe
biological limits
FAO � � � � � Indicator has been published in FAO publications including the State of
the World's Fisheries and Aquaculture (SOFIA), and the catch statistics it
is based on are also included in the Marine Trophic Index and Ecological
Footprint.
� � �
Status of species in
trade
CITES � � � � Indicator measures changes in the species in international trade.
- -
Wild Commodities
Index
UNEP-WCMC � � � � � Indicator will track how the status of wild populations of a selection of
highly used species has changed over the last two decades � � �
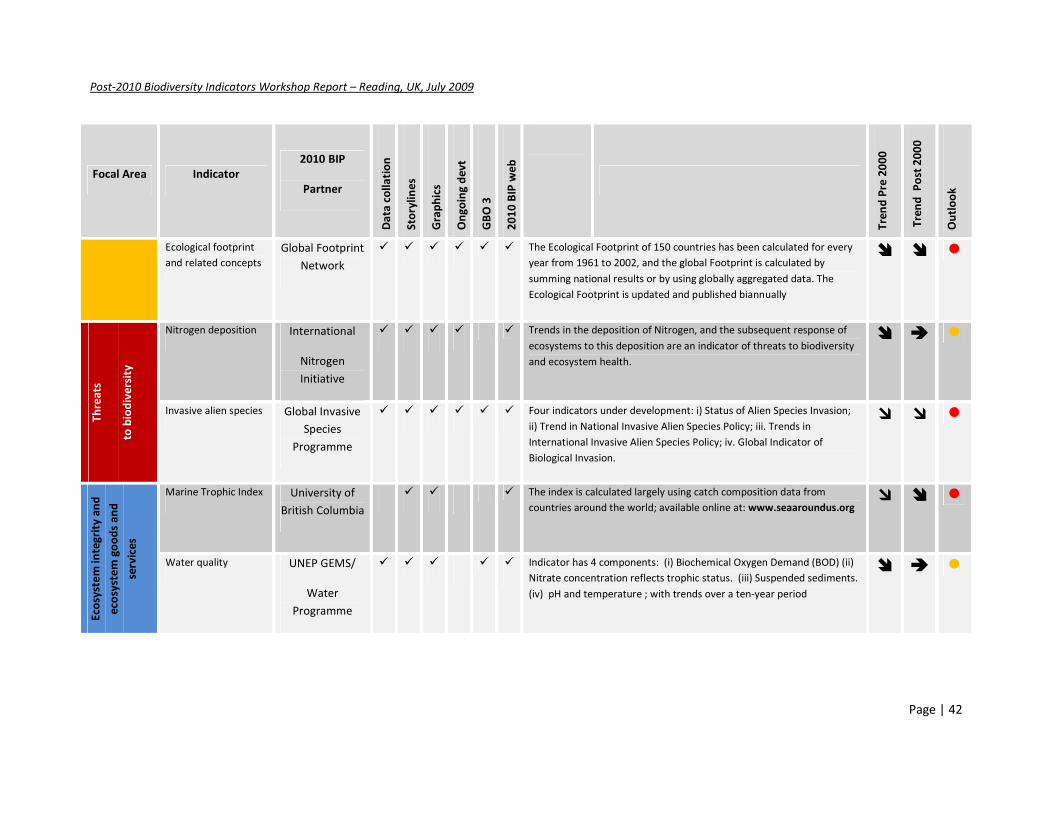
Post-2010 Biodiversity Indicators Workshop Report – Reading, UK, July 2009
Page | 42
Focal Area Indicator
2010 BIP
Partner
Da
ta c
oll
ati
on
Sto
ryli
ne
s
Gra
ph
ics
On
go
ing
de
vt
GB
O 3
20
10
BIP
we
b
Tre
nd
Pre
20
00
Tre
nd
P
ost
20
00
Ou
tlo
ok
Ecological footprint
and related concepts
Global Footprint
Network
� � � � � � The Ecological Footprint of 150 countries has been calculated for every
year from 1961 to 2002, and the global Footprint is calculated by
summing national results or by using globally aggregated data. The
Ecological Footprint is updated and published biannually
� � �
Th
rea
ts
to b
iod
ive
rsit
y
Nitrogen deposition International
Nitrogen
Initiative
� � � � � Trends in the deposition of Nitrogen, and the subsequent response of
ecosystems to this deposition are an indicator of threats to biodiversity
and ecosystem health.
� � �
Invasive alien species Global Invasive
Species
Programme
� � � � � � Four indicators under development: i) Status of Alien Species Invasion;
ii) Trend in National Invasive Alien Species Policy; iii. Trends in
International Invasive Alien Species Policy; iv. Global Indicator of
Biological Invasion.
� � �
Eco
syst
em
in
teg
rity
an
d
eco
syst
em
go
od
s a
nd
serv
ice
s
Marine Trophic Index University of
British Columbia
� � � The index is calculated largely using catch composition data from
countries around the world; available online at: www.seaaroundus.org � � �
Water quality UNEP GEMS/
Water
Programme
� � � � � Indicator has 4 components: (i) Biochemical Oxygen Demand (BOD) (ii)
Nitrate concentration reflects trophic status. (iii) Suspended sediments.
(iv) pH and temperature ; with trends over a ten-year period
� � �
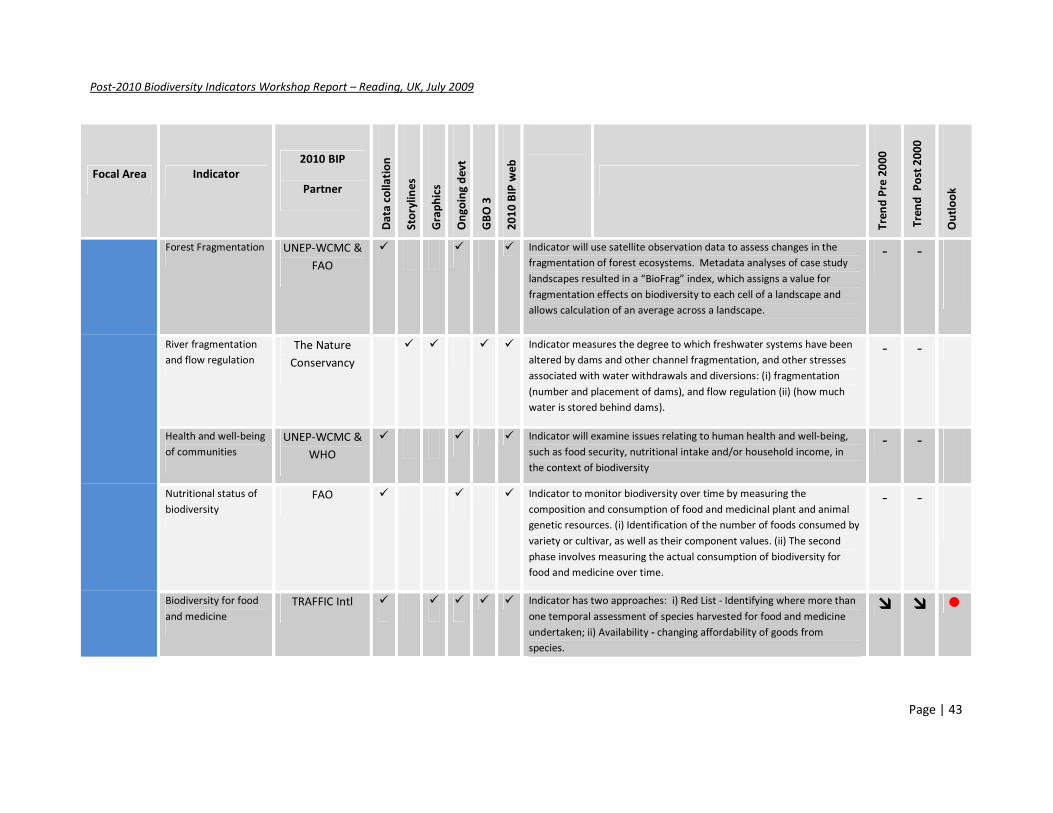
Post-2010 Biodiversity Indicators Workshop Report – Reading, UK, July 2009
Page | 43
Focal Area Indicator
2010 BIP
Partner
Da
ta c
oll
ati
on
Sto
ryli
ne
s
Gra
ph
ics
On
go
ing
de
vt
GB
O 3
20
10
BIP
we
b
Tre
nd
Pre
20
00
Tre
nd
P
ost
20
00
Ou
tlo
ok
Forest Fragmentation UNEP-WCMC &
FAO
� � � Indicator will use satellite observation data to assess changes in the
fragmentation of forest ecosystems. Metadata analyses of case study
landscapes resulted in a “BioFrag” index, which assigns a value for
fragmentation effects on biodiversity to each cell of a landscape and
allows calculation of an average across a landscape.
- -
River fragmentation
and flow regulation
The Nature
Conservancy
� � � � Indicator measures the degree to which freshwater systems have been
altered by dams and other channel fragmentation, and other stresses
associated with water withdrawals and diversions: (i) fragmentation
(number and placement of dams), and flow regulation (ii) (how much
water is stored behind dams).
- -
Health and well-being
of communities
UNEP-WCMC &
WHO
� � � Indicator will examine issues relating to human health and well-being,
such as food security, nutritional intake and/or household income, in
the context of biodiversity
- -
Nutritional status of
biodiversity
FAO � � � Indicator to monitor biodiversity over time by measuring the
composition and consumption of food and medicinal plant and animal
genetic resources. (i) Identification of the number of foods consumed by
variety or cultivar, as well as their component values. (ii) The second
phase involves measuring the actual consumption of biodiversity for
food and medicine over time.
- -
Biodiversity for food
and medicine
TRAFFIC Intl � � � � � Indicator has two approaches: i) Red List - Identifying where more than
one temporal assessment of species harvested for food and medicine
undertaken; ii) Availability - changing affordability of goods from
species.
� � �
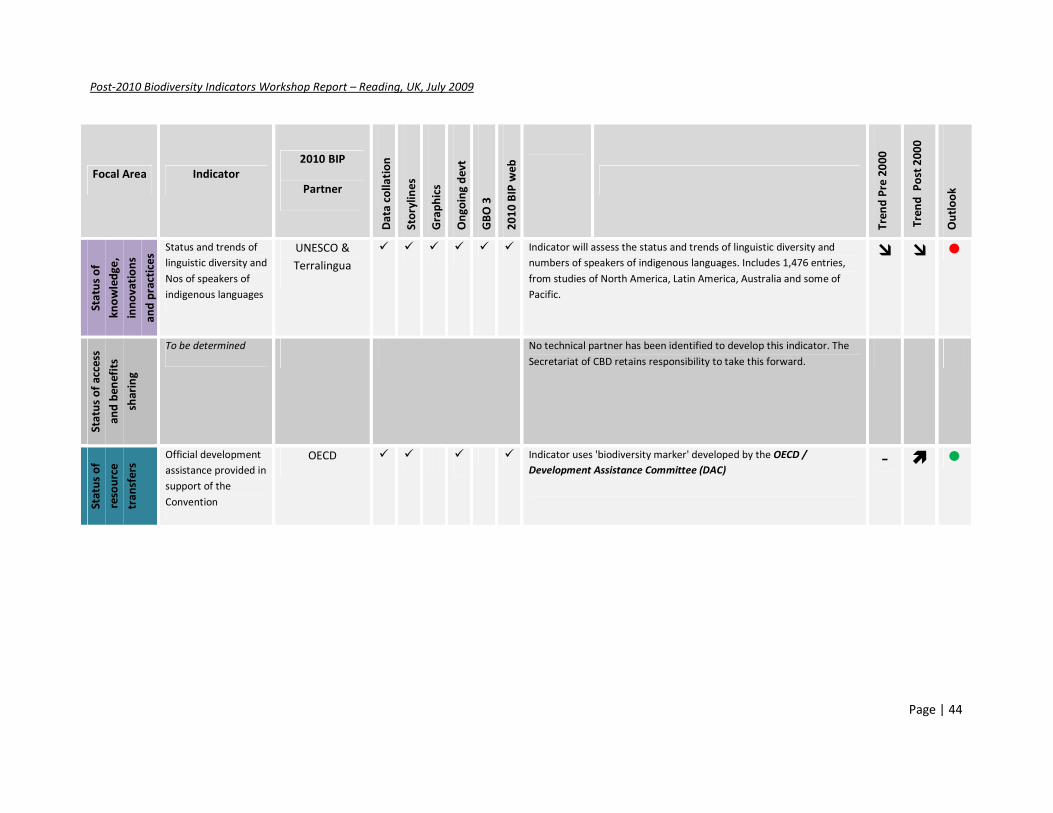
Post-2010 Biodiversity Indicators Workshop Report – Reading, UK, July 2009
Page | 44
Focal Area Indicator
2010 BIP
Partner
Da
ta c
oll
ati
on
Sto
ryli
ne
s
Gra
ph
ics
On
go
ing
de
vt
GB
O 3
20
10
BIP
we
b
Tre
nd
Pre
20
00
Tre
nd
P
ost
20
00
Ou
tlo
ok
Sta
tus
of
kn
ow
led
ge
,
inn
ov
ati
on
s
an
d p
ract
ice
s
Status and trends of
linguistic diversity and
Nos of speakers of
indigenous languages
UNESCO &
Terralingua
� � � � � � Indicator will assess the status and trends of linguistic diversity and
numbers of speakers of indigenous languages. Includes 1,476 entries,
from studies of North America, Latin America, Australia and some of
Pacific.
� � �
Sta
tus
of
acc
ess
an
d b
en
efi
ts
sha
rin
g
To be determined No technical partner has been identified to develop this indicator. The
Secretariat of CBD retains responsibility to take this forward.
Sta
tus
of
reso
urc
e
tra
nsf
ers
Official development
assistance provided in
support of the
Convention
OECD � � � � Indicator uses 'biodiversity marker' developed by the OECD /
Development Assistance Committee (DAC)
- � �
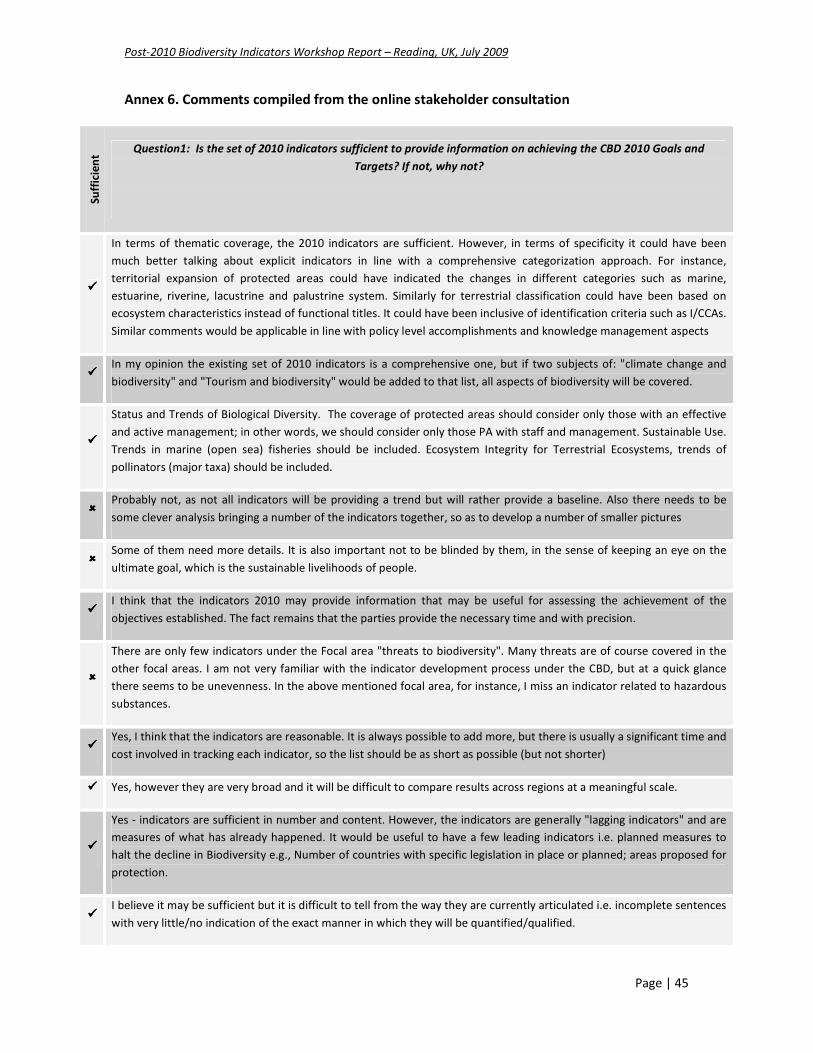
Post-2010 Biodiversity Indicators Workshop Report – Reading, UK, July 2009
Page | 45
Annex 6. Comments compiled from the online stakeholder consultation
Su
ffic
ien
t
Question1: Is the set of 2010 indicators sufficient to provide information on achieving the CBD 2010 Goals and
Targets? If not, why not?
����
In terms of thematic coverage, the 2010 indicators are sufficient. However, in terms of specificity it could have been
much better talking about explicit indicators in line with a comprehensive categorization approach. For instance,
territorial expansion of protected areas could have indicated the changes in different categories such as marine,
estuarine, riverine, lacustrine and palustrine system. Similarly for terrestrial classification could have been based on
ecosystem characteristics instead of functional titles. It could have been inclusive of identification criteria such as I/CCAs.
Similar comments would be applicable in line with policy level accomplishments and knowledge management aspects
���� In my opinion the existing set of 2010 indicators is a comprehensive one, but if two subjects of: "climate change and
biodiversity" and "Tourism and biodiversity" would be added to that list, all aspects of biodiversity will be covered.
����
Status and Trends of Biological Diversity. The coverage of protected areas should consider only those with an effective
and active management; in other words, we should consider only those PA with staff and management. Sustainable Use.
Trends in marine (open sea) fisheries should be included. Ecosystem Integrity for Terrestrial Ecosystems, trends of
pollinators (major taxa) should be included.
���� Probably not, as not all indicators will be providing a trend but will rather provide a baseline. Also there needs to be
some clever analysis bringing a number of the indicators together, so as to develop a number of smaller pictures
���� Some of them need more details. It is also important not to be blinded by them, in the sense of keeping an eye on the
ultimate goal, which is the sustainable livelihoods of people.
���� I think that the indicators 2010 may provide information that may be useful for assessing the achievement of the
objectives established. The fact remains that the parties provide the necessary time and with precision.
����
There are only few indicators under the Focal area "threats to biodiversity". Many threats are of course covered in the
other focal areas. I am not very familiar with the indicator development process under the CBD, but at a quick glance
there seems to be unevenness. In the above mentioned focal area, for instance, I miss an indicator related to hazardous
substances.
���� Yes, I think that the indicators are reasonable. It is always possible to add more, but there is usually a significant time and
cost involved in tracking each indicator, so the list should be as short as possible (but not shorter)
���� Yes, however they are very broad and it will be difficult to compare results across regions at a meaningful scale.
����
Yes - indicators are sufficient in number and content. However, the indicators are generally "lagging indicators" and are
measures of what has already happened. It would be useful to have a few leading indicators i.e. planned measures to
halt the decline in Biodiversity e.g., Number of countries with specific legislation in place or planned; areas proposed for
protection.
���� I believe it may be sufficient but it is difficult to tell from the way they are currently articulated i.e. incomplete sentences
with very little/no indication of the exact manner in which they will be quantified/qualified.

Post-2010 Biodiversity Indicators Workshop Report – Reading, UK, July 2009
Page | 46
Su
ffic
ien
t
Question1: Is the set of 2010 indicators sufficient to provide information on achieving the CBD 2010 Goals and
Targets? If not, why not?
����
The set is certainly helpful in drawing conclusions on the achievement of the 2010 goals and targets. While an "all
embracing" set with more indicators would be desirable in a perfect world, the current set provides a very good basis to
assess trends and status in biodiversity. The biggest challenge for the assessment of the 2010 target is to my
understanding not the set of indicators but the lack of capacity on a global level to gain reliable long-time data to fill
these indicators with life. This needs to be improved over the next years. On the other hand some new and additional
indicators might have to be added to the set. If trade-offs have to be made between the comprehensiveness of the set of
indicators and the operationalisation of the current set it would opt for the later.
����
Yes, it would be if we were already measuring all of them and if agreed baselines had been established. That is clearly
not the case and perhaps we should be aiming for a strong baseline to use as the foundation of monitoring a post-2010
framework
����
I think the indicators are comprehensive and well thought through, though the problem will be making them specific
enough to be meaningful. Under threats to biodiversity I think 'habitat conversion' could be added (even though this
information is implicitly collected under the first indicator under 'status and trends of the components of biological
diversity). I really like the indicator 'proportion of products sourced from sustainable sources' - under 'status of access
and benefit sharing' could an indicator be added such as 'the number of community-corporate resource management
partnerships'
����
In general, the answer is yes, it is as good as the underlying data allow. It is particularly weak in reflecting the status of
freshwater and marine biodiversity, but this is a limitation of the underlying data, not of the indicators themselves. If one
takes into consideration the differences among the seven focal areas of the 2010 target, it is clear that the level of
development of “social indicators” – under focal areas “status of traditional knowledge, innovation and practices” as
well as “status of access and benefit sharing” – is rather low. It is also true that some indicators considered ready for
immediate use and testing will benefit from increased efforts and development.
����
No. Under Focal Area "Status and Trends of the Components of Biological Diversity" and Focal Area “Status of resource
transfers” there should be indicators measuring: inter-institutional cooperation for CBD implementation, cooperation
between institutions responsible for CBD implementation and reporting and interested stakeholders (civil society,
businesses, research and media); resources spent of GDP for biodiversity targets implementation as a % of GDP and their
effectiveness (e.g. number of protected areas established, number of management plans, number of species taken out
from the IUCN Red list, etc.); resources spent on establishment of national biodiversity monitoring systems and their
effectiveness.
����
First, the "Goals and Targets" give a rather incomplete answer to the fundamental "rate of biodiversity loss" question. It
would be possible (theoretically) to successfully hit these goals and targets without significantly slowing the loss of
biodiversity in most of the world's (managed) ecosystems. The existing "goals and targets" do not give a basis for a
comprehensive system of "state" indicators. Given this limitation the current set of proposed indicators does have
potential to provide information on achieving the "goals and targets". To my mind the crucial section is on "ecosystem
integrity", and here the indicators are still in development. The answer to the above question depends on how fully the
"trophic integrity of other ecosystems" indicators are developed.
���� My particular interest is in the "Trends in genetic diversity of domesticated animals, cultivated plants, and fish species of
major socioeconomic importance" and I do not feel sufficient detail has been provided to assess the indicator. For the

Post-2010 Biodiversity Indicators Workshop Report – Reading, UK, July 2009
Page | 47
Su
ffic
ien
t
Question1: Is the set of 2010 indicators sufficient to provide information on achieving the CBD 2010 Goals and
Targets? If not, why not?
plant indicator the three sub-indicators identified: a. The quantity of accessions, genera, species, and crops conserved in
ex situ collections; b. The quality of ex situ collections; c. Capacity to conserve crop genetic diversity in ex situ collections
in terms of conservation facilities and human resources. Only a. provides an assessment for the Trend and numbers
could increase or decrease without reference to any form of threat so it is not a very robust indicator.
���� Threats to biodiversity - does not include loss of habitat; does not include overhunting. These are the main threats
alongside exotics and climate change (although the latter is still being worked out).
����
In the area of species loss not. We still have no tools to measure and monitor directly the dynamics of species. The
necessary infrastructure is only slowly being build up (e.g., GBIF), tools to collect in a standardized way new specimen
data are not established in most of the world, the sociological changes to share data are not implemented, and
conservation is still too individualistic and not up to date to modern possibilities offered through the Internet. Indirect
observations tools, such as remote sensing data is though increasingly available and could be a very important part to
build up evidence based tools rather than inferred.
����
No. Status and trends does not differentiate natural from artificially created (GMO) biodiversity. Threats considers N
and alien species, but not toxic pollutants (e.g., As, He, U; DDT and other pesticides; possibly emergent nanoparticles;
petrochemical, persistent organic chemicals, and other contaminants), habitat modifiers (e.g., agro-forestry monocrops,
paved/impervious surfaces, drained wetlands, explosion-wrecked coral reefs, mountain top-removing strip mines, etc.),
or resource depletion degraders (e.g., industrial bioprospecting) Ecosystem services does not consider contaminated
(e.g., US superfund, former nuclear testing sites), quarantined or boobytrapped (e.g., Korean DMZ) ecosystems where
humans cannot fully extract such services. Traditional knowledge misses the legal allocation of land and resource usage
to traditional users (e.g., indigenous communities of Amazon forest region).
����
The focal areas and provisional indicators are reasonable given the types of information required to develop a
reasonable proxy for the state of biodiversity - particularly given current constraints in the availability of data. What is
primarily missing, however, are clear standards for the collection of data, which can be evenly applied across all
jurisdictions.
����
The current indicators - and in particular data availability - are reasonably well suited to provide information on trends
for Goal 1 (Targets 1.1. and 1.2), Goal 2 (Target 2.2), Goal 4 (4.3), Goal 5 (Target 5.1), Goal 6 (Targets 6.1 and 6.2), and
Goal 7 (Target 7.2). Information/data regarding the other Goals and Targets are insufficient. As the majority of these
touch on socio-economic issues which are difficult to disentangle from direct indicators of the state of biodiversity, it will
be difficult to develop completely empirical measures for these - and hence measures of progress would have to be
based on expert opinion.
����
A large amount of information will be generated by the indicators however the key will the how the indicators are
defined and the quality of the data used in compiling the indicators. If resources are limited fewer but better defined and
compiled indicators is the preference. Eliminating an indicator compiled with unreliable or insufficient data would be
better than a poorly calculated one.
���� It is unrealistic. Most indicators lack data in most countries. The only indicators for which data may be available are
those based on remote sensing.

Post-2010 Biodiversity Indicators Workshop Report – Reading, UK, July 2009
Page | 48
Su
ffic
ien
t
Question1: Is the set of 2010 indicators sufficient to provide information on achieving the CBD 2010 Goals and
Targets? If not, why not?
���� May also want to include goal and targets for increasing awareness of the need to protect biodiversity outside the
communities already focused on it (e.g., the public).
����
Status of access and benefit-sharing: there is a need to involve the private sector as it has such a significant influence on
other indicators. An additional indicator could be: percentage of corporations having and following an explicit
biodiversity strategy.
���� The indicators are ok; would be good to see more tangible relationship with UNFCCC.
����
In short, no. There are some of the targets that do not have indicators that link directly to them. For example target 6.1,
6.2 and 7.1. Although trends in alien species are an indicator this does not monitor whether pathways are controlled or
management plans are in place. I strongly suggest that the list of indicators is directly linked to the list of goals and
targets so that one can see where the gaps are.
����
Generally speaking yes, but some indicators have to be improved in detail and with respect to data quality; e.g. some
sub-indicators are available only for some parts of the world or some taxonomic groups; e.g. the Headline Indicator
“Trends in abundance and distribution of selected species” only covers vertebrate species, no invertebrates and no
plants at all. Conclusions drawn from this limited species set should be interpreted with caution with respect to the
question, if the 2010 target (as a whole) was achieved.
���� No, because it lack adequate spatial and temporal coverage both at the level of species and ecosystems.
-
Norway reports to the Pan European initiative, SEBI2010 (Streamlining European 2010 Biodiversity Indicators) that was
launched in 2004. This is a regional reporting initiative to the CBD indicators. Norway at present reports on the following
three indicators to the SEBI2010, and has so far only reviewed the capability of reporting to the 23 others. We would at
the moment not be ready to answer whether the set of 2010 indicators are sufficient to provide information on
achieving the CBD 2010 Goals and Targets.
����
In most cases, the 2010 indicators provide broad guidance on achieving the CBD Goals and Targets. It is noted that some
indicators remain in development. As they are retrospective, the data collected will provide general information about
the status of global biodiversity conservation. Gathering and generating information that could inform future trends and
outlook could be useful in anticipating changes that may impact on the achievement of the 2010 Goals and Targets.
Hence, this will inform strategy development accordingly.
����
The indicators have shown the main information to be achieved in each focal area. For example (i) trends in biomes,
ecosystems, and habitats, (ii) trends in abundance and distribution. Regarding the “coverage of protected areas”
indicator, while this may sufficient for Target 1.1, emphasize in the outcome of the PA management should become the
next target. The nature of Parties condition requires different indicators. Therefore, different sets of indicators might be
needed depends on the specific conditions of the Party.
����
The set of 22 indicators is too large and too broad to provide concise and useful information (see also our response
under Survey 5). Most of the work accomplished to date is too narrow in its scope (either biased geographically,
ecologically or towards certain groups of species) to give a full picture, or is too remote from the in-country situation to
give a detailed enough picture. Several of the indicators overlap within Focal Areas (e.g. Trends in abundance and
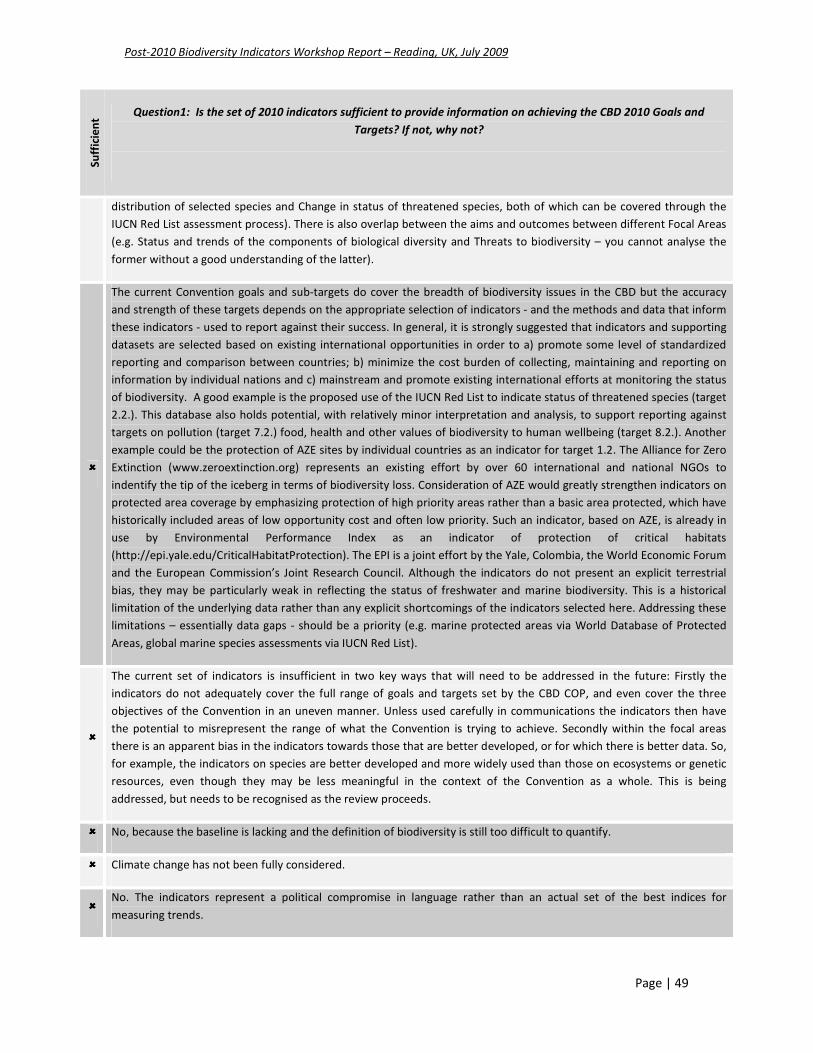
Post-2010 Biodiversity Indicators Workshop Report – Reading, UK, July 2009
Page | 49
Su
ffic
ien
t
Question1: Is the set of 2010 indicators sufficient to provide information on achieving the CBD 2010 Goals and
Targets? If not, why not?
distribution of selected species and Change in status of threatened species, both of which can be covered through the
IUCN Red List assessment process). There is also overlap between the aims and outcomes between different Focal Areas
(e.g. Status and trends of the components of biological diversity and Threats to biodiversity – you cannot analyse the
former without a good understanding of the latter).
����
The current Convention goals and sub-targets do cover the breadth of biodiversity issues in the CBD but the accuracy
and strength of these targets depends on the appropriate selection of indicators - and the methods and data that inform
these indicators - used to report against their success. In general, it is strongly suggested that indicators and supporting
datasets are selected based on existing international opportunities in order to a) promote some level of standardized
reporting and comparison between countries; b) minimize the cost burden of collecting, maintaining and reporting on
information by individual nations and c) mainstream and promote existing international efforts at monitoring the status
of biodiversity. A good example is the proposed use of the IUCN Red List to indicate status of threatened species (target
2.2.). This database also holds potential, with relatively minor interpretation and analysis, to support reporting against
targets on pollution (target 7.2.) food, health and other values of biodiversity to human wellbeing (target 8.2.). Another
example could be the protection of AZE sites by individual countries as an indicator for target 1.2. The Alliance for Zero
Extinction (www.zeroextinction.org) represents an existing effort by over 60 international and national NGOs to
indentify the tip of the iceberg in terms of biodiversity loss. Consideration of AZE would greatly strengthen indicators on
protected area coverage by emphasizing protection of high priority areas rather than a basic area protected, which have
historically included areas of low opportunity cost and often low priority. Such an indicator, based on AZE, is already in
use by Environmental Performance Index as an indicator of protection of critical habitats
(http://epi.yale.edu/CriticalHabitatProtection). The EPI is a joint effort by the Yale, Colombia, the World Economic Forum
and the European Commission’s Joint Research Council. Although the indicators do not present an explicit terrestrial
bias, they may be particularly weak in reflecting the status of freshwater and marine biodiversity. This is a historical
limitation of the underlying data rather than any explicit shortcomings of the indicators selected here. Addressing these
limitations – essentially data gaps - should be a priority (e.g. marine protected areas via World Database of Protected
Areas, global marine species assessments via IUCN Red List).
����
The current set of indicators is insufficient in two key ways that will need to be addressed in the future: Firstly the
indicators do not adequately cover the full range of goals and targets set by the CBD COP, and even cover the three
objectives of the Convention in an uneven manner. Unless used carefully in communications the indicators then have
the potential to misrepresent the range of what the Convention is trying to achieve. Secondly within the focal areas
there is an apparent bias in the indicators towards those that are better developed, or for which there is better data. So,
for example, the indicators on species are better developed and more widely used than those on ecosystems or genetic
resources, even though they may be less meaningful in the context of the Convention as a whole. This is being
addressed, but needs to be recognised as the review proceeds.
���� No, because the baseline is lacking and the definition of biodiversity is still too difficult to quantify.
���� Climate change has not been fully considered.
���� No. The indicators represent a political compromise in language rather than an actual set of the best indices for
measuring trends.
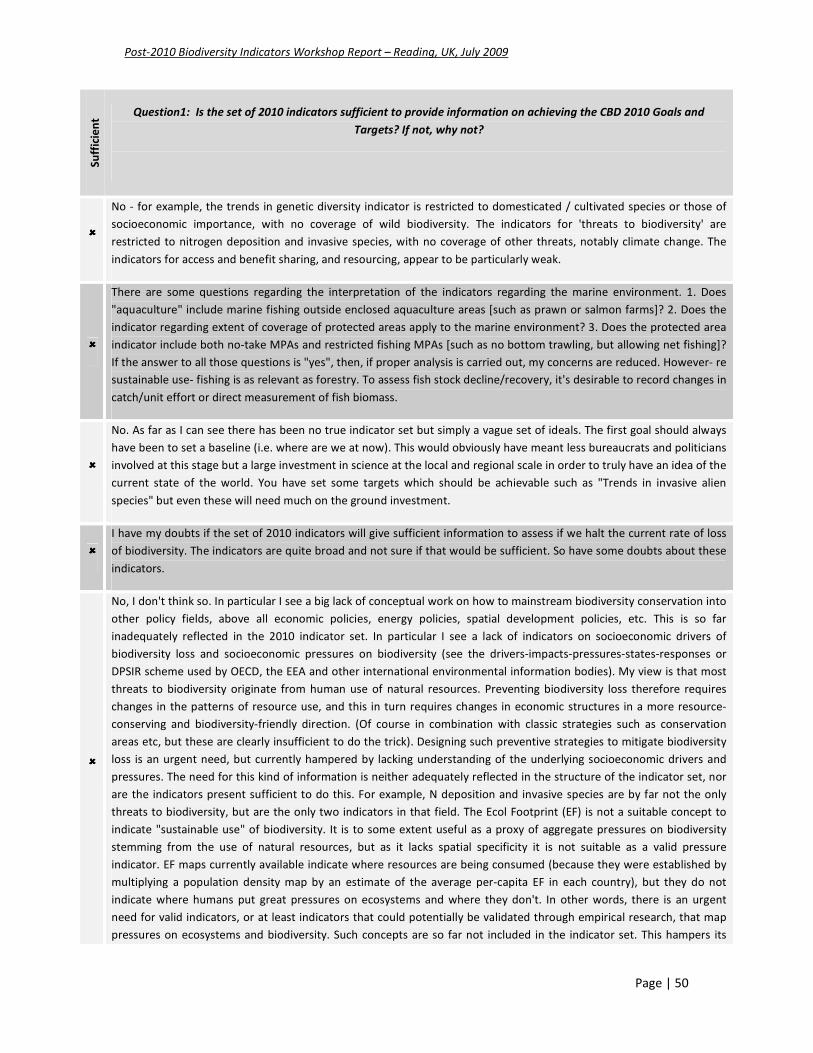
Post-2010 Biodiversity Indicators Workshop Report – Reading, UK, July 2009
Page | 50
Su
ffic
ien
t
Question1: Is the set of 2010 indicators sufficient to provide information on achieving the CBD 2010 Goals and
Targets? If not, why not?
����
No - for example, the trends in genetic diversity indicator is restricted to domesticated / cultivated species or those of
socioeconomic importance, with no coverage of wild biodiversity. The indicators for 'threats to biodiversity' are
restricted to nitrogen deposition and invasive species, with no coverage of other threats, notably climate change. The
indicators for access and benefit sharing, and resourcing, appear to be particularly weak.
����
There are some questions regarding the interpretation of the indicators regarding the marine environment. 1. Does
"aquaculture" include marine fishing outside enclosed aquaculture areas [such as prawn or salmon farms]? 2. Does the
indicator regarding extent of coverage of protected areas apply to the marine environment? 3. Does the protected area
indicator include both no-take MPAs and restricted fishing MPAs [such as no bottom trawling, but allowing net fishing]?
If the answer to all those questions is "yes", then, if proper analysis is carried out, my concerns are reduced. However- re
sustainable use- fishing is as relevant as forestry. To assess fish stock decline/recovery, it's desirable to record changes in
catch/unit effort or direct measurement of fish biomass.
����
No. As far as I can see there has been no true indicator set but simply a vague set of ideals. The first goal should always
have been to set a baseline (i.e. where are we at now). This would obviously have meant less bureaucrats and politicians
involved at this stage but a large investment in science at the local and regional scale in order to truly have an idea of the
current state of the world. You have set some targets which should be achievable such as "Trends in invasive alien
species" but even these will need much on the ground investment.
����
I have my doubts if the set of 2010 indicators will give sufficient information to assess if we halt the current rate of loss
of biodiversity. The indicators are quite broad and not sure if that would be sufficient. So have some doubts about these
indicators.
����
No, I don't think so. In particular I see a big lack of conceptual work on how to mainstream biodiversity conservation into
other policy fields, above all economic policies, energy policies, spatial development policies, etc. This is so far
inadequately reflected in the 2010 indicator set. In particular I see a lack of indicators on socioeconomic drivers of
biodiversity loss and socioeconomic pressures on biodiversity (see the drivers-impacts-pressures-states-responses or
DPSIR scheme used by OECD, the EEA and other international environmental information bodies). My view is that most
threats to biodiversity originate from human use of natural resources. Preventing biodiversity loss therefore requires
changes in the patterns of resource use, and this in turn requires changes in economic structures in a more resource-
conserving and biodiversity-friendly direction. (Of course in combination with classic strategies such as conservation
areas etc, but these are clearly insufficient to do the trick). Designing such preventive strategies to mitigate biodiversity
loss is an urgent need, but currently hampered by lacking understanding of the underlying socioeconomic drivers and
pressures. The need for this kind of information is neither adequately reflected in the structure of the indicator set, nor
are the indicators present sufficient to do this. For example, N deposition and invasive species are by far not the only
threats to biodiversity, but are the only two indicators in that field. The Ecol Footprint (EF) is not a suitable concept to
indicate "sustainable use" of biodiversity. It is to some extent useful as a proxy of aggregate pressures on biodiversity
stemming from the use of natural resources, but as it lacks spatial specificity it is not suitable as a valid pressure
indicator. EF maps currently available indicate where resources are being consumed (because they were established by
multiplying a population density map by an estimate of the average per-capita EF in each country), but they do not
indicate where humans put great pressures on ecosystems and where they don't. In other words, there is an urgent
need for valid indicators, or at least indicators that could potentially be validated through empirical research, that map
pressures on ecosystems and biodiversity. Such concepts are so far not included in the indicator set. This hampers its

Post-2010 Biodiversity Indicators Workshop Report – Reading, UK, July 2009
Page | 51
Su
ffic
ien
t
Question1: Is the set of 2010 indicators sufficient to provide information on achieving the CBD 2010 Goals and
Targets? If not, why not?
utility to provide information for preventive policies to reduce pressures on biodiversity.
����
No. Sustainable use indicators should also include, "Economic value from use of wild resources" These data are readily
obtained from participation and spending surveys, as done regularly by governments in USA, Canada and Finland, and
easy to arrange in EU by Eurostats through appropriate questions in Omnibus surveys.
����
Probably not. 1) There are not enough marine indicators. 2) The Marine Trophic Index is sensitive to sampling and
requires good knowledge of food web interactions. Size-based indicators are more easily collected and less error-prone
(Fulton et al 2005). 3) Target 7.1 (Maintain and enhance resilience of the components of biodiversity to adapt to climate
change) is not adequately addressed. Reference: Fulton, E. A., Smith, A. D. M., and Punt, A. E. 2005. Which ecological
indicators can robustly detect effects of fishing? ICES Journal of Marine Science, 62: 540-551.
rig
oro
us
log
ica
l
com
pre
he
nsi
ve
Question 2: To what extent is the set of 2010 indicators scientifically rigorous, logical and comprehensive?
���� ���� ���� Varies across the indicators set. The more advanced indicators (in terms of progress) are in general rigorous and
comprehensive. The less developed/undeveloped ones are yet to be proven
- - -
While scientific rigour is important, of more real importance is whether the indicator is meaningful to those
using it, and whether it is fit for purpose. The degree of scientific rigour required must be defined by these two
criteria.
���� ���� ���� Moderate, but probably the best we could do given the constraints.
���� ���� ����
Regarding the marine environment, it is not possible to assess the rigor, logic or comprehensiveness of the
indicators, unless detailed analysis of the questions I raised in Survey 1 is carried out. Under threats, it is
necessary to include measurements of changes in the following forces relating to the marine environment; 1.
temperature of seawater- critical to corals; 2. changes in nutrients and other pollutants run-off from land; 3. Ph
of water column- again, critical to corals and other organisms [as well as ability of the seas to absorb carbon
dioxide].
���� ���� ���� The set of 2010 indicators scientifically rigorous, logical and comprehensive is capacity building of mechanism
and institution for CBD.
- - ���� I cannot fully judge the scientifically rigorousness of all the indicators, but some of the indicators seem to be
difficult to understand to the 'general public' in terms of their way of describing 'the state of biodiversity'.
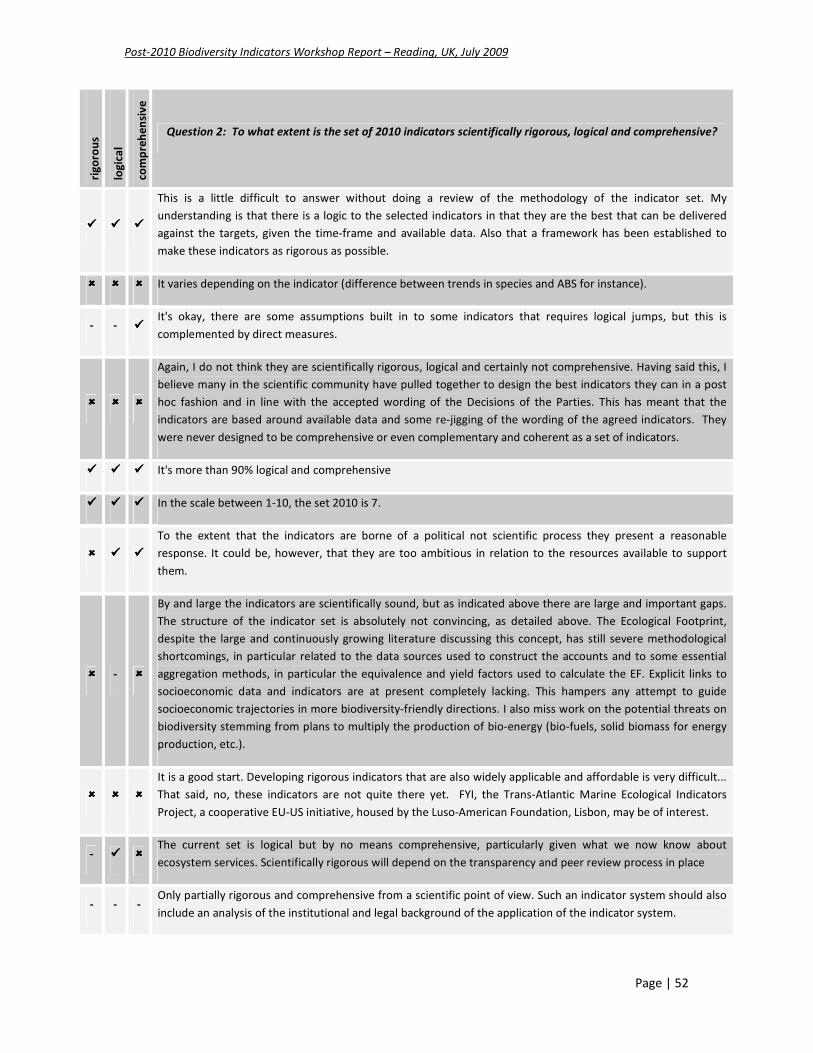
Post-2010 Biodiversity Indicators Workshop Report – Reading, UK, July 2009
Page | 52
rig
oro
us
log
ica
l
com
pre
he
nsi
ve
Question 2: To what extent is the set of 2010 indicators scientifically rigorous, logical and comprehensive?
���� ���� ����
This is a little difficult to answer without doing a review of the methodology of the indicator set. My
understanding is that there is a logic to the selected indicators in that they are the best that can be delivered
against the targets, given the time-frame and available data. Also that a framework has been established to
make these indicators as rigorous as possible.
���� ���� ���� It varies depending on the indicator (difference between trends in species and ABS for instance).
- - ���� It's okay, there are some assumptions built in to some indicators that requires logical jumps, but this is
complemented by direct measures.
���� ���� ����
Again, I do not think they are scientifically rigorous, logical and certainly not comprehensive. Having said this, I
believe many in the scientific community have pulled together to design the best indicators they can in a post
hoc fashion and in line with the accepted wording of the Decisions of the Parties. This has meant that the
indicators are based around available data and some re-jigging of the wording of the agreed indicators. They
were never designed to be comprehensive or even complementary and coherent as a set of indicators.
���� ���� ���� It's more than 90% logical and comprehensive
���� ���� ���� In the scale between 1-10, the set 2010 is 7.
���� ���� ����
To the extent that the indicators are borne of a political not scientific process they present a reasonable
response. It could be, however, that they are too ambitious in relation to the resources available to support
them.
���� - ����
By and large the indicators are scientifically sound, but as indicated above there are large and important gaps.
The structure of the indicator set is absolutely not convincing, as detailed above. The Ecological Footprint,
despite the large and continuously growing literature discussing this concept, has still severe methodological
shortcomings, in particular related to the data sources used to construct the accounts and to some essential
aggregation methods, in particular the equivalence and yield factors used to calculate the EF. Explicit links to
socioeconomic data and indicators are at present completely lacking. This hampers any attempt to guide
socioeconomic trajectories in more biodiversity-friendly directions. I also miss work on the potential threats on
biodiversity stemming from plans to multiply the production of bio-energy (bio-fuels, solid biomass for energy
production, etc.).
���� ���� ����
It is a good start. Developing rigorous indicators that are also widely applicable and affordable is very difficult...
That said, no, these indicators are not quite there yet. FYI, the Trans-Atlantic Marine Ecological Indicators
Project, a cooperative EU-US initiative, housed by the Luso-American Foundation, Lisbon, may be of interest.
- ���� ���� The current set is logical but by no means comprehensive, particularly given what we now know about
ecosystem services. Scientifically rigorous will depend on the transparency and peer review process in place
- - - Only partially rigorous and comprehensive from a scientific point of view. Such an indicator system should also
include an analysis of the institutional and legal background of the application of the indicator system.
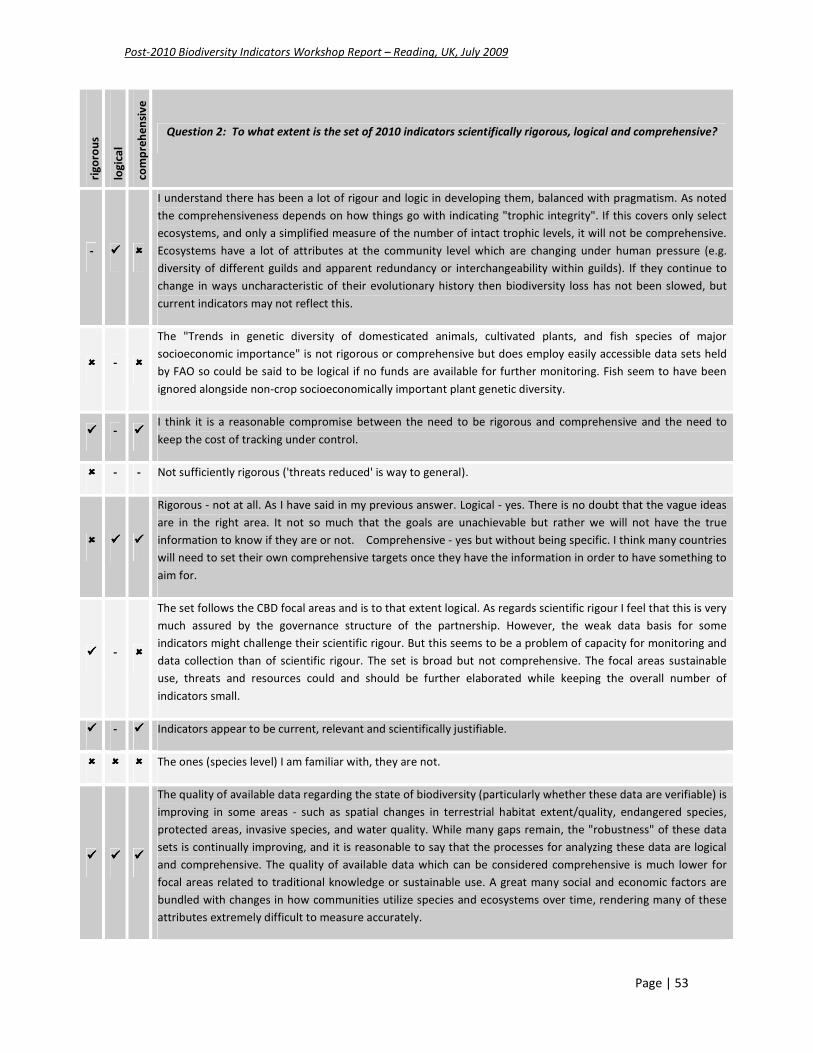
Post-2010 Biodiversity Indicators Workshop Report – Reading, UK, July 2009
Page | 53
rig
oro
us
log
ica
l
com
pre
he
nsi
ve
Question 2: To what extent is the set of 2010 indicators scientifically rigorous, logical and comprehensive?
- ���� ����
I understand there has been a lot of rigour and logic in developing them, balanced with pragmatism. As noted
the comprehensiveness depends on how things go with indicating "trophic integrity". If this covers only select
ecosystems, and only a simplified measure of the number of intact trophic levels, it will not be comprehensive.
Ecosystems have a lot of attributes at the community level which are changing under human pressure (e.g.
diversity of different guilds and apparent redundancy or interchangeability within guilds). If they continue to
change in ways uncharacteristic of their evolutionary history then biodiversity loss has not been slowed, but
current indicators may not reflect this.
���� - ����
The "Trends in genetic diversity of domesticated animals, cultivated plants, and fish species of major
socioeconomic importance" is not rigorous or comprehensive but does employ easily accessible data sets held
by FAO so could be said to be logical if no funds are available for further monitoring. Fish seem to have been
ignored alongside non-crop socioeconomically important plant genetic diversity.
���� - ���� I think it is a reasonable compromise between the need to be rigorous and comprehensive and the need to
keep the cost of tracking under control.
���� - - Not sufficiently rigorous ('threats reduced' is way to general).
���� ���� ����
Rigorous - not at all. As I have said in my previous answer. Logical - yes. There is no doubt that the vague ideas
are in the right area. It not so much that the goals are unachievable but rather we will not have the true
information to know if they are or not. Comprehensive - yes but without being specific. I think many countries
will need to set their own comprehensive targets once they have the information in order to have something to
aim for.
���� - ����
The set follows the CBD focal areas and is to that extent logical. As regards scientific rigour I feel that this is very
much assured by the governance structure of the partnership. However, the weak data basis for some
indicators might challenge their scientific rigour. But this seems to be a problem of capacity for monitoring and
data collection than of scientific rigour. The set is broad but not comprehensive. The focal areas sustainable
use, threats and resources could and should be further elaborated while keeping the overall number of
indicators small.
���� - ���� Indicators appear to be current, relevant and scientifically justifiable.
���� ���� ���� The ones (species level) I am familiar with, they are not.
���� ���� ����
The quality of available data regarding the state of biodiversity (particularly whether these data are verifiable) is
improving in some areas - such as spatial changes in terrestrial habitat extent/quality, endangered species,
protected areas, invasive species, and water quality. While many gaps remain, the "robustness" of these data
sets is continually improving, and it is reasonable to say that the processes for analyzing these data are logical
and comprehensive. The quality of available data which can be considered comprehensive is much lower for
focal areas related to traditional knowledge or sustainable use. A great many social and economic factors are
bundled with changes in how communities utilize species and ecosystems over time, rendering many of these
attributes extremely difficult to measure accurately.

Post-2010 Biodiversity Indicators Workshop Report – Reading, UK, July 2009
Page | 54
rig
oro
us
log
ica
l
com
pre
he
nsi
ve
Question 2: To what extent is the set of 2010 indicators scientifically rigorous, logical and comprehensive?
- - ���� Indicators for the goals and targets are reasonably comprehensive and rigorous - and are improving steadily.
Indicators for the others are not, in my opinion, scientifically rigorous.
- - - The indicators will depend on the comprehensive and reliable data collection equally distributed across all
regions.
- ���� ����
They lack explicit recognition that biodiversity components, structure, functioning and stakeholders are scale-
dependent: "trends in abundance and distributions of selected species" Distribution is a scale-dependent
concept. It begs the question of what at what extents and resolutions we are talking about. Imagine a report on
the same species, shared in Mexico, reported at 1:64,000,000 and Costa Rica, reported at 1:100,000. It is
impossible to compare the results. Others are too vague: "Status and trends of linguistic diversity and numbers
of speakers of indigenous languages" Indigenous languages, like English or French? Or Japanese? Or Tagalo? Or
Bahasa? Or tribal languages...but where? In cities? Nahuatl is increasing in Mexico City... These indicators lack a
coherent framework and are to a large extent the result of meeting of non-experts.
- - - Need indicators relative to increasing awareness of the issues and their criticality to long-term healthy planet
stability.
���� ���� I believe the indicators are logical and comprehensive but they also might be a bit subjective because different
experts might evaluate same situation differently.
- - - The indicators are ok, but what about reliable data collection?
���� ���� ���� They are much too vague at the moment and operationalizing them will be extremely difficult, but in general I
think they are scientifically rigorous, logical and comprehensive.
���� ���� ���� Highly relevant and well coverage on the current affair/ issues
- ���� ����
The main problem I experience in this regard is that some of the indicators are quite vague. For example
"Trends in genetic diversity of domesticated animals..."; "Water quality of freshwater ecosystems" and
"Connectivity and fragmentation of ecosystems". These are all quite broad concepts which would need to be
made much more specific before they could be clearly measured. For example with genetic diversity what
exactly should one measure, is it heterozygosity in the population? If so, this is not very practical.
���� ���� ����
The overall set of indicators covers a wide range of components of biodiversity (biomes, habitats, species and
genetic diversity) and seems to be sound (some proposals for additions are given below). Scientific quality
strongly differ between indicators, especially with respect to representativeness, e.g. concerning the trends of
animal species; populations and species monitored often were not selected randomly; organism-related
indicators mainly focus on vertebrates and ignore other groups, especially plants; there is, in parts an overlap
between groups used simultaneously in different indicators (e.g. birds). Another shortcoming is the lack of clear
rules for - the update intervals of the indicators - defining target values or thresholds (e.g. what exactly is a
“significant” reduction in the loss of biodiversity?) for the indicators.
���� ���� ���� I think they do a good job in those components considering the data that is currently available, but much more

Post-2010 Biodiversity Indicators Workshop Report – Reading, UK, July 2009
Page | 55
rig
oro
us
log
ica
l
com
pre
he
nsi
ve
Question 2: To what extent is the set of 2010 indicators scientifically rigorous, logical and comprehensive?
could be done if a true global biodiversity observation system was put into place.
���� ����
In aspect of logical, indicators are good. I think it’s better that we prepare more facilities for developing
countries because in these countries there are many legal issues; in summary I can say that the indicators are
comprehensive.
���� - -
A number of the 2010 indicators (for example, nitrogen deposition, trends in invasive alien species, area of
forest, agricultural and aquaculture ecosystems under sustainable management) are generally accepted
mechanisms with which to measure the impact on biodiversity. The practicality of measuring some indicators
may be difficult in implementation, particularly where a country(ies) may not provide the information required
for the indicator measure. The rigour of the data supplied towards these indicators by a country(ies) relies on
the use of scientifically accurate measurement techniques with the result that quality may vary country by
country. Some qualitative indicators are more difficult to measure (for example, status of traditional
knowledge, innovations and practices) and may not provide for quantitative analysis. Whilst results from these
qualitative indicators are acceptable, they may be easily challenged.
���� ���� ����
“Nitrogen deposition” and “Trends in invasive alien species” are not enough to measure all different threats to
biodiversity. Some other indicators, like “Health and well-being of communities who depend directly on local
ecosystem goods and services” may be differently interpreted and it is difficult to provide data as they are not
specific and concrete enough. Otherwise, they are logical and quite comprehensive.
���� - -
From the scientific point of view, the indicators provide the “what” to measure. In order to be scientifically
robust, the data/information and the methodology of measurement need to be verifiable. Therefore a
methodology framework that regards Party capacity should be made available. The differences in the capacity
of the Party to monitor and implement also seems to be overlooked from the indicators.
���� ����
It is hard to evaluate scientific rigor at the level of the entire set of indicators: this is better judged at the level of
individual indicators (many of which are yet to be developed). However, the set of 2010 indicators is generally
logical and comprehensive.
���� ���� ����
Many of the indicators chosen have the potential to be rigorous and logical and, if full data coverage and
analysis were to be achieved for all the indicators, comprehensive. However, the multiplicity of indicators and
the dearth of dedicated funding for achieving full coverage for any indicator has meant that there has been
insufficient time and resources to complete much work that would have been desirable. Thus the world view
provided by the work accomplished so far for many of the individual indicators may not be scientifically
rigorous, logical or comprehensive, and thus the results presented from the whole set of indicators will itself
not be rigorous, logical and comprehensive. A more successful strategy would have been to invest adequately
in a smaller number of well-designed indicators that were each rigorous, logical, defined in scope and, above
all, achievable. For example, work on the IUCN Sampled Red List Index (SRLI) indicator is being used to
measure ‘Changes in status of threatened species’, with scope also to measure ‘Trends in abundance and
distribution of selected species’. Work towards the SRLI has been rigorous, logical, globally comprehensive and
taxonomically inclusive, because the project was designed specifically for this purpose four years ago. A great
deal of new data gathering, methodology development and analysis have been undertaken for this project
explicitly for the purpose of measuring progress towards the 2010 Biodiversity Target. Progress has been
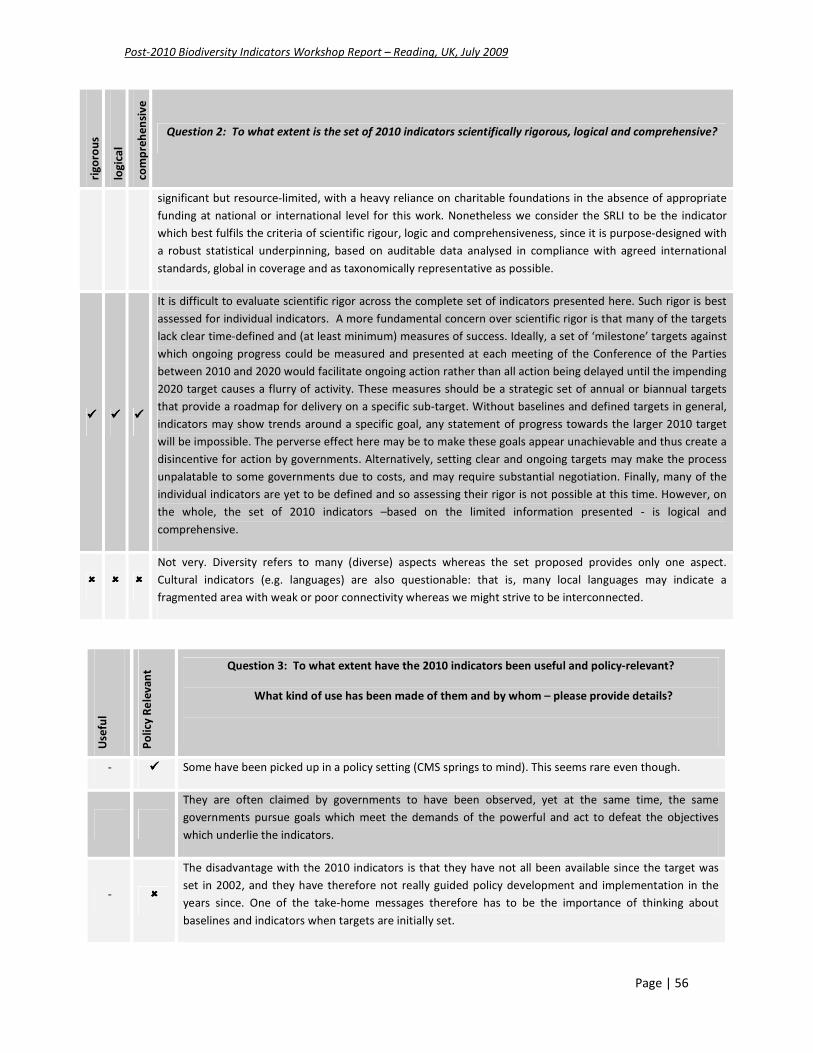
Post-2010 Biodiversity Indicators Workshop Report – Reading, UK, July 2009
Page | 56
rig
oro
us
log
ica
l
com
pre
he
nsi
ve
Question 2: To what extent is the set of 2010 indicators scientifically rigorous, logical and comprehensive?
significant but resource-limited, with a heavy reliance on charitable foundations in the absence of appropriate
funding at national or international level for this work. Nonetheless we consider the SRLI to be the indicator
which best fulfils the criteria of scientific rigour, logic and comprehensiveness, since it is purpose-designed with
a robust statistical underpinning, based on auditable data analysed in compliance with agreed international
standards, global in coverage and as taxonomically representative as possible.
���� ���� ����
It is difficult to evaluate scientific rigor across the complete set of indicators presented here. Such rigor is best
assessed for individual indicators. A more fundamental concern over scientific rigor is that many of the targets
lack clear time-defined and (at least minimum) measures of success. Ideally, a set of ‘milestone’ targets against
which ongoing progress could be measured and presented at each meeting of the Conference of the Parties
between 2010 and 2020 would facilitate ongoing action rather than all action being delayed until the impending
2020 target causes a flurry of activity. These measures should be a strategic set of annual or biannual targets
that provide a roadmap for delivery on a specific sub-target. Without baselines and defined targets in general,
indicators may show trends around a specific goal, any statement of progress towards the larger 2010 target
will be impossible. The perverse effect here may be to make these goals appear unachievable and thus create a
disincentive for action by governments. Alternatively, setting clear and ongoing targets may make the process
unpalatable to some governments due to costs, and may require substantial negotiation. Finally, many of the
individual indicators are yet to be defined and so assessing their rigor is not possible at this time. However, on
the whole, the set of 2010 indicators –based on the limited information presented - is logical and
comprehensive.
���� ���� ����
Not very. Diversity refers to many (diverse) aspects whereas the set proposed provides only one aspect.
Cultural indicators (e.g. languages) are also questionable: that is, many local languages may indicate a
fragmented area with weak or poor connectivity whereas we might strive to be interconnected.
Use
ful
Po
licy
Re
lev
an
t Question 3: To what extent have the 2010 indicators been useful and policy-relevant?
What kind of use has been made of them and by whom – please provide details?
- ���� Some have been picked up in a policy setting (CMS springs to mind). This seems rare even though.
They are often claimed by governments to have been observed, yet at the same time, the same
governments pursue goals which meet the demands of the powerful and act to defeat the objectives
which underlie the indicators.
- ����
The disadvantage with the 2010 indicators is that they have not all been available since the target was
set in 2002, and they have therefore not really guided policy development and implementation in the
years since. One of the take-home messages therefore has to be the importance of thinking about
baselines and indicators when targets are initially set.

Post-2010 Biodiversity Indicators Workshop Report – Reading, UK, July 2009
Page | 57
Use
ful
Po
licy
Re
lev
an
t Question 3: To what extent have the 2010 indicators been useful and policy-relevant?
What kind of use has been made of them and by whom – please provide details?
���� - Not very useful, as most of us use other indicators for assessing progress, and use these indicators to
show other signs of progress than the 2010 target.
- -
Many of the indicators are still under development and the results yet to be published. Thus it's rather
premature to comment on their use and policy relevance. The proof will be how well they (as a set)
inform progress against the 2010 target. Having said that, some of the better established indicators have
already been shown to be very useful. For example, the European Wild Bird Indicator is being used to
inform the review of the EU Common Agricultural Policy.
- -
Indicators classified as ready for testing have been policy relevant in as much as they have been
"publicized" and used to raise awareness beyond their constituency. The Biodiversity Indicators
Partnership has been in that respect key for this purpose although the way in which it functions and the
way in which its products reach out to a wider audience can be improved. Definitely, this has been
limited to decision makers and scientists mostly in the CBD realm.
���� ����
In China, it has been a useful process, at least for awareness raising but still limited to academics largely,
so up till now not policy-relevant, so this significant challenge remains. For example China is currently
revising its NBSAP but the 2010 indicators are not used as targets. Currently neither NBSAP nor 2010
targets are used in environmental planning exercises but there is at least discussion on this, since we are
approaching a five year planning period. Mainly it has been used by the Dept of Nature Conservation in
Ministry of Environmental Protection and its associated institutes, but has not reached across ministries
where data is needed, such as agriculture, forestry, though there is some consultation here. They can be
seen as a "bridge" to China developing a set of longer-term biodiversity monitoring indicators.
���� -
I do think the indicators have had some utility in the policy realm. If nothing else, they have drawn
attention to the fact that we do not have reliable data sets for measuring changes in biodiversity at local,
national, regional and global levels - or at least very, very few which are likely biased by sampling
distribution. I think that Europe used the indicators process to bring high profile to the issue of
biodiversity loss and even though they, too, have been unable to meet the 2010 target, at least they have
raised considerable awareness around this. Probably the Countdown 2010 Campaign also helped with all
this. Lastly, the indicator work has brought together a set of players who have an interest in indicator
work - their development and the compilation of the underlying data sets. While there is still not
harmonisation among the many entities, there is in fact a lot more exchange of thought and in the future
I think the community would be able to do a far better job - the politics of the Parties notwithstanding.
Perhaps if the scientific community could come to better agreement on the indicators, and provide the
data, then policy and decision-makers would be less able to obfuscate on their responsibilities and
obligations under the MEAS. It would be excellent if there could be more harmonisation of efforts across
MEAs as well.
���� -
It's very useful for decision making and is also policy-relevant, especially regarding focal areas number
1,2 and 4, decision makers can use those in programming and also for developing the National
Development Plan.
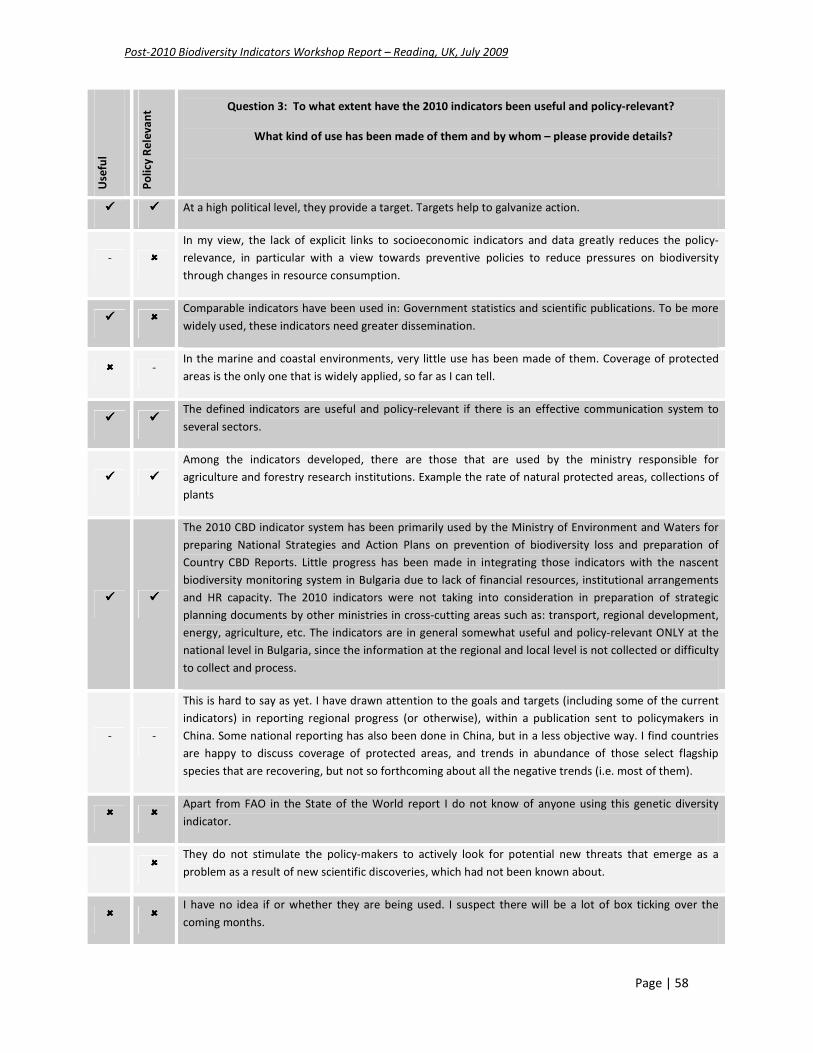
Post-2010 Biodiversity Indicators Workshop Report – Reading, UK, July 2009
Page | 58
Use
ful
Po
licy
Re
lev
an
t Question 3: To what extent have the 2010 indicators been useful and policy-relevant?
What kind of use has been made of them and by whom – please provide details?
���� ���� At a high political level, they provide a target. Targets help to galvanize action.
- ����
In my view, the lack of explicit links to socioeconomic indicators and data greatly reduces the policy-
relevance, in particular with a view towards preventive policies to reduce pressures on biodiversity
through changes in resource consumption.
���� ���� Comparable indicators have been used in: Government statistics and scientific publications. To be more
widely used, these indicators need greater dissemination.
���� - In the marine and coastal environments, very little use has been made of them. Coverage of protected
areas is the only one that is widely applied, so far as I can tell.
���� ���� The defined indicators are useful and policy-relevant if there is an effective communication system to
several sectors.
���� ����
Among the indicators developed, there are those that are used by the ministry responsible for
agriculture and forestry research institutions. Example the rate of natural protected areas, collections of
plants
���� ����
The 2010 CBD indicator system has been primarily used by the Ministry of Environment and Waters for
preparing National Strategies and Action Plans on prevention of biodiversity loss and preparation of
Country CBD Reports. Little progress has been made in integrating those indicators with the nascent
biodiversity monitoring system in Bulgaria due to lack of financial resources, institutional arrangements
and HR capacity. The 2010 indicators were not taking into consideration in preparation of strategic
planning documents by other ministries in cross-cutting areas such as: transport, regional development,
energy, agriculture, etc. The indicators are in general somewhat useful and policy-relevant ONLY at the
national level in Bulgaria, since the information at the regional and local level is not collected or difficulty
to collect and process.
- -
This is hard to say as yet. I have drawn attention to the goals and targets (including some of the current
indicators) in reporting regional progress (or otherwise), within a publication sent to policymakers in
China. Some national reporting has also been done in China, but in a less objective way. I find countries
are happy to discuss coverage of protected areas, and trends in abundance of those select flagship
species that are recovering, but not so forthcoming about all the negative trends (i.e. most of them).
���� ���� Apart from FAO in the State of the World report I do not know of anyone using this genetic diversity
indicator.
���� They do not stimulate the policy-makers to actively look for potential new threats that emerge as a
problem as a result of new scientific discoveries, which had not been known about.
���� ���� I have no idea if or whether they are being used. I suspect there will be a lot of box ticking over the
coming months.
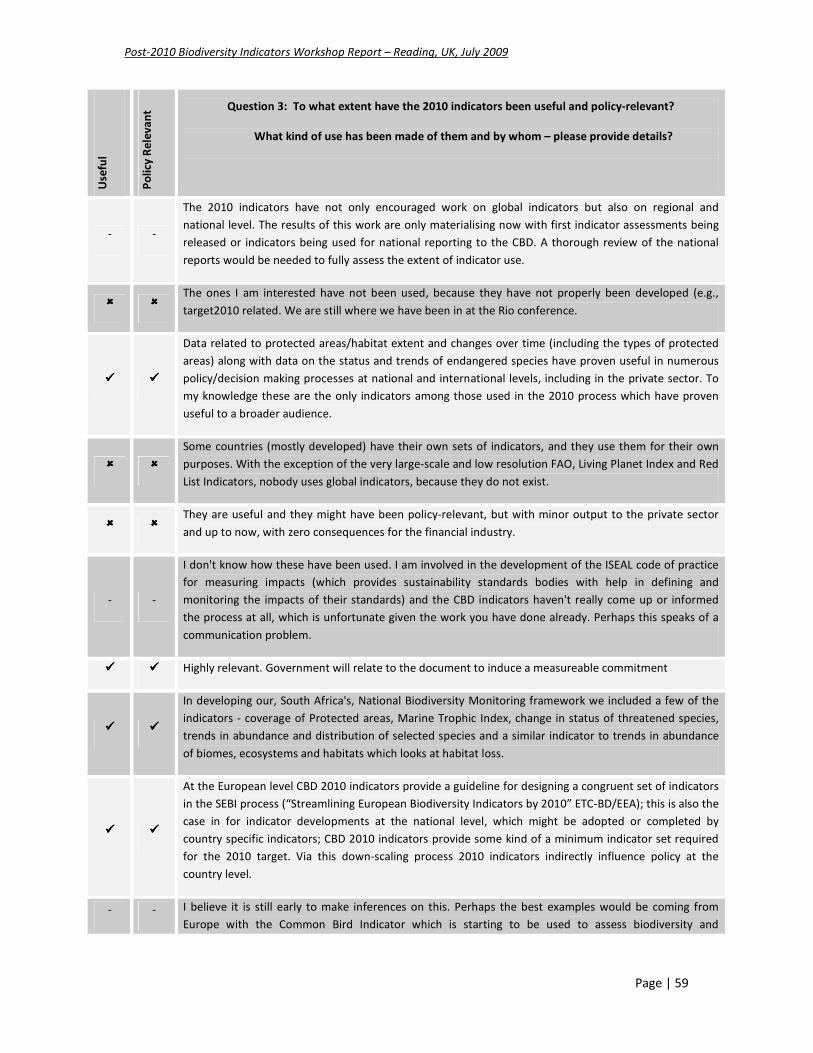
Post-2010 Biodiversity Indicators Workshop Report – Reading, UK, July 2009
Page | 59
Use
ful
Po
licy
Re
lev
an
t Question 3: To what extent have the 2010 indicators been useful and policy-relevant?
What kind of use has been made of them and by whom – please provide details?
- -
The 2010 indicators have not only encouraged work on global indicators but also on regional and
national level. The results of this work are only materialising now with first indicator assessments being
released or indicators being used for national reporting to the CBD. A thorough review of the national
reports would be needed to fully assess the extent of indicator use.
���� ���� The ones I am interested have not been used, because they have not properly been developed (e.g.,
target2010 related. We are still where we have been in at the Rio conference.
���� ����
Data related to protected areas/habitat extent and changes over time (including the types of protected
areas) along with data on the status and trends of endangered species have proven useful in numerous
policy/decision making processes at national and international levels, including in the private sector. To
my knowledge these are the only indicators among those used in the 2010 process which have proven
useful to a broader audience.
���� ����
Some countries (mostly developed) have their own sets of indicators, and they use them for their own
purposes. With the exception of the very large-scale and low resolution FAO, Living Planet Index and Red
List Indicators, nobody uses global indicators, because they do not exist.
���� ���� They are useful and they might have been policy-relevant, but with minor output to the private sector
and up to now, with zero consequences for the financial industry.
- -
I don't know how these have been used. I am involved in the development of the ISEAL code of practice
for measuring impacts (which provides sustainability standards bodies with help in defining and
monitoring the impacts of their standards) and the CBD indicators haven't really come up or informed
the process at all, which is unfortunate given the work you have done already. Perhaps this speaks of a
communication problem.
���� ���� Highly relevant. Government will relate to the document to induce a measureable commitment
���� ����
In developing our, South Africa's, National Biodiversity Monitoring framework we included a few of the
indicators - coverage of Protected areas, Marine Trophic Index, change in status of threatened species,
trends in abundance and distribution of selected species and a similar indicator to trends in abundance
of biomes, ecosystems and habitats which looks at habitat loss.
���� ����
At the European level CBD 2010 indicators provide a guideline for designing a congruent set of indicators
in the SEBI process (“Streamlining European Biodiversity Indicators by 2010” ETC-BD/EEA); this is also the
case in for indicator developments at the national level, which might be adopted or completed by
country specific indicators; CBD 2010 indicators provide some kind of a minimum indicator set required
for the 2010 target. Via this down-scaling process 2010 indicators indirectly influence policy at the
country level.
- - I believe it is still early to make inferences on this. Perhaps the best examples would be coming from
Europe with the Common Bird Indicator which is starting to be used to assess biodiversity and
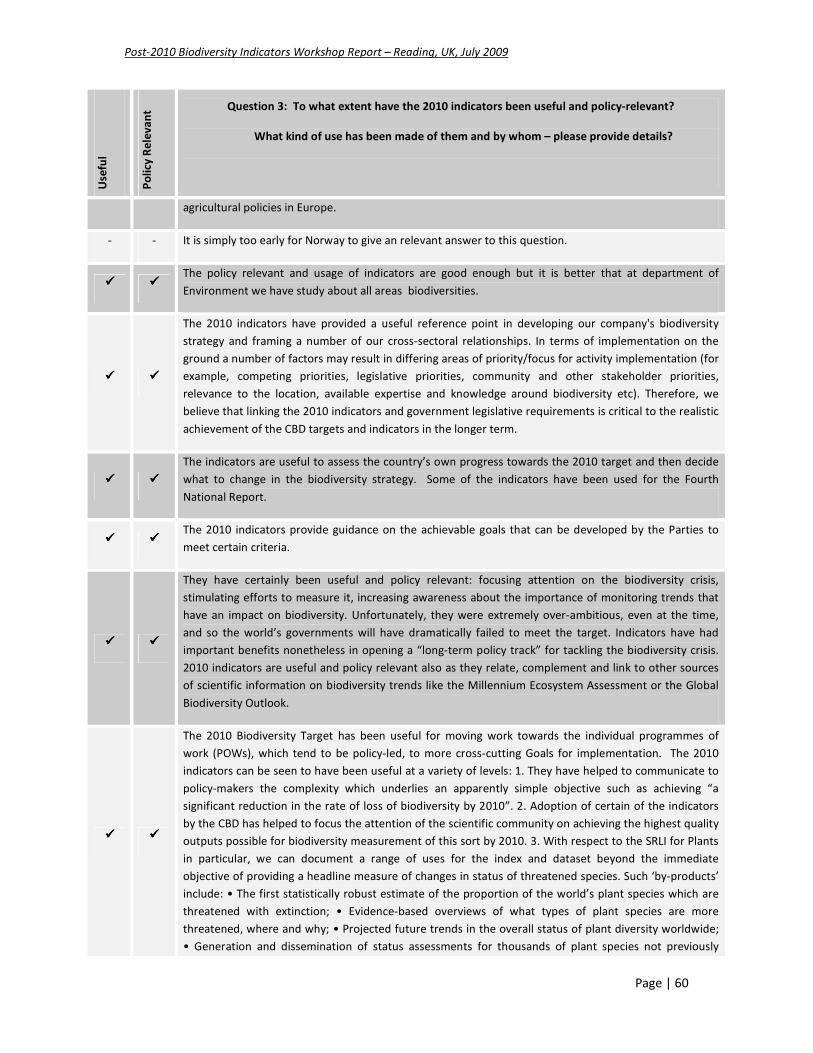
Post-2010 Biodiversity Indicators Workshop Report – Reading, UK, July 2009
Page | 60
Use
ful
Po
licy
Re
lev
an
t Question 3: To what extent have the 2010 indicators been useful and policy-relevant?
What kind of use has been made of them and by whom – please provide details?
agricultural policies in Europe.
- - It is simply too early for Norway to give an relevant answer to this question.
���� ���� The policy relevant and usage of indicators are good enough but it is better that at department of
Environment we have study about all areas biodiversities.
���� ����
The 2010 indicators have provided a useful reference point in developing our company's biodiversity
strategy and framing a number of our cross-sectoral relationships. In terms of implementation on the
ground a number of factors may result in differing areas of priority/focus for activity implementation (for
example, competing priorities, legislative priorities, community and other stakeholder priorities,
relevance to the location, available expertise and knowledge around biodiversity etc). Therefore, we
believe that linking the 2010 indicators and government legislative requirements is critical to the realistic
achievement of the CBD targets and indicators in the longer term.
���� ����
The indicators are useful to assess the country’s own progress towards the 2010 target and then decide
what to change in the biodiversity strategy. Some of the indicators have been used for the Fourth
National Report.
���� ���� The 2010 indicators provide guidance on the achievable goals that can be developed by the Parties to
meet certain criteria.
���� ����
They have certainly been useful and policy relevant: focusing attention on the biodiversity crisis,
stimulating efforts to measure it, increasing awareness about the importance of monitoring trends that
have an impact on biodiversity. Unfortunately, they were extremely over-ambitious, even at the time,
and so the world’s governments will have dramatically failed to meet the target. Indicators have had
important benefits nonetheless in opening a “long-term policy track” for tackling the biodiversity crisis.
2010 indicators are useful and policy relevant also as they relate, complement and link to other sources
of scientific information on biodiversity trends like the Millennium Ecosystem Assessment or the Global
Biodiversity Outlook.
���� ����
The 2010 Biodiversity Target has been useful for moving work towards the individual programmes of
work (POWs), which tend to be policy-led, to more cross-cutting Goals for implementation. The 2010
indicators can be seen to have been useful at a variety of levels: 1. They have helped to communicate to
policy-makers the complexity which underlies an apparently simple objective such as achieving “a
significant reduction in the rate of loss of biodiversity by 2010”. 2. Adoption of certain of the indicators
by the CBD has helped to focus the attention of the scientific community on achieving the highest quality
outputs possible for biodiversity measurement of this sort by 2010. 3. With respect to the SRLI for Plants
in particular, we can document a range of uses for the index and dataset beyond the immediate
objective of providing a headline measure of changes in status of threatened species. Such ‘by-products’
include: • The first statistically robust estimate of the proportion of the world’s plant species which are
threatened with extinction; • Evidence-based overviews of what types of plant species are more
threatened, where and why; • Projected future trends in the overall status of plant diversity worldwide;
• Generation and dissemination of status assessments for thousands of plant species not previously

Post-2010 Biodiversity Indicators Workshop Report – Reading, UK, July 2009
Page | 61
Use
ful
Po
licy
Re
lev
an
t Question 3: To what extent have the 2010 indicators been useful and policy-relevant?
What kind of use has been made of them and by whom – please provide details?
assessed which will help inform conservation management plans and make a very significant contribution
to Target 2 of the Global Strategy for Plant Conservation; • The elements which comprise the SRLI can be
disaggregated to generate a geographically-restricted view for a region or country of interest, a facility
which appears to be of growing interest to colleagues overseas as 2010 approaches and the dearth of
other comprehensive assessments become apparent; • A representative dataset on plant distributions
and occurrences as the basis for further research activities, such as the potential impact of future climate
change. In the future, for the indicators to be more globally policy relevant, they should be
mainstreamed into national strategies and made more widely policy relevant by focusing on issues such
as poverty alleviation and development through conservation of valuable ecosystem services. Use of the
2010 Indicators and details of users. Little use has been made of the aggregated results of the overall
SRLI as yet, since work is still ongoing to deliver the first comprehensive product, against a very
challenging timeline and with significant funding constraints. However, comprehensive assessments of all
bird, amphibian and also mammal species have been published in the last few years and have received
major attention in both the scientific and the mainstream media; these groups also all contribute
towards the larger SRLI project to provide a representative status assessment for all biodiversity. With
regard to the use of other indicators, the Living Planet Index, for example, is often cited and reproduced
(e.g. in a recent lecture on Climate Change and Biodiversity by the Government’s Chief Scientist) but all
too often this is done with no reference to its limitations in terms of taxonomic or geographic coverage.
Thus population trends in a non-random and unrepresentative set of vertebrates from (mostly)
temperate regions are mistaken for reliable assessments of the status and trends of living organisms
more generally.
���� ����
The 2010 target and the associated goals and subtargets have in general been useful and policy relevant
in that they have increased focus on the biodiversity crisis and spurred greater effort in measuring
biodiversity trends. The broader 2010 target was perhaps difficult to achieve in practice, resulting in a
failure to meet the target by national governments. It is important that the potential fall-out of this
failure be carefully managed in order to maintain momentum (as far as that exists). The indicators are
very general in nature and for the most part are neither time bound nor measurable, making them
somewhat useless at the policy level except to provide an overall direction for decision makers. As
previously mentioned, the general nature of the targets does not push governments to take new or even
specific actions to meet the targets. Countries are able to continue their existing strategies and efforts
and then fit those actions into the indicator categories for reporting purposes. Since the targets do not
have minimum levels of success defined then almost any action, whether effective or not, can be
categorized as contributing to one or another of the sub-targets. As a result, the indicators have not
generally been used as a basis for specific policies at the national level. The fact that numerous indicators
are still under development has also prevented widespread adoption. Lack of clear definition or national-
level guidance has also hampered progress and adoption. The Biodiversity Indicators Partnership has
developed some guidance documents and capacity building efforts for implementing indicators at
national scale but these are recent and still incomplete.
���� ����
Partially - however, Marine Trophic Index is far too specific, where as Ecological Footprint is far too
broad/large. We need something in the mid-range. It seems that indicators can be used by very specific
groups (academics) but they can be far from the policy/regulatory framework.
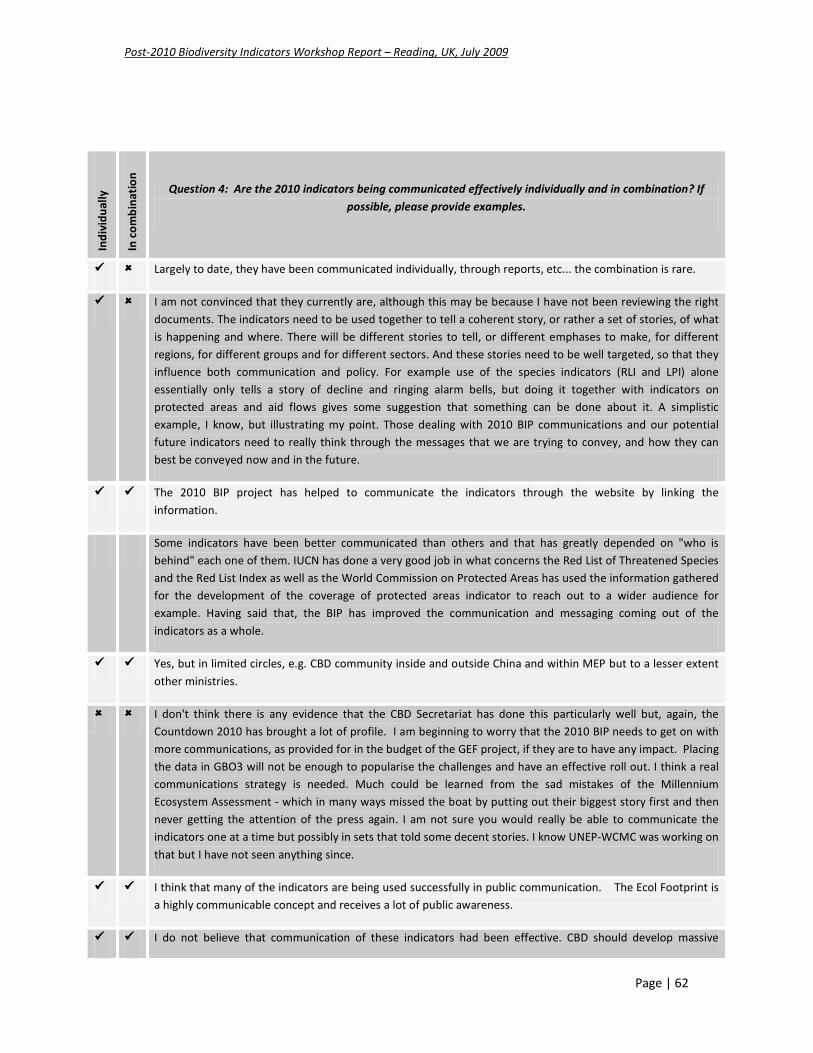
Post-2010 Biodiversity Indicators Workshop Report – Reading, UK, July 2009
Page | 62
Ind
ivid
ua
lly
In c
om
bin
ati
on
Question 4: Are the 2010 indicators being communicated effectively individually and in combination? If
possible, please provide examples.
���� ���� Largely to date, they have been communicated individually, through reports, etc... the combination is rare.
���� ���� I am not convinced that they currently are, although this may be because I have not been reviewing the right
documents. The indicators need to be used together to tell a coherent story, or rather a set of stories, of what
is happening and where. There will be different stories to tell, or different emphases to make, for different
regions, for different groups and for different sectors. And these stories need to be well targeted, so that they
influence both communication and policy. For example use of the species indicators (RLI and LPI) alone
essentially only tells a story of decline and ringing alarm bells, but doing it together with indicators on
protected areas and aid flows gives some suggestion that something can be done about it. A simplistic
example, I know, but illustrating my point. Those dealing with 2010 BIP communications and our potential
future indicators need to really think through the messages that we are trying to convey, and how they can
best be conveyed now and in the future.
���� ���� The 2010 BIP project has helped to communicate the indicators through the website by linking the
information.
Some indicators have been better communicated than others and that has greatly depended on "who is
behind" each one of them. IUCN has done a very good job in what concerns the Red List of Threatened Species
and the Red List Index as well as the World Commission on Protected Areas has used the information gathered
for the development of the coverage of protected areas indicator to reach out to a wider audience for
example. Having said that, the BIP has improved the communication and messaging coming out of the
indicators as a whole.
���� ���� Yes, but in limited circles, e.g. CBD community inside and outside China and within MEP but to a lesser extent
other ministries.
���� ���� I don't think there is any evidence that the CBD Secretariat has done this particularly well but, again, the
Countdown 2010 has brought a lot of profile. I am beginning to worry that the 2010 BIP needs to get on with
more communications, as provided for in the budget of the GEF project, if they are to have any impact. Placing
the data in GBO3 will not be enough to popularise the challenges and have an effective roll out. I think a real
communications strategy is needed. Much could be learned from the sad mistakes of the Millennium
Ecosystem Assessment - which in many ways missed the boat by putting out their biggest story first and then
never getting the attention of the press again. I am not sure you would really be able to communicate the
indicators one at a time but possibly in sets that told some decent stories. I know UNEP-WCMC was working on
that but I have not seen anything since.
���� ���� I think that many of the indicators are being used successfully in public communication. The Ecol Footprint is
a highly communicable concept and receives a lot of public awareness.
���� ���� I do not believe that communication of these indicators had been effective. CBD should develop massive

Post-2010 Biodiversity Indicators Workshop Report – Reading, UK, July 2009
Page | 63
Ind
ivid
ua
lly
In c
om
bin
ati
on
Question 4: Are the 2010 indicators being communicated effectively individually and in combination? If
possible, please provide examples.
outreach programs to communicate better.
���� ���� More could be done, particularly if we want post 2010 we need to get country examples out there in the public
domain, highlighting much of the good work being carried out by countries. The 2010 website is a logical place
for this.
���� ���� No. As mentioned previously, such indicators are present only in national strategic planning documents.
Therefore, they are not known and used by planning authorities at regional and local level. The civil society
and the media are also largely unaware of them do to lack of specifically targeted communication campaigns.
Only very few specialized NGOs in Bulgaria know about them and try to report on those indicators due to the
specifics of their work.
���� ���� Not from what I've seen in China. My own article (in Living Forests magazine) is the only example I've seen.
���� - I have been peripherally involved in the development of the genetic diversity indicator but have received little
information about its recent application, but the other indicators have been more widely publicised.
���� ���� What counts is how effectively the need to use these indicators is being communicated to the general policy
community (i.e. not just the people already involved). There is not much evidence that this is happening yet.
���� ���� No. In biology and environmental departments at my national university, I know of only one professor (who
helped write CBD) and zero students who could demonstrate any meaningful awareness of the 2010 indicators
without reading the link you provided. By virtue of this apparent ignorance in a major university setting -- and I
believe among many of my UN-affiliated colleagues, I conclude the indicators have not been effectively
communicated.
���� ���� I can only speak for North America, and on this continent I would say that the 2010 Biodiversity Goal, along
with the Targets and Indicators for this process, is largely unknown.
���� ���� I sometimes wonder at this type of question... Of course they are not being communicated, mostly because, to
a large extent, they do not exist!!! Is there a web-page of 2010 indicators, outside Europe? The 2010
Biodiversity Indicators Partnership mostly is about texts. The few actual datalines are LPI and RLI!! And I am
sorry to express this view: they are not being used at national level, anywhere. Why, because of lack of
resolution; they are irrelevant to take local decisions.
���� ���� Outreach needs to solicit and engage public to drive government and business at all levels.
���� ���� Yes, I believe amongst scholars, politicians and interested stakeholders. There is very little or zero knowledge
in the general public and the private sector. Even amongst CSR-manager the indicators are not known.
���� ���� I don't think so. I have struggled to find detailed information on the indicators that would enable us to use
them exactly as recommended. I was referred to the website http://www.twentyten.net when I enquired to
the e-mail address on this survey but am not having any success in accessing the site.
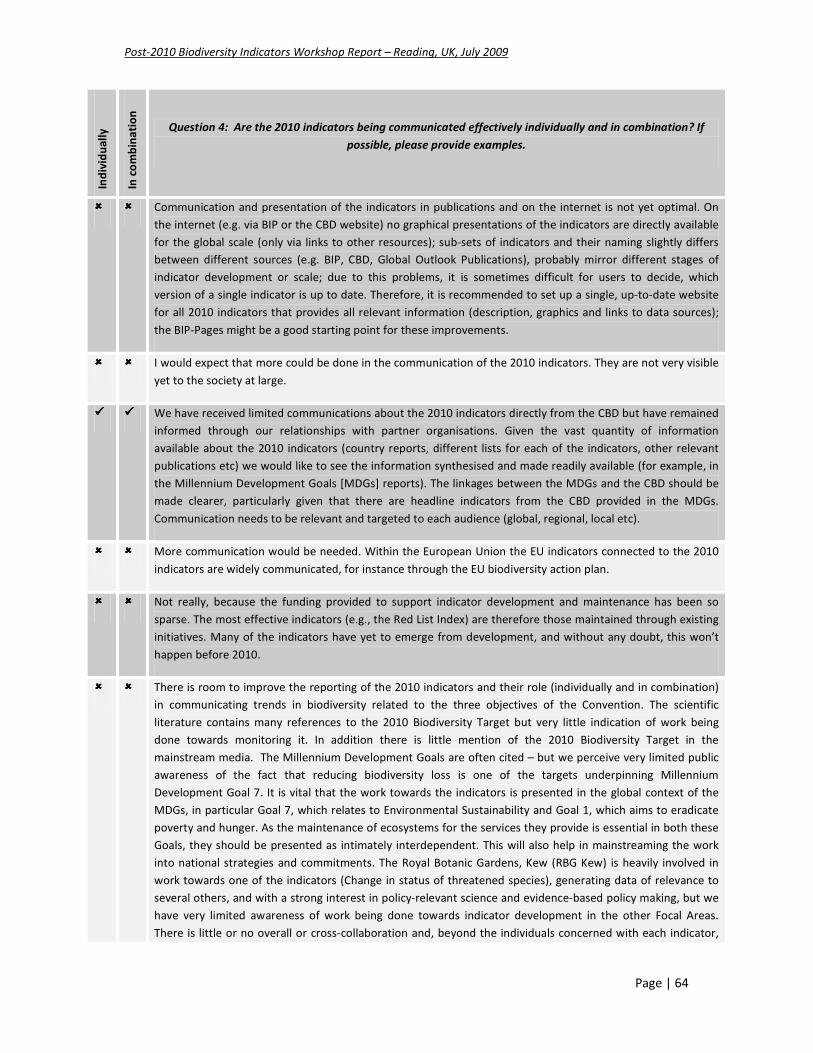
Post-2010 Biodiversity Indicators Workshop Report – Reading, UK, July 2009
Page | 64
Ind
ivid
ua
lly
In c
om
bin
ati
on
Question 4: Are the 2010 indicators being communicated effectively individually and in combination? If
possible, please provide examples.
���� ���� Communication and presentation of the indicators in publications and on the internet is not yet optimal. On
the internet (e.g. via BIP or the CBD website) no graphical presentations of the indicators are directly available
for the global scale (only via links to other resources); sub-sets of indicators and their naming slightly differs
between different sources (e.g. BIP, CBD, Global Outlook Publications), probably mirror different stages of
indicator development or scale; due to this problems, it is sometimes difficult for users to decide, which
version of a single indicator is up to date. Therefore, it is recommended to set up a single, up-to-date website
for all 2010 indicators that provides all relevant information (description, graphics and links to data sources);
the BIP-Pages might be a good starting point for these improvements.
���� ���� I would expect that more could be done in the communication of the 2010 indicators. They are not very visible
yet to the society at large.
���� ���� We have received limited communications about the 2010 indicators directly from the CBD but have remained
informed through our relationships with partner organisations. Given the vast quantity of information
available about the 2010 indicators (country reports, different lists for each of the indicators, other relevant
publications etc) we would like to see the information synthesised and made readily available (for example, in
the Millennium Development Goals [MDGs] reports). The linkages between the MDGs and the CBD should be
made clearer, particularly given that there are headline indicators from the CBD provided in the MDGs.
Communication needs to be relevant and targeted to each audience (global, regional, local etc).
���� ���� More communication would be needed. Within the European Union the EU indicators connected to the 2010
indicators are widely communicated, for instance through the EU biodiversity action plan.
���� ���� Not really, because the funding provided to support indicator development and maintenance has been so
sparse. The most effective indicators (e.g., the Red List Index) are therefore those maintained through existing
initiatives. Many of the indicators have yet to emerge from development, and without any doubt, this won’t
happen before 2010.
���� ���� There is room to improve the reporting of the 2010 indicators and their role (individually and in combination)
in communicating trends in biodiversity related to the three objectives of the Convention. The scientific
literature contains many references to the 2010 Biodiversity Target but very little indication of work being
done towards monitoring it. In addition there is little mention of the 2010 Biodiversity Target in the
mainstream media. The Millennium Development Goals are often cited – but we perceive very limited public
awareness of the fact that reducing biodiversity loss is one of the targets underpinning Millennium
Development Goal 7. It is vital that the work towards the indicators is presented in the global context of the
MDGs, in particular Goal 7, which relates to Environmental Sustainability and Goal 1, which aims to eradicate
poverty and hunger. As the maintenance of ecosystems for the services they provide is essential in both these
Goals, they should be presented as intimately interdependent. This will also help in mainstreaming the work
into national strategies and commitments. The Royal Botanic Gardens, Kew (RBG Kew) is heavily involved in
work towards one of the indicators (Change in status of threatened species), generating data of relevance to
several others, and with a strong interest in policy-relevant science and evidence-based policy making, but we
have very limited awareness of work being done towards indicator development in the other Focal Areas.
There is little or no overall or cross-collaboration and, beyond the individuals concerned with each indicator,
Post-2010 Biodiversity Indicators Workshop Report – Reading, UK, July 2009
Page | 65
Ind
ivid
ua
lly
In c
om
bin
ati
on
Question 4: Are the 2010 indicators being communicated effectively individually and in combination? If
possible, please provide examples.
our perception is that the work being done on the other indicators is not currently being widely disseminated.
���� ���� The overarching target of eliminating biodiversity loss by 2010 has been well communicated throughout the
international community but the indicators have not. This is at least in part because the financial support for
developing and maintaining indicators has been minimal. The most effective indicators have tended to be
those supported and maintained as part of existing initiatives. As a result many indicators proposed here are
yet to be established and are unlikely to be by 2010. Another complicating factor is that the targets are
technically worded and so are difficult to communicate to a wide audience and particularly difficult for policy-
makers to champion. Indicators should be selected both for their robustness as well as ease of communication
to a non-scientific audience such as change in numbers of threatened species on the Red List or AZE sites
protected, rather than more complex indicators based on indices or trends in more difficult to explain
concepts.