winning the media campaign: how the press … the media campaign fina… · and when vice...
TRANSCRIPT

WINNING THE MEDIA CAMPAIGN:
How the Press Reported the 2008 Presidential General Election
The media coverage of the race for president has not so much cast Barack Obama
in a favorable light as it has portrayed John McCain in a substantially negative one, according to a new study of the media since the two national political conventions ended.
Press treatment of Obama has been somewhat more positive than negative, but
not markedly so. But coverage of McCain
has been heavily unfavorable—and has become more so over time. In the six weeks following the conventions through the final debate, unfavorable stories about McCain outweighed favorable ones by a factor of more than three to one—the most unfavorable of all four candidates—according to the study by the Pew Research Center’s Project for Excellence in Journalism.
For Obama during this period, just over a third of the stories were clearly positive
in tone (36%), while a similar number (35%) were neutral or mixed. A smaller number (29%) were negative.
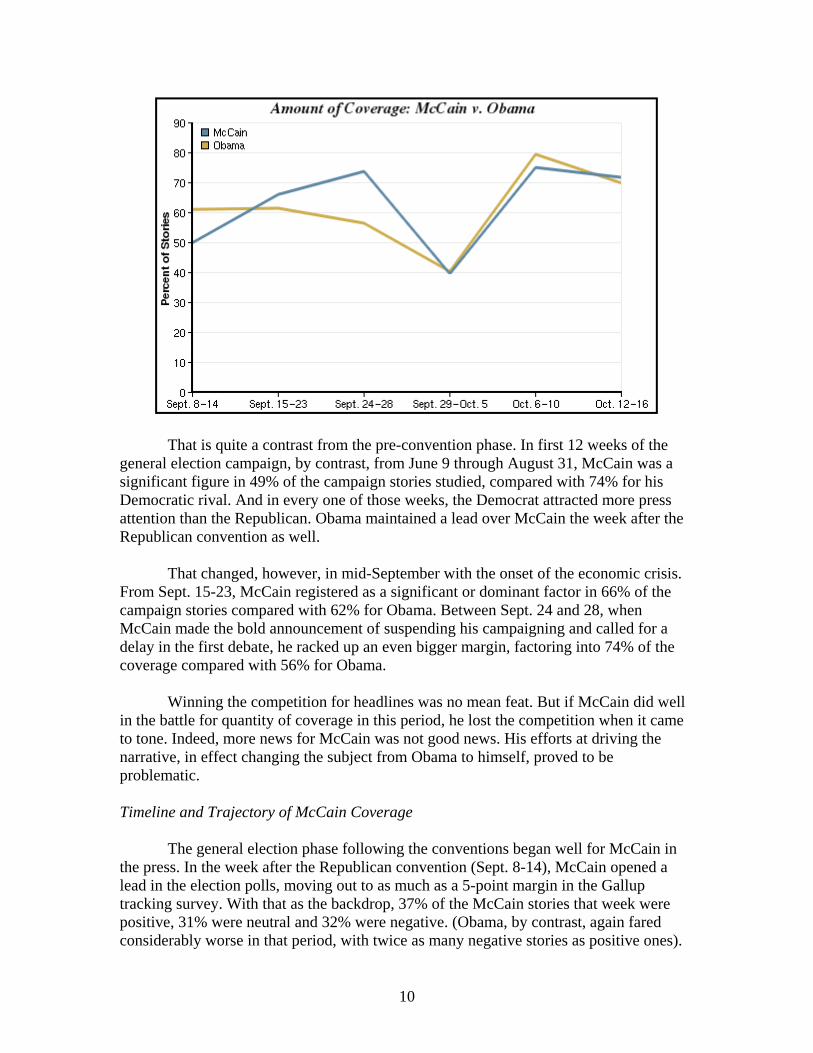
For McCain, by comparison, nearly six in ten of the stories studied were
decidedly negative in nature (57%), while fewer than two in ten (14%) were positive. McCain did succeed in erasing one advantage Obama enjoyed earlier in the
campaign—the level of media exposure each candidate received. Since the end of August, the two rivals have been in a virtual dead heat in the amount of attention paid, and when vice presidential candidates are added to the mix the Republican ticket has the edge. This is a striking contrast to the pre-convention period, when Obama enjoyed nearly 50% more coverage.
1

Much of the increased attention for McCain derived from actions by the senator himself, actions that, in the end, generated mostly negative assessments. In many ways, the arc of the media narrative during this phase of the 2008 general election might be best described as a drama in which John McCain has acted and Barack Obama has reacted.
As for Alaska Governor Sarah Palin, her coverage had an up and down trajectory,
moving from quite positive, to very negative, to more mixed. What drove that tone toward a more unfavorable light was probing her public record and her encounters with the press. Little of her trouble came from coverage of her personal traits or family issues. In the end, she also received less than half the coverage of either presidential nominee, though about triple that of her vice presidential counterpart, Joe Biden.
The findings suggest that, in the end, Palin’s portrayal in the press was not the
major factor hurting McCain. Her coverage, while tilting negative, was far more positive than her running mate’s.
These are some of the findings of the study, which examined 2,412 campaign
stories from 48 news outlets, during six critical weeks of the general election phase from the end of the conventions through the final presidential debate. Tone was examined on a subset of this sample, 857 stories from 43 outlets, those campaign stories that were focused on one of the candidates. Marion Just of Wellesley College served as a consultant on the study. The Project is funded by the Pew Charitable Trusts. Among the findings:
• Coverage of Obama began in the negative after the conventions, but the tone switched with the changing direction of the polls. The most positive stories about him were those that were most political—the ones focused on polling, the electoral map, and tactics.
• For McCain, coverage began positively, but turned sharply negative with
McCain’s reaction to the crisis in the financial markets. As he took increasingly bolder steps to try and reverse the direction of the polls, the coverage only worsened. Attempts to turn the dialogue away from the economy through attacks on Obama’s character did hurt Obama’s media coverage, but McCain’s was even more negative.
• Coverage of Palin, in the end, was more negative than positive. In all, 39% of
Palin stories carried a negative tone, while 28% were positive, and 33% were neutral. Contrary to what some suggested, little of the coverage was about Palin’s personal life (5%).
• Democratic vice presidential nominee Joe Biden was nearly the invisible man. His
had just one large moment, the vice presidential debate, which also offered his only positive or neutral contribution. Aside from that week, the limited coverage
2

he did receive was far more negative than Palin’s, and nearly as negative as McCain’s.
• The economy was hardly a singular lens through which the media perceived the
race. Though it was the No. 1 campaign topic overall, five out of the six weeks other topics were bigger, and in the end it accounted for not much more of the campaign newshole (18%) than assessments of the candidates in the four debates (17%).
• Horse race reporting, once again, made up the majority of coverage, but less so
than earlier in the contest or than in previous elections. Since the conventions ended, 53% of the newshole studied has focused on political matters, particularly tactics, strategy and polling. That is more than twice as much as the coverage focused on policy (20%). This focus on tactics and horse race grew in the last three weeks as both campaigns became more negative in their rhetoric.
Tone is an elusive and yet unavoidable question when examining the role of the
news media. Who got better coverage, and why? To examine tone, the Project takes a particularly cautious and conservative
approach. Unlike some researchers, we examine not just whether assertions in stories are positive or negative, but also whether they are inherently neutral. This, we believe, provides a much clearer and fairer sense of the tone of coverage than ignoring those balanced or mixed evaluations. Second, we do not simply tally up all the evaluative assertions in stories and compile them into a single pile to measure. Journalists and audiences think about press coverage in stories or segments. They ask themselves, is this story positive or negative or neutral? Hence the Project measures coverage by story, and for a story to be deemed as having a negative or positive tone, it must be clearly so, not a close call: for example, the negative assertions in a story must outweigh positive assertions by a margin of at least 1.5 to 1 for that story to be deemed negative.
One question likely to be posed is whether these findings provide evidence that
the news media are pro-Obama. Is there some element in these numbers that reflects a rooting by journalists for Obama and against McCain, unconscious or otherwise? The data do not provide conclusive answers. They do offer a strong suggestion that winning in politics begat winning coverage, thanks in part to the relentless tendency of the press to frame its coverage of national elections as running narratives about the relative position of the candidates in the polls and internal tactical maneuvering to alter those positions. Obama’s coverage was negative in tone when he was dropping in the polls, and became positive when he began to rise, and it was just so for McCain as well. Nor are these numbers different than what we have seen before. Obama’s numbers are similar to what we saw for John Kerry four years ago as he began rising in the polls, and McCain’s numbers are almost identical to what we saw eight years ago for Democrat Al Gore.
What the findings also reveal is the reinforcing—rather than press-generated—
effects of media. We see a repeating pattern here in which the press first offers a
3

stenographic account of candidate rhetoric and behavior, while also on the watch for misstatements and gaffes. Then, in a secondary reaction, it measures the political impact of what it has reported. This is magnified in particular during presidential races by the prevalence of polling and especially daily tracking. While this echo effect exists in all press coverage, it is far more intense in presidential elections, with the explosion of daily tracking polls, state polls, poll aggregation sites and the 24-hour cable debate over their implications. Even coverage of the candidate’s policy positions and rhetoric, our reading of these stories suggest, was tied to horse race and took on its cast. Barack Obama
Throughout the race, critics have contended that the media were besotted with Barack Obama’s candidacy; Hillary Clinton made the accusation first, most memorably in a debate during the primaries in late February. McCain’s campaign has leveled the criticism as well throughout the general election phase, particularly since the conventions.
The evidence suggests something more complicated than that. Coverage of Obama since the conventions has been more positive than negative, but it has also been almost as neutral or mixed.
In all, 36% of stories about
Obama have been positive, vs. 35% that have been neutral. And 29% have been negative.
What are we to make of these numbers?
One metric is how they compare with past studies, both those earlier in this race
and from other years. Obama’s are similar to those recorded by the Project four years ago during a two-
week period dominated by debates between John Kerry and George Bush. That year, 34% of Kerry stories were positive, while 25% were negative and 41% neutral. In 2000, when George Bush enjoyed more positive coverage than Al Gore, the depiction of him in the press was less flattering (24% positive, 27% neutral and 49% negative). This year’s study covers a much broader period of time, nearly six weeks.
This coverage is also significantly less positive, or more mixed, than the Project
found of Obama during the pre-primary phase of the campaign. From January 1 through March 31, 2007, a study by the project found coverage of Obama was roughly three times as positive as negative (47% versus 16%). And a study of the early primaries in 2008,
4

using a different methodology that examined the narratives about character but excluded horse race coverage, found Obama’s positive narratives twice as prevalent as his negative (69% versus 31%).1
Tone of Obama Coverage vs. Past Candidates2
Percent of Stories Obama 2008 Obama 2007 Kerry 2004 Bush 2000
Positive 36% 47% 34% 24% Negative 29 16 25 49 Neutral 35 38 41 27
Obama’s positive coverage, in other words, falls below what we have seen for him earlier in the race, but is more positive than George Bush received in his two victories in 2000 and 2004.
Tone over Time
Another element to consider is the shifts in the tone of coverage over time. The
media depiction of Obama also changed over the six weeks between the conventions and the last presidential debate—as the polls changed.
The portrayal of Obama in this period began fairly negative. During the week
after the Republican convention (Sept. 8-14), for instance, coverage of Obama was about twice as negative as positive (41% negative vs. 20% positive and 39% neutral).
The following week, when the economic crisis began (Sept. 15-23), the tone
shifted, becoming more mixed (35% positive, 35% neutral, 30% negative). And in the next period (Sept. 24-28), when Obama prepared to debate while
McCain suspended his campaign and both candidates returned to Washington for a White House meeting, Obama enjoyed his most decidedly positive coverage of the race. Nearly half of all stories about Obama were clearly positive in tone (47%), while less than one-in-ten were clearly negative (8%).
Some of that positive coverage was related to evidence that the financial crisis
was aiding Obama. “Recent economic woes have given Democrat Barack Obama a clear lead over Republican John McCain,” declared a story posted on AOL News on Sept. 24, citing a 9-point lead for Obama in a new Washington Post/ABC News poll. 1 “Character and the Primaries of 2008,” May 29, 2008. This analysis identified, for each of the five main candidates at the time, the most prominent narrative themes in the coverage leading up to the Iowa primary. We found between four and seven narratives, depending on the candidate. We then measured how often that narrative was asserted or refuted in news stories during the primary season itself. 2The 2000 and 2004 studies covered two-week time periods during the debate and studied slightly different universes of outlets. For the full methodologies and findings of these reports, see Last Lap: How the Press Covered the Final Stages of the 2000 Campaign and The Debate Effect: How the Press Covered the Pivotal Period of the 2004 Campaign. For full details on how the coding of tone in this report compared with the coding for tone in PEJ’s previous reports, see the Tone Variable section in the methodology.
5

That more positive tone for Obama continued through the vice presidential debate
a week later when 50% of stories about him were positive, while 38% were neutral and 13% were negative.
However, the week of the second presidential debate (Oct. 6-10), the tone
changed again, becoming more negative. The week of that encounter, a point when the overall tenor of the campaign grew noticeably harsher and the McCain camp linked Obama with ‘60’s radical William Ayers, 45% of the stories studied about Obama were negative, while 25% were positive and another 30% were mixed. The McCain attacks worked, in other words, in changing the dialogue in the media, as well as the tone of that dialogue.
6

“Barack Obama’s campaign was nearly swamped this spring when his pastor’s
inflammatory sermons were widely publicized,” reported the Los Angeles Times Oct. 7. “But now John McCain, trailing in the polls, is reviving questions about Obama’s past.”
The last week of the study (Oct. 12-16), which included the final presidential
debate, coverage of Obama became more positive again (50% positive, vs. 19% negative and 31% neutral).
Reasons for the Tone of Obama Coverage
How much of the coverage of Obama is simply a reflection of his leading in the
polls? The data clearly point in this direction for some of the explanation. Of those
stories that focused mostly on polls, a clear majority (57%) were positive for Obama, while less than a quarter (23%) were negative. Similarly, stories about the electoral map, swing states and campaign strategy were even more favorable (77% positive vs. 6% negative). These represent the most positive element of Obama’s coverage.
The data also suggest there is some truth to the idea that the financial crisis was a
boon to Obama in the media narrative, though less than was the case with these horse race-oriented stories. Coverage of the economy and financial meltdown was more likely to be positive as negative (36% vs.23%). The more political component of the financial crisis hitting the campaign helped Obama even more: Obama stories concerning McCain’s announcement that he would suspend campaigning to respond to the crisis were positive 44% vs. 9% negative.
7
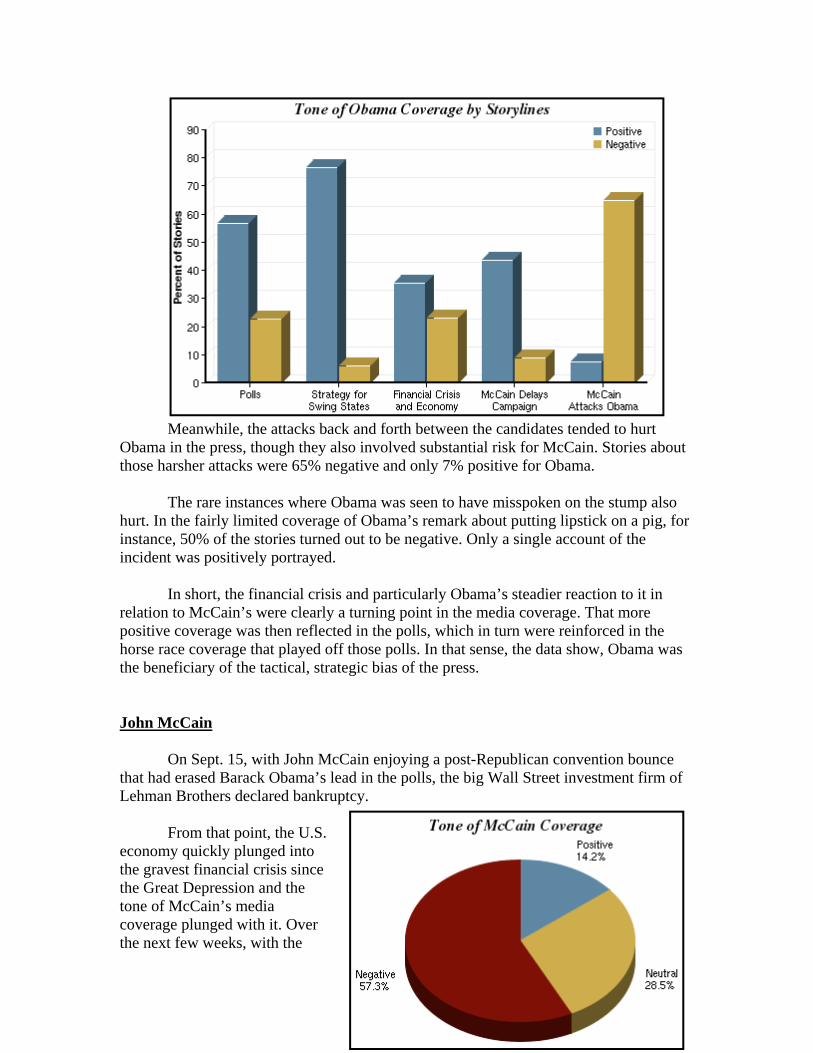
Meanwhile, the attacks back and forth between the candidates tended to hurt
Obama in the press, though they also involved substantial risk for McCain. Stories about those harsher attacks were 65% negative and only 7% positive for Obama.
The rare instances where Obama was seen to have misspoken on the stump also
hurt. In the fairly limited coverage of Obama’s remark about putting lipstick on a pig, for instance, 50% of the stories turned out to be negative. Only a single account of the incident was positively portrayed.
In short, the financial crisis and particularly Obama’s steadier reaction to it in
relation to McCain’s were clearly a turning point in the media coverage. That more positive coverage was then reflected in the polls, which in turn were reinforced in the horse race coverage that played off those polls. In that sense, the data show, Obama was the beneficiary of the tactical, strategic bias of the press.
John McCain
On Sept. 15, with John McCain enjoying a post-Republican convention bounce that had erased Barack Obama’s lead in the polls, the big Wall Street investment firm of Lehman Brothers declared bankruptcy.
From that point, the U.S. economy quickly plunged into the gravest financial crisis since the Great Depression and the tone of McCain’s media coverage plunged with it. Over the next few weeks, with the
8

economic crisis dominating news and public concern, McCain made several efforts—some of them dramatic—to try and seize the initiative. In doing so, he became a dominant actor in the campaign drama, generating more coverage than any other presidential or vice presidential candidate for the first time in the general election season.
But as McCain did so, the media narrative about him grew increasingly negative. Overall, between Sept. 8 and Oct. 16, only 14% of stories in which McCain was a significant factor were positive, while 57% were negative. The rest, another 29%, were neutral or mixed. In a sense, the late general election narrative about McCain is not dissimilar to the tone of his coverage early on in the campaign. A PEJ study of coverage from Jan. 1-May 31, 2007, found that the Arizona Senator’s coverage was about four times more negative than positive. Then, too, his coverage was influenced by his lagging in the polls and a campaign that seemed in disarray. Another study in the early primary season (Jan. 1-Mar. 9, 2008) using a different methodology that excluded horse race coverage found McCain’s negative themes outnumbered his positive ones by 57% to 43%.3 Those negative narratives were largely driven by the perception, during the GOP primary fight, that he was not a reliable conservative.
Since September, one thing McCain did accomplish was reversing what had been a substantial Obama lead in media exposure. For the general election phase overall, they drew remarkably even. McCain was a significant factor in 62% of the campaign stories studied from September 8 through October 16, the same percentage as Obama—largely because of his actions during the early phases of the economic meltdown.
3 “Character and the Primaries of 2008,” May 29, 2008. This analysis identified, for each of the five main candidates at the time, the most prominent narrative themes in the coverage leading up to the Iowa primary. We found between four and seven narratives, depending on the candidate. We then measured how often that narrative was asserted or refuted in news stories during the primary season itself.
9
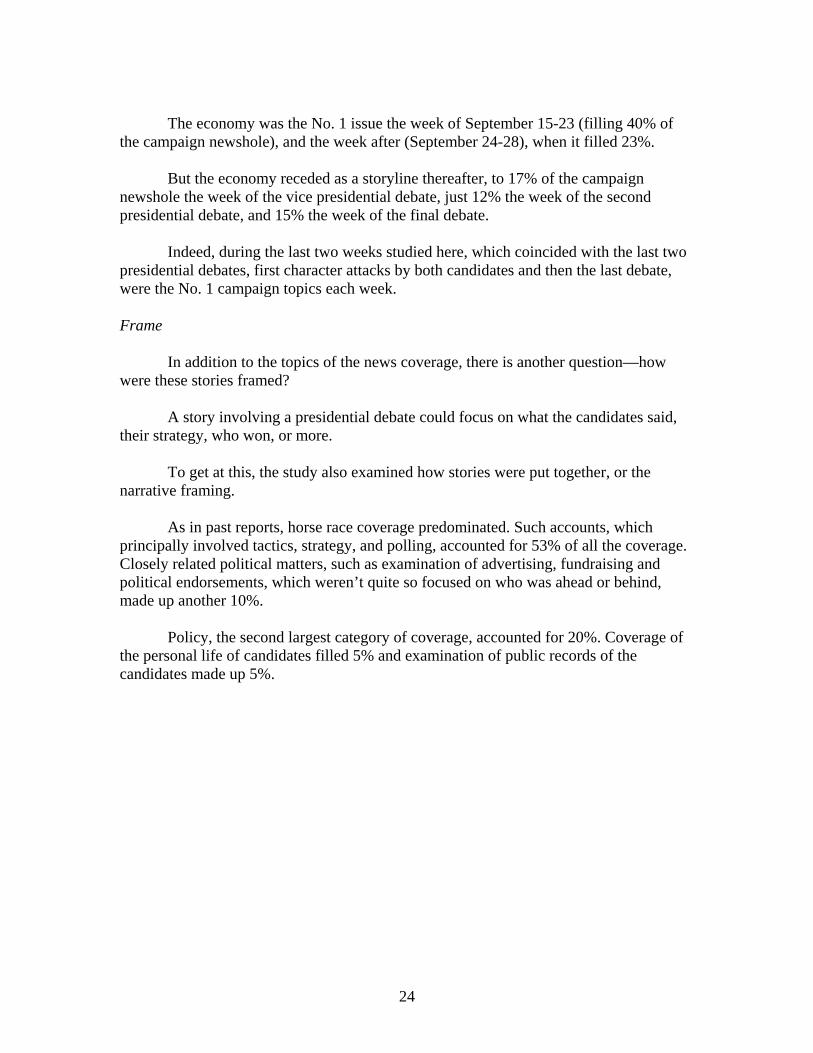
That is quite a contrast from the pre-convention phase. In first 12 weeks of the
general election campaign, by contrast, from June 9 through August 31, McCain was a significant figure in 49% of the campaign stories studied, compared with 74% for his Democratic rival. And in every one of those weeks, the Democrat attracted more press attention than the Republican. Obama maintained a lead over McCain the week after the Republican convention as well.
That changed, however, in mid-September with the onset of the economic crisis. From Sept. 15-23, McCain registered as a significant or dominant factor in 66% of the campaign stories compared with 62% for Obama. Between Sept. 24 and 28, when McCain made the bold announcement of suspending his campaigning and called for a delay in the first debate, he racked up an even bigger margin, factoring into 74% of the coverage compared with 56% for Obama.
Winning the competition for headlines was no mean feat. But if McCain did well in the battle for quantity of coverage in this period, he lost the competition when it came to tone. Indeed, more news for McCain was not good news. His efforts at driving the narrative, in effect changing the subject from Obama to himself, proved to be problematic.
Timeline and Trajectory of McCain Coverage
The general election phase following the conventions began well for McCain in the press. In the week after the Republican convention (Sept. 8-14), McCain opened a lead in the election polls, moving out to as much as a 5-point margin in the Gallup tracking survey. With that as the backdrop, 37% of the McCain stories that week were positive, 31% were neutral and 32% were negative. (Obama, by contrast, again fared considerably worse in that period, with twice as many negative stories as positive ones).
10

But the tenor of McCain’s coverage worsened for him the following week (Sept. 15-23). In the wake of the collapse of Lehman Brothers, the buyout of Merrill Lynch and the bailout of insurance giant AIG, the Bush Administration unveiled an extraordinary $700 billion plan to try and stabilize the credit system and Wall Street. In a single week, coverage of the economy as a percentage of campaign coverage increased tenfold, from 4% to 40%.
The financial turmoil changed the subject of the campaign and “hit the pause button on everybody’s strategy,” in the words of CNN’s John King. One of McCain’s first responses was stating that the “fundamentals of the economy are strong,” a statement Obama pounced on and which McCain’s camp tried to dial back by explaining that he was referring to the American worker.
The exchange hurt McCain badly in the press. From September 15-23, negative
stories about McCain outnumbered positive ones by about 3:1. Only 17% of the stories in which he was a significant factor were positive, down by half from the previous week. Suddenly a majority of the stories about McCain (53%) were clearly negative. (The percentage of neutral stories, 30%, was essentially the same as the previous week).
As the crisis deepened from Sept. 24-28, the GOP hopeful made more aggressive attempts to respond, helping to create the most fluid and unpredictable week of the campaign. On Sept. 24, he announced he was suspending campaigning to return to Washington to work on a rescue bill and advocated delaying the first debate, scheduled two days away in Oxford Mississippi. The Washington Post called the moves one of the “biggest…bet[s]…of his political life.” When the Washington meeting failed to yield any immediate breakthroughs, Obama and McCain went ahead with the debate. And some of the coverage depicted McCain’s decision-making in an unflattering light, such as a Sept.
11

26 CNN.com piece stating that “some fellow lawmakers said McCain hadn’t contributed much to the financial debate, and senior campaign advisors told CNN they believed it was politically crucial that McCain show up in Oxford, Mississippi.”
Once that encounter ended, many pundits scored it a draw and declared that there had been no “knockout.” But a series of snap polls revealed that those watching the debate at home thought Obama had done better, and by a decisive margin. And by now, the election match-up polls showed Obama enlarging his lead over McCain to between five and ten points.
In the news media, that tumultuous week played terribly for McCain, the second bad one in a row. While Obama enjoyed more than a 5:1 ratio of positive to negative coverage that week, McCain’s was the reverse. A mere 11% of his stories were positive while 50% were negative. Another 40% were neutral. McCain’s gamble, as it turned out, proved even more negative in the media portrayal than the one before when he had supposedly made his big gaffe about the economy.
The following week (Sept. 29-Oct. 5), brought more turmoil. The House of Representatives voted down the proposed bailout plan, and the stock market in reaction lost 777 points in a single day. After absorbing that grim news, the campaign narrative began to shift toward the vice presidential candidates’ Oct. 2 debate.
While McCain was hardly the focus of the coverage that week (just 40% of the week’s campaign stories were about him), a good number of those stories suggested strategic weakness in his campaign. Polls showed Obama now solidly ahead nationally and rising in key battleground states, and McCain’s campaign pulled out of Michigan, once viewed as a key battleground.
In the media, McCain’s positive coverage dropped further, to 7%. His negative coverage spiked all the way up to 66% and. 27% of his stories were mixed.
Between Oct. 6-10, as McCain aides acknowledged they were trying to turn the dialogue away from the economy, the rhetoric between the campaigns took a harsher turn. Obama’s coverage became negative, but McCain fared far worse than his rival. Negative stories about him outnumbered positive ones by 10:1 (7% positive compared with 70% negative and 23% neutral). If McCain wanted to change the subject away from the economy, he succeeded, but he did not succeed in getting better press in the process.
12

The subject changed again during the week of Oct. 12-16, when the two
candidates met for their third and final presidential debate—which many pundits viewed as perhaps one of McCain’s last opportunities for an election math “game changer.” Instant polls of viewers showed McCain losing the debate to his rival, and even those who thought he performed well did not suggest he had scored major points against Obama.
In the press, the tone of McCain coverage during the week of the last debate was virtually unchanged from the previous week. Only 7% of his stories were positive in contrast to 69% negative. Another 25% were neutral. Tone of McCain Coverage by Topic and Storyline
Was this falling depiction of McCain simply a reflection of his slipping in the polls? It is clearly tied to them, but in McCain’s case it made little difference if the story was about policy or strategy.
Certainly McCain did not fare well in the so-called horserace stories—which include polls, strategy and momentum, and made up about six out of ten of all McCain stories. Only 14% of his horserace coverage was positive compared with 25% neutral and 62% negative. In a related category that included stories about political ads, fundraising, and endorsements (another 7% of McCain stories), the Republican hopeful even did a little worse, with 10% positive stories, 24% neutral and 66% negative.
But on the policy side, with the economic crisis as the overwhelming campaign issue, the quality of McCain’s coverage was only slightly more favorable—18% of the
13

policy stories featuring him were positive compared with 46% negative and 36% neutral. (These policy stories made up 27% of all the McCain coverage).
An examination of several specific campaign storylines sheds further light on where McCain’s problems in the press narrative emerged. The most negative coverage came late, actually, when McCain tried to turn from the economy and make more pointed attacks on Obama. Nearly three quarters of the coverage of the negative exchanges between the candidates (74%) were unfavorable for McCain, while only three stories studied, 5%, had a clearly positive tone.
Tone of McCain Coverage by Frame Percent of Stories
Positive Negative Neutral Political Horserace 13.5% 61.6 24.9 Policy 17.7% 46.2 36.1 Advertising, Fundraising* 9.8% 65.9 24.4 Personal 12.5% 43.8 43.8 Public Record 0.0% 14.3 85.7
*Also includes treatment by the press, electoral calendar and endorsements.
That was even more negative for McCain than his troubled efforts that began earlier with his response to the economic crisis, something that seemed to spark the downward spiral of his campaign in the polls. Of the McCain stories about the general economy and financial meltdown, 55% were negative, compared with 15% positive and 30% neutral. (By contrast, Obama stories were 23% negative and 36% positive). McCain, in short, hurt himself here more than Obama helped himself.
McCain’s efforts to suspend his campaign in response to the crisis, which was the
most positive moment of the race for Obama, was not McCain’s worst. Coverage of McCain here was more divided between neutral and negative, though little of it came out favorably. The coverage here was 50% negative, 11% positive, and 39% neutral.
In the end, the trajectory of McCain’s coverage during this heart of the general
election phase reflects the convergence of three closely related factors—the exploding economic crisis, some missteps in handling it, and the polls showing Obama moving solidly ahead. Once McCain began to fall behind in the polls, his efforts to change that were viewed from a political perspective. And on this ground, he lost footing. Sarah Palin
For Governor Sarah Palin, her best days in the national spotlight were her first. After being named McCain’s running mate, she quickly became a major part of the campaign narrative, and a positive one as well. When her problems came, as it turned out, she was already largely beginning to recede from center stage.
Overall, for the six weeks studied here, Palin was a significant factor in only half as many stories as the main contenders, or 28% of all of the election stories. That,
14

however, is about three times that of Democratic vice presidential nominee Joe Biden (9%).
That percentage might have been even higher were it not for two factors—the emergence of the economic crisis and the apparent limits of Palin’s impact on the polls. In addition, the campaign strove to shield Palin from the press, granting just two interviews in the weeks following the convention. This likely dampened some coverage but also increased the press impact of the two main interviews granted.
When the general election phase of the race began in earnest, Palin was as important a news figure as the people at the top of the ticket. The week after the Republican convention, more than half (53%) of the campaign stories focused significantly on Palin, more than even her running mate, McCain (50%).
A week later, as the economic crisis took hold of Washington and the two presidential contenders responded, stories involving Palin dropped by more than half (to 23%) of the coverage.
Some might have imagined she would have seen a resurgence with her much-
talked-about interview series with CBS anchor Katie Couric. Not so. The week the bulk of those interviews aired (Sept. 24-28), press attention to Palin fell even lower, to 15%.
Part of the further decline was likely tied to the economic crisis and McCain’s
dramatic announcement that week that he would suspend his campaign to focus on the proposed economic bailout package. Yet this number may also reflect another phenomenon. Much of the impact of those Palin interviews came from people replaying and emailing them from YouTube and other websites, including CBS’ own. That kind of viral media flies somewhat below the radar of traditional measurements of the news agenda.
15

Attention to Plain did spike briefly again with the October 2 vice presidential
debate. Anticipation for the event was high after even some conservatives criticized her performance in the Couric interviews. Viewership for the Biden-Palin encounter hit record levels. And afterwards there was a fair amount of discussion about whether the Alaska governor had exceeded the lowered expectations. When the week was over (Sept. 29-Oct. 5), Palin was a major newsmaker in more than half (51%) of the coverage—more than any of the other candidates during the period. It was Joe Biden’s high water mark in exposure as well, though he remained far below that of the governor (31%).
Yet in some ways, Palin’s passing the test of the debate seemed to have the effect
of reducing her importance as a key player, at least to a degree. She was now less controversial than she had been when there were more acute doubts about her, but she was also receiving less coverage. By the next week (Oct. 6-10), Palin’s presence in the news fell back down to just 18% of the stories and then to a mere 8% by mid-October. Tone of Palin Coverage
How did Palin fare in the press? In the end, Palin’s coverage was more negative than positive during the six weeks examined.
Roughly four-in-ten stories about
Palin carried a clearly negative tone (39%). That is slightly more than the percentage that were neutral or mixed (33%), and fully eleven points more than the percentage that were positive (28%).
Thus Palin’s coverage was twice
as positive as McCain’s (28% vs. 14%), and nearly twenty points less negative (39% vs. 57%).
Palin also received slightly more
positive coverage than Biden (28% vs. 25%), as well as more negative coverage (39% vs. 32%). Arguably the effect of these differences was more important since the volume of her coverage was triple that of Biden’s.
What was the trajectory? Did Palin, after burning brightly at first, just fade away? Not really. Instead, what began well for Palin turned negative and then began to
bounce more up and down. Palin’s best week in the press came the week after the GOP convention, when
Palin received more positive coverage than McCain, Obama or Biden. During that period,
16

Sept. 8-14, which ended with the candidate’s interview with ABC’s Charlie Gibson, 41% of the campaign stories about Palin painted her in a positive light. McCain was close behind (37% positive), while only 20% of Obama’s coverage was clearly positive. Joe Biden was virtually invisible.
The following week, September 15-23, when the economic crisis exploded into
the headlines and changed the campaign dynamic, the tone of her coverage reversed itself: 41% of her coverage was negative versus just 23% positive.
Then it got worse. As the Couric interview aired followed by a related Saturday Night Live skit (and her running mate lost ground on his public response to the economic crisis), fully 64% of the stories about her were negative—about nine times the number of stories that were positive (7%).
Questions about her aptitude for the job, her knowledge of foreign affairs and her
negative impact on the race dominated the media. On MSNBC’s Hardball September 29, guest Joan Walsh of Salon remarked, “I thought she absolutely did not understand what was in the bailout . . . It was a complete disconnect.” And Fox News correspondent Carl Cameron observed on the Special Report with Britt Hume that same day that Palin’s foreign policy response, “continues to raise eyebrows.”
17

Palin regrouped some with the vice presidential debate, though in the days leading
up to the event, many strategists questioned the governor’s readiness. The day before the debate, ABC commentator George Stephanopoulos remarked on World News Tonight that the “number of Americans questioning her qualifications, her readiness is steadily rising ….There is no question she’s become a bit of a drag on the ticket so far.”
Palin proved at least some of her skeptics wrong. Linda Feldman of the Christian Science Monitor wrote a story the day after the debate titled, “Could there be two Sarah Palins?” The candidate in the debate, she says, was “articulate, charming, and well-prepared.” Her performance, however, wasn’t enough to even out the tone of the press coverage. The week of the debate (September 29-October 5), negative stories about Palin still outweighed positive, 47% versus 28%, with 25% neutral or mixed. (Biden’s coverage, by contrast, was largely neutral, 53%, and twice as positive as negative, 33% positive versus 15% negative.) The debate helped Palin, but it did not erase the doubts audiences might be seeing in the press coverage.
What the debate appeared to do instead for Palin was help her enter the final days of the campaign with something of a more mixed image in the press, tending toward negative. As the spotlight turned back to the presidential nominees, the majority of coverage about Palin (56%) was neutral or balanced in tone, though negative stories still outweighed the positive, 32% versus 12%.
During the week of the last presidential debate (October 12-16) Palin was virtually absent from the press (just 8% of the election coverage that week), but the coverage she did receive had again moved more negative—46% versus 23% positive and 31% neutral or mixed. Explaining Tone for Palin
18

Why did Palin’s coverage become more negative? Was it some scrutinizing look
at her personal life such as the choice to run for vice president as a mother of a special needs baby or her personal religious beliefs? Was it reporters heading to Alaska to examine her record in office? Or was it those difficult interviews with Katie Couric?
The findings here suggest they had little to do with the press looking into her personal life or that of her children and husband. There were in the end, very few stories of this nature: a mere 5% overall and the bulk of those came in the first days of the Republican Convention after the revelation that her teenage daughter was pregnant. Along with getting less coverage overall than some might have expected, these stories were pretty evenly divided among neutral (38%), positive (31%) and negative (31%).
Rather, the most negative element in the press treatment of Palin came from reporters examining her record in office in Alaska, and matching that record to her rhetoric as an ethics and financial reformer. Fully 64% of these stories carried a clearly negative tone versus just 7% (two stories in all) positive. Palin was hurt in the media, in other words, when her pronouncements about saying “thanks, but no thanks” to the Bridge to Nowhere turned out to be problematic, and when details were drawn out about her involvement in the so-called “troopergate” story involving her ex-brother in law.
Stories on the governor’s policy stances such as offshore drilling or troop withdrawals from Iraq were mostly neutral in tone, 65%, but were also nearly three times as negative as positive (26% versus 9% positive).
Other political frames such as fundraising and advertisements were similarly negative, 55% versus 14% positive and 31% neutral.
Tone of Palin Coverage by Frame Percent of Stories
Positive Negative Neutral Personal 38.5% 30.8 30.8 Public Record 7.1% 64.3 28.6 Policy 8.7% 26.1 65.2 Political Horserace 34.5% 34.5 31.0 Advertising, Fundraising*
13.8% 55.2 31.0
*Also includes treatment by the press, electoral calendar and endorsements.
Coverage focused around Palin’s impact on the race was in the end pretty evenly split among positive (34.5%), negative (34.5%) and neutral (31%). Many of these positive assessments about her energizing of the Republican base came early, tracking closely with a boost in public support for McCain.4 As the strategic promise of Palin’s
4 According to the surveys by the Gallup organization, Obama was leading McCain 50% to 42% going into the Republican convention (poll taken August 30 - September 1). Coming out of the convention, McCain had taken a 49% to 44% lead (poll from September 6-8)—a net change of 13 percentage points.
19

presence on the ticket faded, however, negative assessments of her effect on the race increased.
Politically, in other words, Palin appeared in the press as a highly polarizing
figure, either great for the ticket or terrible.
And what about the two one-on-one press interviews that represented rare press access to Palin? Overall, when it came to the tone of the coverage, the first interview with ABC’s Charlie Gibson proved pretty much a wash for the candidate. Nearly half of the stories studied here were neutral (47%). The remainder was a bit more negative than positive.
The interviews with Katie Couric played out much more negatively. More than half (57%) of these stories were negative versus just 14% that carried a clearly positive assessment.
The Couric interviews themselves got less attention in the mainstream media than the Gibson interview, again, in part, perhaps because so much of their impact may have been occurring in the less measurable world of viral media consumption.
The Gibson interview also was the first, so curiosity was higher. And it occurred before the economic blowout, while the Couric series aired right in its midst, the same week as the bailout summit meeting in Washington. The competition for space in the campaign storyline was much greater.
Whether based on these media interviews, the Saturday Night Live skits or broader press coverage, the public seemed to think that the press was too hard on the newly baptized nominee. In an early October survey by the Pew Research Center for the People and the Press, the public was more likely to say the press had been too tough on Palin than they were on any of the other three candidates. When asked, 38% of those surveyed said the press had been too tough on Sarah Palin, versus 23% who said this McCain and just 7% of Obama.
There is one other note to consider about the Palin interviews with ABC and CBS. Those encounters received more scrutiny in significant part because the McCain campaign appeared to be sheltering Palin from the media, a person who was both electrifying and largely unknown. That led the journalists involved to take special effort to prepare for these interviews and also for their organizations to market them in the media. Thus the decision to limit Palin to just a few interviews with a handful of national media, rather than in more frequent but less fraught encounters with the press may have put her at a distinct disadvantage. Joe Biden
20

The Sept. 19 story in the New York Times pretty much summed up the most noteworthy aspect of the coverage of Democratic vice presidential hopeful Joe Biden—how little there was.
“As the economy reels, Senator Joseph R. Biden Jr.—the Other Running Mate— has been absolutely butchering Senator John McCain across the Rust Belt this week,” the story stated. “It is not clear who has noticed.”
From Sept. 8-Oct. 16, there was only one period—the week of the Oct. 2 vice-presidential debate—when Biden generated more than minimal press attention. And in that week, he did quite well in the media narrative, getting twice as much positive overage as negative coverage.
For the rest of the time, however, Biden was practically an afterthought, struggling to generate headlines and attention. And the tone of this coverage of Biden—outside of those from the week of the vice presidential debate—was more negative than positive by a factor of almost three to one.
When it comes to media attention, vice presidential candidates traditionally stand a significant distance behind the figures at the top of the ticket. But in the 2008 campaign, Biden has also played a distinctly secondary role to his Republican counterpart, Sarah Palin.
In the interval examined in this study, Sept. 8-Oct. 16, Biden was a significant factor in only 9% of the campaign stories, making him, by far, the least covered of the four candidates on both tickets. But even that number for Biden is misleading. In only one of those weeks, the one when he debated Palin, did Biden register in more than 6% of the coverage, or more than a handful of stories.
Biden’s one significant moment under the klieg lights of media attention came from Sept. 29-Oct. 5. That week, Biden was a significant or dominant figure in 31% of the campaign stories studied. Even then, however, he paled by comparison to his GOP rival. Fully 51% of the coverage that same week involved Palin, both for her debate performance and for the response to her interviews with CBS’s Katie Couric.
Leading up to the encounter with Palin—which attracted more viewers (73 million) than any of the three presidential debates—there was anticipation about how the gaffe-prone Biden would do. Most of the debate post-mortems credited him with a strong performance. While the broad consensus among media and the political people they interviewed was that both Biden and Palin had accomplished what they needed to, the quick surveys of debate viewers revealed Biden as the convincing winner.
The tone of Biden’s coverage that week seemed to reflect that—33% of his coverage from Sept. 29-Oct. 5 was positive with 53% neutral and 15% negative. That
21

compared favorably with Palin, who got less positive and far more negative coverage than Biden that week, in part from the Couric interviews. 5
Other than that one week, however, Biden’s coverage was among the most negative of any candidate studied, more so than Palin’s and close to McCain’s. Excluding the week of the vice presidential debate, 48% of Biden stories carried a clear negative tone. Another 35% were neutral or mixed. Just 17% were positive.
The numbers seem to reinforce the traditional media view of vice presidential candidates. They can do little to help a candidate at the top of the ticket. But they can hurt him. When Biden made news, outside the debate, it was for apparent gaffes or for pungent attacks.
There are several factors that may help explain Biden’s lack of coverage. As someone who has been in the Senate for 35 years and run twice for President—in 1988 and 2008—the Delaware Senator may be viewed as a known quantity to the press and public, one who requires little new media vetting.
That stands in stark contrast with the media’s perspective toward newcomer Palin
and efforts to examine her career and resume. And in an era of newsroom cuts at many media outlets, the task of extensively covering both presidential contenders and Palin hopeful may have usurped some of the resources that might have been devoted to Biden.
5 There is further evidence of the connection between Biden’s debate performance and an upbeat media narrative. Of the Biden campaign stories that were primarily about that debate, 34% were positive, 51% were neutral and 15% were negative in tone, numbers that correlate very closely with the overall tone of Biden’s press for that period.
22

The Sept. 19 New York Times story noted, for example, that he is followed on the campaign trail by “just a few national reporters.” The Top Storylines
Beyond the candidates, what has the general election narrative been about? Did the economy become an all-encompassing story that dictated the race?
The evidence here suggests that is not what happened. The candidates, their
character, temperament and their ideas, seemed to be the dominant elements of this drama. The economy was a key factor, but at least in the media accounts, it was the candidates as actors against that backdrop, from their choices of running mates to their body language and demeanor in their face to face encounters, that drove the media narrative.
Across the whole six weeks studied here, the economy does appear at the top of
the list. In all, 18% of the campaign newshole studied involved coverage of the economic crisis and the economy generally as they intersected with the campaign.6
But that number is rivaled by the coverage of the debates. The four candidate encounters combined filled 17% of the space and time in the media about the campaign. That offers some insight into how significant debates have become in the architecture, if not the outcome, of our general election periods.
Stories that focused in one way or another on Governor Palin’s impact on the race
made up the No. 3 campaign topic during these weeks, from explorations of her record, voter reaction to her, to her various interviews. Together, these Palin-related topics accounted for 14% of the newshole studied.
Polls came next, at 6%, closely
followed by coverage of the increasingly harsh campaign attacks toward the end of the campaign s attacks at 6%.
A look at the narrative storylines over
time offers some added insight into the question of whether the economic crisis really became the story that ate the campaign. It is possible that, despite the famous aphorism posted in Bill Clinton’s campaign headquarters in Arkansas in 1992 that read “It’s the Economy, Stupid” to signify would the race was about, that wasn’t so precisely the case in the eye of the media this year.
Top Ten Campaign Storylines Percent of Newshole
Economy and the Financial Crisis 18.4%Presidential Debates* 16.6 Palin-related Stories 13.9 McCain vs. Obama Polls 5.8 Candidate Attacks 5.7 McCain Suspends Campaign 4.0 Swing State Strategy 3.5 Voting Issues/Irregularities 2.5 Profiles of McCain 1.9 Iraq War as an Issue 1.0 *This includes the three presidential debates on September 26, October 7 and October 15 as well as the vice presidential debate on October 2.
6 These campaign economic stories are separate from stories about the economy, the rescue plan,
Wall Street, stocks, etc., that did not involve the campaign.
23
The economy was the No. 1 issue the week of September 15-23 (filling 40% of
the campaign newshole), and the week after (September 24-28), when it filled 23%. But the economy receded as a storyline thereafter, to 17% of the campaign
newshole the week of the vice presidential debate, just 12% the week of the second presidential debate, and 15% the week of the final debate.
Indeed, during the last two weeks studied here, which coincided with the last two presidential debates, first character attacks by both candidates and then the last debate, were the No. 1 campaign topics each week.
Frame
In addition to the topics of the news coverage, there is another question—how were these stories framed?
A story involving a presidential debate could focus on what the candidates said,
their strategy, who won, or more. To get at this, the study also examined how stories were put together, or the
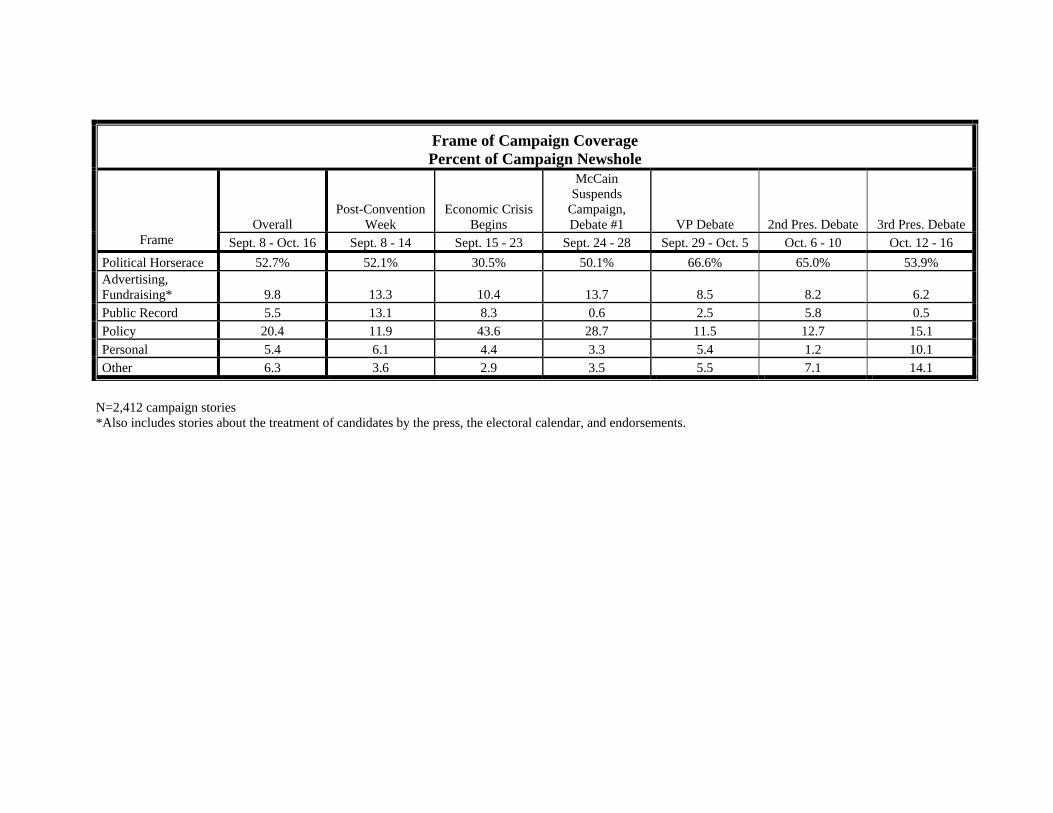
narrative framing. As in past reports, horse race coverage predominated. Such accounts, which
principally involved tactics, strategy, and polling, accounted for 53% of all the coverage. Closely related political matters, such as examination of advertising, fundraising and political endorsements, which weren’t quite so focused on who was ahead or behind, made up another 10%.
Policy, the second largest category of coverage, accounted for 20%. Coverage of
the personal life of candidates filled 5% and examination of public records of the candidates made up 5%.
24

Conclusion
What we see in these findings, above all, are two phenomena. The first is the focus on tactics and strategy. The candidate who was perceived to be winning this year got better coverage. We have seen that pattern before. In 2000, our research saw George Bush receiving more positive coverage than Gore. In 2004, our studies of a narrower time frame saw Kerry enjoying better coverage, as polls perceived his closing the gap on Bush.
The second phenomenon is an almost instantaneous reinforcing and echoing
effect of the press. Presidential elections are now so heavily polled, with various daily tracks and compilations of state-by-state polls, that every campaign event is almost instantly measured for its political impact and that in turn is immediately analyzed by the political press. Each event has in a sense three echoes. The event is covered. The effect is measured. And the reaction to that measurement by the campaigns is then examined and covered.
That pattern becomes a snowball, and the trajectory of any one campaign event is
magnified. Occasionally the news media will alter this dynamic pattern of covering the
candidates’ behavior and then measuring the political effect of it—with their own enterprise or background pieces. This year, stories about Palin’s record or Obama’s relationship with a former terrorist are examples. These may in turn influence the behavior of the candidates. But these enterprise stories represent a fairly limited portion
25

of the coverage. And that enterprise may be diminishing as the press suffers cutbacks in resources. To that extent, the agenda-setting influence of the media may be diminishing.
Even more occasionally the press will influence the narrative by asking questions
of the candidates directly. This, however, is rare in presidential general election periods, when candidates severely limit their exposure to the traveling press corps for direct inquiries. There is relatively little of that in this sample, save for the Palin interviews.
The story of the media coverage of the general election phase of this race, at least
so far, is the snowball effect on John McCain. In the press, this race became substantially defined around the troubles that began for McCain in mid-September and the difficulties he had in trying to change the trajectory of the race in the weeks that followed. With a press corps heavily focused on horse race, and a candidate whose strategy was apparently thrown off by events, he has been unable to change that narrative.
26

Methodology
“WINNING THE MEDIA CAMPAIGN: How the Press Reported the 2008 Presidential General Election” is based on the aggregated data collected as part of the News Coverage Index from September 8 through October 16, 2008. This timeframe begins the Monday following the conclusion of the Republican National Convention and runs through the day after the final presidential debate between John McCain and Barack Obama.
For an accurate account of the chronology of the general election, the period studied has been broken into six distinct phases. These phases have been dictated by the timing of campaign events. Therefore, some of these phases do not correspond with a typical calendar week.
The complete methodology of the PEJ’s News Coverage Index is available here.
In addition to the coding already conducted as part of PEJ’s weekly reports, researchers conducted secondary coding of many of the campaign-focused stories for tone. Details of that process are below.
PEJ’s News Coverage Index
Examining the news agenda of 48 different outlets in five media sectors, including newspapers, online, network TV, cable TV, and radio, the NCI is designed to provide news consumers, journalists and researchers with hard data about what stories and topics the media are covering, the trajectories of major stories and differences among news platforms.
Following a rotation system, PEJ monitors 48 different news outlets each week: 34 or 35 outlets each weekday as well as 7 newspapers each Sunday. The most current list of outlets and rotation schedule is available here.
From that content, PEJ analyzes all stories with a national or international focus that appear as follows:
• On the front page of newspapers • In the entirety of commercial network evening newscasts and syndicated radio
headlines • During the first 30 minutes of network morning news, all cable programs, and talk
radio programs • During a thirty minute segment (rotated daily) of the PBS evening news and
NPR’s Morning Edition • As one of the top 5 stories on each Web site at the time of capture
27

Capture and Retrieval All outlets included in the weekly index are captured and included in PEJ’s media archive.
For newspapers that are available in print in the Washington, D.C. area, we have hard copies delivered to our office each day. For newspapers that are not available for delivery, digital editions of the paper are retrieved either through the newspaper’s own Web site, or through the use of digital delivery services such as pressdisplay.com and newsstand.com. When necessary, the text of articles are supplemented by the archives available in the LexisNexis computer database.
Radio programs are captured through online streams of the shows. Using automated software, we record several local affiliates that air the program in various markets throughout the country. The purpose of this method is to ensure that we have a version of the program in case one of the streams is unavailable on a particular day, and so that we record the show in a manner that represents the way a typical listener would hear the program with commercials and newsbreaks.
Online websites are captured manually by a member of PEJ’s staff. The capture time is rotated daily between 9 am ET and 4 pm ET. The home pages and pages with the top articles for all five sites are saved so that when we reference the material, the format is the same as it appeared online at the time of capture.
Finally, all television shows are recorded digitally and archived for coding purposes. PEJ is a subscriber to DirectTV satellite service and all programs are recorded onto multiple TiVo recording units before being burned onto DVDs for archival purposes.
All television and radio programs are then coded by a member of PEJ’s staff who watches or listens to the archived version of the program.
Coding Team & Process for Weekly Index Coding The data in this study derived from PEJ’s regular Index coding was created by PEJ’s team of 14 trained coders. We have tested all of the variables derived from the regular weekly Index coding and all the variables reached a level of agreement of 80% or higher. For specific information about those tests, see the methodology section for the NCI. A majority of the codes and variables used in this study come out of the coding protocol created for the weekly Campaign Coverage Index which PEJ has been issuing throughout 2008. For the variables of frame/campaign topic, significant presence, and lead newsmaker, the data came from all campaign stories that appeared in PEJ’s weekly coding. The specific description of those variables can be found here.
28

Additional Coding of Campaign Stories for Tone Between September 8 and October 16, the PEJ’s overall Index included 2,412 campaign stories. To measure the tone of the campaign coverage of the major presidential and vice presidential candidates, PEJ’s researchers conducted additional coding on a sample of the campaign stories that appeared in our weekly indexes. Sample Selection Stories in the NCI are considered to be about the presidential election if 50% or more of the story was devoted to discussion of the on-going presidential campaign. To analyze stories about tone about a given candidate, only stories in which at least one of the four major presidential and vice presidential candidates (John McCain, Barack Obama, Sarah Palin, and Joe Biden) were a lead newsmaker were included. For a candidate to be considered a lead newsmaker, they must be featured in at least 50% of the time or space that makes up that story. Two categories of stories were excluded from the sample. Talk radio stories, which are part of PEJ’s regular NCI, were not included in this campaign study of tone. Broadcast stories that were 30 seconds or less were also excluded. PEJ conducted further sampling on the selected stories. This was done by arranging the stories from each outlet in chronological order and randomly selecting a first story. We then selected every-other story within each outlet to arrive at the final sample. This process resulted in 857 total stories from 43 different media outlets. These included 72 newspaper stories, 78 stories from news websites, 213 stories from network TV, 448 from cable TV, and 46 from radio programs. Coding Design The specific analysis of tone was conducted on the subset of campaign stories that was described above. The method of measuring tone was the same that had been used in previous PEJ studies. Unit of Analysis The unit of analysis for this study was the story. Each story was coded for tone for each of the four politicians followed in the study. If a candidate did not appear in at least 25% of the story, they were not considered a significant figure in the story and where therefore coded as “n/a” for not having a significant presence. Coders then determined the tone of the story as a whole for each candidate who was a significant presence. Tone Variable The tone variable measures whether a story’s tone is constructed in a way, via use of quotes, assertions, or innuendo, which results in positive, neutral, or negative coverage for the primary figure as it relates to the topic of the story. While reading or listening to a
29

story, coders tallied up all the comments that have either a negative or positive tone to the reporting. Direct and indirect quotes were counted along with assertions made by journalists themselves. In order for a story to be coded as either “positive” or “negative,” it must have either 1.5 times the amount of positive comments to negative comments, or 1.5 times the amount of negative comments to positive comments (with an exception for 2 to 3, which is coded as “neutral”). If the headline or lead has a positive or negative tone, it was counted twice into the total value. Also counted twice for tone were the first three paragraphs or first four sentences, whichever came first. Any story where the ratio of positive to negative comments was less than 1.5 to 1 was considered a ”neutral” story. In some previous studies, PEJ used a ratio of 2 to 1 instead of 1.5 to 1 in determining the overall tone of news stories. The 2:1 ratio makes sets the bar even higher for a story to be coded as either positive or negative overall. As we entered the 2008 election campaign, PEJ reviewed and retested both the 2:1 ratio and the 1:5 to 1 ratio. We also consulted with academics of content analysis. First, we found only minor shifts in the overall outcome of stories. Indeed, in past content studies where we coded using both ratios, the overall relationship of positive to negative stories changed very little. The bigger difference was in an increase in mixed or neutral stories. In our pre-tests in 2007, the Project felt that the 1.5 to 1 ratio more precisely represented the overall tone of the stories. The academics consulted concurred. Still, in making comparisons to previous years, it is important to note the different measures used. The 1.5 to 1 ratio was used in our previous 2007 study about the Invisible Primary season. The 2 to 1 ratio was used in PEJ’s 2004 report called The Debate Effect and the 2001 report on coverage of George W. Bush’s first 100 days in office. Coding Team & Process for Specific Campaign-related Tone Coding A team of five of PEJ’s experienced coders worked with a coding administrator in order to complete the specific tone coding for the campaign stories. Of the five coders, all but one had previously coded for tone in a previous PEJ campaign study. The previous study that PEJ conducted in October 2007 using the same process for determining tone had a rate of agreement for intercoder reliability of 86%. For this study, each of the five coders were trained (or re-trained) on the tone coding methodology and then were given the same set of 40 stories to code for tone for each of the four candidates. The rate of intercoder reliability agreement was 81%.
30

Topline Winning the Media Campaign: How the Press Reported the 2008 Presidential General Election
Project for Excellence in Journalism
Amount of News Coverage Percent of Campaign Stories Where Each Candidate is a Significant Presence
Overall Palin's Big
Week
Economic Crisis Begins
McCain Suspends
Campaign, Debate #1 VP Debate
2nd Pres. Debate
3rd Pres. Debate
Candidate Sept. 8 - Oct. 16 Sept. 8 - 14 Sept. 15 - 23 Sept. 24 - 28
Sept. 29 - Oct. 5 Oct. 6 - 10 Oct. 12 - 16
Obama 62.4% 61.1% 61.5% 56.5% 40.4% 79.7% 70.4% Biden 9.3 4.9 6.0 6.5 30.7 6.1 3.5 McCain 62.4 50.0 66.1 73.8 39.6 75.1 71.6 Palin 28.4 52.5 23.2 14.5 50.9 17.7 8.3
N=2,412 campaign stories A candidate is considered a significant presence if 25% or more of the story is about him or her.

Tone of Campaign Coverage Percent of Campaign Stories with a Tone
Overall Post-Convention
Week Economic Crisis
Begins
McCain Suspends, Debate #1 VP Debate
2nd Pres. Debate 3rd Pres. Debate
Sept. 8 - Oct. 16 Sept. 8 - 14 Sept. 15 - 23 Sept. 24 - 28 Sept. 29 - Oct. 5 Oct. 6 - 10 Oct. 12 - 16
Candidate Tone # of
stories
% of stories with tone
# of stories
% of stories with tone
# of stories
% of stories with tone
# of stories
% of stories with tone
# of stories
% of stories with tone
# of stories
% of stories with tone
# of stories
% of stories with tone
Obama positive 209 35.8% 21 20.0% 40 35.4% 28 46.7% 28 50.0% 32 25.0% 60 49.6% neutral 204 35.0 41 39.0 39 34.5 27 45.0 21 37.5 38 29.7 38 31.4 negative 170 29.2 43 41.0 34 30.1 5 8.3 7 12.5 58 45.3 23 19.0 n/a 274 59 53 30 82 23 27
Biden positive 28 24.8% 0 0% 7 53.8% 1 11.1% 18 32.7% 0 0% 2 22.2% neutral 49 43.4 8 61.5 2 15.4 2 22.2 29 52.7 4 28.6 4 44.4 negative 36 31.9 5 38.5 4 30.8 6 66.7 8 14.5 10 71.4 3 33.3 n/a 744 151 153 81 83 137 139
McCain positive 84 14.2% 34 37.4% 21 17.1% 8 10.5% 4 6.8% 9 7.1% 8 6.8% neutral 169 28.5 28 30.8 37 30.1 30 39.5 16 27.1 29 23.0 29 24.6 negative 340 57.3 29 31.9 65 52.8 38 50.0 39 66.1 88 69.8 81 68.6 n/a 264 73 43 14 79 25 30
Palin positive 77 28.2% 37 41.1% 9 23.1% 1 7.1% 23 27.7% 4 11.8% 3 23.1% neutral 90 33.0 28 31.1 14 35.9 4 28.6 21 25.3 19 55.9 4 30.8 negative 106 38.8 25 27.8 16 41.0 9 64.3 39 47.0 11 32.4 6 46.2 n/a 584 74 127 76 55 117 135
positive 398 25.5% 92 30.8% 77 26.7% 38 23.9% 73 28.9% 45 14.9% 73 28.0%
neutral 512 32.8 105 35.1 92 31.9 63 39.6 87 34.4 90 29.8 75 28.7All Candidates combined negative 652 41.7 102 34.1 119 41.3 58 36.5 93 36.8 167 55.3 113 43.3
“n/a” indicates that a candidate was not in at least 25% of the story and was not given a tone for that story.
Frame of Campaign Coverage Percent of Campaign Newshole
Overall Post-Convention
Week Economic Crisis
Begins
McCain Suspends
Campaign, Debate #1 VP Debate 2nd Pres. Debate 3rd Pres. Debate
Frame Sept. 8 - Oct. 16 Sept. 8 - 14 Sept. 15 - 23 Sept. 24 - 28 Sept. 29 - Oct. 5 Oct. 6 - 10 Oct. 12 - 16 Political Horserace 52.7% 52.1% 30.5% 50.1% 66.6% 65.0% 53.9% Advertising, Fundraising* 9.8 13.3 10.4 13.7 8.5 8.2 6.2 Public Record 5.5 13.1 8.3 0.6 2.5 5.8 0.5 Policy 20.4 11.9 43.6 28.7 11.5 12.7 15.1 Personal 5.4 6.1 4.4 3.3 5.4 1.2 10.1 Other 6.3 3.6 2.9 3.5 5.5 7.1 14.1
N=2,412 campaign stories *Also includes stories about the treatment of candidates by the press, the electoral calendar, and endorsements.

Frame of Coverage for Each Candidate (From Tone Sample) Percentage of Stories – Sept. 8 – Oct. 16, 2008
Political Horserace Advertising, Fundraising* Personal Policy Public Record Other
# of Stories
% about that
Candidate # of Stories
% about that
Candidate # of Stories
% about that
Candidate # of Stories
% about that
Candidate # of Stories
% about that
Candidate # of Stories
% about that
Candidate
Total # of Stories
Obama 351 60.2% 48 8.2% 13 2.2% 156 26.8% 6 1.0% 9 1.5% 583 Biden 76 67.3 10 8.8 3 2.7 19 16.8 4 3.5 1 0.9 113 McCain 362 61.0 41 6.9 16 2.7 158 26.6 7 1.2 9 1.5 593 Palin 171 62.6 29 10.6 13 4.8 23 8.4 28 10.3 9 3.3 273
*Also includes stories about the treatment by the press, electoral calendar and endorsements.

Tone of Coverage for Each Candidate by Frame Percentage of Stories – Sept. 8 – Oct. 16, 2008
Political Horserace Advertising, Fundraising* Personal Policy Public Record Other
Candidate Tone # of
Stories
% of Stories
with Tone # of
Stories
% of Stories
with Tone # of
Stories
% of Stories
with Tone # of
Stories
% of Stories
with Tone # of
Stories
% of Stories
with Tone # of
Stories
% of Stories
with Tone
Obama positive 129 36.8% 19 39.6% 3 23.1% 54 34.6% 2 33.3% 2 22.2% neutral 115 32.8 18 37.5 3 23.1 63 40.4 2 33.3 3 33.3 negative 107 30.5 11 22.9 7 53.8 39 25.0 2 33.3 4 44.4 n/a 143 25 22 46 32 6
Biden positive 23 30.3% 1 10.0% 0 0% 4 21.1% 0 0% 0 0% neutral 33 43.4 6 60.0 0 0 7 36.8 3 75.0 0 0 negative 20 26.3 3 30.0 3 100 8 42.1 1 25.0 1 100 n/a 418 63 32 183 34 14
McCain positive 49 13.5% 4 9.8% 2 12.5% 28 17.7% 0 0% 1 11.1% neutral 90 24.9 10 24.4 7 43.8 57 36.1 1 14.3 4 44.4 negative 223 61.6 27 65.9 7 43.8 73 46.2 6 85.7 4 44.4 n/a 132 32 19 44 31 6 Palin positive 59 34.5% 4 13.8% 5 38.5% 2 8.7% 2 7.1% 5 55.6% neutral 53 31.0 9 31.0 4 30.8 15 65.2 8 28.6 1 11.1 negative 59 34.5 16 55.2 4 30.8 6 26.1 18 64.3 3 33.3
n/a 323 44 22 179 10 6
positive 260 27.1% 28 21.9% 10 22.2% 88 24.7% 4 8.9% 8 28.6%neutral 291 30.3 43 33.6 14 31.1 142 39.9 14 31.1 8 28.6
All Candidates Combined
negative 409 42.6 57 44.5 21 46.7 126 35.4 27 60.0 12 42.9
*Also includes stories about the treatment by the press, electoral calendar and endorsements. “n/a” indicates that a candidate was not in at least 25% of the story and was not given a tone for that story.