who invents it? - ncwit.org · 4 who invents it women’s participation in information technology,...
TRANSCRIPT

Who invents it?Women’s Participation in Information
Technology Patenting, 2012 Update
Catherine Ashcraft, PhD, National Center for Women & Information Technology (NCWIT)
Anthony Breitzman, PhD, 1790 Analytics, LLC

Who Invents IT? Women’s Participation in Information Technology, 2012 Update www.ncwit.org2
table of contentsInTroDuCTIon 3
SummAry of fInDIngS 3
meThoDology 5 Procedure for Patent Gender-matching 6
Procedure for Assigning Inventorship on Multiple-inventor Patents 8
reSulTS 9 Percentages of IT Patents Held by Women Inventors 9
Percentages of Female IT Patents by IT Subcategory 12
Citation Analysis 15
Organizational Differences in Patenting Patterns 18
Sector Differences in Patenting Patterns 20
ConCluSIon 21
APPenDIx: SummAry of fInDIngS for 22 JAPAneSe-InvenTeD u.S. IT PATenTS
Percentages of IT Patents Held by Women Inventors 22
Trends Over Time 23
Percentages of Female IT Patents by IT Subcategory 23
www.ncwit.org Who Invents IT? Women’s Participation in Information Technology, 2012 Update 3
introductionWhile a number of studies have documented the underrepresentation of women in information technology (IT), few studies have investigated gendered patterns in IT patenting. Patenting, however, is an important measure of innovation and influence in IT and computing. As a result, examining women’s participation in IT patenting is important for helping us understand women’s involvement in the recognized and rewarded aspects of IT innovation, research, and development. Documenting these trends also helps us move beyond merely counting how many women are in computing professions and toward measuring their meaningful participation in the field. Identifying the current state of affairs in female patenting also can provide a benchmark against which to measure future efforts to increase women’s patenting activities. In addition, examining differences in women’s patenting across industry subcategories and across specific organizations is important for uncovering potential areas for future research — research into “what works” in those companies where women patent more frequently.
In 2007, the National Center for Women & Information Technology, in partnership with 1790 Analytics, published its first report on female IT patenting, analyzing records from the U.S. Patent and Trademark Office from 1980-2005. The original report examined female participation in IT patenting and how this participation evolved over the past 25 years. It also identified how female patenting differs across IT industry subcategories and across specific organizations.
This new edition updates those findings, examining U.S. patent data in the intervening five years from 2005-2010. It updates and addresses the following questions:
• What percentage of IT patents are invented by males, females, and mixed-sex teams?
• How have these percentages changed during the past five years? How do these changes compare to the findings from the previous report?
• Do female patenting patterns differ across IT industry subcategories (e.g. Communications and Telecommunications, Computer Hardware, Computer Software, Semiconductors). If so, how and to what extent? Do citation patterns differ for patents invented by male, female, and mixed-sex teams? If so, how and to what extent?
• Do female patenting patterns differ across specific companies, organizations, and sectors (e.g., government, academic, industry)? If so, how, and to what extent?
In addressing these questions, this report also looks at how some of the trends over the past five years are similar to or different from the previous study.
summary of Findings• Percentage of patents with at least one female inventor. In the 31-year
period covered by this study (1980-2010) approximately 13% of U.S.-invented IT patents have at least one female inventor. This reflects an increase from the previous report (1980-2005) when about 9% of U.S.-invented IT patents had at least one female inventor.
• Percentage of patents invented by women, when accounting for multiple inventors. Since many patents have multiple inventors, it is more accurate to count only a fraction of the patent as female (for example, a patent with two female inventors and one male inventor counts as 2/3 female and 1/3 male). Counting this way over the 31-year period, 6.1% of the U.S.-invented IT patents were produced by female inventors; 7.5% were produced by women in the last five years.

Who Invents IT? Women’s Participation in Information Technology, 2012 Update www.ncwit.org4
The chart below illustrates how the above updated findings compare to the original report findings.
orIgInAl rePorT yeArS
(1980-2005)
uPDATeD yeArS
(2006-2010)
ToTAl yeArS STuDIeD
(1980-2010)
% of patents with at least one female inventor(e.g., any patent with at least one female inventor is counted)
9% 16% 13%
% of patents invented by women, when accounting for multiple inventors(e.g., a patent with 2 male and 1 female inventor = counted as 2/3 male and 1/3 female)
4.7% 7.5% 6.1%
• Long-term trends in female patenting. Although the overall level of female participation in IT patents is still relatively low, the trends are quite promising. While, females held only 2% of all IT patents in 1980, their share increased to approximately 6% in 2005 and 8% in 2010.
1980 2005 2010
Long-term trends in female patenting 2% 6% 8%
• Long-term trends in actual numbers of female patenting (as compared to change in percentages). In general, IT patenting has grown substantially over the 31-year period. For female inventors to increase their share of patenting during this period means that female patenting had to grow even more substantially. For example, overall U.S. IT patenting grew from 26,725 patents in the period from 1980-84 to 203,484 patents in the period from 2006-10. This is a 7.5-fold increase. For the same periods, U.S. female IT patenting grew from 611 to 15,292 patents (a 25-fold increase). These growth multiples also are noteworthy because the percentage of women employed in IT remained relatively flat, declining slightly during the past 31-year time period.
1980-84 2006-10
Number of IT Patents (total, male and female) 26,725 203,484(7.5-fold increase)
Number of Female IT Patents 611 15,292 (25-fold increase)
• Citation patterns. Mixed-sex teams still produce the most highly cited patents, with citation patterns 30-40% higher than the norm for patents of similar age and type. Mixed-sex teams average more inventors than either male- or female-only teams, and controlling for size largely accounts for these increased citation numbers. Further research is needed to determine exactly why larger teams produce more highly cited patents. For now, a likely explanation is the fact that during development, inventors and organizations often have an idea of whether an invention is likely to be of significant importance, and that these projects attract more resources and inventors as organizations try to accelerate their development. In addition, it is also possible that originality and diverse thinking do, in fact, influence citation rates but that, at this time, we do not have sensitive enough measures to capture or fully understand these relationships.
• Female patenting patterns in individual companies. Female patenting patterns differ widely from one organization to another. For example, several companies were shown to have 20% to 30% of their patents naming at least one female inventor, while some companies have less than 5% of their patents naming a female inventor. This suggests that individual organizational environments do matter and can influence female patenting patterns. More research is needed to determine the conditions and practices that foster or inhibit female patenting.
www.ncwit.org Who Invents IT? Women’s Participation in Information Technology, 2012 Update 5
MethodologyTo update the original report, NCWIT commissioned 1790 Analytics to analyze U.S. IT patents granted by the U.S. Patent and Trademark Office between 2006-2010, the years since the first report was published. For purposes of this and the previous study, IT patents were defined as any patent that fit into the following categories: Communications and Telecommunications, Computer Hardware, Computer Peripherals, Computer Software, Semiconductors/Solid-state Devices. To identify IT patents, 1790 Analytics used a well-defined set of patent filters consisting of patent classifications and keywords for identifying patents in these categories. This set of patent filters has been tested and refined by 1790 Analytics in previous work.
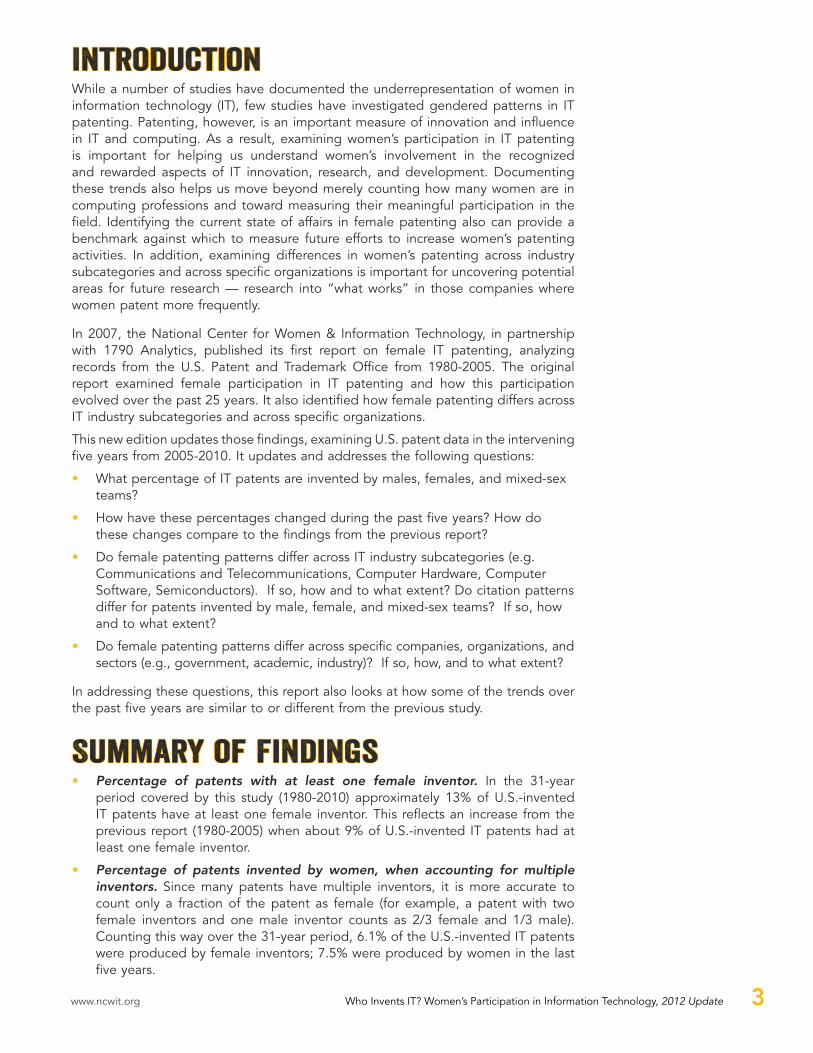
Included patents were limited to those granted by the U.S. Patent and Trademark Office because the U.S. is one of the largest consumers of IT products. As a result, any company wishing to sell these products in the United States would need to obtain a U.S. patent. Figure 1 shows the distribution of U.S. IT patents by inventor country. Roughly 80% of all U.S. IT patents are produced by U.S. and Japanese inventors. Given this distribution, the content of this report focuses on the findings for U.S.-invented IT patents. Summary findings for the Japanese-invented patents are reported in the Appendix.
Who Invents IT? Women’s Participation in Information Technology, 2012 Update www.ncwit.org6
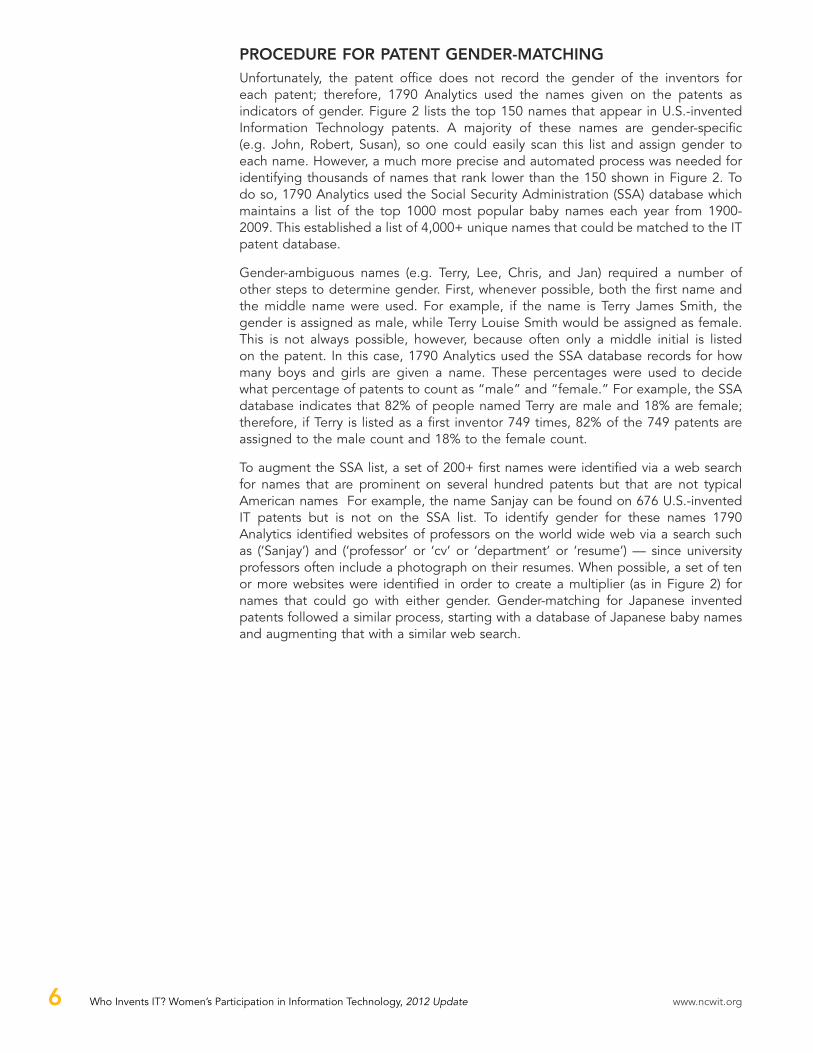
ProCeDure for PATenT genDer-mATChIngUnfortunately, the patent office does not record the gender of the inventors for each patent; therefore, 1790 Analytics used the names given on the patents as indicators of gender. Figure 2 lists the top 150 names that appear in U.S.-invented Information Technology patents. A majority of these names are gender-specific (e.g. John, Robert, Susan), so one could easily scan this list and assign gender to each name. However, a much more precise and automated process was needed for identifying thousands of names that rank lower than the 150 shown in Figure 2. To do so, 1790 Analytics used the Social Security Administration (SSA) database which maintains a list of the top 1000 most popular baby names each year from 1900-2009. This established a list of 4,000+ unique names that could be matched to the IT patent database.
Gender-ambiguous names (e.g. Terry, Lee, Chris, and Jan) required a number of other steps to determine gender. First, whenever possible, both the first name and the middle name were used. For example, if the name is Terry James Smith, the gender is assigned as male, while Terry Louise Smith would be assigned as female. This is not always possible, however, because often only a middle initial is listed on the patent. In this case, 1790 Analytics used the SSA database records for how many boys and girls are given a name. These percentages were used to decide what percentage of patents to count as “male” and “female.” For example, the SSA database indicates that 82% of people named Terry are male and 18% are female; therefore, if Terry is listed as a first inventor 749 times, 82% of the 749 patents are assigned to the male count and 18% to the female count.
To augment the SSA list, a set of 200+ first names were identified via a web search for names that are prominent on several hundred patents but that are not typical American names For example, the name Sanjay can be found on 676 U.S.-invented IT patents but is not on the SSA list. To identify gender for these names 1790 Analytics identified websites of professors on the world wide web via a search such as (‘Sanjay’) and (‘professor’ or ‘cv’ or ‘department’ or ‘resume’) — since university professors often include a photograph on their resumes. When possible, a set of ten or more websites were identified in order to create a multiplier (as in Figure 2) for names that could go with either gender. Gender-matching for Japanese invented patents followed a similar process, starting with a database of Japanese baby names and augmenting that with a similar web search.

www.ncwit.org Who Invents IT? Women’s Participation in Information Technology, 2012 Update 7
fIgure 2Top 150 First Names Appearing in U.S.-invented Information Technology Patents 1980-2010
rAnk #PATenTS mATCh nAme Sex mulTIPlIer rAnk #PATenTS mATCh nAme Sex mulTIPlIer1 51068 DAvID M 76 2371 THeODORe M2 49984 JOHN M 77 2342 DAN M3 46042 RObeRT M 78 2330 JOeL M4 43790 MICHAeL M 79 2314 beNJAMIN M5 39593 JAMeS M 80 2310 JON M6 31602 WILLIAM M 81 2308 HAROLD M7 28279 RICHARD M 82 2278 ROy M8 24716 THOMAS M 83 2272 HARRy M9 24341 MARk M 84 2266 MARC M
10 20015 PAUL M 85 2266 CHRIS M (.86M; .14F)11 17202 STeveN M 86 2257 RALPH M12 15746 JOSePH M 87 2233 kARL M13 14818 CHARLeS M 88 2227 DeAN M14 14806 DANIeL M 89 2172 ALLeN M15 14243 PeTeR M 90 2155 SAMUeL M16 14107 STePHeN M 91 2126 bRADLey M17 13921 JeFFRey M 92 2103 FReD M18 11724 DONALD M 93 2099 STANLey M19 11462 keNNeTH M 94 2090 GORDON M20 11424 CHRISTOPHeR M 95 2064 RANDALL M21 11361 bRIAN M 96 2003 vINCeNT M22 11024 SCOTT M 97 1997 WeI M23 10138 eDWARD M 98 1972 NORMAN M24 10132 eRIC M 99 1959 WARReN M25 9765 GeORGe M 100 1920 FRANCIS M26 9434 kevIN M 101 1918 MING M27 9348 GARy M 102 1876 bReNT M28 9174 ANDReW M 103 1871 kURT M29 8966 RONALD M 104 1841 bRyAN M30 8954 GReGORy M 105 1841 RANDy M31 8739 TIMOTHy M 106 1828 JeFF M32 7938 DOUGLAS M 107 1799 ADAM M33 7190 bRUCe M 108 1768 PHILLIP M34 6620 ALAN M 109 1711 STUART M35 6337 MATTHeW M 110 1711 beRNARD M36 6153 FRANk M 111 1703 GReG M37 6000 ANTHONy M 112 1697 JeAN F38 5278 PATRICk M 113 1681 RAvI M39 5058 PHILIP M 114 1592 GLeN M40 5055 ROGeR M 115 1565 JeROMe M41 4951 LAWReNCe M 116 1559 NeIL M42 4768 LARRy M 117 1555 AARON M43 4747 JONATHAN M 118 1542 MIke M44 4712 DeNNIS M 119 1533 GeOFFRey M45 4469 keITH M 120 1519 ALFReD M46 4410 RAyMOND M 121 1492 TOM M47 4387 CRAIG M 122 1465 vLADIMIR M48 4328 CARL M 123 1452 SUSAN F49 4023 MARTIN M 124 1444 SeAN M50 3934 ALexANDeR M 125 1437 GUy M51 3809 GeRALD M 126 1416 IAN M52 3676 JACk M 127 1410 ALex M53 3599 JASON M 128 1403 RODNey M54 3514 HOWARD M 129 1362 eDWIN M55 3371 FReDeRICk M 130 1359 CURTIS M56 3355 WALTeR M 131 1348 JIM M57 3297 TODD M 132 1297 keN M58 3153 WAyNe M 133 1295 DON M59 3124 ARTHUR M 134 1293 ALLAN M60 3086 LOUIS M 135 1293 HeRbeRT M61 3079 HeNRy M 136 1288 SIMON M61 3006 STeve M 137 1288 eRIk M63 2915 DALe M 138 1279 keNT M64 2885 JAy M 139 1264 NATHAN M65 2826 JeRRy M 140 1258 ALI M (.77M; .23F)66 2739 ALbeRT M 141 1254 JOSe M67 2689 eUGeNe M 142 1230 DeRek M68 2629 bARRy M 143 1216 SANJAy M69 2605 LeONARD M 144 1205 CHUNG M70 2584 vICTOR M 145 1205 JeReMy M71 2577 GLeNN M 146 1203 bReTT M72 2499 TeRRy M (.82M; .18F) 147 1193 RyAN M73 2493 Lee M (.78M; .22F) 148 1171 MARy F74 2471 RUSSeLL M 149 1132 CHRISTIAN M75 2420 NICHOLAS M 150 1096 JOe M
Who Invents IT? Women’s Participation in Information Technology, 2012 Update www.ncwit.org8
In total, 95.5% of the U.S.-invented patents had at least one gender-matchable name and 92.9% of the Japanese-invented patents had at least one gender-matchable name. Most patents have more than one inventor, however. The typical U.S.-invented IT patent has 2.35 U.S. inventors of which 1.95 or 83% were matched. The typical Japanese-invented IT patent has 2.54 Japanese inventors of which 2.03 or 80% were matched.
The process for name matching is rather similar to the match we did for the 2005 report with two exceptions: First, we removed any names that are truly ambiguous. For example, we kept Terry since 82% of the time it is a male name. However, for any names in the 50%-75% male or female range (e.g. Avery or Taylor) we discarded the name as ambiguous. Second, we used the experimental Genderyzer website (http://jofish.com/cgi-bin/genderyze.py) to identify names that are not found in the Social Security database.1
Roughly 15% of patents could not be matched because these names are either missing, obscure, or because only initials are given. The unmatched portion consists of approximately 13,000 names, most of which appear on fewer than 10 patents, leaving roughly 62,000 patents unmatched. To put this in perspective, this is a smaller number of patents than the number invented by the top two inventor names alone — John and David. As such, adding ten, a hundred, or even thousands of names to the database would not significantly change the overall results.
ProCeDure for ASSIgnIng InvenTorShIP on mulTIPle-InvenTor PATenTSWhen multiple inventors produce a patent, accurately crediting the inventorship of that patent becomes difficult. Sometimes companies list the primary inventor first; however, many companies list all inventors alphabetically. As a result, identifying the key researcher and the relative contributions of each author is impossible. Despite this difficulty, many analysts in the industry do assign the patent to the first inventor. because of this precedent, this report also presents results by first inventor, where the gender of the first inventor determines whether the patent is counted as “male-invented” or “female-invented.”
To enhance our understanding of female patenting, however, we also present results using two other counting methods: 1) counting as female all patents that have at least one female inventor and 2) “fractionally attributing” inventorship for each patent. In the first instance, if a patent has one female inventor, it is added to the female count. While this method helps identify patents that would have been overlooked when counting by first author only, it also tends to overestimate female patenting because, for example, a patent that is invented by one female and one male would be counted as female.
To account for this discrepancy, we also then present findings by “fractional attribution,” a method that allows us to account for multiple inventors. For example, suppose a patent lists Susan, Lisa, and John as inventors. In this case 2/3 of the patent is assigned to the female count and 1/3 to the male count. If instead it is invented by Terry, John, and Lisa, the multiplier from Figure 2 for Terry is used. This, then, assigns (0.82*(1/3) + 1/3) = 0.61 to the male count and (0.18*(1/3) + 1/3) = 0.39 to the female count. The next section presents the results by first inventor and then by fractional attribution of inventorship.
1 A brief analysis was undertaken of Genderyzer versus the Social Security Administration (SSA) database prior to completing the patent analysis. The results were largely similar in both cases. However, since the SSA database was used in the previous project, and since it is slightly more accurate with U.S. inventors we decided to use the SSA database as the primary matching source for U.S. inventors.

www.ncwit.org Who Invents IT? Women’s Participation in Information Technology, 2012 Update 9
ResultsPerCenTAgeS of IT PATenTS helD By Women InvenTorS As discussed in the previous section, determining “inventorship” is more difficult than it may first appear, and different counting methods present slightly different pictures. To give the fullest picture, this section presents the percentage of patents invented by women in three different ways: 1) percentage of patents that have a woman listed as the first inventor, 2) percentage of patents with at least one woman inventor, and 3) percentage of patents invented by females when accounting for multiple inventors on one patent.
Percentage of Patents with at Least One Female Inventor. In the 31-year period covered by this study (1980-2010) approximately 13% of U.S.-invented IT patents have at least one female inventor. This reflects an increase from the previous report (1980-2005) when about 9% of U.S.-invented IT patents had at least one female inventor.
Percentage of Patents with Women as “First Inventors.” When considering patents granted between 1980-2010, 94.4% of the matched first inventors on U.S.-invented patents are male and 5.6% of the matched first inventors are female (see Figure 3). Women fared slightly better between 2006-2010 with 7% of patents listing a female first inventor.
Percentage of Female-invented Patents When Accounting for Multiple Inventors. When assigning authorship fractionally — where a patent with one female and two male inventors is counted 1/3 female and 2/3 male (see methods for more detail) — the numbers shift slightly, with 6.1% of U.S.-invented patents being female-invented and 93.9% male-invented (see Figure 4). This is up slightly from the first report when 4.7% of patents were female-invented.

Who Invents IT? Women’s Participation in Information Technology, 2012 Update www.ncwit.org10
To further illuminate the nature of gender and team collaboration over the 31-year period, it is helpful to consider how many U.S.-invented IT patents are produced by teams of multiple inventors and the gender makeup of these collaborative teams (see Figure 5). Roughly 40% of patents are produced by a single male inventor, while only 1.9% are produced by a single female inventor. The second most frequent team composition is two male inventors, accounting for 25% of patents; thus, 65% of all patents are produced by teams of one or two men. While approximately 13% of patents list at least one female, most of these are on teams with at least one male. Figure 6 shows a slight improvement in the last five years with almost 16% of patents having at least one female inventor.
fIgure 5Collaboration Statistics for U.S.-invented Information Technology Patents 1980-2010
(Counts of Gender-matched U.S.-coinvented Patents)
# of mAle CoInvenTorS
# of femAle CoInvenTorS
# of PATenTS % of ToTAl % ofToTAl
1 0 239192 39.65% 39.65%2 0 150012 24.87% 64.52%
3+ 0 137740 22.84% 87.36%3+ 1 20020 3.32% 90.68%1 1 19113 3.17% 93.85%2 1 15677 2.60% 96.45%0 1 11589 1.92% 98.37%
3+ 2 3299 0.55% 98.91%1 2 1916 0.32% 99.23%2 2 1730 0.29% 99.52%0 2 1103 0.18% 99.70%
3+ 3+ 973 0.16% 99.86%2 3+ 371 0.06% 99.92%1 3+ 275 0.05% 99.97%0 3+ 182 0.03% 100.00%
603192 100.00%

www.ncwit.org Who Invents IT? Women’s Participation in Information Technology, 2012 Update 11
fIgure 6Collaboration Statistics for U.S.-invented Information Technology Patents 2006-2010
(Counts of Gender-matched U.S.-coinvented Patents)
# of mAle CoInvenTorS
# of femAle CoInvenTorS
# of PATenTS % of ToTAl % ofToTAl
1 0 72902 35.14% 35.14%3+ 0 52163 25.14% 60.28%2 0 49685 23.95% 84.23%
3+ 1 8837 4.26% 88.49%1 1 7810 3.76% 92.26%2 1 6617 3.19% 95.44%0 1 4735 2.28% 97.73%
3+ 2 1634 0.79% 98.51%1 2 886 0.43% 98.94%2 2 832 0.40% 99.34%0 2 496 0.24% 99.58%
3+ 3+ 442 0.21% 99.80%2 3+ 184 0.09% 99.88%1 3+ 155 0.07% 99.96%0 3+ 86 0.04% 100.00%
207464 100.00%
Trends in Female Patenting Patterns Over Time. Although women’s participation in patenting has been and remains relatively low, the picture improves when we look at trends over time. While women account for only 6.1% of total U.S.- invented patents (when counting fractionally), that percentage has increased steadily from nearly 2% in 1980 to 6% in 2001 to 7.8% in 2010 — nearly a 4-fold increase (see Figure 7). This is particularly noteworthy because, during the past twenty years, the percentage of women employed in IT has remained relatively flat, even declining somewhat from 32% in 1983 to 25% in 2009 (with a high of 37% in 1990-1991).2
2 bureau of Labor Statistics Current Population Survey, 1983-2005 Annual Averages
Who Invents IT? Women’s Participation in Information Technology, 2012 Update www.ncwit.org12
This is perhaps even more promising when considering the growth in IT patenting overall. When looking at trends over the 31-year period, overall U.S.-invented IT patenting has increased approximately twelve-fold since 1980 and more than doubled since 2000. The combination of the 4-fold increase in the percentage of female-invented patents with the 6-fold increase in overall U.S.-invented IT patenting translates to a roughly 24-fold increase in U.S.-invented female IT patenting for the period. In raw numbers, this translates to an increase from 87 U.S.-invented female IT patents in 1980 to more than 2000 in 2005.
PerCenTAgeS of femAle IT PATenTS By IT SuBCATegory
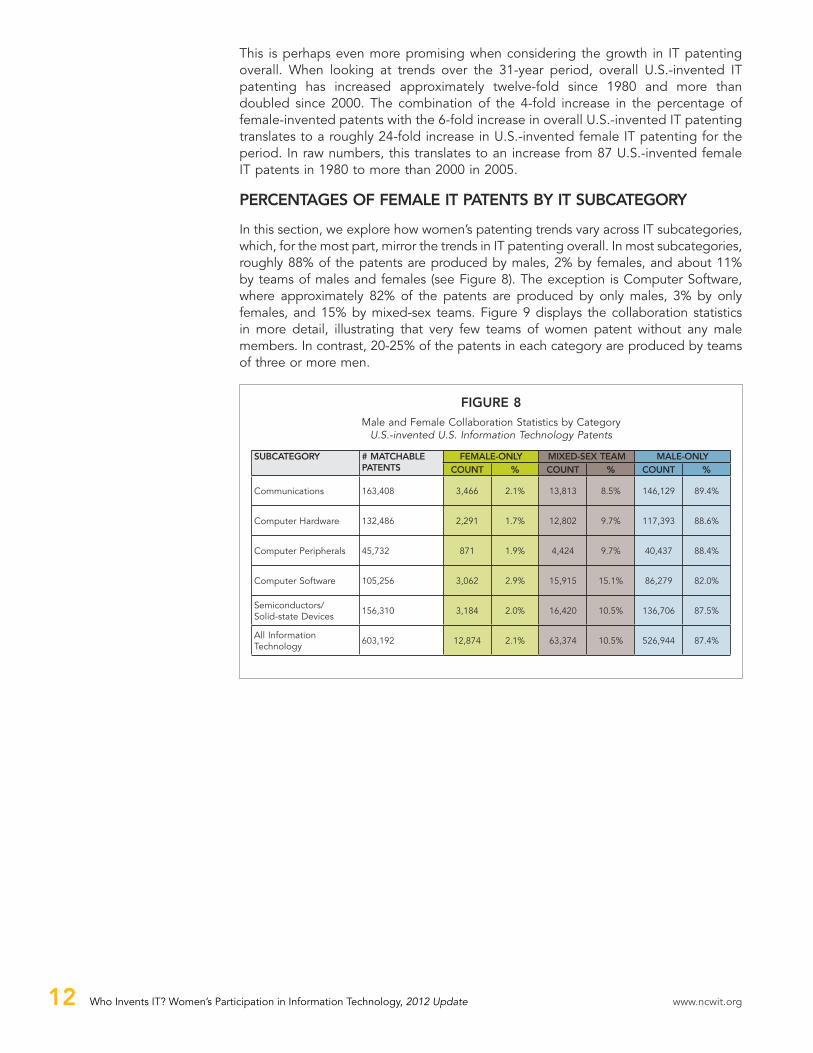
In this section, we explore how women’s patenting trends vary across IT subcategories, which, for the most part, mirror the trends in IT patenting overall. In most subcategories, roughly 88% of the patents are produced by males, 2% by females, and about 11% by teams of males and females (see Figure 8). The exception is Computer Software, where approximately 82% of the patents are produced by only males, 3% by only females, and 15% by mixed-sex teams. Figure 9 displays the collaboration statistics in more detail, illustrating that very few teams of women patent without any male members. In contrast, 20-25% of the patents in each category are produced by teams of three or more men.
fIgure 8Male and Female Collaboration Statistics by Category
U.S.-invented U.S. Information Technology Patents
SuBCATegory # mATChABle PATenTS
femAle-only mIxeD-Sex TeAm mAle-onlyCounT % CounT % CounT %
Communications 163,408 3,466 2.1% 13,813 8.5% 146,129 89.4%
Computer Hardware 132,486 2,291 1.7% 12,802 9.7% 117,393 88.6%
Computer Peripherals 45,732 871 1.9% 4,424 9.7% 40,437 88.4%
Computer Software 105,256 3,062 2.9% 15,915 15.1% 86,279 82.0%
Semiconductors/ Solid-state Devices
156,310 3,184 2.0% 16,420 10.5% 136,706 87.5%
All Information Technology
603,192 12,874 2.1% 63,374 10.5% 526,944 87.4%

www.ncwit.org Who Invents IT? Women’s Participation in Information Technology, 2012 Update 13
fIgure 9Detailed Male and Female Collaboration Statistics by Category
SuBCATegory # of mAle CoInvenTorS
# of femAle CoInvenTorS
# of u.S.-InvenTeD u.S. IT PATenTS
% of ToTAl
Communications
1 0 70,885 43.382 0 41,074 25.14
3+ 0 34,170 20.911 1 4,685 2.87
3+ 1 4,073 2.492 1 3,492 2.140 1 3,200 1.96
3+ 2 590 0.361 2 384 0.232 2 301 0.180 2 239 0.15
3+ 3+ 171 0.102 3+ 67 0.041 3+ 50 0.030 3+ 27 0.02
Computer hardware
1 0 50,343 38.003+ 0 33,764 25.482 0 33,286 25.12
3+ 1 4,474 3.381 1 3,666 2.772 1 3,156 2.380 1 2,034 1.54
3+ 2 667 0.501 2 290 0.222 2 286 0.220 2 208 0.16
3+ 3+ 177 0.132 3+ 54 0.040 3+ 49 0.041 3+ 32 0.02
Computer Peripherals
1 0 18,261 39.932 0 11,389 24.90
3+ 0 10,787 23.593+ 1 1,497 3.271 1 1,309 2.862 1 1,099 2.400 1 792 1.73
3+ 2 200 0.441 2 122 0.272 2 113 0.250 2 67 0.15
3+ 3+ 41 0.092 3+ 34 0.070 3+ 12 0.031 3+ 9 0.02
Computer Software
1 0 37,750 35.862 0 24,582 23.35
3+ 0 23,947 22.753+ 1 4,854 4.611 1 4,294 4.082 1 3,798 3.610 1 2,646 2.51
3+ 2 1,034 0.981 2 651 0.622 2 575 0.55
3+ 3+ 417 0.400 2 342 0.322 3+ 159 0.151 3+ 133 0.130 3+ 74 0.07
Semiconductors/Solid-state Devices
1 0 61,953 39.632 0 39,681 25.39
3+ 0 35,072 22.441 1 5,159 3.30
3+ 1 5,122 3.282 1 4,132 2.640 1 2,917 1.87
3+ 2 808 0.521 2 469 0.302 2 455 0.290 2 247 0.16
3+ 3+ 167 0.112 3+ 57 0.041 3+ 51 0.030 3+ 20 0.01
Who Invents IT? Women’s Participation in Information Technology, 2012 Update www.ncwit.org14
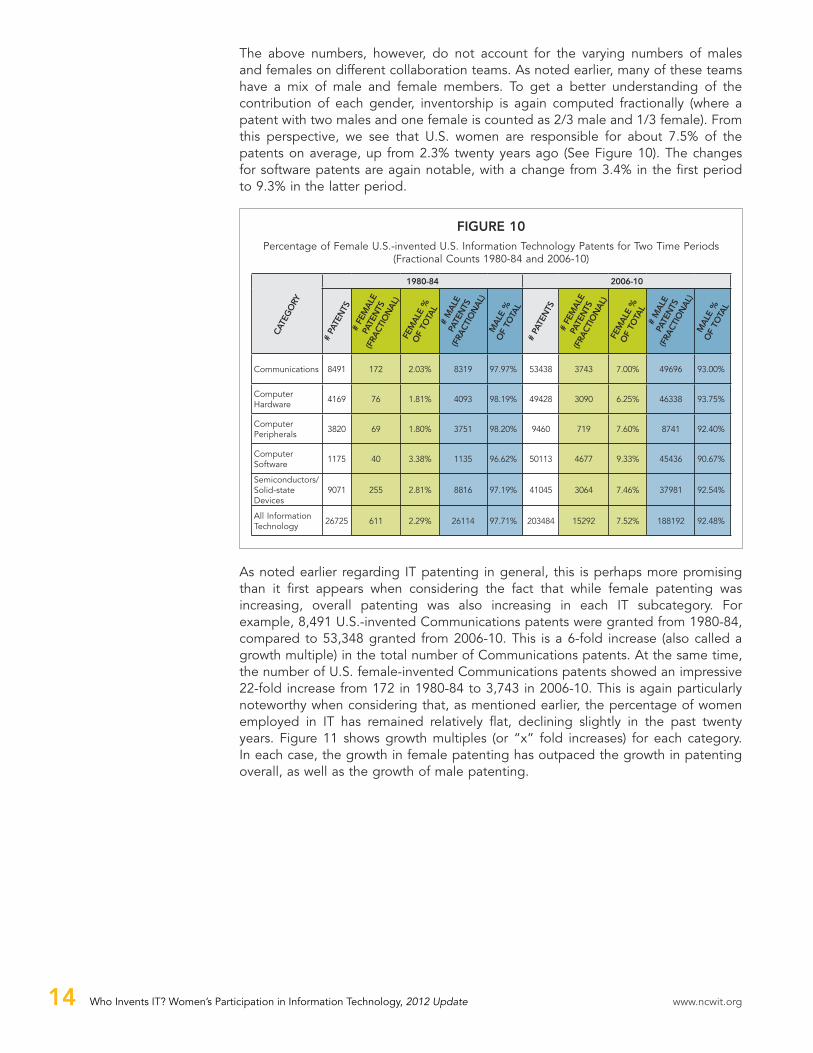
The above numbers, however, do not account for the varying numbers of males and females on different collaboration teams. As noted earlier, many of these teams have a mix of male and female members. To get a better understanding of the contribution of each gender, inventorship is again computed fractionally (where a patent with two males and one female is counted as 2/3 male and 1/3 female). From this perspective, we see that U.S. women are responsible for about 7.5% of the patents on average, up from 2.3% twenty years ago (See Figure 10). The changes for software patents are again notable, with a change from 3.4% in the first period to 9.3% in the latter period.
fIgure 10Percentage of Female U.S.-invented U.S. Information Technology Patents for Two Time Periods
(Fractional Counts 1980-84 and 2006-10)
1980-84 2006-10
Communications 8491 172 2.03% 8319 97.97% 53438 3743 7.00% 49696 93.00%
Computer Hardware 4169 76 1.81% 4093 98.19% 49428 3090 6.25% 46338 93.75%
Computer Peripherals 3820 69 1.80% 3751 98.20% 9460 719 7.60% 8741 92.40%
Computer Software 1175 40 3.38% 1135 96.62% 50113 4677 9.33% 45436 90.67%
Semiconductors/Solid-state Devices
9071 255 2.81% 8816 97.19% 41045 3064 7.46% 37981 92.54%
All Information Technology 26725 611 2.29% 26114 97.71% 203484 15292 7.52% 188192 92.48%
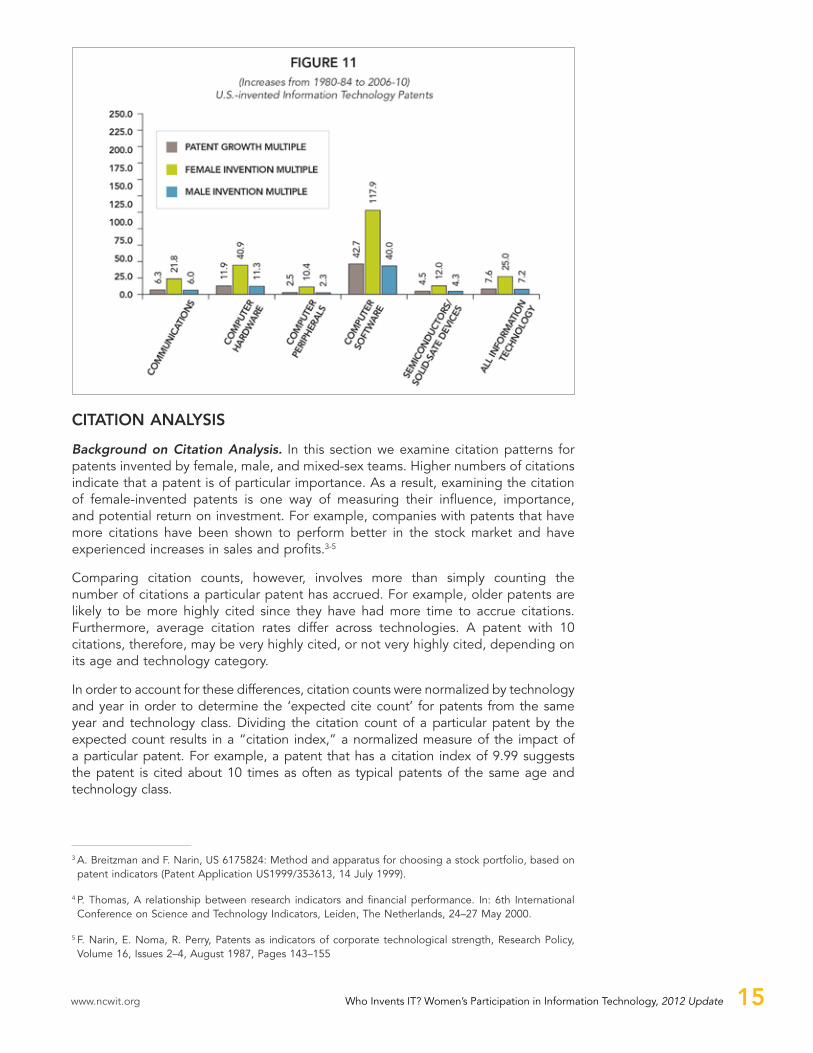
As noted earlier regarding IT patenting in general, this is perhaps more promising than it first appears when considering the fact that while female patenting was increasing, overall patenting was also increasing in each IT subcategory. For example, 8,491 U.S.-invented Communications patents were granted from 1980-84, compared to 53,348 granted from 2006-10. This is a 6-fold increase (also called a growth multiple) in the total number of Communications patents. At the same time, the number of U.S. female-invented Communications patents showed an impressive 22-fold increase from 172 in 1980-84 to 3,743 in 2006-10. This is again particularly noteworthy when considering that, as mentioned earlier, the percentage of women employed in IT has remained relatively flat, declining slightly in the past twenty years. Figure 11 shows growth multiples (or “x” fold increases) for each category. In each case, the growth in female patenting has outpaced the growth in patenting overall, as well as the growth of male patenting.
www.ncwit.org Who Invents IT? Women’s Participation in Information Technology, 2012 Update 15
CITATIon AnAlySIS
Background on Citation Analysis. In this section we examine citation patterns for patents invented by female, male, and mixed-sex teams. Higher numbers of citations indicate that a patent is of particular importance. As a result, examining the citation of female-invented patents is one way of measuring their influence, importance, and potential return on investment. For example, companies with patents that have more citations have been shown to perform better in the stock market and have experienced increases in sales and profits.3-5
Comparing citation counts, however, involves more than simply counting the number of citations a particular patent has accrued. For example, older patents are likely to be more highly cited since they have had more time to accrue citations. Furthermore, average citation rates differ across technologies. A patent with 10 citations, therefore, may be very highly cited, or not very highly cited, depending on its age and technology category.
In order to account for these differences, citation counts were normalized by technology and year in order to determine the ‘expected cite count’ for patents from the same year and technology class. Dividing the citation count of a particular patent by the expected count results in a “citation index,” a normalized measure of the impact of a particular patent. For example, a patent that has a citation index of 9.99 suggests the patent is cited about 10 times as often as typical patents of the same age and technology class.
3 A. breitzman and F. Narin, US 6175824: Method and apparatus for choosing a stock portfolio, based on patent indicators (Patent Application US1999/353613, 14 July 1999).
4 P. Thomas, A relationship between research indicators and financial performance. In: 6th International Conference on Science and Technology Indicators, Leiden, The Netherlands, 24–27 May 2000.
5 F. Narin, e. Noma, R. Perry, Patents as indicators of corporate technological strength, Research Policy, volume 16, Issues 2–4, August 1987, Pages 143–155

Who Invents IT? Women’s Participation in Information Technology, 2012 Update www.ncwit.org16
The citation index can be extended beyond a single patent to a set of patents (i.e., all male-invented Communication patents, all female-invented Communications patents, or all mixed-sex team invented Communications patents — see Figure 12). In fact, applying the citation index to a set of patents tends to provide a more accurate picture since a larger patent set will dilute the effects of any outliers. The citation index for a set of patents is determined by taking the sum of the citations for that set (i.e., the sum of the citations for all male-invented Communications patents) and dividing by the sum of the expected citation counts for all Communications patents. 6 Applying the citation index to these patent sets allows us to compare patent sets of differing sizes with different age profiles (e.g., compare the averages for all of the male-invented Communications patents, all of the female-invented Communications patents, all of the mixed-sex team).
Differences in Citation Patterns for Male, Female, and Mixed-sex Teams. Among U.S-invented patents, 7 patents invented by mixed-sex teams — teams consisting of at least one female and at least one male — are cited 30-40% more often than patents invented by female-only or male-only teams. In the original study, we noted that both the diversity of thought and the fact that mixed-sex teams tend to be larger might be possible explanations that would lead to more innovative inventions. In this update, we investigated the relationship between mixed-sex teams and citation patterns further and found that controlling for size largely accounts for these increased citation counts.
So why exactly do larger teams produce more highly cited patents? We investigated a few possible explanations, but, to date, the answer remains unclear. First, as one can see from Figure 13, the originality index also rises with team size. This index measures the extent to which a patent draws on a wider range of prior art or different kinds of technologies. In other words, a relatively simple or incremental invention will have a lower index than complex inventions drawing from multiple areas of technical expertise. Initially, we thought perhaps the higher originality indexes of larger teams might explain their higher numbers of citations. A regression analysis, however, revealed that originality has very little explanatory power for higher numbers of citations once team size is factored in. In other words, team size seems to matter more than the originality index when predicting higher numbers of citations. This result, however, might be because the originality index is a rather insensitive measure — that is, it is primarily designed to distinguish highly original patents rather than to measure smaller differences in originality.
6 Remember that Communications patents will have different expected counts depending on age of patents, so we add these different expected citation counts for different ages to get the average expected citation count for all Communications patents. We then divide the total number of citations for male-invented patents by this overall expected citation count. This process is repeated for female and mixed-sex invented patents.
7 Citation indexes are based on the average of all U.S. patents in each technology class invented anywhere in the world (including the U.S., Japan, and all other countries filing patents).
In general, we see that U.S.-invented IT patents have a higher citation index than Japanese-invented IT patents. All of the U.S.-invented patent sets have citation indices exceeding 1.0, suggesting that the U.S.-invented IT patents are cited more often than average for all U.S. patents invented in other countries of the same age and technology class.

www.ncwit.org Who Invents IT? Women’s Participation in Information Technology, 2012 Update 17
fIgure 12Citation Impact by Gender and Information Technology Category
U.S.-invented U.S. Information Technology Patents
femAle-only InvenTeD mAle-only InvenTeD mIxeD-genDer TeAm
# PATenTS 1980-2010
CITATIon InDex
# PATenTS 1980-2010
CITATIon InDex
# PATenTS 1980-2010
CITATIon InDex
Communications 3466 1.11 146129 1.17 13813 1.37
Computer Hardware 2291 1.06 117393 1.24 12802 1.34
Computer Peripherals 871 1.09 40437 1.29 4424 1.41
Computer Software 3062 1.18 86279 1.32 15915 1.35
Semiconductors/ Solid-state Devices 3184 1.24 136706 1.28 16420 1.43
Japanese-invented U.S. Information Technology Patents
femAle-only InvenTeD mAle-only InvenTeD mIxeD-genDer TeAm
# PATenTS 1980-2010
CITATIon InDex
# PATenTS 1980-2010
CITATIon InDex
# PATenTS 1980-2010
CITATIon InDex
Communications 913 0.63 64380 0.73 3550 0.79
Computer Hardware 702 0.61 50782 0.75 2805 0.72
Computer Peripherals 653 0.86 67680 0.89 4797 1.06
Computer Software 724 0.59 27480 0.69 2601 0.67
Semiconductors/ Solid-state Devices 1208 0.67 84450 0.88 5949 0.98
Highest Cited Patent Set Second Highest Cited Patent Set Third Highest Patent Set

Who Invents IT? Women’s Participation in Information Technology, 2012 Update www.ncwit.org18
We also found no consistent significant relationship (using one-way ANOvAs) between the citation index and team characteristics such as self-citations, sector of organization (e.g., university, industry, non-profit) or country of organization. Further research is needed to determine exactly why larger teams produce more highly cited patents. For now, a likely explanation is the fact that during development, inventors and organizations often have an idea of whether an invention is likely to be of significant importance. Technologies that look particularly promising will attract more resources and inventors as organizations try to accelerate their development. In addition, inventors will happily join technical projects that look to be particularly promising. Similarly, it is also still possible that originality and diverse thinking do, in fact, influence citation rates but that, at this time, we do not have sensitive enough measures to capture or fully understand these relationships.
orgAnIzATIonAl DIfferenCeS In PATenTIng PATTernS
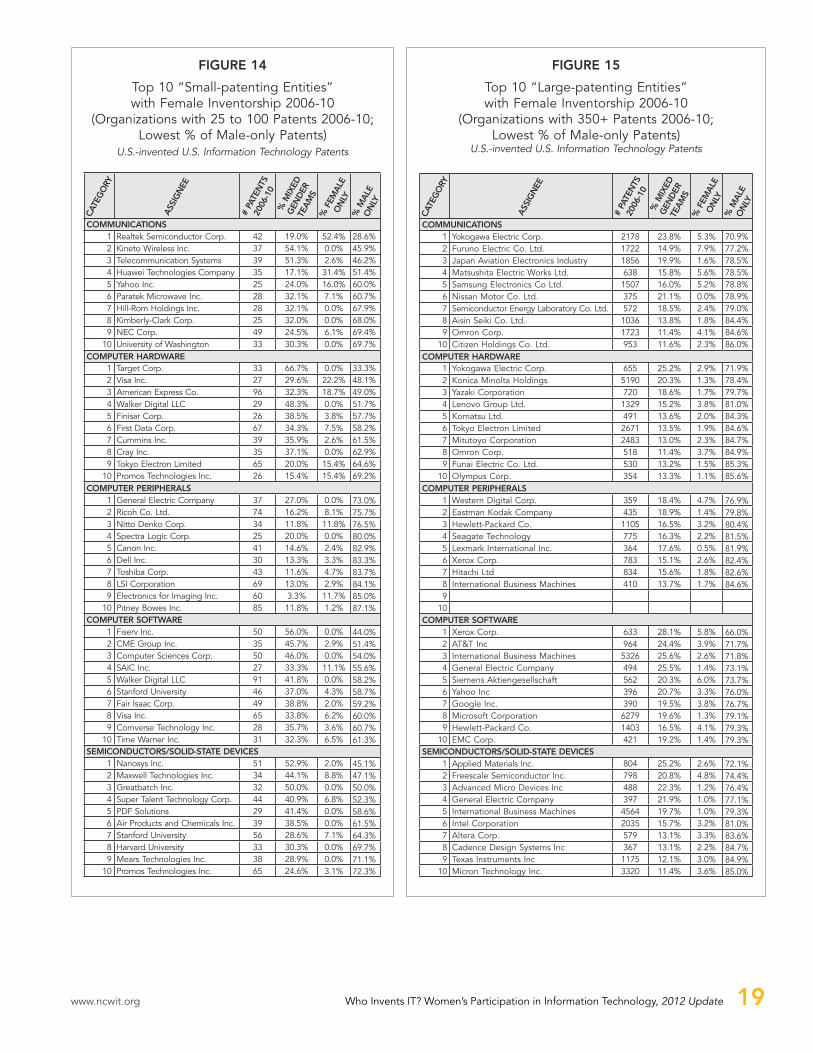
This section explores female IT patenting patterns across different organizations by examining the patenting trends in all companies with more than 10 IT patents between 2000-2005. This analysis reveals that female patenting patterns differ widely from one organization to another. In both “small patenting entities” (those with less than 100 patents during 2006-2010) and “large patenting entities” (those with at least 350 patents during 2006-2010), male, female and mixed-sex team patenting varies widely.
Small-patenting Entities. Figure 14 identifies the top 10 “small patenting entities” with the lowest percent of male-only patents in each of the five industry subcategories. (Identifying the lowest percent of male-only patents is the easiest way to identify companies with the highest percentage of female only or mixed-sex team patents overall.) When considering all 50 of these “small-patenting entities,” female patenting, for the most part, ranged from 0-22%, with two companies as exceptions at 31% and 52%. In these same 50 companies, patenting for mixed-sex teams ranged from 3% to nearly 67%, with most companies falling between 30-50%. In 37 companies, mixed-sex team patenting exceeded 20%. All of the top 50 small-patenting entities had at least some mixed-sex teams with patents (with 3.3% being the lowest percentage). Seventeen companies had no female-only-invented patents, but all of these companies had mixed-sex team patents, ranging from 27-67%.
When considering industry subcategories, Computer Hardware, Computer Software, and Semiconductors/Solid-state Devices have higher levels of mixed-sex team patenting, ranging from roughly 25% to 67% with almost two-thirds of these companies having levels above 35%. In contrast, Communications and Computer Peripherals have lower mixed-sex team patenting levels, with a range from 3.3% to 54%, with only two — or 10% — of these companies having levels above 35%.
Large-patenting Entities. In general, large-patenting companies (those with more than 350 patents during 2000-2005) experienced a narrower range of female patenting but still differed dramatically (see Figure 15). In these companies, female-only invented patenting typically ranged from 0.5–8%. Only one company had no female-only invented patents, but this company did have 21% of its patents invented by mixed-sex teams. Mixed-sex team patents ranged from approximately 11–28%, with 14 companies exceeding 20%.
www.ncwit.org Who Invents IT? Women’s Participation in Information Technology, 2012 Update 19
fIgure 14
Top 10 “Small-patenting entities” with Female Inventorship 2006-10
(Organizations with 25 to 100 Patents 2006-10; Lowest % of Male-only Patents)
U.S.-invented U.S. Information Technology Patents
CommunICATIonS1 Realtek Semiconductor Corp. 42 19.0% 52.4% 28.6%2 kineto Wireless Inc. 37 54.1% 0.0% 45.9%3 Telecommunication Systems 39 51.3% 2.6% 46.2%4 Huawei Technologies Company 35 17.1% 31.4% 51.4%5 yahoo Inc. 25 24.0% 16.0% 60.0%6 Paratek Microwave Inc. 28 32.1% 7.1% 60.7%7 Hill-Rom Holdings Inc. 28 32.1% 0.0% 67.9%8 kimberly-Clark Corp. 25 32.0% 0.0% 68.0%9 NeC Corp. 49 24.5% 6.1% 69.4%
10 University of Washington 33 30.3% 0.0% 69.7%ComPuTer hArDWAre
1 Target Corp. 33 66.7% 0.0% 33.3%2 visa Inc. 27 29.6% 22.2% 48.1%3 American express Co. 96 32.3% 18.7% 49.0%4 Walker Digital LLC 29 48.3% 0.0% 51.7%5 Finisar Corp. 26 38.5% 3.8% 57.7%6 First Data Corp. 67 34.3% 7.5% 58.2%7 Cummins Inc. 39 35.9% 2.6% 61.5%8 Cray Inc. 35 37.1% 0.0% 62.9%9 Tokyo electron Limited 65 20.0% 15.4% 64.6%
10 Promos Technologies Inc. 26 15.4% 15.4% 69.2%ComPuTer PerIPherAlS
1 General electric Company 37 27.0% 0.0% 73.0%2 Ricoh Co. Ltd. 74 16.2% 8.1% 75.7%3 Nitto Denko Corp. 34 11.8% 11.8% 76.5%4 Spectra Logic Corp. 25 20.0% 0.0% 80.0%5 Canon Inc. 41 14.6% 2.4% 82.9%6 Dell Inc. 30 13.3% 3.3% 83.3%7 Toshiba Corp. 43 11.6% 4.7% 83.7%8 LSI Corporation 69 13.0% 2.9% 84.1%9 electronics for Imaging Inc. 60 3.3% 11.7% 85.0%
10 Pitney bowes Inc. 85 11.8% 1.2% 87.1%ComPuTer SofTWAre
1 Fiserv Inc. 50 56.0% 0.0% 44.0%2 CMe Group Inc. 35 45.7% 2.9% 51.4%3 Computer Sciences Corp. 50 46.0% 0.0% 54.0%4 SAIC Inc. 27 33.3% 11.1% 55.6%5 Walker Digital LLC 91 41.8% 0.0% 58.2%6 Stanford University 46 37.0% 4.3% 58.7%7 Fair Isaac Corp. 49 38.8% 2.0% 59.2%8 visa Inc. 65 33.8% 6.2% 60.0%9 Comverse Technology Inc. 28 35.7% 3.6% 60.7%
10 Time Warner Inc. 31 32.3% 6.5% 61.3%SemIConDuCTorS/SolID-STATe DevICeS
1 Nanosys Inc. 51 52.9% 2.0% 45.1%2 Maxwell Technologies Inc. 34 44.1% 8.8% 47.1%3 Greatbatch Inc. 32 50.0% 0.0% 50.0%4 Super Talent Technology Corp. 44 40.9% 6.8% 52.3%5 PDF Solutions 29 41.4% 0.0% 58.6%6 Air Products and Chemicals Inc. 39 38.5% 0.0% 61.5%7 Stanford University 56 28.6% 7.1% 64.3%8 Harvard University 33 30.3% 0.0% 69.7%9 Mears Technologies Inc. 38 28.9% 0.0% 71.1%
10 Promos Technologies Inc. 65 24.6% 3.1% 72.3%
fIgure 15
Top 10 “Large-patenting entities” with Female Inventorship 2006-10
(Organizations with 350+ Patents 2006-10; Lowest % of Male-only Patents)
U.S.-invented U.S. Information Technology Patents
CommunICATIonS1 yokogawa electric Corp. 2178 23.8% 5.3% 70.9%2 Furuno electric Co. Ltd. 1722 14.9% 7.9% 77.2%3 Japan Aviation electronics Industry 1856 19.9% 1.6% 78.5%4 Matsushita electric Works Ltd. 638 15.8% 5.6% 78.5%5 Samsung electronics Co Ltd. 1507 16.0% 5.2% 78.8%6 Nissan Motor Co. Ltd. 375 21.1% 0.0% 78.9%7 Semiconductor energy Laboratory Co. Ltd. 572 18.5% 2.4% 79.0%8 Aisin Seiki Co. Ltd. 1036 13.8% 1.8% 84.4%9 Omron Corp. 1723 11.4% 4.1% 84.6%
10 Citizen Holdings Co. Ltd. 953 11.6% 2.3% 86.0%ComPuTer hArDWAre
1 yokogawa electric Corp. 655 25.2% 2.9% 71.9%2 konica Minolta Holdings 5190 20.3% 1.3% 78.4%3 yazaki Corporation 720 18.6% 1.7% 79.7%4 Lenovo Group Ltd. 1329 15.2% 3.8% 81.0%5 komatsu Ltd. 491 13.6% 2.0% 84.3%6 Tokyo electron Limited 2671 13.5% 1.9% 84.6%7 Mitutoyo Corporation 2483 13.0% 2.3% 84.7%8 Omron Corp. 518 11.4% 3.7% 84.9%9 Funai electric Co. Ltd. 530 13.2% 1.5% 85.3%
10 Olympus Corp. 354 13.3% 1.1% 85.6%ComPuTer PerIPherAlS
1 Western Digital Corp. 359 18.4% 4.7% 76.9%2 eastman kodak Company 435 18.9% 1.4% 79.8%3 Hewlett-Packard Co. 1105 16.5% 3.2% 80.4%4 Seagate Technology 775 16.3% 2.2% 81.5%5 Lexmark International Inc. 364 17.6% 0.5% 81.9%6 xerox Corp. 783 15.1% 2.6% 82.4%7 Hitachi Ltd 834 15.6% 1.8% 82.6%8 International business Machines 410 13.7% 1.7% 84.6%9
10ComPuTer SofTWAre
1 xerox Corp. 633 28.1% 5.8% 66.0%2 AT&T Inc 964 24.4% 3.9% 71.7%3 International business Machines 5326 25.6% 2.6% 71.8%4 General electric Company 494 25.5% 1.4% 73.1%5 Siemens Aktiengesellschaft 562 20.3% 6.0% 73.7%6 yahoo Inc 396 20.7% 3.3% 76.0%7 Google Inc. 390 19.5% 3.8% 76.7%8 Microsoft Corporation 6279 19.6% 1.3% 79.1%9 Hewlett-Packard Co. 1403 16.5% 4.1% 79.3%
10 eMC Corp. 421 19.2% 1.4% 79.3%SemIConDuCTorS/SolID-STATe DevICeS
1 Applied Materials Inc. 804 25.2% 2.6% 72.1%2 Freescale Semiconductor Inc. 798 20.8% 4.8% 74.4%3 Advanced Micro Devices Inc 488 22.3% 1.2% 76.4%4 General electric Company 397 21.9% 1.0% 77.1%5 International business Machines 4564 19.7% 1.0% 79.3%6 Intel Corporation 2035 15.7% 3.2% 81.0%7 Altera Corp. 579 13.1% 3.3% 83.6%8 Cadence Design Systems Inc 367 13.1% 2.2% 84.7%9 Texas Instruments Inc 1175 12.1% 3.0% 84.9%
10 Micron Technology Inc. 3320 11.4% 3.6% 85.0%
Who Invents IT? Women’s Participation in Information Technology, 2012 Update www.ncwit.org20
A number of companies have also produced large increases in female patenting in the past five years, with 20 companies posting more than a 20% increase in their mixed-sex or female-invented patenting. At the same time, the percentage of female inventorship in some companies actually decreased, with 22 companies posting more than a 20% decline in mixed-sex or female-invented patents.
These patenting data alone tell us little about the reasons for the dramatic differences across organizations. As a result, future research would do well to explore how the demographic makeup and size of a company influences higher levels of female patenting. For example, do companies with higher levels of female patenting also employ larger numbers of women from the start? How is women’s participation in patenting distributed in these companies? (e.g., are higher female patenting percentages due to large numbers of women patenting in these companies or to a few prolific women filing patents?) How does overall company size affect patterns in female patenting? What other characteristics, if any, do higher female-patenting companies share? Do specific organizational practices and conditions increase female patenting and if so, in what ways? This additional research is necessary to understand the reasons for the existing variance across companies. The fact that these differences exist, however, does suggest that specific contexts do make a difference and that there is no industry-wide systemic reason for the low level of female patenting overall.
SeCTor DIfferenCeS In PATenTIng PATTernS
In this section, we examine sector differences in female IT patenting. Approximately 78% of U.S.-invented IT patents are assigned to U.S. companies while another 12% of IT patents are invented by U.S.-based inventors of foreign firms such as Alcatel-Lucent, Siemens, or Philips. Only about 7% of U.S. IT patents are held by individual inventors and only 2% of U.S.-invented IT patents come from universities, with even fewer from government agencies or non-profits.
If we look at the overall combined category of IT patents (Figure 16), we see that U.S. universities have the highest percentage of female inventorship in each time period. From 2006-10, 9.43% of U.S.-invented IT patents from universities were invented by women, compared to 8.21% for women in foreign-owned firms with U.S. operations, and 7.34% for women in U.S. firms. It is unclear why foreign firms with labs in the U.S. like Alcatel-Lucent or Philips or Sony would have a higher percentage of patents invented by women, but that seems to be the case in each category except for Computer Peripherals and Computer Hardware. Interestingly, in the last five years, the highest percentage of female inventorship occurred in the U.S. labs of foreign corporations (11.11%), followed by U.S. government labs (10.61%). U.S. universities and U.S. corporations followed with 10.12% and 9.05%, respectively.
While overall female patenting is highest in Computer Software, software is one of the few categories where universities do not lead in the percentage of patents held by women.
Another interesting finding occurs in the Computer Peripheral category where the sector with the highest percentage of female-invented patents is the individual inventor sector where women hold 11.28% in 2006-10. evidently, there are a number of women tinkering on their own in order to come up with the next great printer or storage device. This finding also raises interesting questions about the kinds of environments that foster female patenting.

www.ncwit.org Who Invents IT? Women’s Participation in Information Technology, 2012 Update 21
ConclusionThe National Center for Women & Information Technology, with funding from its Workforce Alliance, commissioned this study to provide insight into the current state of affairs regarding female patenting. The bad news is that patenting by females in IT is relatively low in the U.S. The good news is that the trends are positive with a growing share of female inventorship in a fast-growing field. The news is even better in some subcategories of IT such as Software, and to a lesser extent in Hardware.
Likewise, the finding that mixed-sex teams are more frequently cited than either male-only or female-only teams is still an interesting finding. While this advantage seems primarily related to size of team, future research would do well to explore the relationship between size, gender, and citation patterns.
Additional good news emerges in the finding that the level of female inventorship in IT is quite high at some companies. This suggests that systemic factors, such as company environment, can make a difference. As such, women could continue to gain greater shares of IT invention, especially if we identify and replicate the conditions and practices that foster women’s increased patenting efforts. This report then serves as a call for future research to identify the conditions and practices that would make this possible.

Who Invents IT? Women’s Participation in Information Technology, 2012 Update www.ncwit.org22
Appendix: summary of Findings for Japanese-invented U.s. it patentsPerCenTAgeS of IT PATenTS helD By Women InvenTorS • From 1980-2010, 7.5% of Japanese-invented U.S. IT patents had at least one
female; this is a slight increase from 6.5% in the previous study. This is a bit lower than the U.S.-invented percentage of 13%, which had increased from 9% in the previous study.
• When assigning inventorship by first inventor, 96.6% of the matched first inventors on Japanese-invented U.S. IT patents are male and 3.4% of the matched first inventors are female (see Figure 17). This is a bit lower than the U.S. percentage of 5.6%.
• When counting fractionally, 3.4% of Japanese-invented U.S. IT patents were produced by women during the 31-year period, with 3.9% of Japanese-invented patents being produced by women in the past five years. This is also slightly lower than the U.S. percentage of 6.1% for the 31-year period and 7.5% for the past five years.

www.ncwit.org Who Invents IT? Women’s Participation in Information Technology, 2012 Update 23
TrenDS over TImeDuring the 31-year period, Japanese-invented U.S. IT patents experienced a different pattern in female patenting than did U.S.-invented U.S. IT patents. Among the U.S.-invented patents, female patenting steadily increased from 1.9% in 1980 to 7.8% in 2010. Among Japanese-invented patents, however, female patenting increased from 1.7% in 1980 to 3.8% in 1996 but then dipped below 3.8% for more than a decade. Female patenting did not reach 3.8% again until 2009 and then rose to 4.1% in 2010.
PerCenTAgeS of femAle IT PATenTS By IT SuBCATegoryWhen it comes to IT subcategories, the Japanese-invented IT patents follow a pattern similar to the U.S.-invented IT patents but with slightly lower numbers, with women participating in 7% to 9% of the patents in most categories, but approximately 11% of the Computer Software patents (compared to 13% in most categories and 18% in Software for U.S.-invented patents). When counting fractionally, Japanese women produce 3.5% of the patents in most categories, but 5.6% of the Japanese-invented Computer Software patents (compared to 7.5% in most categories and 9% in Computer Software for U.S.-invented patents).
fIgure 20Male and Female Collaboration Statistics by Category
Japanese-invented U.S. Information Technology Patents
SuB-CATegory # mATChABle PATenTS
femAle-only mIxeD-genDer TeAm
mAle-only
CounT % CounT % CounT %
Communications 68,843 913 1.3% 3,550 5.2% 64,380 93.5%
Computer Hardware 54,289 702 1.3% 2,805 5.2% 50,782 93.5%
Computer Peripherals 73,130 653 0.9% 4,797 6.6% 67,680 92.5%
Computer Software 30,805 724 2.4% 2,601 8.4% 27,480 89.2%
Semiconductors/Solid-state Devices 91,607 1,208 1.3% 5,949 6.5% 84,450 92.2%
All Information Technology 318,764 4,200 1.3% 19,702 6.2% 294,772 92.5%
national Center for Women & Information Technology (nCWIT)w w w. n c w i t . o r g | 3 0 3 . 7 3 5 . 6 6 7 1 | i n f o @ n c w i t . o r g
StrategicPartners:
®
InvestmentPartners:
This report was produced with support from the NCWIT Workforce Alliance.Editor: Stephanie Hamilton | Designer: Adriane Bradberry
© National Center for Women & Information Technology, 2007-2012.