which is a key factor in raising living standards and ... · advances and challenges in measuring...
TRANSCRIPT

ECLAC / ILO
The employment situation in Latin America and the Caribbean
As discussed in this report, the labour market posted a positive performance in Latin America and the Caribbean in 2012, despite a global context that was not particularly conducive to growth and development in the region. Although the gains were, generally speaking, quite modest, the region’s falling unemployment rate, rising numbers of formal jobs, climbing real average wages, declining underemployment and narrowing gender gaps in labour market participation, employment and unemployment all speak of fresh progress as regards working conditions in the region.
These improvements are significant because they encompass not only the number of jobs, but also job quality, which is a key factor in raising living standards and achieving lasting poverty reduction. Fourteen years ago, ILO put forward the concept of “decent work” as a framework for promoting quality employment. Many of the region’s countries are monitoring progress in this regard by pursuing initiatives to measure the various dimensions that comprise decent work. This report examines the progress to date in building information systems on decent work and discusses pending challenges.
May 2013Number 8
Advances and challenges in measuring decent work

ECLAC / ILO
The employment situationin Latin America and the Caribbean
May 2013Number 8
Advances and challenges in measuring decent work

The Employment Situation in Latin America and the Caribbean is a twice-yearly report prepared jointly by the Economic Development Division of the Economic Commission for Latin America and the Caribbean (ECLAC) and the Subregional Office for the South Cone of Latin America of the International Labour Organization (ILO), headed by Juan Alberto Fuentes and Guillermo Miranda, respectively. Work on the document was coordinated by Gerhard Reinecke, Senior Expert on Employment Policies of ILO, and Jürgen Weller, Senior Economic Affairs Officer at ECLAC.
The first section of this report was prepared by Jürgen Weller, and the second by David Glejberman, Regional Advisor on Decent Work Indicators of ILO. Manuel Córdoba and Rigoberto García, programmers with the Labour Analysis and Information System in Latin America and the Caribbean, collaborated in the preparation of the statistical information, under the coordination of Bolívar Pino; Werner Gárate contributed additional statistical inputs.
Cornelia Kaldewei and Andrés Marinakis provided valuable comments on earlier drafts of the document.
United Nations PublicationLC/L.3630Copyright © United Nations / © OIT, May 2013Printed in Santiago, Chile • 2013-318

Contents
Foreword ...............................................................................................................................................................5
I. Labour market performance in Latin America and the Caribbean in 2012 .......................................................7
II. Indicators of decent work ................................................................................................................................11Introduction ....................................................................................................................................................11A. Labour statistics and decent work indicators .............................................................................................12B. Objectives and use of decent work indicators ...........................................................................................13C. Advances in systems of decent work indicators in Latin American countries ...........................................14D. Limitations and problems observed in the preparation of a system of decent work indicators ..................17E. Analysis of selected decent work indicators ..............................................................................................18
Bibliography .........................................................................................................................................................20
Annex IShort-term indicators ...........................................................................................................................................21
Annex IILatin America: selected decent work indicators ..................................................................................................25

The employment situation in Latin America and the Caribbean 5
Foreword
At 6.4%, the unemployment rate for the Latin American and Caribbean region overall was the lowest for the past few decades, down from 6.7% in 2011. This is significant, in view of the difficult employment situation prevailing in other world regions.
Labour market indicators improved despite modest growth of just 3.0% in the region’s economy. Even with sharply rising labour market participation, the number of urban unemployed fell by around 400,000, on the back of relatively strong job creation.
Nevertheless, around 15 million are still jobless in the region.Other highlights of 2012 labour market performance were that the gender gaps in labour market participation,
unemployment and employment narrowed, albeit slightly; formal employment increased; the hourly underemployment rate declined; and average wages rose.
This rendering was obviously not homogenous across the region. Labour market indicators worsened again in the Caribbean countries, for example, reflecting the sluggish performance of their economies.
The sustainability of recent labour market progress is also a cause for concern. Most of the new jobs in the region were created as part of a self-perpetuating cycle in which new jobs and higher real
wages (and greater access to credit) have boosted household purchasing power and so pushed up domestic demand. Much of this demand is for non-tradable goods and services (and imports), which has stimulated expansion of the tertiary sector and hence its demand for labour, and many of the new jobs have therefore arisen in these sectors of the economy.
This dynamic certainly has positive implications in terms of labour and distribution, but the concern is whether it is sustainable in a context of still relatively low investment (even after some recent gains) which is, moreover, not structured in a manner conducive to diversifying production. Doubt hangs over the future growth of production capacity in the region, given the enormous challenges facing the region in terms of innovation, education quality, infrastructure and productivity.
As vigorous job creation has driven progress in reducing unemployment, attention has turned once again to the characteristics of that employment. Awareness exists in the region that economic growth is essential, but not in itself sufficient to generate more and better jobs.
For some time, ILO has been drawing attention to the fact that it is not enough to create any sort of employment. The concept of decent work, as proposed by ILO, emphasized the need for quality jobs which enshrine respect for fundamental rights at work. The United Nations General Assembly endorsed this notion and incorporated it into the targets set in the framework of the Millennium Development Goals.
This eighth issue of the ECLAC/ILO publication “The employment situation in Latin America and the Caribbean” examines how the concept of decent work has evolved in the region, progress in measuring it and the challenges involved in building a system of decent work indicators, 14 years after the concept was first proposed.
Although the concept of decent work has been accompanied since the outset by the challenge of measurement, its first objective was to generate a discussion on the best achievable labour practices in each country. Accordingly, rather than defining a universal threshold of what could be considered decent work —regarding which developed countries might have almost reached the target before starting, while poor countries could be left hopelessly behind— ILO called upon the countries to define their own criteria and measurements for promoting decent work policies.
6 ECLAC / ILONumber 8
As a result, there is no shared set of variables for measuring decent work applicable to all countries. The suggestion is, instead, that countries move forward with measuring decent work on the basis of their own priorities, using the information they have available now and in the future. However, this strategy of progressing according to the data available in each country tends to complicate statistical comparison between them. So, once the countries have developed their respective systems of decent work indicators, it will be also be important to work towards harmonizing them. ECLAC and ILO are available to provide technical support to this end.
With respect to 2013, there is cautious optimism regarding the performance of the region’s labour markets. If projections of a slight uptick —to 3.5%— in the region’s economic growth in 2013 are borne out, labour indicators
should continue to gradually improve. This will bring new increases in real wages and a slight drop of up to 0.2 percentage points in the region’s unemployment rate, reflecting a fresh rise in the regional employment rate and slower growth in labour market participation.
Elizabeth TinocoAssistant Director-General
Regional DirectorRegional Office for Latin America and the Caribbean
International Labour Organization (ILO)
Alicia Bárcena Under-Secretary-General of the United Nations
Executive SecretaryEconomic Commission for Latin America
and the Caribbean (ECLAC)

The employment situation in Latin America and the Caribbean 7
I. Labour market performance in Latin America and the Caribbean in 2012
The economic performance of the Latin American and Caribbean region was set against a complex global environment in 2012. On the one hand, global growth slowed for the second year running, mainly because of the eurozone’s economic contraction and slacker growth in China. Other developed economies (such as the United States and Japan) improved —albeit modestly— on their 2011 performances. On the other hand, great uncertainty prevailed throughout the year, as a number of eurozone members traversed profound crises that precluded ruling out the possibility of uncontrolled break-up of the monetary union. Although this particular risk receded towards year-end, eurozone weakness continued to act as a drag on global growth.
Latin America and the Caribbean was not immune to these conditions, which were transmitted to the region mainly through the trade channel, as external demand slowed and prices for the basket of the region’s export goods fell.1 Weak growth (0.9%) in Brazil, the region’s largest economy, also helped to pull down the regional figure. The region’s growth rate overall thus slipped again, from 4.3% in 2011 to 3.0% in 2012, bringing per capita GDP growth to below 2% (ECLAC, 2013).
Household consumption played an important role in stabilizing aggregate demand for the region overall, partially offsetting lacklustre external demand. A virtuous circle operated, on the one hand, between dynamic labour markets with buoyant formal job creation and rising real wages (and therefore rising household purchasing power) and, on the other, expansion in economic sectors driven by this burgeoning domestic demand, which, in turn, pushed up labour demand in these sectors.
The favourable labour trends seen over the past decade thus continued in 2012. These were interrupted only temporarily in 2007-2008 by the food and fuel price surge, which eroded the purchasing power of labour income, and in 2008-2009 by the global financial and economic crisis, which slowed regional economic growth and labour demand and thus pushed up unemployment.
Regionwide, the urban employment rate rose from 56.1% to 56.5% of the working-age population in 2012, reflecting the generation of approximately 5.5 million urban jobs. The steep climb in employment levels begun in 2003 (and broken only in 2009) thus continued. The increase in the urban employment rate in the decade between 2002 and 2012 —from 52.0% to 56.5% of the working-age population— was a key factor in the substantial poverty reduction achieved in the region in this period (ECLAC, 2009).
The labour supply also rose in 2012, with the urban labour market participation rate in the region rising to 60.4% from 60.2% in 2011.
1 Preliminary data indicate that the region’s export growth slowed from 23.9% in 2011 to 1.6% in 2012 (ECLAC, 2013).
The rise in the participation rate in 2012 reflected growing incorporation of women into the labour market. At the same time, the employment rate rose slightly faster than would be expected in the contest of quite modest economic growth. This could reflect relatively optimistic expectations on the part of businesses and households with respect to the region’s economic situation and outlook. A special case in this context is Brazil: despite meagre economic growth of 0.9%, the employment rate for six main metropolitan areas rose 0.5 percentage points. Notably, this is not the result of the sort of informalization process that could come about in a context of slack formal sector labour demand. On the contrary: formal employment (i.e. workers with carteira assinada) actually increased from 53.0% of all employment in 2011 to 53.7% in 2012 in these metropolitan areas.
With job creation buoyant and labour market participation climbing quite strongly, the urban open unemployment rate fell again, from 6.7% to 6.4%. Open unemployment thus reached a fresh low and the absolute number of urban jobless fell by around 400,000. Even so, 15 million people are still out of work in the region’s urban areas. Analysis of the situation in a group of 14 ountries shows that unemployment fell by at least 0.2 percentage points in six; remained stable with variation within a range of 0.1 percentage points in five; and, according to preliminary data, rose in three (Dominican Republic,2 Guatemala and Paraguay).
The situation is clearly not as bright in the Caribbean, where three of five countries with information available (Barbados, Jamaica, and Trinidad and Tobago) saw unemployment rise between 2011 and 2012, taking the rate to a high of 14 years in Barbados and 16 years in Jamaica. The Bahamas was the only country to record a decrease in unemployment, which nevertheless remains high.3
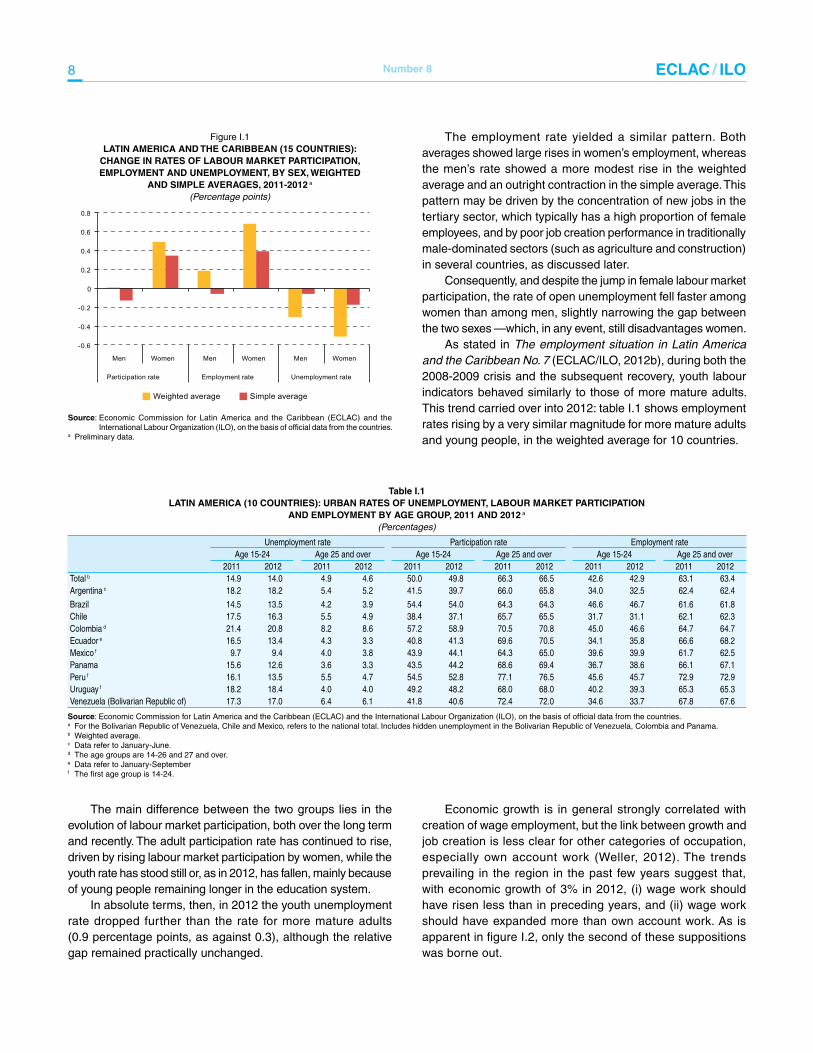
What do these regional variations in the main labour market indicators mean from the point of view of gender? As shown in figure I.1, for a set of 15 countries, the rise in the participation rate was entirely a result of greater labour market participation by women. The female participation rate rose significantly as both a simple and a weighted average, while the rate for men stood still or —as a simple average— fell slightly. The long-term labour market participation trends therefore continued in 2012, especially in terms of steadily rising female participation rates and a gradually closing gap between the rates for men and women.
2 Open unemployment increased in the Dominican Republic, but broader unemployment fell.
3 Although 2011 unemployment data are not available for Belize, a significant rise was recorded between 2010 and 2012.
8 ECLAC / ILONumber 8
Figure I.1 LATIN AMERICA AND THE CARIBBEAN (15 COUNTRIES):
CHANGE IN RATES OF LABOUR MARKET PARTICIPATION, EMPLOYMENT AND UNEMPLOYMENT, BY SEX, WEIGHTED
AND SIMPLE AVERAGES, 2011-2012 a
(Percentage points)
-0.6
-0.4
-0.2
0
0.2
0.4
0.6
0.8
Men Women Men Women Men Women
Participation rate Employment rate Unemployment rate
Weighted average Simple average
Source: Economic Commission for Latin America and the Caribbean (ECLAC) and the International Labour Organization (ILO), on the basis of official data from the countries.
a Preliminary data.
The employment rate yielded a similar pattern. Both averages showed large rises in women’s employment, whereas the men’s rate showed a more modest rise in the weighted average and an outright contraction in the simple average. This pattern may be driven by the concentration of new jobs in the tertiary sector, which typically has a high proportion of female employees, and by poor job creation performance in traditionally male-dominated sectors (such as agriculture and construction) in several countries, as discussed later.
Consequently, and despite the jump in female labour market participation, the rate of open unemployment fell faster among women than among men, slightly narrowing the gap between the two sexes —which, in any event, still disadvantages women.
As stated in The employment situation in Latin America and the Caribbean No. 7 (ECLAC/ILO, 2012b), during both the 2008-2009 crisis and the subsequent recovery, youth labour indicators behaved similarly to those of more mature adults. This trend carried over into 2012: table I.1 shows employment rates rising by a very similar magnitude for more mature adults and young people, in the weighted average for 10 countries.
Table I.1 LATIN AMERICA (10 COUNTRIES): URBAN RATES OF UNEMPLOYMENT, LABOUR MARKET PARTICIPATION
AND EMPLOYMENT BY AGE GROUP, 2011 AND 2012 a
(Percentages)
Unemployment rate Participation rate Employment rateAge 15-24 Age 25 and over Age 15-24 Age 25 and over Age 15-24 Age 25 and over
2011 2012 2011 2012 2011 2012 2011 2012 2011 2012 2011 2012Total b 14.9 14.0 4.9 4.6 50.0 49.8 66.3 66.5 42.6 42.9 63.1 63.4Argentina c 18.2 18.2 5.4 5.2 41.5 39.7 66.0 65.8 34.0 32.5 62.4 62.4
Brazil 14.5 13.5 4.2 3.9 54.4 54.0 64.3 64.3 46.6 46.7 61.6 61.8Chile 17.5 16.3 5.5 4.9 38.4 37.1 65.7 65.5 31.7 31.1 62.1 62.3Colombia d 21.4 20.8 8.2 8.6 57.2 58.9 70.5 70.8 45.0 46.6 64.7 64.7Ecuador e 16.5 13.4 4.3 3.3 40.8 41.3 69.6 70.5 34.1 35.8 66.6 68.2Mexico f 9.7 9.4 4.0 3.8 43.9 44.1 64.3 65.0 39.6 39.9 61.7 62.5Panama 15.6 12.6 3.6 3.3 43.5 44.2 68.6 69.4 36.7 38.6 66.1 67.1Peru f 16.1 13.5 5.5 4.7 54.5 52.8 77.1 76.5 45.6 45.7 72.9 72.9Uruguay f 18.2 18.4 4.0 4.0 49.2 48.2 68.0 68.0 40.2 39.3 65.3 65.3Venezuela (Bolivarian Republic of) 17.3 17.0 6.4 6.1 41.8 40.6 72.4 72.0 34.6 33.7 67.8 67.6
Source: Economic Commission for Latin America and the Caribbean (ECLAC) and the International Labour Organization (ILO), on the basis of official data from the countries.a For the Bolivarian Republic of Venezuela, Chile and Mexico, refers to the national total. Includes hidden unemployment in the Bolivarian Republic of Venezuela, Colombia and Panama.b Weighted average.c Data refer to January-June.d The age groups are 14-26 and 27 and over.e Data refer to January-Septemberf The first age group is 14-24.
The main difference between the two groups lies in the evolution of labour market participation, both over the long term and recently. The adult participation rate has continued to rise, driven by rising labour market participation by women, while the youth rate has stood still or, as in 2012, has fallen, mainly because of young people remaining longer in the education system.
In absolute terms, then, in 2012 the youth unemployment rate dropped further than the rate for more mature adults (0.9 percentage points, as against 0.3), although the relative gap remained practically unchanged.
Economic growth is in general strongly correlated with creation of wage employment, but the link between growth and job creation is less clear for other categories of occupation, especially own account work (Weller, 2012). The trends prevailing in the region in the past few years suggest that, with economic growth of 3% in 2012, (i) wage work should have risen less than in preceding years, and (ii) wage work should have expanded more than own account work. As is apparent in figure I.2, only the second of these suppositions was borne out.

The employment situation in Latin America and the Caribbean 9
Figure I.2 LATIN AMERICA AND THE CARIBBEAN (11 COUNTRIES): GROWTH IN EMPLOYMENT, BY CATEGORY, WEIGHTED AVERAGE, 2011 AND 2012
(Percentages)
-3
-2
-1
0
1
2
3
4
Total Wage workers Own accountworkers
Domesticworkers
Unpaid workers
2011 2012a
Source: Economic Commission for Latin America and the Caribbean (ECLAC) and the International Labour Organization (ILO), on the basis of official data from the countries.
a Preliminary data.
Preliminary data show total employment rising by 2.4% in 2012, in the weighted average for 11 countries. This implies a very slight increase in average labour productivity. Wage employment was up by 3.4%, while own account work edged up a mere 1.1%. With the exception of Argentina, wage employment grew more than own account work in all countries with available information, suggesting that demand for labour has remained relatively strong. Domestic service continued the contraction observed in 2011, and unpaid family work stood still.
Compared with previous years, the magnitude of the rise in wage employment —similar to that of 2011, when the regional economy expanded by 4.3%— was surprising in view of the economic slowdown in the region. This strong expansion in wage employment at the regional level was partly a reflection of a surge in this type of employment in Chile, Colombia, Mexico and Peru. The main factor driving the expansion of wage employment above the trend, however, was the growth of this type of employment generation of Brazil (2.6%, with a rise of 2.3% in private wage employment), despite meagre growth of 0.9%.4
Buoyant job creation was also reflected in the expansion of formal employment (i.e. that covered by social security systems), thanks to the creation of new jobs and the formalization of existing ones. Formal employment was up by around 4% (simple average for 12 countries), slightly down on 2011and similar to the figure for 2010. Consistently with economic performance, formal job creation slowed significantly in Argentina and Brazil, and remained stable or rose slightly in other countries (Chile, Costa Rica, Mexico and Nicaragua).
4 The relatively dynamic performance of employment in Brazil in 2012, despite slack economic growth that year, is not fully understood. It apparently has to do with sectoral aspects of growth, since the new jobs are centred on activities of relatively low average productivity and high labour density (such as commerce and construction), in the context of relatively buoyant household demand. The data for Brazil, it will be recalled, count heavily in the weighted average for the region, owing to its large weight in the economy of Latin America and the Caribbean overall.
Figure I.3 LATIN AMERICA AND THE CARIBBEAN (SELECTED COUNTRIES):
RATES OF FORMAL EMPLOYMENT GROWTH, 2010-2012(Percentages)
0
2
4
6
8
10
12
Arg
entin
a
Bra
zil
Chi
le
Cos
ta R
ica
El S
alva
dor
Gua
tem
ala
Mex
ico
Nic
arag
ua
Pan
ama
Per
u
Uru
guay
2010 2011 2012 a
Source: Economic Commission for Latin America and the Caribbean (ECLAC) and the International Labour Organization (ILO), on the basis of official data from the countries.
a Preliminary data.
The labour market’s reasonably positive performance at the regional level in 2012 was seen, too, in the evolution of underemployment by hours, which represents the proportion of workers who work fewer hours than the standard working day in the respective country, would like to work more hours and are available to do so. In the median for 11 countries, this measure of employment quality problems fell from 9.1% of the employed in 2011 to 7.9% in 2012, while the simple average edged down from 8.3% to 8.2%. Performance in this area is uneven from one country to another, with underemployment by hours falling in Brazil, Chile, Ecuador, Paraguay and Peru, but rising in Argentina, Colombia, Costa Rica and Panama.
Table I.2 LATIN AMERICA (11 COUNTRIES): INDICATORS OF URBAN
UNDEREMPLOYMENT BY HOURS, 2008-2012 a
(Percentages)
2008 2009 2010 2011 2012 b
Argentina 9.5 11.1 9.8 9.1 9.3
Brazil 3.1 3.1 2.7 2.3 2.0
Chile 9.0 10.8 11.5 11.6 11.2
Colombia 9.1 9.5 12.0 11.1 11.7
Costa Rica 10.5 13.5 11.2 13.4 13.8
Ecuador 10.6 11.8 11.5 9.4 7.9
Mexico 6.1 8.9 7.6 7.1 7.0
Panama 2.1 2.1 1.8 1.5 2.4
Paraguay … … 7.3 6.3 5.4
Peru 15.6 15.4 14.5 12.4 12.2
Uruguay 10.8 9.1 8.6 7.2 7.1
Source: Economic Commission for Latin America and the Caribbean (ECLAC) and the International Labour Organization (ILO), on the basis of official data from the countries.
a The data refer to employed workers who work fewer hours than the standard working day in the respective countries, wish to work more and are available to do so. Owing the methodological differences, the series are not comparable from one country to another. The data refer to urban areas, with the exceptions of Chile and Costa Rica, where they refer to the national total.
b Preliminary figures.

10 ECLAC / ILONumber 8
Average wages in the formal sector continued to rise. For the region overall, the rise was 2.5% in real terms, as a simple average. By country, the rise was over 3% in the Bolivarian Republic of Venezuela, Brazil, Chile, Guatemala and Uruguay, and more modest (up to 2%) in Colombia, Costa Rica, Mexico, Nicaragua and Paraguay.5
Figure I.4 LATIN AMERICA (SELECTED COUNTRIES): VARIATION IN AVERAGE
REAL WAGE IN FORMAL EMPLOYMENT (Percentages)
-6
-4
-2
0
2
4
6
8
Braz
il
Chi
le
Col
ombi
a
Cos
ta R
ica
Gua
tem
ala
Mex
ico
Nic
arag
ua
Pan
ama
Par
agua
y
Uru
guay
Vene
zuel
a(B
ol.R
ep. o
f)
2010 2011 2012 a
Source: Economic Commission for Latin America and the Caribbean (ECLAC) and the International Labour Organization (ILO), on the basis of official data from the countries.
Positive developments as regards real wages were aided not only by the favourable labour market context (particularly the low unemployment rates), which strengthened workers’ bargaining power, but also by a slight drop in inflation in most of the countries and —although with high variance across the countries of the region— rises in minimum wages, which tend to have the greatest impact on the lowest wages. In the median for 20 countries, real minimum wages were up by 2.8% (versus 1.3% in 2011), albeit with wide differences between countries. For the year overall, the rise was more than 5% above the average for 2011 in Brazil, Ecuador, Panama, Peru, the Plurinational State of Bolivia and Uruguay, but less than 1% above 2011 or a slight drop in Honduras, Jamaica, Mexico and Paraguay, and in Haiti real minimum wages fell by over 5%.
5 In the case of Peru, the available information shows real wages of wage workers (not only formal workers) rising by 2.4% in Lima metropolitan area.
Many of the new jobs created in 2012 were in the tertiary sector. The activities with the fastest-growing employment, in the simple average for 10 countries, were basic services (transport, storage and communications, and electricity, gas and water (4.0%); community, social and personal services (2.6%); and financial services and real estate and business services (2.4%). Owing to its great weight in the occupational structure, the commerce, restaurants and hotels sector also contributed much of the new employment, despite posting a smaller rate of increase (1.7%). The expansion of employment in the tertiary sector, which is composed mainly of non-tradables segments, reflected the importance of domestic demand in driving the region’s economic growth. Employment in construction, another activity which closely tracks domestic demand, was up by 1.4% in the simple average of the countries, representing the combination of a rebound in the sector in several of them (including Chile, Colombia and Peru) and a downturn in others (including the Bolivarian Republic of Venezuela, Jamaica and Mexico).
By contrast, employment posted another modest expansion in the agricultural sector (0.5%), continuing its long-term decline as a proportion of total employment. Manufacturing employment was also only slightly up (1.1%), as a result, among other things, of the contraction of this type of employment in the Bolivarian Republic of Venezuela and Brazil caused by weak output performance in the sector.
Growth is expected to pick up slightly in the region in 2013, which would augur well for further improvements in labour indicators. The results may be expected to vary between countries, however, since slowing economies in several countries will slacken growth in labour demand there. The link between economic growth and employment generation should return to a more typical state, after more new jobs were created in 2012 than might be expected amid modest regional economic growth of 3%. Above all, a close watch will need to be kept on labour market developments in the region’s two largest economies, Brazil and Mexico.
For the region overall, it is estimated that the average urban unemployment rate will edge down again in 2013, by up to 0.2 percentage points, reflecting a fresh increase in the regional employment rate and slower growth in labour market participation.

The employment situation in Latin America and the Caribbean 11
II. Indicators of decent work
Introduction
The concept of decent work appeared for the first time in 1999 in the Report of the DirectorGeneral of the International Labour Organization (ILO) at the 87th session of the International Labour Conference. It is defined as follows:
“Decent work sums up the aspirations of people in their working lives. It involves opportunities for work that is productive and delivers a fair income, security in the workplace and social protection for families, better prospects for personal development and social integration, freedom for people to express their concerns, organize and participate in the decisions that affect their lives and equality of opportunity and treatment for all women and men.”1
These aspects of decent work have been condensed into four strategic objectives: promote and realize standards and fundamental principles and rights at work, create greater opportunities for women and men to decent employment and income, enhance the coverage and effectiveness of social protection for all, and strengthen tripartism and social dialogue.
Decent work has since become a new ILO paradigm or conceptual framework for analysing labour market trends and relationships. It reflects a comprehensive vision that takes into account not only issues relating to access to work (participation, employment, underemployment, unemployment, among others) but also qualitative aspects that affect individuals at work, such as vocational training, health and other workplace conditions, employment security, excessive work hours and work-life balance, workplace ethics (forced labour and child labour), gender equality and nondiscrimination and social dialogue2 and worker participation. It is thus a vision shared with other conceptual frameworks such as employment quality.3
In order for work to be regarded as decent, it must have the following characteristics: (i) productive; (ii) fairly remunerated; (iii) performed in conditions of freedom, equity, security; (iv) performed with respect for human dignity.
From the perspective of the Millennium Development Goals, in order for work to be regarded as productive, labour
1 See [online] www.ilo.org/global/topics/decent-work/lang--en/index.htm.2 Social dialogue includes all types of exchange—negotiation, consultation,
requests for information—between or among representatives of governments, employers and workers on issues of common interest relating to labour, economic and social policy.
3 Employment quality can be defined as a set of work-related factors that affect the economic, social, psychological, and physical well-being of workers (Reinecke and Valenzuela, 2000), www.oitchile.cl/pdf/publicaciones/igu/igu021.pdf. See also Infante (1999), Rodgers and Reinecke (1998), Weller and Roethlisberger (2011) and ECE (2010).
productivity levels must be high enough to generate sufficient income to help workers rise out of poverty. This means, among other things, that they must have good training upon entering the labour market, and once employed, they must continue to receive training on an ongoing basis. Thus, educational level and on-the-job training are two dimensions of decent work.
Fair pay, freedom, equity, and respect for human dignity are enshrined as fundamental rights in the workplace in the Universal Declaration of Human Rights, Articles 23 and 24 of which establish the following:
Article 23 1. Everyone has the right to work, to free choice of
employment, to just and favourable conditions of work and to protection against unemployment.
2. Everyone, without any discrimination, has the right to equal pay for equal work.
3. Everyone who works has the right to just and favourable remuneration ensuring for himself and his family an existence worthy of human dignity, and supplemented, if necessary, by other means of social protection.
4. Everyone has the right to form and to join trade unions for the protection of his interests.
Article 24 Everyone has the right to rest and leisure, including
reasonable limitation of working hours and periodic holidays with pay.
The concept of security should be broadly interpreted to include aspects relating both to occupational health and to social protection.
Respect for human dignity excludes from decent work forced labour and slavery as well as child labour (work that endangers the health, security, morale, or development of children and adolescents).
In the years following 1999, numerous efforts were made to define the scope of decent work. In a 2003 article, Dharam Ghai proposed a broad definition of the reference population: “Employment here covers work of all kinds and has both quantitative and qualitative dimensions. Thus, decent work applies not just to workers in the formal economy but also to unregulated wage workers, the self-employed and home workers.”
The ILO Declaration on Social Justice for a Fair Globalization (2008)4 called upon the members of the organization to contribute
4 Adopted at the 97th Session of the International Labour Conference, June 2008.

12 ECLAC / ILONumber 8
to “the realization of a global and integrated strategy for the implementation of the strategic objectives, which encompass the Decent Work Agenda,” and as part of this strategy, to consider “the establishment of appropriate indicators or statistics, if necessary with the assistance of ILO, to monitor and evaluate the progress made.”
Decent work is understood to be a complex multifaceted concept, and in order to measure it, an array of indicators or statistics are needed. Accordingly, in March 2008, the ILO Governing Body approved a Tripartite Meeting of Experts on
the Measurement of Decent Work to provide guidance on the different methods for measuring the dimensions of decent work. The discussions that took place at the meeting, which was held in September 2008, yielded a methodological document (ILO, 2008) that described the fundamental aspects of decent work and proposed a system of statistical indicators and a model for organizing information on the legal framework. This proposal was recommended at the 18th International Conference of Labour Statisticians in December 2008 and remains in effect.
A. Labour statistics and decent work indicators
As ILO already has a labour statistics system to analyse the labour market, it is valid to ask what value is added by the conceptual framework of decent work. In response, whereas the labour statistics system (Convention No. 160) focuses on the labour market at the macro level (active population, average earnings, average hours of work, and so forth), decent work focuses on the worker from a micro perspective, by looking at issues such as labour discrimination, fair wages, excessive hours of work, union membership, work-family balance, and rights at work. In addition, the decent work framework defines work broadly to encompass not only employment that falls within the production boundary of the System of National Accounts but also activities performed in the home to provide services for members of the household (e.g. caretaking work), voluntary work to provide services to other households and production for own consumption even if not significant.
Inasmuch as all these aspects must be considered in the concept of decent work, how can the level of decent work and progress or setbacks over time be measured? This question has several answers. Between 2001 and 2007, a number of proposals were made, some from a conceptual viewpoint and others from an empirical perspective.5 At the 17th International Conference of Labour Statisticians (2003), 29 indicators based
5 More conceptual proposals include, notably, Anker and others (2003) as background to the document prepared by the Tripartite Meeting of Experts. The empirical proposals include MTESS (2007).
on 10 substantive elements of the Decent Work Agenda were proposed. In 2008, the Tripartite Meeting of Experts revised the proposal, which now groups the list of indicators6 by various criteria, as follows:i) Grouping by the substantive elements of the Decent Work
Agenda:• Employment opportunities• Work that should be abolished• Adequate earnings and productive work• Decent hours• Stability and security of work• Combining work and family life• Equal opportunity and treatment in employment• Safe work environment• Social security• Social dialogue and workers’ representation
ii) Grouping by indicators subject to quantitative measurement (statistical indicators) or qualitative measurement (description of rights at work and the legal framework).
iii) Grouping by importance and priorities, the indicators are classified as main, additional, context, and future. The system of decent work indicators for each country could
be presented according to the following diagram.
6 The complete list can be found in ILO (2008) and an in-depth analysis of each indicator is provided in ILO (2012a).
Table II.1 PROPOSAL FOR PRESENTATION OF THE SYSTEM OF DECENT WORK INDICATORS BY COUNTRY
Substantive element
Quantitative indicators
Main
Additional
Future
Legal framework indicators
Source: Prepared by the authors.
{{

The employment situation in Latin America and the Caribbean 13
B. Objectives and use of decent work indicators
As for how to measure decent work, indicators should be selected based on the following general principles (ILO, 2008):i) Given the multidimensional nature of decent work, the indicators
should take into account all the substantive elements.ii) The indicators should reflect the conditions of all workers,
with an emphasis on the most vulnerable workers.iii) The indicators should go beyond statistics on work and the
workplace and could include, for example, aspects such as unpaid care work and reproductive work, as well as the incidence of working poverty.
iv) Consider the gender dimension.v) Take into account the context of the social and economic
situation in the countries, so that factors that hinder and promote progress towards decent work can be identified.
vi) Since the purpose is to evaluate progress over time, the indicators should be presented in chronological series and an initial value and a target to be reached within a given time should be established.
vii) Interpret the statistical indicators in conjunction with data on the demographic structure, the sectoral distribution of employment and contextual data.
viii) Supplement the statistical indicators with information on changes in labour laws and enforcement.
ix) Consider all dimensions of decent work in the system and reflect the specific circumstances and priorities of each country.As for use of the system of decent work indicators, first,
as with the concept of employment quality, decent work indicators can be used to conduct country-level analyses of the situation and evolution over time of changes and trends in the labour market. In cases of economic downturn, for example, it would be useful to know how the labour market adapts: through changes in the quantity of work or through changes in the quality of work, or both (ECE, 2010). Second, information sources permitting, a system of decent work indicators can provide inputs for sector policy (large divisions of activity) or information on the most vulnerable employment categories (self-employed workers, home workers, informal wage workers, subsistence workers). Third, the decent work framework can be used to analyse structural gaps as well as trends among the groups that are most vulnerable to economic depression or crisis (women, children, older adults, people with disabilities, migrants, ethnic minority groups, rural dwellers) insofar as the system includes appropriate indicators that can be disaggregated by characteristics such as gender, age, ethnicity, place of residence, and so forth.
A recurring question since 1999 has been whether a single indicator could serve as an accurate measure of decent work. Owing to a number of factors, the answer to this question is no. Although certain dimensions can be measured with quantitative indicators (totals, rates or averages), some aspects can only be measured with qualitative indicators (e.g. features of labour laws and regulations). Moreover, developing a composite indicator would require an in-depth discussion to determine the weight that should be assigned to the various indicators and the formula to be used. Lastly, social indicators tend to be approximations of reality, and changes over time cannot always be interpreted as an improvement or deterioration in decent work. Such is the case, for example, with the indicator expressing the rate of participation in the labour market: an increase in the rate means that more people are active and some have likely found jobs (while others are looking for jobs), but these new jobs might well be primarily casual and precarious employment with very low pay or excessive hours, so an increase in the rate of participation would not be correlated, in these cases, with progress towards decent work.
The question, then, is what is the purpose of measuring decent work, how should it be measured, and how can the findings be used?
The purpose is not, at present, to make international comparisons, because labour market indicators have not yet been harmonized, despite the long-time existence7 of international recommendations and of efforts by the countries to adopt them in their statistical studies. Some of the definitions of labour market indicators that have been recommended by ILO, at least until the next ICLS (October 2013), leave it to the countries to devise their own definitions (e.g. minimum working age, open or expanded unemployment), which makes it difficult to perform international comparisons.
The main purpose of the measurement of decent work is to provide the agents —governments, workers and employers— with tools to evaluate each country’s progress with respect to decent work.
Each country, then, selects the set of indicators that will allow it to conduct monitoring of decent work. Given the statistical development of the countries in the region, this set is contingent on the availability of sources of statistical information, the possibility of making improvements to the tools for measurement and the feasibility of initiating new research on labour issues.
7 See the outcomes of the 13th International Conference of Labour Statisticians (ICLS) (ILO, 1982), as well as subsequent resolutions and guidelines (15th, 16th, 17th and 18th ICLS).

14 ECLAC / ILONumber 8
C. Advances in systems of decent work indicators in Latin American countries
The adoption and development of decent work information systems have varied significantly from one country to the next in the region. While some countries began compiling indicators early on to track the progress of their Decent Work Agendas, others have only recently started to develop systems of decent work indicators, as evidenced by the creation of a Working Group on Labour-Market Indicators for Latin America and the Caribbean. In its first document, the Working Group states that it emerged in response to a concern expressed by several member countries during the sixth meeting of the Statistical Conference of the Americas of the Economic Commission for Latin America and the Caribbean, held in November 2011 in the Dominican Republic, regarding the creation of a discussion forum to review the concepts associated with employment, unemployment, and underemployment, as well as to propose new labour-market indicators, in particular indicators that can document the phenomenon of labour force underutilization, informal work, and progress towards decent work (ECLAC, 2012).
Argentina
Argentina was the first country in the region to develop a system of decent work indicators. The document Sistema de Indicadores de Trabajo Decente. Evolución del Déficit de Trabajo Decente en Argentina was published in December 2007.8 The prologue to the document states that the system is intended as the first version of a tool that will make it possible to assess the evolution of the decent work deficit in Argentina. Concerning the indicators selected, it notes that the proposed system contains a small but sufficient number of indicators that can be constructed at present. It does not intend to simplify the problem by aggregating a single value or an index that entails the use of weights that could be arbitrary. It is conceived as a tool for reflecting on the current situation and how it evolved. The indicators measure deficits and are accompanied by context indicators that provide a framework for analysis. Gender equity is considered a crosscutting issue and is monitored in all dimensions (MTESS, 2007).
It should be noted —because it is a feature of Argentina’s system of decent work indicators— that the selection of indicators was oriented toward measuring deficits, and accordingly the indicators have been defined in such a way that when they rise quantitatively, they are reflecting an increase in the deficit of the corresponding dimension. The chapter defining the system of decent work indicators reads as follows:
8 This document was published prior to the Tripartite Meeting of Experts, which explains the methodological differences and the fact that different indicators were selected from the ones recommended at that Meeting.
During deployment of the system, a small but sufficient set of data have been identified to track the overall evolution of the deficit taking into account the existence of diverse conditions. Argentina has sharp disparities […]. As a result, in order to measure the decent work deficit, national-level indicators are used, but the data are also disaggregated to reflect diversity in geography, age and educational level. Equality of opportunity between men and women is treated as a crosscutting element, and thus the gender gap is calculated for each indicator. In addition to the indicators that measure the deficit, the system includes a section for each one of the dimensions with contextual information. These supplemental data do not measure deficit but rather incorporate variables that help place in perspective the current situation and the evolution of the deficit” (MTESS, 2007).
In 2011 the Ministry of Labour, Employment and Social Security launched a review of the system of decent work indicators to address the recommendations of the Tripartite Meeting of Experts and the compilation efforts of the National Institute of Statistics and Censuses (INDEC) and the Ministry to obtain new relevant indicators to include in the system and obtain series covering the period 2003-2010.
Brazil
In 2008, the Economic Commission for Latin America and the Caribbean, the United Nations Development Programme and the International Labour Organization published a study analysing, inter alia, the evolution of decent work between 1992 and 2006. The study looked at 18 dimensions grouped into four areas that represented a slightly modified version of the four strategic objectives mentioned in the introduction to this section: employment, security and social protection, rights at work and social dialogue, and gender and racial equality (ECLAC/UNDP/ILO, 2008).
At the same time, the project Monitoring and Assessing Progress on Decent Work (MAP), conducted by ILO and the European Community, helped to develop a system of decent work indicators in Brazil. The ILO Office for Brazil organized a tripartite workshop to propose a set of indicators based on the list prepared by the Tripartite Meeting of Experts (ILO, 2008) and evaluate the possibility of including other relevant indicators that were available in the country. The proposed indicators and series calculated for a period of over 10 years can be found in the publication Perfil del trabajo decente en Brasil (ILO, 2010). The prologue states:

The employment situation in Latin America and the Caribbean 15
The workshop included representatives from the Ministry of Labour and Employment, Employers’ and Workers’ organizations, IBGE,9 as well as experts from IPEA10 and academia. In addition to proposing additional indicators, the workshop discussed the statistical sources that could be used for measuring progress on decent work as well as some preliminary findings from the data. Following the workshop, the ILO Office in Brazil prepared the following Decent Work Country Profile which assesses progress on decent work in Brazil since 1992. It represents a first attempt to measure progress and we plan to issue annual assessment reports covering the ten dimensions of decent work as well as the economic and social context, and highlighting important policy advances and challenges. (ILO, 2010)
The series presented in the publication cover the period 1992- 2007. The introduction mentions one of the most frequent problems encountered by the countries in developing a system of decent work indicators: “It should be stressed that methodological changes in PNAD11 in the early 1990s, and more for the 1992 survey, have hampered comparisons with labour market indicators from earlier decades.” The indicators were selected taking into account the recommendations of the Tripartite Meeting (ILO, 2008) but also the availability of other indicators relevant in the case of Brazil.12
The decent work indicators that were compiled in Brazil for the cited period point to a reduction in unemployment, growth of female participation in the labour market, an expansion of formal employment, growth in the real minimum wage, a reduction in child labour and success in reducing forced labour. The indicators also provide information about older people who receive a retirement or pension, unionization, collective bargaining agreements and the persistent gaps in the labour market that emerge upon analysing gender and racial inequalities.
In addition to the statistical indicators, the report presents results on indicators related to the legal framework,13
9 Brazilian Institute for Statistics and Geography (IBGE)10 Institute for Applied Economic Research (IPEA)11 National Household Survey.12 In fact, for areas in which the Tripartite Meeting had not made recommendations,
the Brazil report added new indicators. This was the case, for example, with the indicators “Commuting time to the workplace” and “Hours per week spent on domestic tasks” in the case of the substantive element “Combining work, family and personal life” and with the indicators related to “Job tenure (average, less than one year and more than five years)” in the case of the substantive element “Stability and security of work”. In addition, a new critical dimension —race—was added to the analytical set to assess inequalities related to opportunities and barriers to access to decent work in Brazil. This was possible due to the existence of data disaggregated by skin color in the National Statistics System.
13 Indicators related to the legal framework in the report: Government commitment to full employment, Unemployment insurance, Statutory minimum wage, Maximum hours of work, Paid annual leave, Maternity leave, Parental leave, Child labour, Forced labour, Termination of employment, Equal opportunity and treatment, Equal remuneration of men and women for work of equal value, Employment injury benefits, Labour inspection, Pension, Incapacity for work due to sickness/sick leave, Incapacity for work due to invalidity, Freedom of association and the right to organize, Collective bargaining right, Tripartite consultations, and Labour administration.
although information on coverage and degree of compliance is generally scarce.
A second report on decent work indicators in Brazil, prepared under the responsibility of the ILO Office for Brazil as part of the MAP project, was published in 2012 following tripartite consultation (ILO, 2012c). The report presented indicators for the country as a whole and its 27 federative units (disaggregated at the state level) for the purpose of analysing the heterogeneity and diversity of situations throughout the country for all the dimensions of decent work, thus constituting the first international experience with measuring decent work at the subnational level based on the recommendations of the ILO Tripartite Meeting (ILO, 2008). Primarily covering the period 2004-2009, it incorporated a broader set of indicators than those used in the first study. For example, the substantive element “Employment opportunities” incorporated the indicators “Number of training contracts” for young people between the ages of 14 and 24, “Number of formal jobs and rate of formal employment” and “Number of green jobs,” and the dimension “Adequate earnings and productive work” incorporated the indicators “Composition of household income by source of income” and “Gap in employment income by gender and ethnicity,” among other indicators.
Also added were new indicators for the element “Combining work, family and personal life” and the area of care-giving.14 In the case of the element “Equal opportunity and treatment in employment”, additional indicators were developed on people with disabilities, domestic workers and migrant workers. In addition, the new report included a chapter on companies and decent work.
Chile
In 2006 a pilot project was launched to develop a consensus-based methodology for applying decent work indicators with the participation of social stakeholders and the government. The project was centred on the businesses that had won the National Quality Award given annually by the National Centre for Productivity and Quality (ChileCalidad), an institution with a tripartite council made up of the Confederation of Production and Trade on behalf of employers, the Amalgamated Worker’s Union on behalf of union members and the government through the Ministry of Economy, Ministry of Labour and the Production Development Corporation (CORFO).
The indicators and the methodology presented in the first report (ChileCalidad/ILO, 2009) were selected by consensus of the social actors and the government under the supervision of ChileCalidad’s tripartite council, for the purpose of promoting
14 Indicators included under “ Combining work, family and personal life” included, for example, “Percentage of women of 16 years of age or older employed with children between 0 and 6 years of age in relation to the total number of women employed” and “daycare attendance by category: no child attends/some children attend/all children attend.” Under care-giving, indicators included “percentage distributon of families by type of familial arrangement —single person, couple with children, couple without children, single person with children.”

16 ECLAC / ILONumber 8
discussion on an initial exercise that get a process under way for developing indicators to measure progress on decent work in Chile.
The six components identified by the social actors to operationalize the concept of decent work are:i) Employment stability.ii) Income and productive work.iii) Workplace and employment conditions.iv) Work-family balance.v) Social protection.vi) Social dialogue and labour relations.
The first report analyses the evolution of the indicators during the period 2003-2007 for two sets of firms: the winners of the National Quality Award and the universe of firms in the country. The indicators are disaggregated, where information is available, by a range of variables (gender, area of activity, large occupational groups and size of establishment).
In 2011 a second report was published (ChileCalidad, 2010) updating the series of indicators to 2008, which helps to show the effects of the crisis, mainly through the indicators in the component “Income and productive work”.
Mexico
In 2011 the ILO Office for Mexico and Cuba published the document Políticas de Empleo Decente para México, which analyses the evolution of a set of indicators during the period 2005-2010, selecting issues falling within each of the four strategic objectives of the concept of decent work (labour rights, access to employment, security in employment and social dialogue).
The paper analyses the evolution over time of 19 indicators, organized into four groups in line with these strategic objectives, for the country as a whole and disaggregated at the state level. Maps in the three colours of traffic lights provide a visual representation of the situation in Mexico’s states in 2010 with respect to each of the groups analysed.
Peru
In 2010, with the support of the ILO and European Community project Monitoring and Evaluation of Progress towards Decent Work (MAP), a tripartite consultation workshop was held in order to “identify technical assistance priorities in terms of decent work indicators, for the constituents and official institutions that produce data in Peru.” The workshop studied the indicators proposed by the Tripartite Meeting of Experts (ILO, 2008) and made a selection tailored to the needs expressed by the authorities and based on the availability of information at the country’s statistics institutions.
In 2012 the National Institute of Statistics and Informatics (INEI) and the Ministry of Labour and Promotion of Employment
(MTPE) in Peru prepared a discussion paper entitled Perú: Indicadores de Trabajo Decente (INEI/MTPE, 2012) on the evolution of a set of indicators in series covering the period 2004-2011 in most cases and the period 2008-2011 in others. The indicators presented in that paper are grouped into three categories: indicators released by INEI, potential indicators to be estimated and agreed upon indicators.
Uruguay
In 2012 Uruguay’s Ministry of Labour and Social Security prepared a report titled “Panorama de la calidad del empleo en el Uruguay,” which took a sectoral approach to analyse the evolution of employment quality in the country in the period from 2006 to 2010. The report looked at labour market conditions throughout the country, using as a principal source of information the household surveys conducted by the National Statistics Institute. Additional information came from various offices of the Ministry of Labour and Social Security, the Social Insurance Bank, the Central Bank of Uruguay and the Catholic University of Uruguay. The theoretical framework is based on the concept of decent work, and the set of indicators is based on the proposal of the Tripartite Meeting of Experts (ILO, 2008). In the absence of an ILO recommendation on indicators for the substantive element “Combining work and family life,” the report proposes calculating the rate of activity among women between the ages of 19 and 40 with children under the age of 5 in the household.
Central America and the Dominican Republic
The report Evolución de los principales indicadores del mercado de trabajo en Centroamérica y República Dominicana, años 2006-2010 can be found on the website of the Labour Observatory of Central America and the Dominican Republic.15 It presents the decent work indicators that can be extracted from annual series of household surveys for six countries in the subregion (Costa Rica, Dominican Republic, El Salvador, Honduras, Nicaragua and Panama) and data from Guatemala corresponding to 2006. The indicators refer exclusively to the substantive elements “Employment opportunities” and “Adequate earnings and productive work” but are variously disaggregated for relevant factors—gender, age, urban and rural areas, educational level, area of activity, sex and age, sex and educational level—where this information is available.
At present, the Observatory is working on a publication that will include indicators for the seven countries on all the substantive elements of decent work.
15 See [online] http://www.ilo.org/sanjose/programas-y-proyectos/observatorio-laboral/WCMS_206030/lang--es/index.htm.

The employment situation in Latin America and the Caribbean 17
MERCOSUR
On the website of the MERCOSUR Labour Market Observatory,16 there are six reports that look at how the labour market has evolved in the member countries since 2001. The publication Informe N° 6 del Mercado de Trabajo del MERCOSUR (MERCOSUR, 2011) analyses labour conditions in the subregion from 2006 to 2008. It begins with a brief description of the demographic situation of each country and then explores the most prominent aspects of the labour force and employment and unemployment levels, as well as the types of labour market participation by occupational category and the degree of social security coverage for wage earners from a gender perspective.
According to the report, in the labour markets of the four MERCOSUR countries, labour conditions improved significantly between 2006 and 2008 as a result of an upward economic growth path and rising job creation. However, the scope of these advances varied from one country to the next, based on the labour structure and the prevailing labour relations in the national context.
16 See [online] http://www.observatorio.net/es/ContenidoInformes.aspx.
In May 2012 the Observatory released the publication “Hacia la construcción de un sistema de indicadores de trabajo decente para el MERCOSUR,” which presented a first version of the system of indicators for the four countries based of the harmonization of statistics carried out by the respective statistics institutes. The document performs a time analysis of the decent work indicators classified according to the recommendation of the Tripartite Meeting of Experts corresponding to the period between 2006 and 2009 and primarily covering five of the ten substantive elements—employment opportunities, security of work, decent hours, equal opportunity and treatment in employment and access to social security—to which context indicators were added for purposes of analysis.
The website of the MERCOSUR Labour Market Observatory has a statistics section with 20 annual series of available decent work indicators that have been harmonized for the four countries, for the period between 2006 and 2010. These indicators point up the results that can be achieved when statistics institutes embark on the process of harmonization.
D. Limitations and problems observed in the preparation of a system of decent work indicators
The process of building a system of decent work indicators is not without its challenges. First, it requires the participation and assent of the social actors, in particular representatives of government, unions and employers, and the belief that the information provided by the system will prove useful for making policy and supporting negotiation between the parties. Second, it is necessary to identify the indicators that the country considers most appropriate for evaluating the evolution of each one of the substantive elements of decent work, taking into account the availability of indicators. Third, although three of the four recommended indicators can be obtained from employment surveys—or from other household surveys that have an employment component—additional sources are needed, including administrative records from labour ministries and social security institutes primarily. Fourth, responsibility for establishing a system of decent work indicators and keeping it up to date must be assigned to a government institution with the resources and authority to be able to coordinate periodic delivery of the necessary information with the statistics producers.
Other problems are related to the availability of the statistical information needed to prepare the indicators. The most common are: i) Lack of coordination between institutions that produce
official statistics;ii) Changes in methodology and/or in measurement instruments
that make it difficult (or impossible) to run comparisons over time;iii) Limited development of official statistics on the labour market;iv) Limited geographic coverage of employment surveys
(restricted to urban areas, metropolitan areas, or the capital city of the country); and
v) Insufficient human and financial resources to compile statistics from diverse sources, including sample surveys, censuses and administrative records, generally the responsibility of different institutions.17
There is no question that these problems pose significant challenges to getting a system of decent work indicators up and running, but the experiences of several countries described in the preceding section demonstrate that it is possible to overcome them.
17 A nonexhaustive list of sources of information for the system of decent work indicators includes: household surveys, employment surveys, population censuses, business surveys, economic censuses, child labour surveys, time use surveys, social security records, labour ministry records (accidents, disputes, collective agreements), population projections, national accounts system, administrative records of the health ministry, consumer price index, employer association records and union records.

18 ECLAC / ILONumber 8
E. Analysis of selected decent work indicators
This section, together with the annex, presents decent work indicators for the period between 2007 and 2011, which can be used to assess how the region’s labour markets have performed since just before the start of the 2008 crisis. The indicators were selected because they were the ones available for most of the region’s countries. They are:
Table II.2 DECENT WORK INDICATORS
Substantive element Indicators
Employment opportunities Wage-earner rateUrban informal employment
Social security Vulnerable employment rateEmployed with the right to a pensionEmployed with health protection
Source: Prepared by the authors.
In addition, this section refers to the evolution in indices of real average wages and real minimum wages, which are the key element in “adequate earnings and productive work”.
The wage-earner rate is obtained by grouping workers by status in employment and calculating the percentage of the total who are wage earners. Where the change between 2007 and 2011 has been possible to calculate, an increase in the percentage of wage-earners among the total employed is observed in the majority of the countries (see table II.3). The most striking exception is the case of Colombia, where the rate has been falling year after year. An analysis of the evolution of the rate by gender reveals that the increase is slightly greater among women, again with the exception of Colombia. Although an increase in the wage-earner rate can be interpreted at first glance as an improvement in terms of decent work, because the expectation is that it would be accompanied by an increase in formal employment, the indicator should be analysed in conjunction with the informal employment rate (if available) and the vulnerable employment rate.
With respect to the vulnerable employment rate (own- account workers and unpaid family workers as a percentage of total employed workers), situations vary from country to country in the region. Whereas the vulnerable employment rate for men and women alike fell in the MERCOSUR countries and in Panama, in the rest of the countries it either rose (Bolivarian Republic of Venezuela, Colombia, Dominican Republic, Ecuador, El Salvador, Honduras and Nicaragua) or remained relatively constant (Costa Rica, Mexico and Peru).
A significant reduction in the informal employment rate was observed from 2009 to 2011 in Argentina, Brazil, Ecuador, Panama, Paraguay and Uruguay (see table II.4). The decrease can largely be attributed to policies to reduce informality in the formal sector of the economy, with Ecuador standing out with a reduction of more than five percentage points over the two years.
Table II.3 LATIN AMERICA (SELECTED COUNTRIES): WAGE-EARNER RATE OF
THE EMPLOYED URBAN POPULATION, 2007-2011(Percentages)
CountryTotal
2007 2008 2009 2010 2011
Latin America 70.4 70.7 70.7 66.4 a 72.2
Argentina b 69.7 73.1 71.8 73.5 73.3
Bolivia (Plurinational State of) 53.4 51.9 54.9 ... ...
Brazil c 71.2 71.8 72.0 ... 73.8
Chile d 71.9 73.2 72.3 73.5 73.6
Colombia e 56.4 51.1 50.2 49.5 49.3
Costa Rica f 74.8 74.4 74.5 78.4 78.0
Ecuador g 58.9 59.7 60.1 61.0 58.5
El Salvador h 64.1 62.9 61.0 61.4 62.1
Honduras 59.0 59.8 56.4 55.9 57.3
Mexico i 71.8 71.4 70.9 70.2 71.1
Nicaragua j 59.0 59.4 ... 53.0 ...
Panama 75.8 76.0 74.9 75.9 78.0
Paraguay k 61.7 59.1 59.4 64.0 65.1
Perú l 54.6 55.4 55.5 54.7 55.4
Dominican Republic 59.5 57.5 57.2 55.8 56.5
Uruguay 71.4 71.7 72.1 73.1 74.2
Venezuela (Bolivarian Republic of) m 61.1 60.1 59.4 58.6 58.8
Source: Economic Commission for Latin America and the Caribbean (ECLAC) and International Labour Organization (ILO), estimates on the basis of official information from household surveys conducted in the respective countries.
a Weighted average excluding data from Brazil, which did not conduct a national household survey in 2010.
b Data from 28 urban agglomerations, corresponding to the fourth quarter of each year.c In 2010 there was no national household survey because the population census was
conducted.d National total. Through 2009 the data come from the National Employment Survey (ENE);
since 2010 they come from the New National Employment Survey (NENE) and are not comparable with the data from previous years.
e The data are for the second quarter and correspond to municipal seats in the Major Integrated Household Survey (GEIH).
f Through 2009 the data come from the Multi-purpose Household Survey (EHPM); since 2010 they come from the National Household Survey (ENAHO) and are not comparable with the data from previous years.
g The data correspond to the fourth quarter of the Survey on Employment, Unemployment and Underemployment.
h The working age population is defined as 16 years or age and older.i The data correspond to the second quarter of the National Occupation and Employment Survey
(ENOE).j Through 2009 the data come from the Household Survey to Measure Urban and RuralEmployment;
since 2010 they come from the Permanent Household Survey and are not comparable with the data from previous years.
k The data correspond to the period between October and December of the Permanent Household Survey.
l The data come the National Household Survey (ENAHO).m National total. The data correspond to the second half of each year.
The data on health protection for workers in countries where the household or employment surveys provide such information show significant improvements in nearly all cases for the period of analysis (the case of domestic service in Paraguay and Peru stands out in particular).

The employment situation in Latin America and the Caribbean 19
Table II.4 LATIN AMERICA (SELECTED COUNTRIES): URBAN INFORMAL EMPLOYMENT, AROUND 2009 AND 2011
(Numbers and percentages)
Country
Around 2009 Around 2011
Total people with informal employment a
People employed in the informal sector
People with informal employment in the
formal sector
Total people with informal employment a
People employed in the informal sector
People with informal employment in the
formal sector
Number Percentage Number Percentage Number Percentage Number Percentage Number Percentage Number Percentage
Argentina b 5 127 214 49.7 3 280 713 31.8 1 201 751 11.6 5 015 711 46.9 3 049 816 28.5 1 317 614 12.3
Brazil 32 493 342 42.2 18 631 710 24.2 8 530 455 11.1 30 248 709 38.4 17 747 874 22.5 7 778 555 9.9
Colombia 8 690 185 57.4 7 188 040 47.5 897 869 5.9 9 235 475 56.8 7 746 850 47.6 897 277 5.5
Costa Rica c 754 443 43.8 561 565 32.6 114 745 6.7 574 429 33.6 348 018 20.4 103 721 6.1
Ecuador 2 691 350 60.9 1 629 184 36.9 882 162 20.0 2 383 591 52.2 1 624 836 35.6 657 522 14.4
El Salvador 1 226 841 65.6 965 157 51.6 152 256 8.1 1 269 681 65.7 990 155 51.2 180 979 9.4
Honduras 1 453 646 73.9 1 119 672 56.9 264 722 13.5 1 438 001 70.7 1 117 126 54.9 246 654 12.1
Mexico 20 257 518 53.7 12 637 973 33.5 5 826 702 15.5 21 732 131 54.2 13 850 098 34.5 5 868 944 14.6
Panama 517 460 43.8 325 076 27.5 134 831 11.4 484 749 39.3 313 805 25.5 120 873 9.8
Paraguay 1 472 611 70.7 789 391 37.9 485 162 23.3 1 465 470 65.8 761 147 34.2 505 918 22.7
Peru 7 457 635 69.9 5 144 889 48.2 1 900 798 17.8 7 816 548 68.8 5 548 104 48.8 1 932 015 17.0
Republica Dominicana 1 483 781 48.5 890 328 29.1 396 600 13.0 1 669 244 50.0 1 067 563 32.0 386 383 11.6
Uruguay 557 277 38.8 430 371 30.0 58 673 4.1 520 963 35.5 397 613 27.1 50 942 3.5
Source: Economic Commission for Latin America and the Caribbean (ECLAC) and International Labour Organization (ILO), estimates on the basis of official information from household surveys conducted in the respective countries.
a The difference between the total and the sum of the two sectors corresponds to informal employment in domestic service and people who work exclusively to produce for own consumption.b Data from 31 urban agglomerations.c The data from 2011 are not comparable with the data from preceding years.
As for the right to a pension for workers, in all countries for which information is available progress is observed at the level of the total universe of workers, although there are major differences by status in employment. The most significant improvements are seen among wage-earners, compared with the rest of workers. One exception is Uruguay, where the rate of domestic employees with the right to a pension had climbed to over 50% in 2011. Another noteworthy case is Colombia, where an improvement of nearly seven percentage points among wage-earners had very little effect on the overall rate of workers because the relative weight of wage-earners in the labour force also fell by seven percentage points.
An analysis of real average earnings indexes in the countries for which information is available reveals that
from 2007 to 2011 earnings rose 1.6% annually on average, while annual GDP growth in these countries averaged more than 4% during the same period (ILO, 2012b, table 9 in the statistical annex). If GDP per capita for the same group of countries is considered, growth was slightly above 3% per year, double the growth of average earnings. In order to determine if earnings shrank as a share of total value-added, it is necessary to evaluate the evolution of employment in the period of analysis.18 Meanwhile, during the same period, real minimum wage indexes show average (weighted) growth of 2.8% per year (ILO (2012b, table 10 in the statistical annex). This indicates that from 2007 to 2011, the lowest-income wage-earners experienced greater gains that did the workforce as a whole.
18 See ECLAC/ILO (2012a).

20 ECLAC / ILONumber 8
Bibliography
Anker, Richard and others (2003), “Measuring decent work with statistical indicators”, International Labour Review, vol. 142, No. 2.
Chile Calidad/ILO (International Labour Organization) (2011), Segundo Informe sobre Indicadores de Trabajo y Excelencia en Chile, 2003-2008, Santiago, Chile.
(2009), Primer Informe sobre Indicadores de Trabajo y Excelencia en Chile, 2003-2007, Santiago, Chile.
ECE (Economic Commission for Europe) (2010), Measuring Quality of Employment (ECE/CES/5), Geveva.
ECLAC (Economic Commission for Latin America and the Caribbean) (2013), Updated Economic Overview of Latin America and the Caribbean, 2012 (LC/G.2564), Santiago, Chile, April.
(2012), “Informe sobre la propuesta del Grupo de trabajo sobre indicadores del mercado laboral”, Santiago, Chile.
(2009), Social Panorama of Latin America, 2009 (LC/G.2423-P), Santiago, Chile, United Nations publication, Sales No. S.09.II.G.135.
ECLAC/ILO (Economic Commission for Latin America and the Caribbean/International Labour Organization) (2012a), “Labour productivity and distribution issues”, The employment situation in Latin America and the Caribbean, No. 6, Santiago, Chile, May.
(2012b), “Youth employment: crisis and recovery”, The employment situation in Latin America and the Caribbean, No. 7, Santiago, Chile, October.
ECLAC/PNUD/ILO (Economic Commission for Latin America and the Caribbean/United Nations Development Programme/ International Labour Organization) (2008), Emprego, desenvolvimento humano e trabalho decente: a experiência brasileira recente, Brasilia.
Ghai, Dharam (2003), “Decent work: concept and indicators”, International Labour Review, vol. 142, No. 2, Geneva.
ILO (International Labour Organization) (2012a), Decent Work Indicators. Concepts and Definitions, Geneva, May.
(2012b), Labour Overview. Latin America and the Caribbean 2012, Lima, December.
(2012c), Perfil do trabalho decente no Brasil: um olhar sobre as unidades da federação, Brasilia.
(2010), Decent Work Country Profile Brazil, Brasilia. (2008), Measurement of decent work. Discussion paper for the
Tripartite Meeting of Experts on the Measurement of Decent Work (TMEMDW/2008), Geneva [online] http://www.ilo.org/wcmsp5/groups/public/---dgreports/--- integration/documents/meetingdocument/wcms_098027.pdf.
(1999), Report of the Director-General of the International Labour Organization on decent work, 87th session of the International Labour Conference, June.
(1982), Resolution concerning statistics of the economically active population, employment, unemployment and underemployment, adopted by the Thirteenth International Conference of Labour Statisticians (CIET).
INEI/MTPE (National Institute of Statistics and Informatics/Ministry of Labour and Employment Promotion of Peru) (2012), “Perú: indicadores de trabajo decente” [online] http://www.ilo.org/wcmsp5/groups/public/---dgreports/---integration/documents/projectdocumentation/wcms_194611.pdf.
Infante, Ricardo (ed.) (1999), La calidad del empleo. La experiencia de los países latinoamericanos y de los Estados Unidos, Santiago, Chile, International Labour Organization (ILO).
MERCOSUR (Southern Common Market) (2011), Informe N° 6 del Mercado de Trabajo del MERCOSUR [online] http://portal.mte.gov.br/data/files/8A7C816A2E7311D1012FE5A8668033AC/cartilha-informe6-mercosul.pdf.
MTESS (Ministry of Labour, Employment and Social Security of Argentina) (2007), Sistema de Indicadores de Trabajo Decente. Evolución del déficit de trabajo decente en Argentina, Buenos Aires.
OLACD (Labour Market Observatory of Central America and the Dominican Republic) (2011), “Evolución de los principales indicadores del mercado de trabajo en Centroamérica y República Dominicana, años 2006-2010”, San Jose, International Labour Organization (ILO) [online] http://www.olacd.oit.or.cr/images/stories/Informe_2006-2010_WEB.pdf.
Reinecke, Gerhard and María Elena Valenzuela (2000), “La calidad de empleo: un enfoque de género”, Más y mejores empleos para las mujeres? La experiencia de los países de Mercosur y Chile, M.E. Valenzuela and G. Reinecke (eds.), Santiago, Chile, International Labour Organization (ILO).
Rodgers, G. and G. Reinecke (1998), “The quality of work: prospects and examples from Chile and Brazil”, Restructure, integration and labour market. Growth and quality of employment in open Economies, C, Ricardo Soifer and others, International Labour Organization (ILO).
Weller, Jürgen (2012), “Crecimiento, empleo y distribución de ingresos en América Latina”, Macroeconomía del Desarrollo series, No. 122 (LC/L.3516), Santiago, Chile, Economic Commission for Latin America and the Caribbean (ECLAC).
Weller, Jürgen and Claudia Roethlisberger (2011), “La calidad del empleo en América Latina”, Macroeconomía del Desarrollo series, No. 110 (LC/L.3320-P), Santiago, Chile, Economic Commission for Latin America and the Caribbean (ECLAC), April.
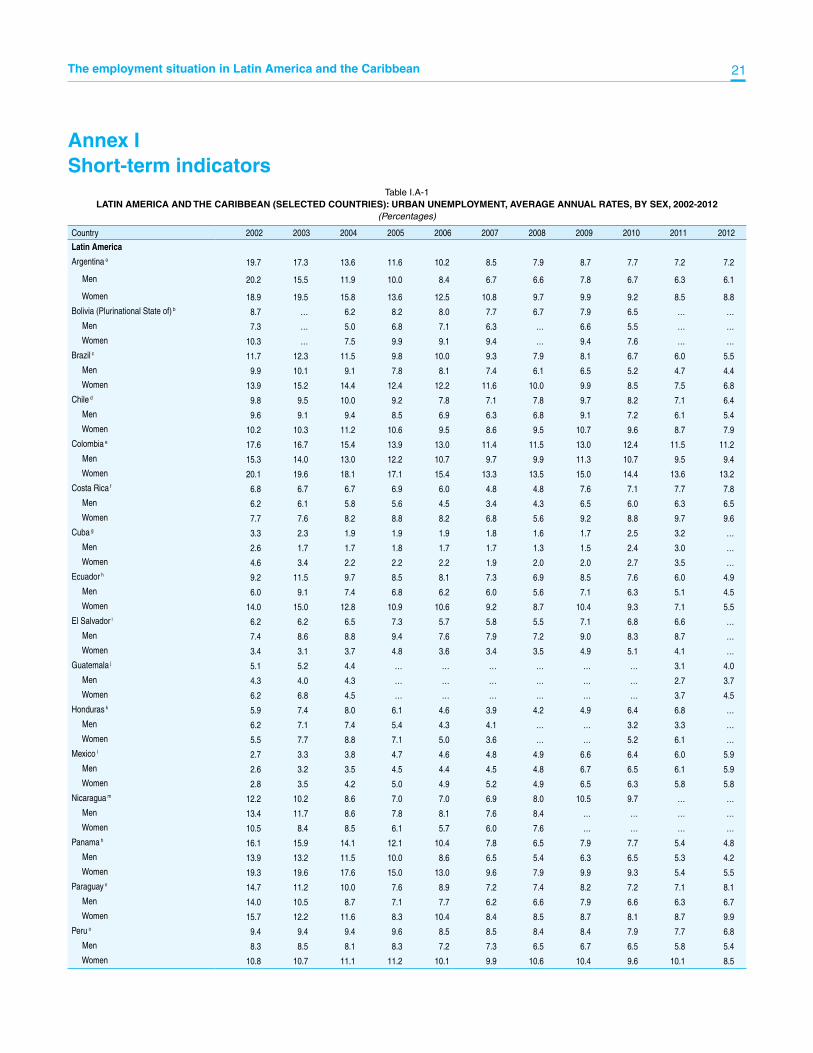
The employment situation in Latin America and the Caribbean 21
Annex I Short-term indicators
Table I.A-1LATIN AMERICA AND THE CARIBBEAN (SELECTED COUNTRIES): URBAN UNEMPLOYMENT, AVERAGE ANNUAL RATES, BY SEX, 2002-2012
(Percentages)
Country 2002 2003 2004 2005 2006 2007 2008 2009 2010 2011 2012
Latin America
Argentina a 19.7 17.3 13.6 11.6 10.2 8.5 7.9 8.7 7.7 7.2 7.2
Men 20.2 15.5 11.9 10.0 8.4 6.7 6.6 7.8 6.7 6.3 6.1
Women 18.9 19.5 15.8 13.6 12.5 10.8 9.7 9.9 9.2 8.5 8.8
Bolivia (Plurinational State of) b 8.7 … 6.2 8.2 8.0 7.7 6.7 7.9 6.5 … …
Men 7.3 … 5.0 6.8 7.1 6.3 … 6.6 5.5 … …
Women 10.3 … 7.5 9.9 9.1 9.4 … 9.4 7.6 … …
Brazil c 11.7 12.3 11.5 9.8 10.0 9.3 7.9 8.1 6.7 6.0 5.5
Men 9.9 10.1 9.1 7.8 8.1 7.4 6.1 6.5 5.2 4.7 4.4
Women 13.9 15.2 14.4 12.4 12.2 11.6 10.0 9.9 8.5 7.5 6.8
Chile d 9.8 9.5 10.0 9.2 7.8 7.1 7.8 9.7 8.2 7.1 6.4
Men 9.6 9.1 9.4 8.5 6.9 6.3 6.8 9.1 7.2 6.1 5.4
Women 10.2 10.3 11.2 10.6 9.5 8.6 9.5 10.7 9.6 8.7 7.9
Colombia e 17.6 16.7 15.4 13.9 13.0 11.4 11.5 13.0 12.4 11.5 11.2
Men 15.3 14.0 13.0 12.2 10.7 9.7 9.9 11.3 10.7 9.5 9.4
Women 20.1 19.6 18.1 17.1 15.4 13.3 13.5 15.0 14.4 13.6 13.2
Costa Rica f 6.8 6.7 6.7 6.9 6.0 4.8 4.8 7.6 7.1 7.7 7.8
Men 6.2 6.1 5.8 5.6 4.5 3.4 4.3 6.5 6.0 6.3 6.5
Women 7.7 7.6 8.2 8.8 8.2 6.8 5.6 9.2 8.8 9.7 9.6
Cuba g 3.3 2.3 1.9 1.9 1.9 1.8 1.6 1.7 2.5 3.2 …
Men 2.6 1.7 1.7 1.8 1.7 1.7 1.3 1.5 2.4 3.0 …
Women 4.6 3.4 2.2 2.2 2.2 1.9 2.0 2.0 2.7 3.5 …
Ecuador h 9.2 11.5 9.7 8.5 8.1 7.3 6.9 8.5 7.6 6.0 4.9
Men 6.0 9.1 7.4 6.8 6.2 6.0 5.6 7.1 6.3 5.1 4.5
Women 14.0 15.0 12.8 10.9 10.6 9.2 8.7 10.4 9.3 7.1 5.5
El Salvador i 6.2 6.2 6.5 7.3 5.7 5.8 5.5 7.1 6.8 6.6 …
Men 7.4 8.6 8.8 9.4 7.6 7.9 7.2 9.0 8.3 8.7 …
Women 3.4 3.1 3.7 4.8 3.6 3.4 3.5 4.9 5.1 4.1 …
Guatemala j 5.1 5.2 4.4 … … … … … … 3.1 4.0
Men 4.3 4.0 4.3 … … … … … … 2.7 3.7
Women 6.2 6.8 4.5 … … … … … … 3.7 4.5
Honduras k 5.9 7.4 8.0 6.1 4.6 3.9 4.2 4.9 6.4 6.8 …
Men 6.2 7.1 7.4 5.4 4.3 4.1 … … 3.2 3.3 …
Women 5.5 7.7 8.8 7.1 5.0 3.6 … … 5.2 6.1 …
Mexico l 2.7 3.3 3.8 4.7 4.6 4.8 4.9 6.6 6.4 6.0 5.9
Men 2.6 3.2 3.5 4.5 4.4 4.5 4.8 6.7 6.5 6.1 5.9
Women 2.8 3.5 4.2 5.0 4.9 5.2 4.9 6.5 6.3 5.8 5.8
Nicaragua m 12.2 10.2 8.6 7.0 7.0 6.9 8.0 10.5 9.7 … …
Men 13.4 11.7 8.6 7.8 8.1 7.6 8.4 … … … …
Women 10.5 8.4 8.5 6.1 5.7 6.0 7.6 … … … …
Panama h 16.1 15.9 14.1 12.1 10.4 7.8 6.5 7.9 7.7 5.4 4.8
Men 13.9 13.2 11.5 10.0 8.6 6.5 5.4 6.3 6.5 5.3 4.2
Women 19.3 19.6 17.6 15.0 13.0 9.6 7.9 9.9 9.3 5.4 5.5
Paraguay n 14.7 11.2 10.0 7.6 8.9 7.2 7.4 8.2 7.2 7.1 8.1
Men 14.0 10.5 8.7 7.1 7.7 6.2 6.6 7.9 6.6 6.3 6.7
Women 15.7 12.2 11.6 8.3 10.4 8.4 8.5 8.7 8.1 8.7 9.9
Peru o 9.4 9.4 9.4 9.6 8.5 8.5 8.4 8.4 7.9 7.7 6.8
Men 8.3 8.5 8.1 8.3 7.2 7.3 6.5 6.7 6.5 5.8 5.4
Women 10.8 10.7 11.1 11.2 10.1 9.9 10.6 10.4 9.6 10.1 8.5

22 ECLAC / ILONumber 8
Country 2002 2003 2004 2005 2006 2007 2008 2009 2010 2011 2012
Dominican Republic p 6.6 7.3 6.1 6.4 5.5 5.0 4.7 5.3 5.0 5.8 6.5
Men 4.8 5.4 4.2 4.7 3.7 3.7 3.1 4.0 3.9 4.4 4.9
Women 10.0 10.8 9.8 9.6 8.7 7.4 7.3 7.8 6.9 8.2 9.1
Uruguay k 17.0 16.9 13.1 12.2 11.4 9.6 7.9 7.7 7.1 6.3 6.2
Men 13.5 13.5 10.3 9.6 8.8 7.1 5.7 5.7 5.4 5.0 4.9
Women 21.2 20.8 16.6 15.3 14.4 12.6 10.3 9.8 9.0 7.7 7.8
Venezuela (Bolivarian Republic of) q 15.9 18.0 15.1 12.3 10.0 8.4 7.3 7.8 8.7 8.3 8.1
Men 14.4 16.3 13.1 11.3 9.2 7.9 7.0 7.4 8.5 7.7 7.4
Women 18.2 21.1 17.9 13.8 11.3 9.3 7.8 8.3 9.0 9.2 9.0
The Caribbean
Bahamas q 9.1 10.8 10.2 10.2 7.6 7.9 12.1 14.2 … 13.7 14.0
Men 8.8 10.0 9.4 9.2 6.9 6.7 … 14.0 … 13.6 14.1
Women 9.4 11.7 11.0 11.2 8.4 9.1 … 14.4 … 13.7 14.0
Barbados q 10.3 11.0 9.6 9.1 8.7 7.4 8.1 10.0 10.8 11.2 11.7 o
Men 8.6 9.6 8.8 7.4 7.7 6.5 6.9 10.1 10.9 9.8 11.0 o
Women 12.1 12.6 10.5 10.8 9.8 8.5 9.5 9.8 10.6 12.6 12.3 o
Belize q 10.0 12.9 11.6 11.0 9.4 8.5 8.2 13.1 12.5 … 15.3
Men 7.5 8.6 8.3 7.4 6.2 5.8 … … … … …
Women 15.3 20.7 17.4 17.2 15.0 13.1 … … … … …
Jamaica q 14.3 10.9 11.4 11.2 10.3 9.8 10.6 11.4 12.4 12.6 13.7
Men 9.9 7.2 8.1 7.6 7.0 6.2 7.3 8.5 9.2 9.3 10.3
Women 19.8 15.6 15.7 15.8 14.4 14.5 14.6 14.8 16.2 16.7 17.8
Trinidad and Tobago q 10.4 10.5 8.3 8.0 6.2 5.5 4.6 5.3 5.9 5.1 5.4 s
Men 7.8 8.0 6.4 5.8 4.5 3.9 … … … … …
Women 14.5 13.8 11.2 11.0 8.7 7.9 … … … … …
Latin America and the Caribbean t 11.2 11.1 10.3 9 8.6 7.9 7.3 8.1 7.3 6.7 6.4 u
Source: Economic Commission for Latin America and the Caribbean (ECLAC) and International Labour Organization (ILO), on the basis of household surveys conducted in the respective countries.a Gradual incorporation up to 31 urban areas. New measurement from 2003; data not comparable with previous years.b Urban areas. Data for 2004 based on the survey carried out between November 2003 and October 2004. New measurement from 2009; data not comparable with previous years.c Six metropolitan areas.d National total. New measurement from 2010; data not comparable with previous years.e Thirteen metropolitan areas. Includes hidden unemployment.f Urban areas nationwide. New measurement from 2009; data not comparable with previous years.g National total. Working-age population refers to those aged 17-54 years in the case of women and 17-59 years in the case of men.h Urban areas nationwide. Includes hidden unemployment.i Urban areas nationwide.In 2007, the definition of the working-age populationchanged from 10 years and over to 16 years and over.j Urban areas nationwide. In 2011, the definition of the working-age population changed from 10 years and over to 15 years and over.k Urban areas nationwide.l Thirty-two urban areas.m Urban areas nationwide. New measurement from 2003 on; data not comparable with previous years.n Up to 2009, urban areas nationwide; from 2010 on, urban areas of Asunción and the Central Department, not comparable with previous years.o Metropolitan Lima.p National total. q National total. Includes hidden unemployment.r Average for January-September.s Data refer to March.t Weighted average. Includes adjustment to the data for methodological changes in Argentina (2003), and for the exclusion of hidden unemployment in Colombia,Dominican Republic, Ecuador,
Jamaica and Panama. Does not include Guatemala. u Preliminary data.
Table I.A-1 (concluded)
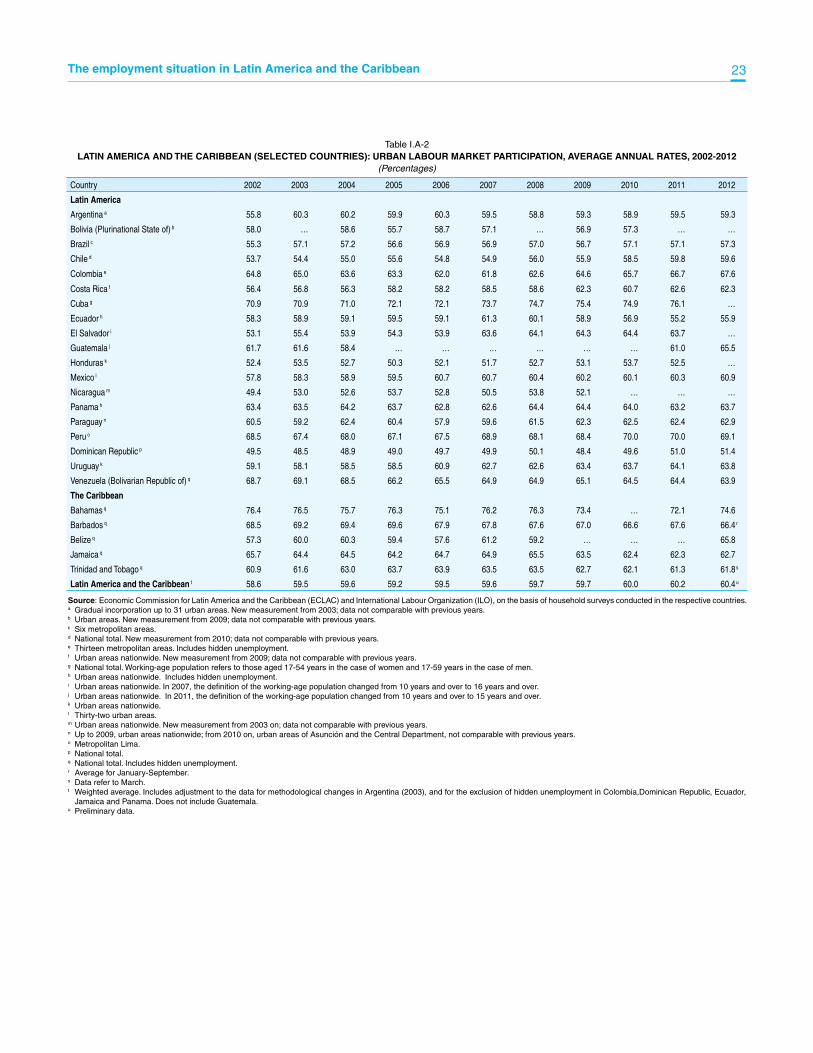
The employment situation in Latin America and the Caribbean 23
Table I.A-2LATIN AMERICA AND THE CARIBBEAN (SELECTED COUNTRIES): URBAN LABOUR MARKET PARTICIPATION, AVERAGE ANNUAL RATES, 2002-2012
(Percentages)
Country 2002 2003 2004 2005 2006 2007 2008 2009 2010 2011 2012
Latin America
Argentina a 55.8 60.3 60.2 59.9 60.3 59.5 58.8 59.3 58.9 59.5 59.3
Bolivia (Plurinational State of) b 58.0 … 58.6 55.7 58.7 57.1 … 56.9 57.3 … …
Brazil c 55.3 57.1 57.2 56.6 56.9 56.9 57.0 56.7 57.1 57.1 57.3
Chile d 53.7 54.4 55.0 55.6 54.8 54.9 56.0 55.9 58.5 59.8 59.6
Colombia e 64.8 65.0 63.6 63.3 62.0 61.8 62.6 64.6 65.7 66.7 67.6
Costa Rica f 56.4 56.8 56.3 58.2 58.2 58.5 58.6 62.3 60.7 62.6 62.3
Cuba g 70.9 70.9 71.0 72.1 72.1 73.7 74.7 75.4 74.9 76.1 …
Ecuador h 58.3 58.9 59.1 59.5 59.1 61.3 60.1 58.9 56.9 55.2 55.9
El Salvador i 53.1 55.4 53.9 54.3 53.9 63.6 64.1 64.3 64.4 63.7 …
Guatemala j 61.7 61.6 58.4 … … … … … … 61.0 65.5
Honduras k 52.4 53.5 52.7 50.3 52.1 51.7 52.7 53.1 53.7 52.5 …
Mexico l 57.8 58.3 58.9 59.5 60.7 60.7 60.4 60.2 60.1 60.3 60.9
Nicaragua m 49.4 53.0 52.6 53.7 52.8 50.5 53.8 52.1 … … …
Panama h 63.4 63.5 64.2 63.7 62.8 62.6 64.4 64.4 64.0 63.2 63.7
Paraguay n 60.5 59.2 62.4 60.4 57.9 59.6 61.5 62.3 62.5 62.4 62.9
Peru o 68.5 67.4 68.0 67.1 67.5 68.9 68.1 68.4 70.0 70.0 69.1
Dominican Republic p 49.5 48.5 48.9 49.0 49.7 49.9 50.1 48.4 49.6 51.0 51.4
Uruguay k 59.1 58.1 58.5 58.5 60.9 62.7 62.6 63.4 63.7 64.1 63.8
Venezuela (Bolivarian Republic of) q 68.7 69.1 68.5 66.2 65.5 64.9 64.9 65.1 64.5 64.4 63.9
The Caribbean
Bahamas q 76.4 76.5 75.7 76.3 75.1 76.2 76.3 73.4 … 72.1 74.6
Barbados q 68.5 69.2 69.4 69.6 67.9 67.8 67.6 67.0 66.6 67.6 66.4r
Belize q 57.3 60.0 60.3 59.4 57.6 61.2 59.2 … … … 65.8
Jamaica q 65.7 64.4 64.5 64.2 64.7 64.9 65.5 63.5 62.4 62.3 62.7
Trinidad and Tobago q 60.9 61.6 63.0 63.7 63.9 63.5 63.5 62.7 62.1 61.3 61.8s
Latin America and the Caribbean t 58.6 59.5 59.6 59.2 59.5 59.6 59.7 59.7 60.0 60.2 60.4u
Source: Economic Commission for Latin America and the Caribbean (ECLAC) and International Labour Organization (ILO), on the basis of household surveys conducted in the respective countries.a Gradual incorporation up to 31 urban areas. New measurement from 2003; data not comparable with previous years.b Urban areas. New measurement from 2009; data not comparable with previous years.c Six metropolitan areas.d National total. New measurement from 2010; data not comparable with previous years.e Thirteen metropolitan areas. Includes hidden unemployment.f Urban areas nationwide. New measurement from 2009; data not comparable with previous years.g National total. Working-age population refers to those aged 17-54 years in the case of women and 17-59 years in the case of men.h Urban areas nationwide. Includes hidden unemployment.i Urban areas nationwide. In 2007, the definition of the working-age population changed from 10 years and over to 16 years and over.j Urban areas nationwide. In 2011, the definition of the working-age population changed from 10 years and over to 15 years and over.k Urban areas nationwide.l Thirty-two urban areas.m Urban areas nationwide. New measurement from 2003 on; data not comparable with previous years.n Up to 2009, urban areas nationwide; from 2010 on, urban areas of Asunción and the Central Department, not comparable with previous years.o Metropolitan Lima.p National total. q National total. Includes hidden unemployment.r Average for January-September.s Data refer to March.t Weighted average. Includes adjustment to the data for methodological changes in Argentina (2003), and for the exclusion of hidden unemployment in Colombia,Dominican Republic, Ecuador,
Jamaica and Panama. Does not include Guatemala. u Preliminary data.

24 ECLAC / ILONumber 8
Table I.A-3LATIN AMERICA AND THE CARIBBEAN (SELECTED COUNTRIES): URBAN EMPLOYMENT, AVERAGE ANNUAL RATES, 2002-2012
(Percentages)
Country 2002 2003 2004 2005 2006 2007 2008 2009 2010 2011 2012
Latin America
Argentina a 44.6 49.9 52.1 53.0 54.1 54.5 54.2 54.2 54.4 55.2 55.0
Bolivia (Plurinational State of) b 53.0 … 55.0 51.2 54.0 52.7 … 52.4 53.6 … …
Brazil c 48.9 50.1 50.6 51.0 51.2 51.6 52.5 52.1 53.2 53.7 54.2
Chile d 48.4 49.3 49.5 50.4 50.5 51.0 51.7 50.5 53.7 55.5 55.7
Colombia e 53.4 54.2 53.8 54.5 54.0 54.8 55.3 56.2 57.6 59.1 60.1
Costa Rica f 52.6 53.0 52.5 54.2 54.7 55.7 55.7 57.0 56.4 57.8 57.4
Cuba g 68.6 69.2 69.7 70.7 70.7 72.4 73.6 74.2 73.0 73.6 …
Ecuador h 52.1 48.6 53.4 54.4 54.3 56.8 56.0 53.9 52.5 51.9 53.2
El Salvador i 49.8 52.0 50.4 50.3 50.8 59.9 60.6 59.7 60.0 59.5 …
Guatemala j 58.5 58.4 55.8 … … … … … … 59.0 62.8
Honduras h 49.3 49.5 48.5 47.2 49.7 49.7 50.5 50.5 50.3 48.9 …
Mexico k 55.5 55.6 55.8 56.7 57.9 57.8 57.5 56.2 56.2 56.7 57.4
Nicaragua l 43.3 47.6 48.0 49.9 49.1 47.1 49.5 46.6 … … …
Panama h 53.2 53.4 55.1 56.0 56.3 57.7 60.2 59.3 59.1 59.8 60.7
Paraguay m 48.4 52.5 56.1 55.8 52.7 55.3 57.0 57.1 58.0 58.0 57.8
Peru n 62.0 61.2 61.6 60.7 61.8 63.0 62.4 62.7 64.5 64.5 64.4
Dominican Republic o 46.2 45.2 46.0 45.9 46.9 47.4 47.7 45.8 47.1 48.0 48.2
Uruguay h 49.1 48.3 50.9 51.4 53.9 56.7 57.7 58.6 59.1 60.1 59.8
Venezuela (Bolivarian Republic of) o 57.9 56.7 58.0 58.0 58.9 59.4 60.2 60.0 58.9 59.0 58.7
The Caribbean
Bahamas o 70.5 69.7 68.0 68.5 69.4 70.2 69.7 63.0 … 60.6 64.1
Barbados o 61.4 61.6 62.7 63.2 61.9 62.8 62.1 60.3 59.4 60.0 58.6 p
Belize o 51.5 52.3 53.3 52.8 52.2 56.0 54.3 … … … 55.7
Jamaica o 56.4 57.1 57.0 57.0 58.0 58.6 58.5 56.3 54.7 54.4 54.1
Trinidad and Tobago o 54.6 55.2 57.8 58.6 59.9 59.9 60.6 59.4 58.4 58.2 58.4 q
Latin America and the Caribbean r 52.0 52.9 53.5 53.9 54.5 55.0 55.4 54.9 55.6 56.1 56.5 s
Source: Economic Commission for Latin America and the Caribbean (ECLAC) and International Labour Organization (ILO), on the basis of household surveys conducted in the respective countries.a Gradual incorporation up to 31 urban areas. New measurement from 2003; data not comparable with previous years.b Urban areas. New measurement from 2009; data not comparable with previous years.c Six metropolitan areas.d National total. New measurement from 2010; data not comparable with previous years.e Thirteen metropolitan areas. f Urban areas nationwide. New measurement from 2009; data not comparable with previous years.g National total. Working-age population refers to those aged 17-54 years in the case of women and 17-59 years in the case of men.h Urban areas nationwide. i Urban areas nationwide. In 2007, the definition of the working-age population changed from 10 years and over to 16 years and over.j Urban areas nationwide. In 2011, the definition of the working-age population changed from 10 years and over to 15 years and over.k Thirty-two urban areas.l Urban areas nationwide. New measurement from 2003 on; data not comparable with previous years.m Up to 2009, urban areas nationwide; from 2010 on, urban areas of Asunción and the Central Department, not comparable with previous years.n Metropolitan Lima.o National total. p Average for January-September.q Data refer to March.r Weighted average. Includes adjustment to the data for methodological changes in Argentina (2003).s Preliminary data.

The employment situation in Latin America and the Caribbean 25
Annex II Latin America: selected decent work indicators
Table II.A-1 LATIN AMERICA (SELECTED COUNTRIES): URBAN VULNERABLE EMPLOYMENT AS A PROPORTION OF THE EMPLOYED
POPULATION, BY SEX, 2007-2011(Percentages)
Country Year Total Men Women Country Year Total Men WomenLatin America 2007 24.9 25.8 23.7 Honduras 2007 37.6 35.5 40.3
2008 24.1 24.6 23.4 2008 36.9 34.6 39.82009 24.2 25.0 23.2 2009 39.6 36.1 44.12010 a 28.7 26.9 31.2 2010 40.3 36.9 44.52011 23.5 25.3 21.2 2011 39.5 36.5 43.3
Argentina b 2007 18.9 21.1 15.8 Mexico h 2007 21.4 19.8 23.62008 18.7 20.3 16.6 2008 21.6 19.8 24.32009 20.2 22.4 17.2 2009 22.0 20.3 24.62010 18.7 20.5 16.3 2010 22.5 20.4 25.62011 18.3 20.4 15.3 2011 21.4 19.4 24.3
Bolivia (Plurinational State of) 2007 ... ... ... Nicaragua i 2007 36.6 33.1 40.82008 42.0 34.6 51.1 2008 ... ... ...2009 39.8 32.3 49.3 2009 ... ... ...2010 ... ... ... 2010 41.4 34.1 49.82011 ... ... ... 2011 ... ... ...
Brazil c 2007 24.6 26.1 22.8 Panama 2007 20.7 22.9 17.62008 23.3 24.3 22.0 2008 20.2 21.2 18.82009 23.3 24.6 21.5 2009 21.4 21.9 20.62010 ... ... ... 2010 20.6 22.2 18.32011 22.5 25.1 19.1 2011 18.5 21.7 14.1
Chile d 2007 25.0 25.9 23.3 Paraguay j 2007 30.9 27.6 35.12008 23.9 24.6 22.6 2008 29.4 25.1 35.52009 24.9 25.7 23.5 2009 30.5 26.3 36.22010 21.8 21.6 22.1 2010 27.1 23.2 32.62011 21.8 20.9 23.1 2011 27.5 24.0 32.1
Colombia e 2007 39.3 40.2 38.0 Peru k 2007 ... ... ...2008 44.4 45.0 43.6 2008 38.9 32.8 46.72009 44.6 44.4 44.8 2009 38.6 32.3 46.62010 45.6 45.7 45.5 2010 39.0 33.0 46.42011 45.6 44.8 46.5 2011 38.7 33.6 45.0
Costa Rica f 2007 18.0 18.5 17.4 Dominican Republic 2007 36.1 41.8 26.62008 18.3 17.9 18.8 2008 37.4 42.6 29.42009 18.0 16.9 19.5 2009 37.6 43.9 27.32010 18.1 19.0 16.9 2010 40.1 47.1 28.82011 17.9 18.9 16.6 2011 39.4 46.2 29.0
Ecuador g 2007 35.2 30.2 42.3 Uruguay 2007 24.0 25.1 22.72008 34.4 29.3 41.6 2008 23.3 24.2 22.32009 35.2 30.3 42.1 2009 23.1 23.8 22.32010 34.8 30.9 40.5 2010 22.2 23.1 21.22011 37.9 33.6 44.1 2011 21.1 21.5 20.6
El Salvador 2007 30.8 22.1 40.4 Venezuela (Bolivarian Republic of) l
2007 34.7 33.6 36.62008 32.3 23.4 42.4 2008 35.8 35.4 36.32009 34.3 26.4 43.1 2009 36.8 36.4 37.52010 34.0 25.7 43.1 2010 37.9 38.2 37.62011 33.9 26.4 42.5 2011 37.7 38.0 37.2
Source: Economic Commission for Latin America and the Caribbean (ECLAC) and International Labour Organization (ILO), estimates on the basis of official information from household surveys conducted in the respective countries.
a Weighted average excluding data from Brazil, which did not conduct a national household survey in 2010. b Data from 28 urban agglomerations, corresponding to the fourth quarter of each year. c In 2010 there was no national household survey because the population census was conducted. d National total. Through 2009 the data come from the National Employment Survey (ENE); since 2010 they come from the New National Employment Survey (NENE) and are not comparable
with the data from previous years.e The data are for the second quarter and correspond to municipal seats in the Major Integrated Household Survey (GEIH). f Through 2009 the data come from the Multi-purpose Household Survey (EHPM); since 2010 they come from the National Household Survey (ENAHO) and are not comparable with the data
from previous years. g The data correspond to the fourth quarter of the Survey on Employment, Unemployment and Underemployment. h The data correspond to the second quarter of the National Occupation and Employment Survey (ENOE). i Through 2009 the data come from the Household Survey to Measure Urban and Rural Employment; since 2010 they come from the Permanent Household Survey and are not comparable with
the data from previous years. j The data correspond to the period between October and December of the Permanent Household Survey.k The data come the National Household Survey (ENAHO). l National total. The data correspond to the second half of each year.

26 ECLAC / ILONumber 8
Table II.A-2 LATIN AMERICA (SELECTED COUNTRIES): WAGE-EARNER RATE OF THE URBAN EMPLOYED POPULATION, BY SEX, 2007–2011
(Percentages)
CountryTotal Men Women
2007 2008 2009 2010 2011 2007 2008 2009 2010 2011 2007 2008 2009 2010 2011
Latin America 70.4 70.7 70.7 66.4 a 72.2 68.2 68.8 68.4 66.6 a 69.3 73.4 73.2 73.7 66.2 a 76.0
Argentina b 69.7 73.1 71.8 73.5 73.3 65.0 69.7 68.0 69.5 69.0 76.3 77.9 77.2 79.2 79.4
Bolivia (Plurinational State of) 53.4 51.9 54.9 ... ... 58.9 57.2 60.9 ... ... 46.5 45.4 47.3 ... ...
Brazil c 71.2 71.8 72.0 ... 73.8 68.6 69.5 69.2 ... 70.3 74.6 74.7 75.5 ... 78.4
Chile d 71.9 73.2 72.3 73.5 73.6 70.2 71.8 70.9 72.5 73.4 75.0 75.6 74.8 75.1 74.0
Colombia e 56.4 51.1 50.2 49.5 49.3 54.5 49.1 48.7 47.9 48.6 58.9 53.6 52.1 51.5 50.2
Costa Rica f 74.8 74.4 74.5 78.4 78.0 72.4 72.8 73.3 76.4 75.9 78.4 76.6 76.2 81.3 80.9
Ecuador g 58.9 59.7 60.1 61.0 58.5 62.3 63.1 63.7 63.6 61.7 54.1 55.0 55.1 57.2 53.8
El Salvador h 64.1 62.9 61.0 61.4 62.1 71.5 70.1 67.4 68.5 68.6 55.9 54.7 53.8 53.5 54.5
Honduras 59.0 59.8 56.4 55.9 57.3 60.0 61.3 59.1 58.2 59.2 57.6 57.9 53.1 53.1 54.9
Mexico i 71.8 71.4 70.9 70.2 71.1 71.3 71.1 70.8 70.2 70.9 72.7 71.8 71.1 70.1 71.4
Nicaragua j 59.0 59.4 ... 53.0 ... 60.7 61.8 ... 57.9 ... 56.9 56.5 ... 47.4 ...
Panama 75.8 76.0 74.9 75.9 78.0 72.4 74.0 73.3 73.3 74.0 80.5 78.9 77.3 79.7 83.5
Paraguay k 61.7 59.1 59.4 64.0 65.1 62.8 60.3 60.4 65.3 66.2 60.2 57.4 58.1 62.3 63.7
Peru m 54.6 55.4 55.5 54.7 55.4 58.7 59.6 60.0 58.5 58.5 49.4 49.9 49.7 49.9 51.5
Dominican Republic 59.5 57.5 57.2 55.8 56.5 52.9 51.2 49.7 48.2 48.4 70.6 67.2 69.5 68.2 68.8
Uruguay 71.4 71.7 72.1 73.1 74.2 68.8 69.3 69.9 70.7 72.3 74.5 74.7 74.9 75.9 76.5
Venezuela (Bolivarian Republic of) m 61.1 60.1 59.4 58.6 58.8 60.8 59.1 58.6 57.2 57.3 61.5 61.7 60.6 60.8 61.1
Source: Economic Commission for Latin America and the Caribbean (ECLAC) and International Labour Organization (ILO), estimates on the basis of official information from household surveys conducted in the respective countries.
a Weighted average excluding data from Brazil, which did not conduct a national household survey in 2010. b Data from 28 urban agglomerations, corresponding to the fourth quarter of each year. c In 2010 there was no national household survey because the population census was conducted.d National total. Through 2009 the data come from the National Employment Survey (ENE); since 2010 they come from the New National Employment Survey (NENE) and are not comparable
with the data from previous years.e The data correspond are for the second quarter and correspond to municipal seats in the Major Integrated Household Survey (GEIH).f Through 2009 the data come from the Multi-purpose Household Survey (EHPM); since 2010 they come from the National Household Survey (ENAHO) and are not comparable with the data
from previous years.g The data correspond to the fourth quarter of the Survey on Employment, Unemployment and Underemployment.h The working age population is defined as 16 years or age and older.i The data correspond to the second quarter of the National Occupation and Employment Survey (ENOE).j Through 2009 the data come from the Household Survey to Measure Urban and Rural Employment; since 2010 they come from the Permanent Household Survey and are not comparable with
the data from previous years. k The data correspond to the period between October and December of the Permanent Household Survey.l The data come the National Household Survey (ENAHO).m National total. The data correspond to the second half of each year.

The employment situation in Latin America and the Caribbean 27
Table II.A-3 LATIN AMERICA (SELECTED COUNTRIES): URBAN EMPLOYED POPULATION WITH HEALTH PROTECTION, BY STATUS IN EMPLOYMENT, 2007-2011
(Percentages)
Country Year Total Wage workersOwn-account and unpaid
family workers Domestic workers
Argentina a 2007 67.8 75.9 58.1 37.82008 68.3 72.1 59.6 41.02009 68.8 77.0 54.7 42.22010 70.3 77.6 58.7 50.32011 73.4 85.9 60.0 49.7
Brazil b 2007 57.9 77.0 26.2 31.22008 58.8 77.7 26.0 30.82009 60.2 79.2 27.6 32.12010 ... ... ... ...2011 65.4 82.3 32.6 37.9
Chile c 2006 91.6 94.5 83.7 93.52007 ... ... ... ...2008 ... ... ... ...2009 93.4 95.3 88.3 95.42011 95.5 97.4 90.8 97.1
Colombia d 2007 47.5 68.4 26.0 27.62008 49.1 74.8 27.6 32.02009 47.7 74.1 26.8 29.22010 47.6 75.0 26.4 29.02011 48.1 75.4 27.0 29.1
El Salvador e 2007 43.9 62.3 19.4 12.72008 ... ... ... ...2009 42.4 63.1 19.1 9.82010 ... ... ... ...2011 ... ... ... ...
Mexico f 2007 48.2 69.2 0.2 8.12008 47.6 68.5 0.2 6.72009 46.9 67.2 0.3 7.02010 46.2 67.1 0.2 6.42011 47.0 67.2 0.1 4.3
Paraguay g 2007 32.4 44.6 23.1 8.52008 33.6 44.9 24.5 9.72009 35.0 46.3 25.8 12.42010 36.6 48.1 26.0 13.72011 38.0 49.2 25.5 17.3
Peru h 2007 35.5 49.1 26.1 20.12008 43.2 54.5 37.3 26.52009 50.7 61.5 46.4 38.42010 53.8 63.9 50.9 41.12011 55.5 65.4 52.0 49.2
Uruguay 2007 95.7 97.7 91.1 96.42008 95.7 97.5 91.5 95.82009 95.8 97.7 91.3 96.62010 96.6 98.4 92.1 97.52011 97.0 98.6 92.7 97.4
Source: Economic Commission for Latin America and the Caribbean (ECLAC) and International Labour Organization (ILO), estimates on the basis of official information from household surveys conducted in the respective countries.
a Data from 31 urban agglomerations, corresponding to the third quarter, with the exception of 2007, which correspond to the fourth quarter.b Data corresponding to the national household survey conducted each year in September. In 2010 this survey was not conducted because there was a population census.c National Socioeconomic Survey (CASEN). d The data are for the second quarter and correspond to municipal seats in the Major Integrated Household Survey (GEIH).e Since 2007, the working age population has been defined as 16 years or age and older.f The data correspond to the second quarter of the National Occupation and Employment Survey (ENOE). g The data correspond to the period between October and December of the Permanent Household Survey.h The data come the National Household Survey (ENAHO).

28 ECLAC / ILONumber 8
Table II.A-4LATIN AMERICA (SELECTED COUNTRIES): URBAN EMPLOYED POPULATION WITH RIGHT TO A PENSION,
BY STATUS IN EMPLOYMENT, 2007-2011(Percentages)
Country Year Total Wage workersOwn-account and unpaid
family workersDomestic workers
Argentina a 2007 49.1 70.1 0.0 12.9
2008 48.9 66.2 0.0 15.8
2009 50.7 71.9 0.0 20.8
2010 51.8 72.4 0.0 22.0
2011 53.0 78.1 0.0 19.7
Brazil b 2007 62.2 78.1 37.8 37.4
2008 63.3 78.8 38.5 38.1
2009 64.5 80.3 39.5 38.9
----- ----- ----- ----- -----
2011 68.8 83.2 42.3 43.7
Chile c 2006 66.5 82.8 25.6 42.6
----- ----- ----- ----- -----
----- ----- ----- ----- -----
2009 64.4 78.2 27.7 40.1
----- ----- ----- ----- -----
2011 69.9 86.0 23.4 49.8
Colombia d 2007 37.5 61.2 12.1 13.7
2008 38.8 67.8 13.8 15.3
2009 37.3 66.9 13.1 13.4
2010 38.2 68.5 13.9 14.0
2011 37.9 68.1 13.5 14.3
Mexico e 2007 42.9 61.6 2.0 1.6
2008 42.2 60.7 1.9 1.7
----- ----- ----- ----- -----
----- ----- ----- ----- -----
----- ----- ----- ----- -----
Paraguay f 2007 21.1 37.8 2.3 2.1
2008 21.7 38.7 1.4 0.6
2009 24.8 40.9 6.4 0.6
2010 24.3 42.5 0.0 0.0
2011 26.6 44.6 1.2 0.1
Peru g 2007 33.8 51.0 20.5 9.9
2008 34.3 51.1 20.5 7.6
2009 37.1 54.7 22.7 8.5
2010 37.7 55.2 23.8 10.2
2011 38.7 57.3 22.1 10.0
Uruguay 2007 65.6 83.5 32.7 41.9
2008 67.5 84.7 35.5 42.4
2009 68.2 85.4 35.2 43.6
2010 70.2 87.1 36.0 46.8
2011 72.9 88.4 38.6 50.4
Source: Economic Commission for Latin America and the Caribbean (ECLAC) and International Labour Organization (ILO), estimates on the basis of official information from household surveys conducted in the respective countries.
a Data from 31 urban agglomerations, corresponding to the third quarter, with the exception of 2007, which correspond to the fourth quarter.b Data corresponding to the national household survey conducted each year in September. In 2010 this survey was not conducted because there was a population census.c National Socioeconomic Survey (CASEN).d The data are for the second quarter and correspond to municipal seats in the Major Integrated Household Survey (GEIH).e The data correspond to the second quarter of the National Occupation and Employment Survey (ENOE). f The data correspond to the period between October and December of the Permanent Household Survey.g The data come the National Household Survey (ENAHO).

ECLAC / ILO
The employment situation in Latin America and the Caribbean
As discussed in this report, the labour market posted a positive performance in Latin America and the Caribbean in 2012, despite a global context that was not particularly conducive to growth and development in the region. Although the gains were, generally speaking, quite modest, the region’s falling unemployment rate, rising numbers of formal jobs, climbing real average wages, declining underemployment and narrowing gender gaps in labour market participation, employment and unemployment all speak of fresh progress as regards working conditions in the region.
These improvements are significant because they encompass not only the number of jobs, but also job quality, which is a key factor in raising living standards and achieving lasting poverty reduction. Fourteen years ago, ILO put forward the concept of “decent work” as a framework for promoting quality employment. Many of the region’s countries are monitoring progress in this regard by pursuing initiatives to measure the various dimensions that comprise decent work. This report examines the progress to date in building information systems on decent work and discusses pending challenges.
May 2013Number 8
Advances and challenges in measuring decent work