whats inside the growth curve?
TRANSCRIPT

Leveraging Operations
in a Complex and Chaotic World
Co-created by 118 Practitioners
SHRIDHAR LOLLA
THE
Path DOSSIER FOR CO-CREATORS Inside the Growth Curve
Chapter from the Book

The Path
Leveraging Operations
In a Complex and Chaotic World
SHRIDHAR
LOLLA
The Path
Copyrights © Shridhar Lolla 2013
First Printing, 2013
ISBN-10: 1482759144
ISBN-13: 978-1482759143
All rights reserved. This book or any portion thereof may not be reproduced or used in any manner whatsoever without the express
written permission of the publisher.
Published by Shridhar Lolla #2304, Nandi Park, Gottigere
Bannergatta Road, Bangalore- 560 083
INDIA E mail: [email protected]
The Book is a work of fiction based on the experience of the Author.
The names, characters, dates and places used in the Book are fictional and any resemblance to reality is purely coincidental. The Book also
contains information that might seem prescriptive in nature. The Author
can't assume any responsibility for the validity of all the materials or consequence of their use. The Author has attempted to trace the
copyright holders of materials reproduced in this publication and
apologize to copyright holders if permission to publish in this form has
not been obtained. If any copyright material has not been acknowledged please write and let him know so he may rectify in any further reprint.
Trademark Notice: Product or corporate names may be trademarks or registered trademarks, and are used only for identification and
explanation without intent to infringe.


1
INSIDE THE GROWTH CURVE Increasingly it is being felt that a vast majority of organizations has huge
hidden capacity, and a good process of improvement could help in achieving
more on the existing resources quickly, without taking too much risk and
incurring costly trade-offs. Let’s dwell on this aspect by getting inside the
growth curve.
Case studies as well as popular non-fiction management books on business
transformation often depict significant improvement in organizational performance as given in Figure A2-1. Of course, such a growth curve would
be an abstraction of the claimed growth over a reasonably long horizon of
time.
Time
Perf
orm
ance
Linear Growth Curve
Figure A2-1 Highest level of abstraction for representing growth
Subsequently, an algorithmic methodology of excellence is explained and a step by step growth of the organization is presented, which would look like Figure A2-2. It would give the impression that the growth is so systematic and
achieved perfectly as per design and plan.
2
Time
Perf
orm
ance
Stepwise Growth Curve
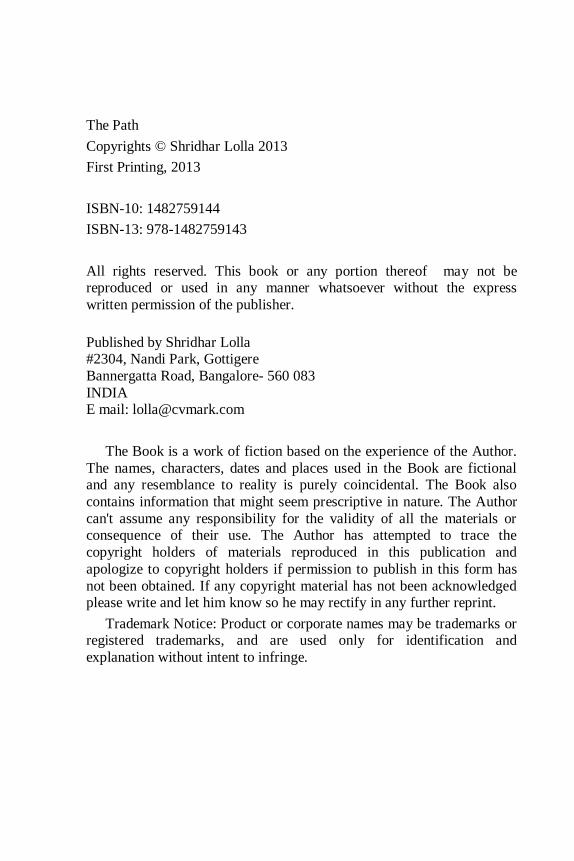
Figure A2-2 Most often stepwise growth of an organization is shown as if the growth follows a systematic, by design, a well planned approach
However, a vast majority of managers are used to commit their efforts to a
growth curve, as given in Figure A2-3.
Time
Perf
orm
ance
Saturating Exponential Growth Curve
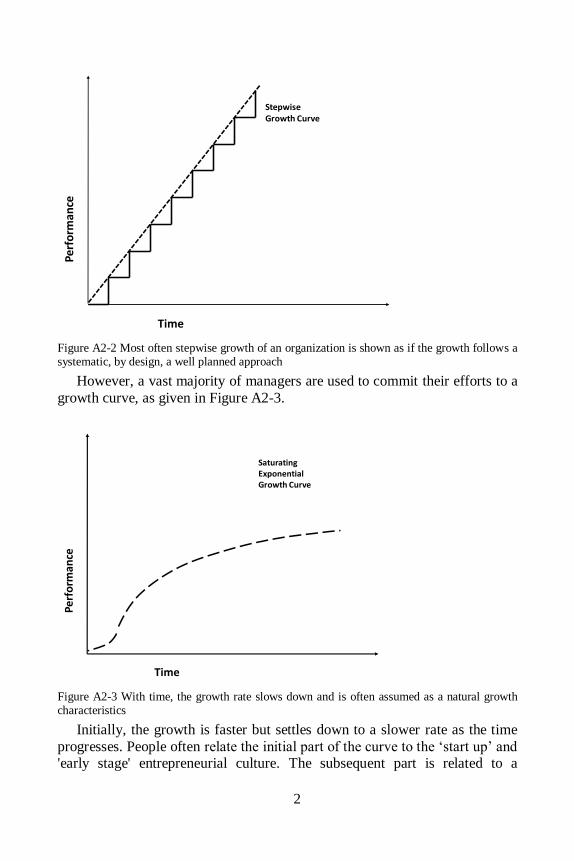
Figure A2-3 With time, the growth rate slows down and is often assumed as a natural growth characteristics
Initially, the growth is faster but settles down to a slower rate as the time
progresses. People often relate the initial part of the curve to the ‘start up’ and 'early stage' entrepreneurial culture. The subsequent part is related to a
3
matured organization, with well laid out structures and procedures. There is a
belief that this is a natural phenomenon. In fact, this assumption is also supported by physical phenomenon of saturation, which exists in the material
world. Think about growth of human body with age, saturation of a solution
with the quantity of solute or change in magnetic field of an electromagnet with current.
However, growth specialists often question sustainability of this pattern of organizational growth, since organizations are living entities, and are resilient
enough to jump out of saturation. Actually, organizations are started up with
an intention to live longer than one human generation.
Some organizations understand the danger of stagnating growth and
initiate actions well in time. For example, if the challenges in business environment cause significant fluctuation in input cost, employee retention,
price etc, it is imperative that an organization must improve its performance
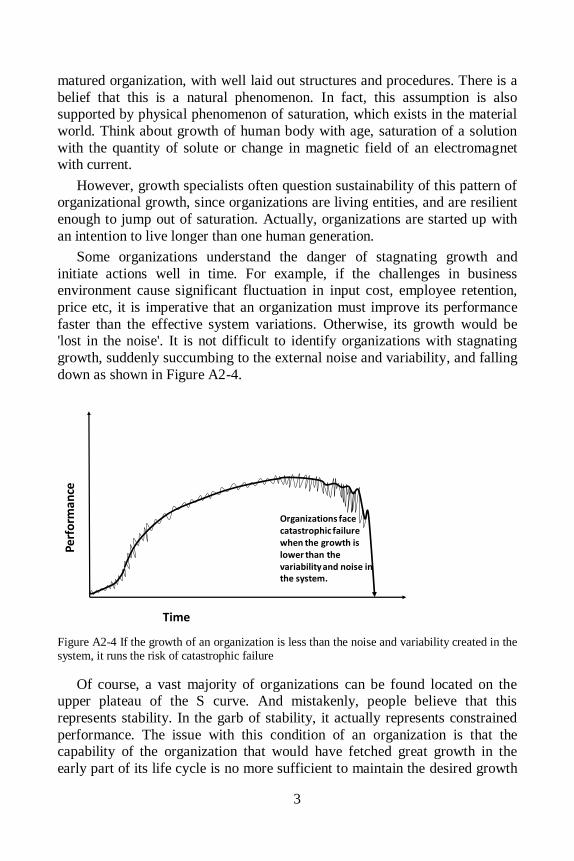
faster than the effective system variations. Otherwise, its growth would be 'lost in the noise'. It is not difficult to identify organizations with stagnating
growth, suddenly succumbing to the external noise and variability, and falling
down as shown in Figure A2-4.
Time
Perf
orm
ance
Organizations face catastrophic failure when the growth is lower than the variability and noise in the system.
Figure A2-4 If the growth of an organization is less than the noise and variability created in the system, it runs the risk of catastrophic failure
Of course, a vast majority of organizations can be found located on the upper plateau of the S curve. And mistakenly, people believe that this
represents stability. In the garb of stability, it actually represents constrained
performance. The issue with this condition of an organization is that the capability of the organization that would have fetched great growth in the
early part of its life cycle is no more sufficient to maintain the desired growth

4
trajectory. It is wise to assume that some big constraint prevents the
organization from growing. And it is this aspect that makes progressive organizations focus on managing the constraint better and improving its
performance.
Actually, if you look at the growth curve of successful organizations that are built to transform, you would find that the growth curve is more of an
upward exponential nature, Figure A2-5. Just do internet download of past 15-20 years data of companies like GE, Microsoft, Google, Shell, Infosys,
TISCO, ABB, IKEA, Pfizer, GSK etc., to validate that it is indeed so.
Time
Perf
orm
ance
Exponential Growth Curve
Figure A2-5 A progressive organization actually has an exponential growth curve
Of course, every entrepreneur and business chief aims to follow on this
curve of exponential growth. However, this curve is also an abstraction of an ever flourishing company over a long horizon. And it is important to further
understand the underlying construct of this characteristic.
Because an organization has high ambition but operates under limited resource environment (including management attention), prudent
organizations take up limited growth initiatives at a given moment. So an initiative that is started today, actually would have an S curve in terms of its
contribution to the organization’s growth. The top tapered part of the S curve
actually shows the maturity or stability or institutionalization of the new ways
of doing things, for that particular single initiative. The responsibility of the organization is to see that this stability is built and strengthened, by an
ongoing process that institutionalizes the new rules. The institutionalization of
the new rules emanating from any improvement initiative must get into the culture of the organization. Once the new culture is built, it consolidates
performance into a strong base. Now, the next improvement initiative, much

5
larger than the previous one, can be built on this strong base, without allowing
the organization to slide down on its growth curve, Figure A2-6.
Time
Pe
rfo
rman
ce
Growth due to improvement-1
Growth due to improvement-2 on the base-1
Base created by improvement-1
Base under formation by improvement-2
Figure A2-6 The S curve is the fundamental element of organizational growth. Each S curve builds a stronger base for further growth, as the rules of the initiative are institutionalized.
Often organizations try to start too many initiatives when those in hand are mid way or waiting to be stabilized. This only has the undesired effect of not
realizing enough benefits of the existing improvement initiative, as it leads to creation of immature base. Often, it leads to conflicting interactions between
different initiatives, which jeopardize the prospects of most of the initiatives.
It is estimated that a vast majority of failures of such improvement initiatives
is linked to running too many of them at once than the organization can manage. We have too often heard of ‘growth taking precedence over
organizational capability’ leading to collapse of businesses.
For an organization to grow on an ongoing basis without sliding down dramatically, it is important that it continues to build the base (stability)
bigger with just the few initiatives and builds new initiatives on the ever more solid base.
Therefore, when a series of growth initiatives is built on previous base, the concatenation transforms the growth curve of the organization into an
exponential curve, with distinct build up of the base, as shown in Figure A2-7.

6
Time
Perf
orm
ance
The underlying phenomenon of building exponential growth
Figure A2-7 Concatenation of growth curves leads to exponential growth
A better representation of such a growth curve is as shown in Figure A2-8, where every new growth is achieved on a higher and stronger base.
Time
Perf
orm
ance
Exponential Growth Curve
The base created by successive improvements
Figure A2-8 The natural growth curve of progressive organizations is an exponential curve with distinct build up of base or shoulder, on which successive growth is built.
This curve is also important for the change agents to acknowledge that
every claim of a new initiative offering significant benefit is built only on the shoulders of giants (strong base provided by the previous good initiatives).

7
The underlying construct (S-curve) of the exponential growth curve has
next level of details.
Each level of growth or improvement does not follow a smooth S curve,
but within each S curve, there is a process of iterative maturity to build the base (stability). This phenomenon is well detailed in TQM (Total Quality
Management [20]).
Any particular object or system taken for improvement, passes through a series of cyclical progression, and gradually builds along concept, actions and
standardization. Each iteration of the cycle is called a PDCA cycle (Plan, Do, Check and Act cycle). As an initiative moves from one PDCA cycle to the
next one, it moves from initial concept levels to standardization of operating
procedures. It then becomes the way of life for the organization, which is analogous to building a stronger base, as shown in Figure A2-9.
This process of iterative progression in seeking improvement through small but significant initiative is fundamental to the culture of TQM. And
Terra Pharma’s team (the organization described in the Path) entered this
level of behavior in their quest for excellence. The behavior of following a process of ongoing improvement was embedded in its DNA, and thus created
a long term and decisive competitive edge that was hard for its competitors to
perceive and replicate.
P
P
P
P
D
D
D
D
C
C
C
C
A
A
A
A
StandardizationInstitutionalizationBuilding Stronger base
Pe
rfo
rma
nce
S curve of a single initiative
Time
Figure A2-9 The DNA of exponential growth is built iteratively in cyclic progression within each improvement initiative
This is the way, the growth curve of a progressive organization shapes up into an exponential curve.
For those who have spent reasonably long time in the process of ongoing improvement in any organization, the growth curve would consist of a number
of iterations and loops, crisscrossing each other, as shown in the Figure A2-
10; and they would acknowledge that it is never smooth.

8
Time
Perf
orm
ance
An operational reality of Exponential Growth Curve
Figure A2-10 The actual operational growth curve of a progressive organization
We do see this pattern of growth in Terra Pharma, Figure A2-11. There were moments of dip in performance as obstacles and constraints popped up
during Life2.0 (the transformation at Terra Pharma). The disruptions to the
flow in business are inevitable but it is the ability to figure out the way of dealing with them keeps an organization on the path of sustainable growth.
The Operating System
Hesitation to Improvements
Start Implementation
Grasping Problem
Direction to Solution
SystemDesign
Setting War room
Align Suppliers Poor
Behavior
Understanding Business
Identifying the Core
Improving Measurement
Purpose
Identifying Weakest link
Leveraging Weakest Link
Setting OperationalImprovement Targets
Blame Game
Vicious Cycle
Raw material Stock outs
Failing in Purpose
Irrational Measurement
Leadership @ work
RightBehavior
PeopleAttrition
New Business Model
Time
Gro
wth
Figure A2-11 The pathway of Terra Pharma during Life2.0

1
The Path Copyrights © Shridhar Lolla 2013 [email protected]
To achieve sustainable growth amidst increasingly complex and
chaotic business environment an organization must figure out
its own path to leverage operations
An action oriented Business Novel presenting a blow by blow account of
a forward looking organization on how it builds the culture of
Operational Excellence. And in doing so, it provides
a business solution to one of the biggest evils of
today’s world.