weekly commentary - westpac weekly commentary | 24 april 2017 | 3 nz housing activity 0 2 4 6 8 10...
TRANSCRIPT
WESTPAC WEEKLY COMMENTARY | 24 April 2017 | 1
Weekly Commentary24 April 2017
Inflation at its highest level since 2011There has been a marked turnaround in New Zealand’s inflation environment in recent months. After lingering below the Reserve Bank’s 1 to 3% target band for much of the past two years, inflation jumped higher in the March quarter, with the annual rate climbing to 2.2%. This is the first time that inflation has been above the Reserve Bank’s 2% target midpoint since September 2011.
Underlying much of the pick-up in inflation have been two big factors. First, the early part of 2017 saw strong increases in the prices of some fresh produce, such as apples and carrots. Those increases were related in part to climatic conditions. And with poor weather continuing in March and April, we're likely to see some further weather impacts on prices in the June quarter also. Nevertheless, this still represents only a temporary boost to inflation.
Second, petrol prices have risen over the past year in response to higher global oil prices, and they are currently around 12% higher than this time last year.
Both food and fuel prices can be volatile, with factors unrelated to the strength of domestic economy causing sharp swings (such as unseasonable weather conditions). However, even outside of these categories we’ve been seeing a firming in New Zealand’s inflation environment. That’s been reflected in the various measures of core inflation which track the underlying trend in price movements, and which have been rising steadily since mid-2016.
On top of this, there were a number of import-heavy areas – clothing, used cars, electronic goods – where prices didn’t fall as much as expected in March. This could be a sign that firm domestic demand combined with a fall in import prices is allowing retailers to rebuild their margins. Recent business surveys have shown that retailers have
become more optimistic about their ability to raise prices. If that’s the case, it could mean a bit more persistence in the inflation outlook than we previously thought.
Following the stronger than anticipated March quarter result, we now expect that inflation will remain around 2% through the remainder of 2017. That's a markedly stronger outlook for inflation than the Reserve Bank was expecting back in February when it released its latest set of projections. That will go a long way in terms of removing downside risks for inflation expectations, which had been a major bugbear for the RBNZ in recent years. It will also reinforce the outlook for wage inflation over the coming year, with higher costs of living adjustments and firm domestic activity expected to boost wage claims through 2017 and 2018.
In February, the Reserve Bank’s projections assumed that the Official Cash Rate would remain on hold until 2019. But with inflation already at levels that the RBNZ wasn’t expecting to see for another three years, it now seems unlikely that they will hold off on hikes for that long. We had previously pencilled in the first OCR hike for early 2019, which is on the later side of the range of market forecasts. But that timing will be under review in coming weeks, as part of a broader review of our forecasts.
We still expect that the OCR will be adjusted at a fairly gradual pace. Much of the recent pickup in inflation has

WESTPAC WEEKLY COMMENTARY | 24 April 2017 | 2
For borrowers with a deposit of 20% or more, the best value lies in the two-year rate or shorter terms. Three- to five-year rates seem high relative to where we think short-term rates are going to go over that time. That said, these rates are most likely to be pressured higher by global market trends, so borrowers who prefer the security of a longer term still have a chance to lock in at historically quite low levels.
Floating mortgage rates usually work out to be more expensive for borrowers than short-term fixed rates such as the six-month rate. However, floating may still be the preferred option for those who require flexibility in their repayments.
NZ interest rates
1.8
2.0
2.2
2.4
2.6
2.8
3.0
3.2
3.4
3.6
3.8
1.8
2.0
2.2
2.4
2.6
2.8
3.0
3.2
3.4
3.6
3.8
90 d
ays
180
days
1yr s
wap
2yr s
wap
3yr s
wap
4yr s
wap
5yr s
wap
7yr s
wap
10yr
sw
ap
%%
18-Apr-17
24-Apr-17
Fixed vs Floating for mortgages
been due to temporary factors, with the impact of recent weather related food price increases and last year’s petrol price gains set to fade over time.
What matters for the RBNZ is whether there are signs of a sustained lift in medium term inflation pressures. And that will require an extended period of strong domestic activity. It’s true that we have seen some positive signs in terms of domestic activity. But there are a couple of important things to keep in mind. First, New Zealand’s population is currently growing at some of the fastest rates we’ve seen since the 1970s. That alone should mean that we see firmer growth. It also means that we have a greater capacity to grow without a significant increases in inflationary pressures.
Next, and importantly for the RBNZ’s policy stance, much of the strength that we’ve seen in both economic activity and inflation has been underpinned by earlier reductions in interest rates. But the argument runs in both directions: earlier interest rate hikes could see the momentum in activity and inflation fading quickly. In fact, we’ve already seen the housing market cooling in response to the lift in longer-term interest rates since late 2016.
This means that to ensure there is enough momentum in activity to generate the lift in inflation that they are looking for, the RBNZ will need to keep the OCR at low levels for some time yet. The RBNZ will also be wary of adding to the upside pressure on the NZ dollar.
Inflation at its highest level since 2011 continued
0
1
2
3
4
5
6
0
1
2
3
4
5
6
2003 2005 2007 2009 2011 2013 2015 2017
%yr%yr
TotalExcluding fuel
Source: Stats NZ
CPI inflation

WESTPAC WEEKLY COMMENTARY | 24 April 2017 | 3
NZ housing activity
0
2
4
6
8
10
12
0
500
1,000
1,500
2,000
2,500
3,000
3,500
2000 2002 2004 2006 2008 2010 2012 2014 2016
Building consents (lhs)
House sales (rhs)Sources: Stats NZ, REINZ
consents sales 000
NZ housing activity
Contributions 2017Q1 CPI forecastsContributions 2017Q1 CPI forecasts
-0.08-0.06
-0.05-0.03
0.06
0.07
0.07
0.12
0.14
0.160.20
-0.2 -0.1 0.0 0.1 0.2 0.3
Clothing
Fruit & veg
Houshold contents
Communications
Recreation
Food ex fruit & veg
Alcohol & tobacco
Education
Health
Housing
Transport
ppt contrib. to the quarter
Sources: ABS, Westpac Economics
Import & export goods pricesImport & export goods prices
40
60
80
100
120
140
Dec-92 Dec-98 Dec-04 Dec-10 Dec-16-40
-20
0
20
40
60index % ann
Export price index (rhs)Import price index (rhs)Terms of trade, goods (lhs)
Sources: ABS, Westpac Economics
fc/s
NZ business confidence and inflation expectations
1.0
1.5
2.0
2.5
3.0
3.5
4.0
4.5
5.0
-80
-60
-40
-20
0
20
40
60
80
100
1996 1998 2000 2002 2004 2006 2008 2010 2012 2014 2016
Business confidence (left axis)
Inflation expectations (right axis)
Source: ANZ
net % %
NZ business confidence and inflation expectations
NZ Mar building consentsApr 28, Last: 14.0%, Westpac f/c: -4%
– Residential dwelling consent issuance rebounded in February, rising 14%. That followed a small rise in January and some large falls in late 2016.
– Much of February’s increase was centred on Auckland, where despite a growing housing shortage, consent issuance in recent months had been subdued. However, with the Unitary Plan having now cleared many legal hurdles, construction activity appears to be lifting. We’ve also seen gains in other regions, with the notable exception of Canterbury.
– With much of February’s rebound related to multi-unit consents, which can be lumpy on a month-to-month basis, we expect to see some easing in issuance in March. However, smoothing through such volatility, the general trend in issuance is expected to remain positive over the coming months.
Aus Q1 import price indexApr 27, Last: 0.2%, WBC f/c: –0.4% Mkt f/c: -0.5%, Range: -1.0% to 1.0%
– In the March quarter, the price of imported goods most likely edged lower, down a forecast 0.4%. This continues the downward trend of late, to have prices 2% below the level of a year ago.
– Import prices weakened over the past year largely because of the partial rebound in the Australian dollar.
– In Q1, the Australian dollar appreciated by almost 2% on a TWI basis to be about 7% higher than a year ago. However, higher energy prices in the period will provide a partial offset to the dampening impact of the stronger currency. Gasoline price rose by around 10% in the opening quarter of 2017, extending the rebound since mid-2016.
NZ Apr business confidenceApr 28, Last: 11.3
– Business confidence declined in March. However, activity indicators showed that firms remained upbeat in terms of their own economic prospects, which is indicative of the strong growth potential in 2017. We’d expect this positive sentiment to continue into Q2. Export intentions demonstrated the greatest jump in optimism from February to March. Last month sentiment around construction pulled back, so we’ll be watching to see whether this is sustained.
– Annual inflation jumped to 2.2% in Q1, the first time since 2011 that inflation has been above 2%. The rise was driven by food and fuel price inflation, which are expected to be transitory. In light of this, the survey’s pricing gauges will give an indication of the underlying inflation pulse in the economy and firms’ willingness to raise prices going forward.
Aus Q1 Consumer Price Index Apr 26, Last: 0.5%, WBC f/c: 0.6% Mkt f/c: 0.6%, Range: 0.3% to 0.8%
– The Q4 CPI printed 0.5% compared to Westpac’s forecast for 0.7%. The December quarter presented a clearly softer inflation profile compared to the more mixed results from the September quarter. Early signs of AUD pass-through faded and discounting in the consumer space returned. Westpac’s forecast is 0.6%qtr lifting the annual pace to 2.3%yr from 1.5%yr. March is a seasonally softer quarter with the ABS seasonal factors boosting our seasonally adjusted estimate to 0.8%qtr.
– We are forecasting a reversal in fresh fruit & vegetable prices, further declines in clothing & footwear plus household contents & services while housing costs remain contained. Offsetting is seasonal jump in pharmaceuticals, the bump in auto fuel prices and signs that the energy crisis is feeding into higher utility bills.
The week ahead

WESTPAC WEEKLY COMMENTARY | 24 April 2017 | 4
Commodity prices & export price indexCommodity prices & export price index
-40
-20
0
20
40
60
Dec-92 Dec-98 Dec-04 Dec-10 Dec-16-40
-20
0
20
40
60% ann % ann
Export price index
Commodity prices (AUD)
Sources: ABS, Westpac Economics
fc/s
US GDP outlook: another soft quarterUS GDP outlook: another soft quarter
-6.0
-3.0
0.0
3.0
6.0
9.0
-6.0
-3.0
0.0
3.0
6.0
9.0
1980 1985 1990 1995 2000 2005 2010 2015
%
quarterly growthannual growth
Source: BEA, Westpac Economics
%
f’casts
Benefit growth weighing on compensationBenefit growth weighing on compensation
0
1
2
3
4
5
6
7
8
0
1
2
3
4
5
6
7
8
2002 2004 2006 2008 2010 2012 2014 2016
CompensationWagesBenefits
Sources: CEIC
%yr %yrEmployment Cost Index
Credit: momentum shiftCredit: momentum shift
-10
-5
0
5
10
15
20
25
-10
-5
0
5
10
15
20
25
Feb-03 Feb-06 Feb-09 Feb-12 Feb-15
TotalHousingBusiness
Sources: RBA, Westpac Economics
6 mth % chg, annl’sd 6 mth % chg, annl’sd
RBA easing cycles
Aus Q1 export price indexApr 27, Last: 12.4%, WBC f/c: 6.0% Mkt f/c: 8.0%, Range: 2.5% to 14.0%
– Export prices rebounded over the past year as commodity prices bounced off the lows prevailing early in 2016.
– The export price index rose by a forecast 6% in Q1, with upside risks, to be around 25% higher than a year ago.
– That would still have the export price index around 13% below the peak of late 2011.
– Commodity prices made sizeable gains in the opening quarter of 2017, up 8.5% in AUD terms on the WCFI measure, and posting even stronger gains as measured on the RBA commodity price index.
– The terms of trade for goods, on these estimates, increases by around 6.5% in the quarter to be 28% above a year ago.
US Q1 Employment Cost IndexApr 28, Last: 0.5%, WBC 0.6%
– Last quarter the ECI disappointed again as compensation rose just 0.5% in the quarter to be up 2.2%yr over the year.
– Key in recent quarters has been weakness in benefit growth in the private sector which is being used as an offset against wages growth across many industries.
– Come Q1, a slightly more robust gain is expected in total compensation, circa 0.6%. However, it remains the case that the private sector will continue to mitigate rises in their total labour cost bill.
– In this key measure of household incomes, a pass-through from jobs growth and full employment is yet to be seen.
Aus Mar private sector creditApr 28, Last: 0.3%, WBC f/c: 0.4% Mkt f/c: 0.5%, Range: 0.4% to 0.6%
– Credit to the private sector has begun 2017 on a softer note, weighed down by the volatile business segment. For March, we expect a modest gain of 0.4%, on the heels of a rise of 0.3% in February and a gain of 0.2% in January. By comparison, in 2016, credit grew by an average of 0.5% per month to be 5.6% higher over the year. Business credit expanded by 5.5% in 2016, but has hit a soft spot, continuing the stop-start pattern of late. For March, we expect a small gain on the back of a modest rebound in commercial finance, after business credit fell in both January, -0.4%, and February, -0.1%. Housing credit, boosted by RBA rate cuts in 2016, increased by 0.57% in February and grew by 6.8% annualised over the past three months. A similar result is likely in March, ahead of the dampening impact from tighter regulatory controls.
US Q1 GDPApr 28, Last: 2.1%, WBC 1.6%
– In Q4, US GDP disappointed expectations, coming in at 2.1% annualised. The consumer was solid and residential investment bounced back after a weak six months, but business investment was lacklustre. Had it not been for inventories, the headline outcome would have been sub-trend.
– Come 2017, there were expectations that growth would firm, particularly given the rapid rise of consumer and business confidence. However, partial data points to this not being the case. The market is now forecasting annualised growth only marginally above 1%. We are more positive at 1.6%.
– A softer consumer and still subdued business investment are the key themes. Inventories should subtract. Note that the nowcasts point to risks being greater than normal.
The week ahead

WESTPAC WEEKLY COMMENTARY | 24 April 2017 | 5
Last Market median
Westpac forecast Risk/Comment
Mon 24UK Apr Rightmove house prices 1.3% – – Low supply is offsetting softer demand.US Mar Chicago Fed activity index 0.34 – – Up from –0.2 in Jan, indicating just above trend growth.
Apr Dallas Fed index 16.9 17.5 – Manufacturing conditions remain strong.Fedspeak Kashkari at investment conf. and Q&A on 'too big to fail'.
Tue 25NZ, Aus Public Holiday, ANZAC Day – – – Markets closed. UK Mar public sector borrowing £bn 1.1 – – Deficit to narrow, but softening activity is a headwind.US Feb FHFA house prices 0.0% – – Momentum in housing continues...
Feb S&P/CS home price index 0.86% 0.70% – ... to be maintained...Mar new home sales 6.1% –0.7% – ... with new stock quickly absorbed by the market.Apr consumer confidence index 125.6 123.7 – At very strong levels.Apr Richmond Fed index 22 17 – Manufacturing conditions remain strong.
Wed 26NZ Mar net migration 6000 – – Mth flows firm, ann. migration to remain around record.Aus Q1 CPI 0.5% 0.6% 0.6% The Q4 surprised to the downside & a stronger AUD.
Q1 core CPI (avg RBA measures) 0.4% 0.5% 0.5% Presents downside risks offsetting rising energy costs.Thu 27Aus Q1 import price index 0.2% –0.5% –0.4% Down on stronger AUD, higher oil prices a partial offset.
Q1 export price index 12.4% 8.0% 6.0% Up on commodity prices sharp bounce from recent lows.RBA speak – – – Gov. Lowe speaking at Renminbi Global Cities Dinner.
Chn Mar industrial profits %yr 8.5% – – Industrial sector has benefitted from commodity prices.Eur Apr consumer confidence (final) – – – Consumers remain buoyant...
Apr business climate indicator 0.82 – – ... as do most businesses.ECB policy decision –0.4% – – On hold for foreseeable future.
US Mar wholesale inventories 0.4% 0.3% – Volatility to persist.Mar durable goods orders 1.8% 1.5% – Investment trend remains poor, though g'th is positive.Initial jobless claims 244k – – Remains at historic lows.Mar pending home sales 5.5% –0.5% – A lead on existing sales two months out.Apr Kansas City Fed index 20 – – Strong conditions.
Fri 28NZ Mar building permits 14% – –4% Some moderation after last month's strong gains.
Mar trade balance $m –18 370 370 Boosted by dairy and a recovery in meat exports.Apr ANZ business confidence 11.3 – – Activtity metrics healthy, inflation expectations rising.
Aus Mar private sector credit 0.3% 0.5% 0.4% Softer tone of late, hit by often volatile business segment.Q1 PPI 0.5% 0.7% 0.5% Stronger AUD offsetting impact of rising energy costs.
Eur Mar M3 money supply %yr 4.7% – – Credit data also due.Apr CPI %yr (advance) 1.5% – – Flash estimate; inflation pulled back in March.
UK Apr GfK consumer sentiment –6 – – Rising inflation likely to dampen household sentiment.Q1 GDP (advance) 0.7% – – Manuf/exporting offsetting softer domestic demand.Apr Nationwide house prices –0.3% – – Uncertainty and income squeeze weighing on prices.
US Q1 employment cost index 0.5% 0.6% – Continues to see solid gains; benefits a drag.Q1 GDP (annualised) 2.1% 1.2% – Greater than usual uncertainty for Q1 releaseApr Chicago PMI 57.7 56.9 – Points to robust growth for manufacturers.Apr Uni. of Michigan sentiment 98.0 98.4 – Republican/ Democrat divide persists.Fedspeak – – – Harker on 'How STEM can get you anywhere'.
Sun 30Chn Apr manufacturing PMI 51.8 – – Momentum looks likely to abate...
Apr non–manufacturing PMI 55.1 – – ... in coming months.
Data calendar

WESTPAC WEEKLY COMMENTARY | 24 April 2017 | 6
Economic Forecasts March years Calendar years
% change 2015 2016 2017f 2018f 2015 2016 2017f 2018f
GDP (Production) ann avg 3.4 2.4 3.1 3.3 2.5 3.1 3.2 3.4
Employment 3.2 2.0 5.3 2.1 1.4 5.8 2.3 1.5
Unemployment Rate % s.a. 5.4 5.2 4.9 4.7 4.9 5.2 4.7 4.7
CPI 0.3 0.4 2.0 1.5 0.1 1.3 1.8 2.1
Current Account Balance % of GDP -3.5 -3.1 -2.5 -2.1 -3.4 -2.7 -2.0 -2.7
Financial Forecasts Jun-17 Sep-17 Dec-17 Mar-18 Jun-18 Sep-18
Cash 1.75 1.75 1.75 1.75 1.75 1.75
90 Day bill 2.00 2.00 2.00 2.00 2.00 2.00
2 Year Swap 2.40 2.40 2.40 2.50 2.60 2.70
5 Year Swap 3.00 3.10 3.15 3.25 3.35 3.50
10 Year Bond 3.30 3.50 3.60 3.65 3.75 4.00
NZD/USD 0.69 0.68 0.67 0.66 0.64 0.63
NZD/AUD 0.91 0.91 0.91 0.91 0.92 0.93
NZD/JPY 81.4 80.2 80.4 80.3 79.7 79.4
NZD/EUR 0.66 0.66 0.66 0.66 0.65 0.64
NZD/GBP 0.57 0.57 0.56 0.56 0.54 0.53
TWI 76.2 75.8 75.4 74.9 74.2 73.6
NZ interest rates as at market open on Monday 24 April 2017
Interest Rates Current Two weeks ago One month ago
Cash 1.75% 1.75% 1.75%
30 Days 1.83% 1.88% 1.83%
60 Days 1.89% 1.93% 1.90%
90 Days 1.95% 1.99% 1.98%
2 Year Swap 2.35% 2.27% 2.32%
5 Year Swap 2.90% 2.83% 2.93%
NZ foreign currency mid-rates as at Monday 24 April 2017
Exchange Rates Current Two weeks ago One month ago
NZD/USD 0.7047 0.6936 0.7009
NZD/EUR 0.6513 0.6552 0.6469
NZD/GBP 0.5493 0.5601 0.5617
NZD/JPY 77.86 77.02 77.64
NZD/AUD 0.9302 0.9268 0.9204
TWI 76.67 76.03 76.33
New Zealand forecasts
2 Year Swap and 90 Day Bank Bills
1.80
1.90
2.00
2.10
2.20
2.30
2.40
2.50
2.60
2.70
1.80
1.90
2.00
2.10
2.20
2.30
2.40
2.50
2.60
2.70
Apr-16 Jun-16 Aug-16 Oct-16 Dec-16 Feb-17 Apr-17
90 day bank bill (left axis)
2 year swap (right axis)
NZD/USD and NZD/AUD
0.86
0.88
0.90
0.92
0.94
0.96
0.98
1.00
1.02
0.64
0.66
0.68
0.70
0.72
0.74
0.76
Apr 16 Jun 16 Aug 16 Oct 16 Dec 16 Feb 17 Apr 17
NZD/USD (left axis)
NZD/AUD (right axis)
WESTPAC WEEKLY COMMENTARY | 24 April 2017 | 7
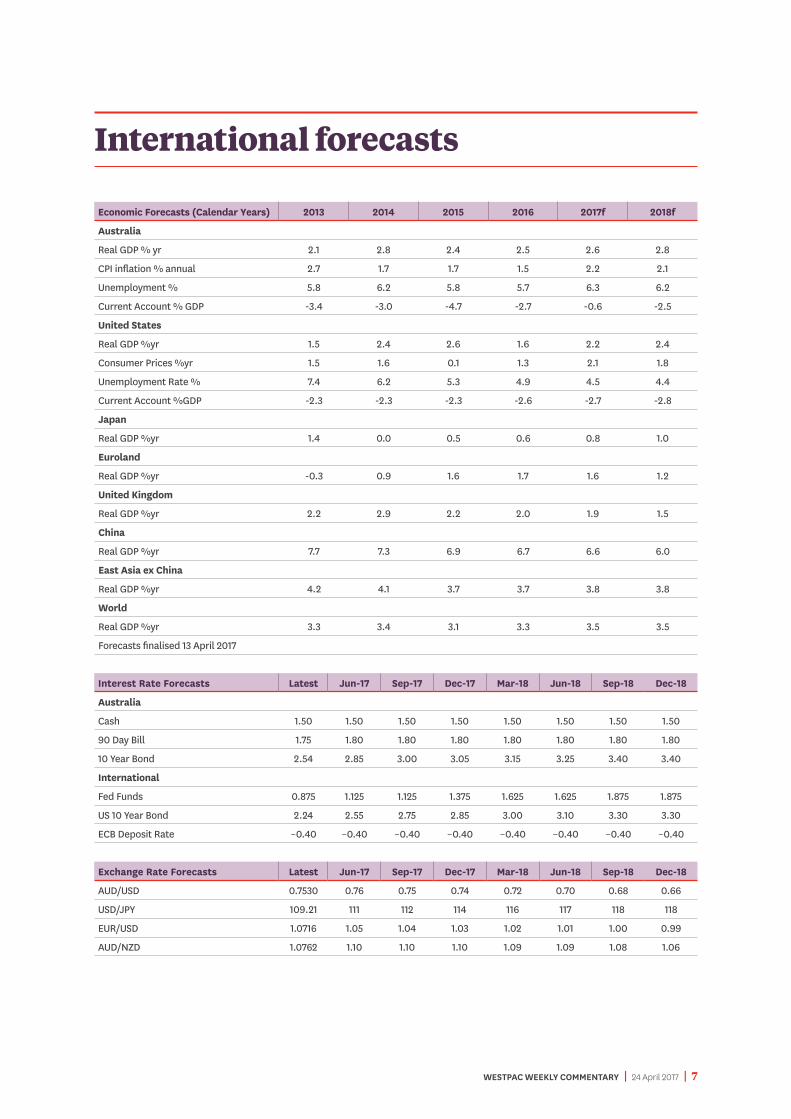
Economic Forecasts (Calendar Years) 2013 2014 2015 2016 2017f 2018f
Australia
Real GDP % yr 2.1 2.8 2.4 2.5 2.6 2.8
CPI inflation % annual 2.7 1.7 1.7 1.5 2.2 2.1
Unemployment % 5.8 6.2 5.8 5.7 6.3 6.2
Current Account % GDP -3.4 -3.0 -4.7 -2.7 -0.6 -2.5
United States
Real GDP %yr 1.5 2.4 2.6 1.6 2.2 2.4
Consumer Prices %yr 1.5 1.6 0.1 1.3 2.1 1.8
Unemployment Rate % 7.4 6.2 5.3 4.9 4.5 4.4
Current Account %GDP -2.3 -2.3 -2.3 -2.6 -2.7 -2.8
Japan
Real GDP %yr 1.4 0.0 0.5 0.6 0.8 1.0
Euroland
Real GDP %yr -0.3 0.9 1.6 1.7 1.6 1.2
United Kingdom
Real GDP %yr 2.2 2.9 2.2 2.0 1.9 1.5
China
Real GDP %yr 7.7 7.3 6.9 6.7 6.6 6.0
East Asia ex China
Real GDP %yr 4.2 4.1 3.7 3.7 3.8 3.8
World
Real GDP %yr 3.3 3.4 3.1 3.3 3.5 3.5
Forecasts finalised 13 April 2017
Interest Rate Forecasts Latest Jun-17 Sep-17 Dec-17 Mar-18 Jun-18 Sep-18 Dec-18
Australia
Cash 1.50 1.50 1.50 1.50 1.50 1.50 1.50 1.50
90 Day Bill 1.75 1.80 1.80 1.80 1.80 1.80 1.80 1.80
10 Year Bond 2.54 2.85 3.00 3.05 3.15 3.25 3.40 3.40
International
Fed Funds 0.875 1.125 1.125 1.375 1.625 1.625 1.875 1.875
US 10 Year Bond 2.24 2.55 2.75 2.85 3.00 3.10 3.30 3.30
ECB Deposit Rate –0.40 –0.40 –0.40 –0.40 –0.40 –0.40 –0.40 –0.40
Exchange Rate Forecasts Latest Jun-17 Sep-17 Dec-17 Mar-18 Jun-18 Sep-18 Dec-18
AUD/USD 0.7530 0.76 0.75 0.74 0.72 0.70 0.68 0.66
USD/JPY 109.21 111 112 114 116 117 118 118
EUR/USD 1.0716 1.05 1.04 1.03 1.02 1.01 1.00 0.99
AUD/NZD 1.0762 1.10 1.10 1.10 1.09 1.09 1.08 1.06
International forecasts

WESTPAC WEEKLY COMMENTARY | 24 April 2017 | 8
Contact the Westpac economics team
Michael Gordon, Acting Chief Economist +64 9 336 5670
Satish Ranchhod, Senior Economist +64 9 336 5668
Sarah Drought, Economist +64 9 336 5696
Any questions email: [email protected]
Past performance is not a reliable indicator of future performance. The forecasts given in this document are predictive in character. Whilst every effort has been taken to ensure that the assumptions on which the forecasts are based are reasonable, the forecasts may be affected by incorrect assumptions or by known or unknown risks and uncertainties. The ultimate outcomes may differ substantially from these forecasts.
Things you should know
Westpac Institutional Bank is a division of Westpac Banking Corporation ABN 33 007 457 141 (‘Westpac’).
Disclaimer
This material contains general commentary, and market colour. The material does not constitute investment advice. Certain types of transactions, including those involving futures, options and high yield securities give rise to substantial risk and are not suitable for all investors. We recommend that you seek your own independent legal or financial advice before proceeding with any investment decision. This information has been prepared without taking account of your objectives, financial situation or needs. This material may contain material provided by third parties. While such material is published with the necessary permission none of Westpac or its related entities accepts any responsibility for the accuracy or completeness of any such material. Although we have made every effort to ensure the information is free from error, none of Westpac or its related entities warrants the accuracy, adequacy or completeness of the information, or otherwise endorses it in any way. Except where contrary to law, Westpac and its related entities intend by this notice to exclude liability for the information. The information is subject to change without notice and none of Westpac or its related entities is under any obligation to update the information or correct any inaccuracy which may become apparent at a later date. The information contained in this material does not constitute an offer, a solicitation of an offer, or an inducement to subscribe for, purchase or sell any financial instrument or to enter a legally binding contract. Past performance is not a reliable indicator of future performance. Whilst every effort has been taken to ensure that the assumptions on which the forecasts are based are reasonable, the forecasts may be affected by incorrect assumptions or by known or unknown risks and uncertainties. The ultimate outcomes may differ substantially from these forecasts.
Country disclosures
Australia: Westpac holds an Australian Financial Services Licence (No. 233714). This material is provided to you solely for your own use and in your capacity as a wholesale client of Westpac.
New Zealand: In New Zealand, Westpac Institutional Bank refers to the brand under which products and services are provided by either Westpac or Westpac New Zealand Limited (“WNZL”). Any product or service made available by WNZL does not represent an offer from Westpac or any of its subsidiaries (other than WNZL). Neither Westpac nor its other subsidiaries guarantee or otherwise support the performance of WNZL in respect of any such product. The current disclosure statements for the New Zealand branch of Westpac and WNZL can be obtained at the internet address www.westpac.co.nz. For further information please refer to the Product Disclosure Statement (available from your Relationship Manager) for any product for which a Product Disclosure Statement is required, or applicable customer agreement. Download the Westpac NZ QFE Group Financial Advisers Act 2008 Disclosure Statement at www.westpac.co.nz.
China, Hong Kong, Singapore and India: This material has been prepared and issued for distribution in Singapore to institutional investors, accredited investors and expert investors (as defined in the applicable Singapore laws and regulations) only. Recipients in Singapore of this material should contact Westpac Singapore Branch in respect of any matters arising from, or in connection with, this material. Westpac Singapore Branch holds a wholesale banking licence and is subject to supervision by the Monetary Authority of Singapore. Westpac Hong Kong Branch holds a banking license and is subject to supervision by the Hong Kong Monetary Authority. Westpac Hong Kong branch also holds a license issued by the Hong Kong Securities and Futures Commission (SFC) for Type 1 and Type 4 regulated activities. This material is intended only to “professional investors” as defined in the Securities and Futures Ordinance and any rules made under that Ordinance. Westpac Shanghai and Beijing Branches hold banking licenses and are subject to supervision by the China Banking Regulatory Commission (CBRC). Westpac Mumbai Branch holds a banking license from Reserve Bank of India (RBI) and subject to regulation and supervision by the RBI.
UK: The contents of this communication, which have been prepared by and are the sole responsibility of Westpac Banking Corporation London and Westpac Europe Limited. Westpac (a) has its principal place of business in the United Kingdom at Camomile Court, 23 Camomile Street, London EC3A 7LL, and is registered at Cardiff in
Disclaimer

WESTPAC WEEKLY COMMENTARY | 24 April 2017 | 9
the UK (as Branch No. BR00106), and (b) authorised and regulated by the Australian Prudential Regulation Authority in Australia. Westpac is authorised in the United Kingdom by the Prudential Regulation Authority. Westpac is subject to regulation by the Financial Conduct Authority and limited regulation by the Prudential Regulation Authority. Details about the extent of our regulation by the Prudential Regulation Authority are available from us on request. Westpac Europe Limited is a company registered in England (number 05660023) and is authorised by the Prudential Regulation Authority and regulated by the Financial Conduct Authority and the Prudential Regulation Authority.
This communication is being made only to and is directed at (a) persons who have professional experience in matters relating to investments who fall within Article 19(5) of the Financial Services and Markets Act 2000 (Financial Promotion) Order 2005 (the “Order”) or (b) high net worth entities, and other persons to whom it may otherwise lawfully be communicated, falling within Article 49(2)(a) to (d) of the Order (all such persons together being referred to as “relevant persons”). Any person who is not a relevant person should not act or rely on this communication or any of its contents. The investments to which this communication relates are only available to and any invitation, offer or agreement to subscribe, purchase or otherwise acquire such investments will be engaged in only with, relevant persons. Any person who is not a relevant person should not act or rely upon this communication or any of its contents. In the same way, the information contained in this communication is intended for “eligible counterparties” and “professional clients” as defined by the rules of the Financial Conduct Authority and is not intended for “retail clients”. With this in mind, Westpac expressly prohibits you from passing on the information in this communication to any third party. In particular this communication and, in each case, any copies thereof may not be taken, transmitted or distributed, directly or indirectly into any restricted jurisdiction. This communication is made in compliance with the Market Abuse Regulation (Regulation(EU) 596/2014).
Investment Recommendations Disclosure
The material may contain investment recommendations, including information recommending an investment strategy. Reasonable steps have been taken to ensure that the material is presented in a clear, accurate and objective manner. Investment Recommendations for Financial Instruments covered by MAR are made in compliance with Article 20 MAR. Westpac does not apply MAR Investment Recommendation requirements to Spot Foreign Exchange which is out of scope for MAR.
Unless otherwise indicated, there are no planned updates to this Investment Recommendation at the time of publication. Westpac has no obligation to update, modify or amend this Investment Recommendation or to notify the recipients of this Investment Recommendation should any information, including opinion, forecast or estimate set out in this Investment Recommendation change or subsequently become inaccurate.
Westpac will from time to time dispose of and acquire financial instruments of companies covered in this Investment Recommendation as principal and act as a market maker or liquidity provider in such financial instruments.
Westpac does not have any proprietary positions in equity shares of issuers that are the subject of an investment recommendation.
Westpac may have provided investment banking services to the issuer in the course of the past 12 months.
Westpac does not permit any issuer to see or comment on any investment recommendation prior to its completion and distribution.
Individuals who produce investment recommendations are not permitted to undertake any transactions in any financial instruments or derivatives in relation to the issuers covered by the investment recommendations they produce.
Westpac has implemented policies and procedures, which are designed to ensure conflicts of interests are managed consistently and appropriately, and to treat clients fairly.
The following arrangements have been adopted for the avoidance and prevention of conflicts in interests associated with the provision of investment recommendations.
(i) Chinese Wall/Cell arrangements;
(ii) physical separation of various Business/Support Units;
(iii) and well defined wall/cell crossing procedures;
(iv) a “need to know” policy;
(v) documented and well defined procedures for dealing with conflicts of interest;
(vi) steps by Compliance to ensure that the Chinese Wall/Cell arrangements remain effective and that such arrangements are adequately monitored.
U.S.: Westpac operates in the United States of America as a federally licensed branch, regulated by the Office of the Comptroller of the Currency. Westpac is also registered with the US Commodity Futures Trading Commission (“CFTC”) as a Swap Dealer, but is neither registered as, or affiliated with, a Futures Commission Merchant registered with the US CFTC. Westpac Capital Markets, LLC (‘WCM’), a wholly-owned subsidiary of Westpac, is a broker-dealer registered under the U.S. Securities Exchange Act of 1934 (‘the Exchange Act’) and member of the Financial Industry Regulatory Authority (‘FINRA’). This communication is provided for distribution to U.S. institutional investors in reliance on the exemption from registration provided by Rule 15a-6 under the Exchange Act and is not subject to all of the independence and disclosure standards applicable to debt research reports prepared for retail investors in the United States. WCM is the U.S. distributor of this communication and accepts responsibility for the contents of this communication. All disclaimers set out with respect to Westpac apply equally to WCM. If you would like to speak to someone regarding any security mentioned herein, please contact WCM on +1 212 389 1269. All disclaimers set out with respect to Westpac apply equally to WCM.
Investing in any non-U.S. securities or related financial instruments mentioned in this communication may present certain risks. The securities of non-U.S. issuers may not be registered with, or be subject to the regulations of, the SEC in the United States. Information on such non-U.S. securities or related financial instruments may be limited. Non-U.S. companies may not subject to audit and reporting standards and regulatory requirements comparable to those in effect in the United States. The value of any investment or income from any securities or related derivative instruments denominated in a currency other than U.S. dollars is subject to exchange rate fluctuations that may have a positive or adverse effect on the value of or income from such securities or related derivative instruments.
The author of this communication is employed by Westpac and is not registered or qualified as a research analyst, representative, or associated person under the rules of FINRA, any other U.S. self-regulatory organisation, or the laws, rules or regulations of any State. Unless otherwise specifically stated, the views expressed herein are solely those of the author and may differ from the information, views or analysis expressed by Westpac and/or its affiliates.
Disclaimer continued