v.p!. petft' ityn; • i - irc · adsorption ratio (sar), soluble sodium percentage (ssp),...
TRANSCRIPT
I15 SUCh 3
the jni t i ;i t s occurspncernint,nti ty, prc-<l environ-stic inter-ly a pointmined no
imro! Petft'; •v .p . iTyn
2 4 1 . 3
8 3 C O
...» -i
7
QMMCN C O M P O S I T I O N CHARACTERISTICS OF F L U O R I D EB E A R I N G G R O U N D W A T E R S
v.v. J A G A N N A D H A S A R M A a n d A . N A R A Y A N A S W A M YDipt of Geophysics. Andhra University, Wattqir - 530003. India
(Received March 13, 1982; revised July 1, 1982)
-Abstract. During routine groundiva'.er surveys of the Visakhapatnam basin, concemra.lic%ns of fluoride ionsabove-the permissible l imit of I to 1.5 nig I" 1 have boen detected near the village Jaggayyapalem. Thefluoride bearing groundvvaters of the area were compared with fluoride bearing groundwaters from differentparts of the world. !t is observed that they contain meager amounts of Ca and Mg and large amounts ofNa and bicarbonate. Linear statistical relationships are obtained between fluoride and Ca plus Mg. andbicarbonate. '
i 1. Introduction '" ' . ' ' ' " .';.V)".T ?
The existence of fluoride in groundwater and its effect on tooth enamel was recognizedaround 1930 (Hem, 1959). It is observed that waters having fluoride ion concentrationof more than 1 mgl" 1 (Handa, 1975) to 1 .5mgl~ ' (Todd, 1959) cause dental defectsand retardation of bone growth. It is also observed (Dregne, 1967) that not only the
••concentration of fluoride in the waters but also the total amount of water consumedc.etermines the effect on health. A detailed investigation regarding the occurrence offlUoride in the groundwater and its relationship with other ions was conducted for a
• -small region, Jaggayyapalem situated in Visakhapatnam basin of Andhra Pradesh Stale;in India. The available data from other parts of the world are also considered in the.present investigation to generalize the characteristics of fluoride bearing groundwaters.
i '.2. Survey Program
A regular survey of the groundwater resources of Visakhapatnam basin of the AndhraPradesh State in India has been carried out by the Geophysics Department of AndhraUniversity since 1974. Groundwater samples from the area are analyzed for Ca, Mg,and Na cations and chloride, bicarbonate, and sulphate anions in the manner prescribedby Taylor (1958). The water samples are also analyzed for fluoride ion using theScott-Sanchis method (World Health Organization, 1958).
3. Results and Discussion
3.1." CONCENTRATION OF VARIOUS IONS
Water samples collected from 11 observation wells near and around Jaggayyapalem'village in Visakhapatnum are observed to contain high amounts of fluoride ions (greater
Wpter. Air. and Soil Pollution 20 (19S3) 29-39. 0049-6979/83/0201-0029501.61Copyright © 19S3 by D. Reidel Publishing Co.. Dordrecht. Holland, and Boston, U.S.A.
I
In;'iI

30 v. v. JAGANNADIIA SARMA AND A. NARAYANA SWAMV
On.
S-7.it
C'O.VIMON
than 1 mgl"').fluoride ion in tlthe results of thtthe 11 observatithe months of Cto represent higlThe ionic conceper liter (mg 1 ~ 'Adsorption Ratnate (RSC) as |observed that thigher conduct!(1979) referred Ilogy of the area
Handa(1975low amounts ofshows the ionicpoints out thatreadily soluble <water has beenfluoride bearing
The areal disis plotted in figrespectively. Frdrop and [HC[Ca 2 ' ] + [Mggives the compi3b. From the Flinear correlatkbetween [F~]
To verify theparts of the wedifferent parts(Follett, 1974)4b present thethe waters meningly these figu[HCO3 ] am[Ca2"] + [Msthose obtainedenvironment fiJaggayyapalenrocks whereas

COMMON COMPOSITION CHARACTERISTICS OF FI-UOR1DE BLARING GROf NDWATERS 31
than 1 mgl"1) . Figure 1 shows the location of the region affected by the existence offluoride ion in the groundwaters with amounts greater than 1 mg 1~ '. Table I presentsthe results of the chemical analyses carried out for the groundwaters collected from allthe 11 observation wells around Jaggayyapalem village in Visakhapatnam basin duringthe months of October 1974 and February 1975. These sampling months are selectedto represent high and low water table conditions from respective rainy and dry periods.The ionic concentrations of the anions and the cations are expressed in both milligramsper liter (mg 1~' ) and milliequivalents per liter (meq 1~'). Table I also presents SodiumAdsorption Ratio (SAR), Soluble Sodium Percentage (SSP), Residual Sodium Carbo-nate (RSC) as given by Eaton (1950) and Electrical Conductivity. From Table I it isobserved that the groundwater samples collected in the wet period (October) showhigher conductivities than the samples from the dry period (February). Sarma et al.(1979) referred to this variation by relating the position of the watertable with hydrogeo-logy of the area.
Handa (1975) has indicated that high fluoride bearing groundwaters generally containlow amounts of Ca and high amounts of bicarbonate. Table I shows this feature. It alsoshows the ionic concentration of Mg2* as low and that of Na* as high. Hem (1959)points out that low concentration of Ca compared to Na may indicate the absence ofreadily soluble Ca minerals or the action of base exchange whereby Ca originally in thewater has been exchanged for Na. This may be the significant feature taking place withfluoride bearing groundwaters.
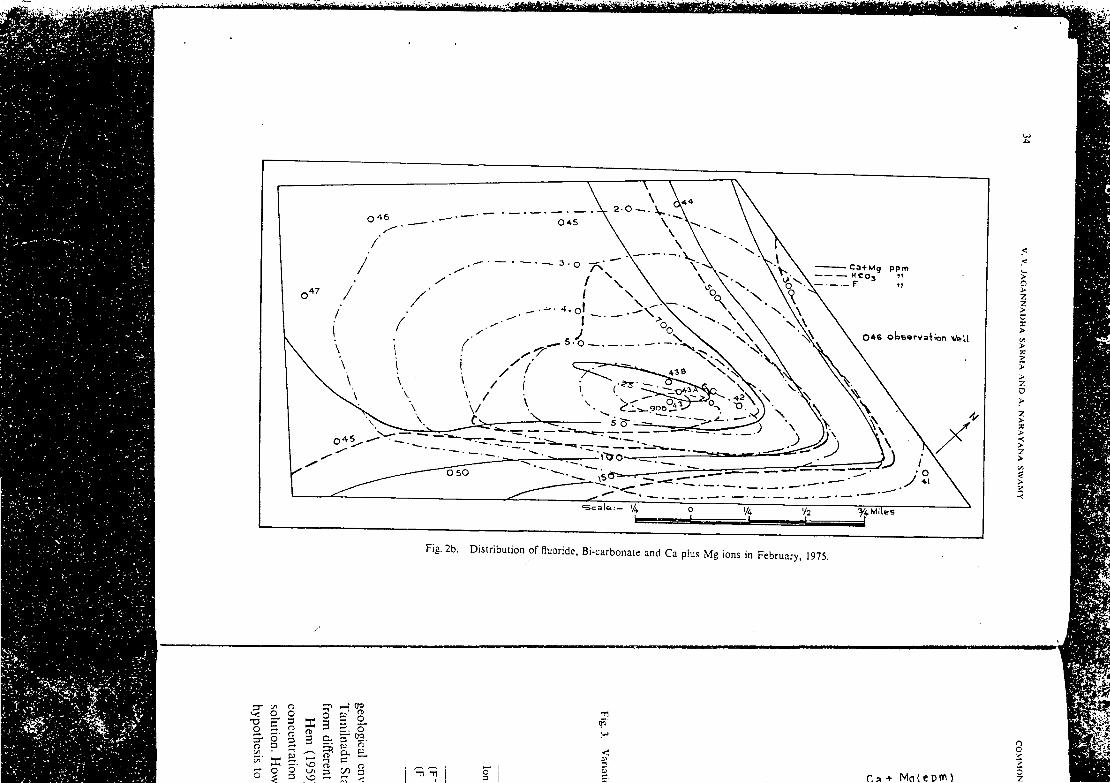
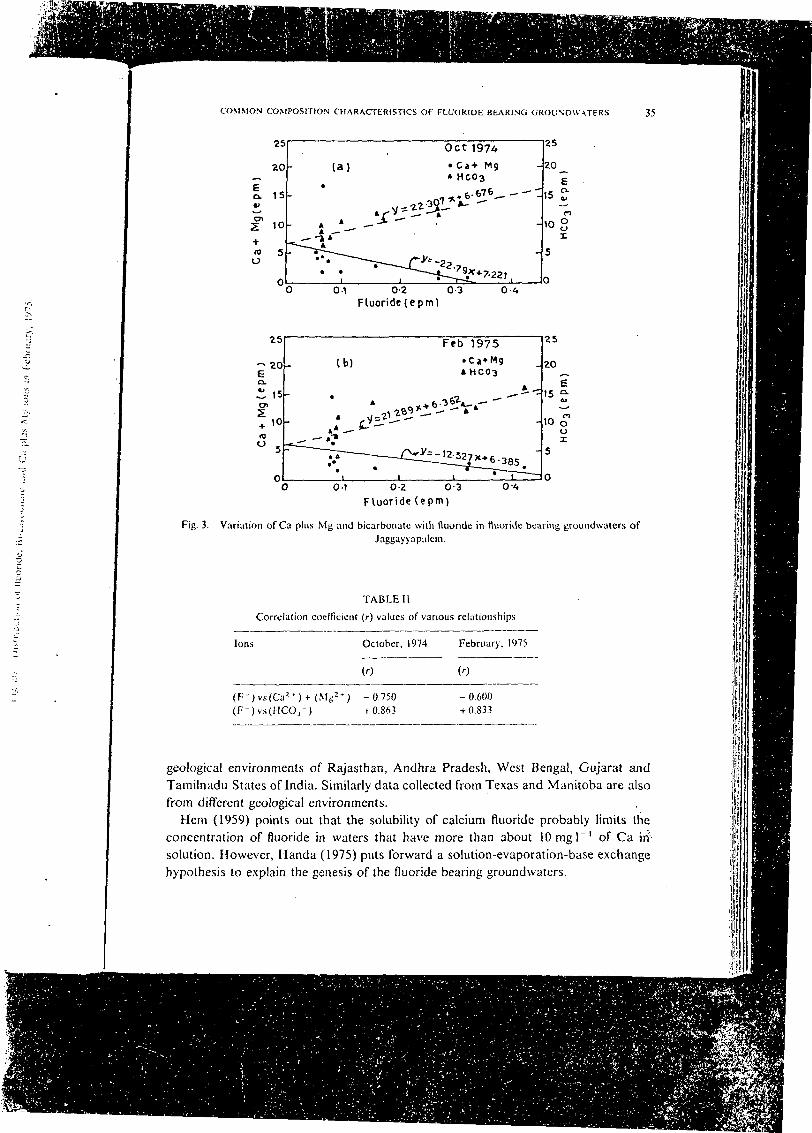
"Hie areal distribution of [Ca2* ] + [Mg2"1 ], [F~], and [HCO3"] in the groundwateris plotted in figures 2a and 2b for the periods of October 1974 and February 1975,respectively. From the figures it can be observed that as [F~ ] rises [Ca2 ' ] + [Mg2 * ]drop and [HCO3~] rises. Figures 3a and 3b show the relation between [ F ~ ] and[Ca2< ] + [Mg2* ], and [HCO3 ] for the wet and dry periods respectively. Table IIgives the computed correlation coefficients for the relationships shown in Figures 3a and3b. From the Figure 3 and Table II it can be concluded that there exists a good negativelinear correlation between [ F ~ ] and [Ca2* ] + [Mg2* ] and positive linear correlationbetween [ F ~ ] and [HCO3"j.
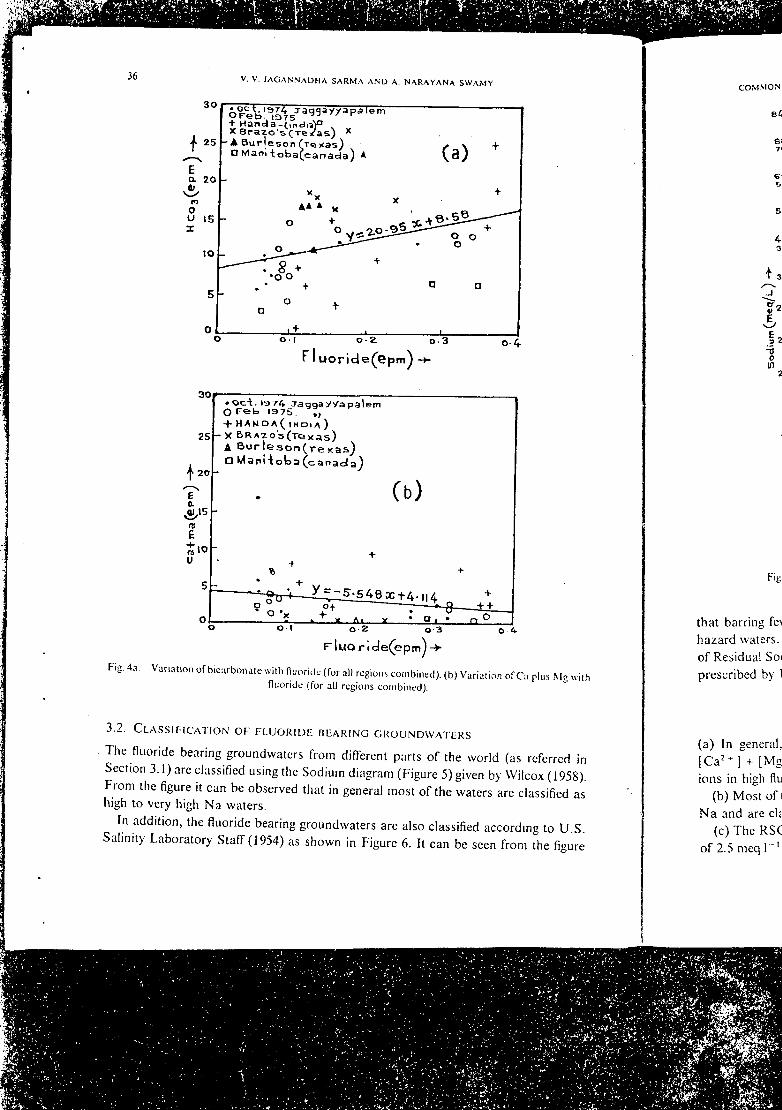
To verify these relationships for fluoride bearing groundwaters belonging to differentparts of the world, the chemical analysis data of fluoride bearing groundwaters fromdifferent parts of India (Handa, 1975), Brazos and Burleson Counties, Texas, U.S.A.(Follett, 1974) and Manitoba, Canada (Charron, 1974) are considered. Figures 4a and4b present the variation of [HCO3~] and [Ca2* ] + [Mg2* ] ions with [F~ ] ion of allthe waters mentioned above along with those belonging to Jaggayyapalem area. Interest-ingly these figures also exhibit linear positive correlation (r = 0.30) between [F" ] and[HCO3~] and a linear negative correlation (r = -0.37) between [ F ~ ] and[Ca2*] + [Mg21"]. The existence of low correlation coefficients when compared tothose obtained for Jaggayyapalem can be explained as due to the differences in geologicalenvironment from which the groundwater samples are collected. In the case of theJaggayyapalem area all of the water samples are collected from the khondalitic suite ofrocks whereas the data presented by Handa (1975) itself were collected from different

TABLE I
Results of chemical analyses of fluoride bearing groundwaters of Jaggayyapalcm, India
Well Conducti-No. vity in
micromhosa t 2 5 ° C
October. 197441 417742 190743 137143 A 112543 B 109644 1 30945 146246 115447 139248 67550 797
February. IV7541 337742 126643 109143A 97543 B 70944 88745 97246 81547 70948 64550 507
mg l~ ' = milligrams
J Sodium adsorption
Chloride
mgl - 1
15003501405665
20521017022060
150
16003601308065
15521017011595
150
XT liier.
ratio =
mcq I"1
42.3009.S703.9481.5511.8335.7805.9234.7946.2041.6924.230
45.12010.1503.6662.2561.8334.3705.9224.7943.2432.6794.230
(Na*
/(Ca: ' ) +
Bicarbonate
mgl- '
390.47330756.4829.6732.04S8.0573.4451.4585.6341.6341.6
244.0744.2976.0805.2799.1414.8671.0457.5549.0512.434 1 .6
meq 1"'
meq I"1
6.402512.004712.404913.605412.00508.00319.40407.40309.60405.60225.6022
4.001512.204816.006013.205013.10506.8030
11.00407.50309.00358.40335.6022
Sulphate
mgl"
17540301515405045406515
20040502015356035356525
- milli equivalents
1 meq I-1
3.64000.83200.62390.31190.31190.83201.03990.93590.83201.35200.3119
4.16000.83201.04000.41600.31190.72801.24SO0.72800.72801.35200.5199
per liter.
Ca
mgl ' 1
884444
321636403248
28S656
40486
1656
———— h Soluble sodium ncrccntace = ———(MiT * )
meq I'1
4.39110.19950.19950.19950.19951.59670.79831.79631.99591.59672.3951
1.39710.39910.29930.25940.29931.99590.19950.39910.29930.79832.7943
N a '-" r * (Ca:* *Mg2*
Mg
m g l - 1
150.831.6
9.79.7
17.053.514.624.329.234.063.2
158.124.320.713.920.760.817.036.535.340.157.2
+ Na * )
meq 1 !
12.39402.59900.79960.79961.39934.39801.19941.99902.39902.79905.1980
12.99001.99901.69901.13941.69904.99801.39902.99902.89903.29904.6980
100
Na
mg 1 " * mcq 1 - '
817.8 35.5570457.9 19.9080367.5 15.9780332.S 14.4690288.7 12.5510198.3 8.6213330.5 14.3680214.8 9.3374281.6 12.245097.8 4.251058.7 2.5513
894.5 38.8900' 478.2 20.7900
430.4 18.7140333.0 14.4780304.8 13.2520112.9 4.9100381.2 16.5750221.4 9.6270224.9 9.7760191.8 8.337065.8 2.8600
Fluoride
mgl ' 1
1.23.05.06.05.01.21.61.41.21.00.6
1.86.08.07.06.0
.6
.8
.6
.6
.6
.2
meq I " 1
0.06320.15790.26320.31580.26320.06320.08420.07370.06320.05260.0316
0.09470.31580.42100.36840.31580.08420.09470.08420.08420.08420.0632
SAR"
12.316.822.620.514.05.0
14.46.88.32.91.3
-14.519.018.717.313.32.6
18.57.47.75.81.5
SSR"
67.987.794.193.588.757.087.871.173.649.225.2
73.089.790.491.286.941.291.273.975.467.127.6
RSC
_9.2
' l l . 412.610.42.07.43.65.2
' 1.2-
-9.8
14.011.211. 15.29.84.15.84.3-
c Residual Sodium Ca bonate =(HCCV)-(Ca-* + Mg2')
( I n all cases ionic concentrations expressed in meq 1 ~ ')

COMMON COMPOSITION CHARACTERISTICS OF FI.UORIDE SHARING GROUNDWATERS 33
o_nco00
<J
2o
z
7.O
271
Fig. 2b. Distribution of fluoride. Bi-carbonate and Ca plus Mg ions in February, 1975.
JIT V) Oc? o o•§ = "£. o
=P H <SI 1 2-d 5. o
. co 2 § (_/^ 3 C/} 3\O «— r* < r. a + Ma ( e p m 5
8oZ
COMMON COMPOSITION CHARACTtRISTlCS OF FLUORIDE BEARING GROUNDWATERS 35
25
20.-,
t ,5V
u»Z 10+n> 50
0 .
Octi974(a ) • Ca-«- Mg
» HC03
• • ^#**---* • ^--^ ^* — — —
-"-d"11*"" — *__^^••7~~~~-~— ___T~J'-- -2
' ' * /"^""-s— *7-22',
25
20 _£
15 £
nlOgI
5
00 0-1 0-2 03 0-4
Fluoride (epm)
25 ————————————————————————————— -
- 206Q.
iL 15
f 1°
5 5
0
Feb 1975(b) .Ca+Mg
»HC03
» fe.-ife^"^ "*'4 cj^***'-' " " * *
4 - — • ^-"
-c^nr' "** *^^7T- ——— ———— JJ:12-527X*6.385 "
* * i * i ~~i~~^ — r~—
za
20£>
15 S'10 o
0X
5
00-1 0-2 0-3
Fluoride ( e p m )0-4
Fig. 3. Variation of Ca plus Mg and bicarbonate with fUioride in fluorUle bearing t;.roundwaters ofJaggayyapalem.
TABLE IICorrelation coefficient (r) values of various relationships
Ions October, 1974 February, 1475
(F- )vs(Ca 2 *)+ (M(F-)vs(MC03-)
-0.750+0.863
- 0.600+ 0.833
geological environments of Rajasthan, Andhra Pradesh, West Bengal, Gujarat andTamilnadu States of India. Similarly data collected from Texas and Manitoba are alsofrom different geological environments.
Hem (1959) points out that the solubility of calcium ftuoride probably limits theconcentration of fluoride in waters that have more than about lOmgl" 1 of Ca insolution. However, Handa (1975) puts forward a solution-evaporation-base exchangehypothesis to explain the genesis of the fluoride bearing groundwaters.
36 v. v. JAGANNADHA SARMA AND
3O • —— -ri —— - —————————————————
A"Ea 204)•^nOU 15X
IO
5
0
OFe^'^^S3"3'393^31''316'"+ Handa-cmdisY3
X Brazo's^re/as) x
- A Burleson (vexas)DMani-tobaCcanada) *
-V*x
A* * X0 +
°J^o.^-*—^^- rr
•o o• 4.• T
n °,->•
O o- 1 0-2C" 1 xr luonde(e
30 —— —————————————————— ———
25
|> 20
T"a,01,15wE+ 10n lo
U
5
00
• oci.1974 jaggayyapalemO Feb 1975 ;,-f. H A H D A ( IMDIA)
- X BRA^o'5(Texas)A Burlesonf rexas)aManUobaQoanada)
V
.
+
• -: ——— -OCTH —— zSvS^e:
D5Tj- ST" ————O 'x 4-? ^ ~ * Ai v
o t a z
A. NARAYANA SWAMY
(a) +
-fy
^s^s^-•2^ O Oo
a a
i
COMMON
&(,
e<7
0 3 o-4
pm)-*-
(b)
+
ct4-n4 .„ *— : —— 8 — i±—• a, • D o
0-3 o 4
F 1 uo r i de(e p m) ->
on of bicarbonate with fluoricle (for all regionsni,^^:.)-. <r,._ _ i i - . . • _ - -
combined), (b) Variation of Ca plus Mg with
C5
5
43
* 3s~**J
" •7
I\^E,3 2
OUl
2
Fig
that barring fevhazard waters.of Residual Sotprescribed by 1
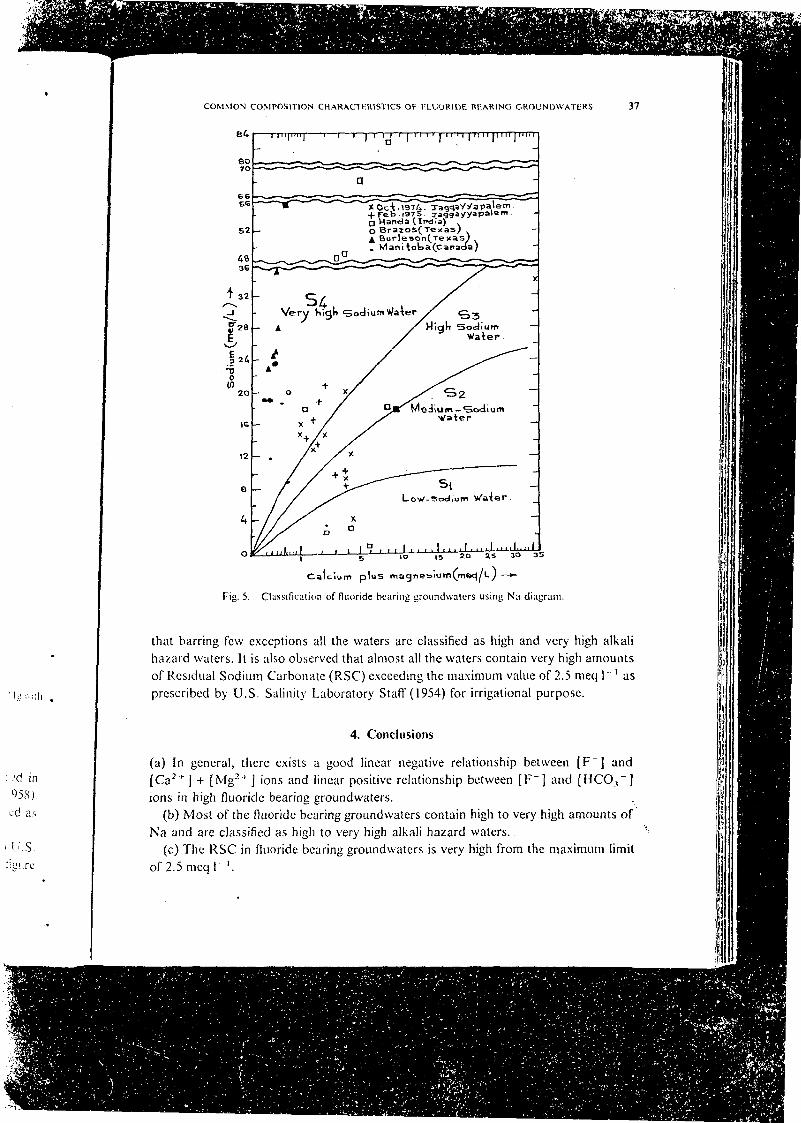
3.2. CLASSIFICATION OF FLUORIDE R E A R I N G GROUNDWATERSThe fluoride bearing groundvvaters from different parts of the world (as referred inSection 3.1) are classified using the Sodium diagram (Figure 5) given by Wilcox (1958).From the figure it can be observed that in general most of the waters are classified ashigh to very high Na waters.
In addition, the fluoride bearing groundvvaters are also classified according to U.S.Salinity Laboratory Staff (1954) as shown in Figure 6. It can be seen from the figure
(a) In general,[ C a 2 * f + [ M gions in high flu
(b) Most of INa and are cla
(c) The RSCof 2.5 meq 1"'.
COMMON COMPOSITION CHARACTT.RISTICS OF I 1.UORIDE BPARING GROUNOWATtRS
eo70
S2
4836
37
aftTJ0in
20
XOc-t.1374. Ta' .1975 ja•eb
O Brazos(Texas)^ Burleson^Texas). Manttot>a(canada)
Very high <5<ydium Water
Calcium plus magnesiom(m«K)/l-/ —*-
Fig. 5. Classification of fluoride bearing groundwatcrs using Na diagram.
that barring few exceptions all the waters are classified as high and very high alkalihazard waters. It is also observed that almost all the waters contain very high amountsof Residual Sodium Carbonate (RSC) exceeding the maximum value of 2.5 meq 1" ' asprescribed by U.S. Salinity Laboratory Staff (1954) for irrigational purpose.
4. Conclusions
(a) In general, there exists a good linear negative relationship between [F~] and[Ca2 "" ] + [Mg2 ' ] ions and linear positive relationship between [F~] and [HCO,~]ions in high fluoride bearing groundwaters.
(b) Most of the fluoride bearing groundwaters contain high to very high amounts ofNa and are classified as high to very high alkali hazard waters.
(c) The RSC in fluoride bearing groundwaters is very high from the maximum limitof 2.5 meq 1 '.

V. V. JAGANNADHA SARMA AND A. NARAYAMA SWAMY
IOO 2 3 * 5 6 8 IOOO 2 3 4 5OOO
CI-S*
~i i i i i r~
. . ,A Fe*bru;ry, 197S. jagg ay/a »*!•"*X Handa(lnrl.i)
C2-S4
CI-S3
CI-S2
C2-S3
C2-S2
r- C I -S I
C2-SI
. X
i i i i
~m i i~o
00
C3- S4
C3-52
C3-SII i i______L
C4-S4
C4-S2
C4- SI
conduct iv i ty mkro mhos/cm(ecxicf)a^ 25 c1
LOW2
MEDIUM3
HIGH4 1VERY HIGH]
Fig. 6.
sal inity h a z a r d
Na (alkali) hazards of fluoride bearing grounduaters of all regions combined.
COMMON CO
One of the authorsof Scientific and Irwork.
Charron.J.F..: 1974, /Waters Directorate
Dregne, H. E.: 1967, ((Regions, Tucson. A
Eaton, F. M : 1950, 5Follett, C. R.: 1974, C
ment Board ReportHanda, B. K..: 1975, (HemJ. D.: 1959, S/M
Water-Supply PapeSarma, V. V. J., Pras:Taylor, F.. W.: 1958,Todd, K. D.: 1959, GUnited States Salinitj
ture Hand Book NV/itcox, L. V.: 1958, -World Health Organ

COMMON COMPOSITION CHARACTERISTICS OF FLUOK1DE BEARING GROUNDWATERS 39
Acknowledgments
One of the authors (ANS) is thankful to the University Grants Commission and Councilof Scientific and Industrial Research for providing financial assistance to carry out thework.
References
Charron, J. E.: 1974, A Hydrogeologkal Study of the Selkirk Area. Manitoba. Scientific Series No. 8, InlandWaters Directorate, Ottawa, Canada.
Dregne, M. E.: 1967, Water Quality Problems Peculiar to Arid Regions. Symposium on Water Supplies for AridRegions, Tucson, Arizona, May 1-2, 1967.
Eaton, F. M.: 1950, Soil. Sci. 69, 123.Follett, C. R.: 1974, Groundwater Resources of Brazos and Burleson Counties. Texas. Texas Water Develop-
ment Board Report 185.Handa, B. K.: 1975, Ground Water 13, 3.Hem, J. D.: 1959, Study and Interpretation of the Chemical Characteristics of Natural Water, U.S. Geol. Survey
Water-Supply Paper 1473.Sarma, V. V. J., Prasad, N. V. B. S. S., and P. Rajendra Prasad: 1979, Jour, of Hydro. 44, 81.Taylor, F.. \V.: 1958, The Examination of Waters and Water Supplies, J and A Churchill Ltd., London.Todd, K. D.: 1959, Grnundwater Hydrology, John Wilcy and Sons, New York, p. 463.United States Salinity Laboratory Staff: 1954, Diagnosis ami Improvement of Saline and A/kali Soils, Agricul-
ture Hand Book No. 60.Wilcox, L. V.: 1958, Determining the Quality of Irrigation Water, U.S. Dept. Agri. Infor. Bull. 197.World Health Organisation: 1958, International Standards for Drinking Water. Geneva.