ventia analyst presentation ipo
TRANSCRIPT

24 September 2021
ASX Market Announcements Australian Securities Exchange Limited Level 4 20 Bridge Street SYDNEY NSW 2000
VENTIA ANALYST PRESENTATION
CIMIC Group refers to its release dated 7 June 2021, announcing that advisers had been appointed to assist in reviewing strategic options for Ventia, which may include an initial public offering (IPO).
As part of this process, CIMIC advises that Ventia has provided it with a draft briefing presentation (attached to this announcement), which has been prepared by Ventia in relation to the potential IPO and contains draft information, including Ventia’s draft forecast financial information. CIMIC understands that information contained in this presentation is being provided to several research analysts and disclosed to external parties in connection with a potential IPO process.
CIMIC has not prepared and is not responsible for this information, and to the maximum extent permitted by law, disclaims liability to any person who takes action based on it. CIMIC is releasing the information only to ensure that it complies with its continuous disclosure obligations.
No final decision has been made to proceed with an IPO and no decision has been made with respect to the size of the sell-down of CIMIC’s interest in Ventia should an IPO be undertaken.
Ventia is an investment partnership between CIMIC and funds managed by affiliates of Apollo Global Management, with each owning approximately 47%.
Sincerely,
CIMIC GROUP LIMITED T +61 2 9925 6666 F +61 2 9925 6000 Authorised by the CIMIC Group Continuous Disclosure Committee Important notice This document does not contain or constitute an offer or invitation to purchase or subscribe for any shares in Ventia in any jurisdiction including the United States and should not be relied on in connection with any decision to purchase or subscribe for any such shares.

Page 2 of 2
If an IPO proceeds, a prospectus in relation to the IPO would be made available at the time that shares under the potential IPO are offered in Australia. In that case, any person should consider the prospectus in deciding whether to acquire any shares in Ventia. Any person who wants to acquire the shares in Ventia would need to complete the application form that would be in or would accompany the prospectus.
This document contains forward looking statements. These forward-looking statements are not representations, guarantees or predictions of future performance, and are based on assumptions and known and unknown risks, uncertainties and other contingencies, many of which are outside the control of CIMIC Group Limited. Actual events or results may differ significantly from the events or results expressed or implied in this document.
The trading update, historical and forecast financial information and other information in this announcement has been prepared by Ventia. CIMIC has not prepared and is not responsible for this information, and to the maximum extent permitted by law, disclaims liability to any person who takes action based on such information. CIMIC understands that the information is based on Ventia’s current expectations, estimates, forecasts and projections about Ventia’s business and the industry in which it operates and the beliefs and assumptions of Ventia’s management. The information remains draft and subject to change, but may be considered material to CIMIC.

NOT FOR DISTRIBUTION OR RELEASE IN THE UNITED STATES
Presentation to AnalystsFinancial Information | September 2021
NOT FOR DISTRIBUTION OR RELEASE IN THE UNITED STATES

NOT FOR DISTRIBUTION OR RELEASE IN THE UNITED STATES
Important information and disclaimer
Page | 2
This document (Presentation) is confidential and provided by VentiaServices Group Pty Ltd (Ventia) solely on the basis that you (Recipient)agree in favour of Ventia, its advisers (Advisers), their respective relatedbodies corporate (as defined in the Corporations Act 2001 (Cth)(Corporations Act)), affiliates and securityholders, and their respectivedirectors, officers, employees, partners, representatives, agents,advisers and consultants (together, the Limited Parties) to be bound bythe following terms and conditions. If you are not the intended recipientof this Presentation, or if you do not agree to be bound by the followingterms and conditions, please notify Ventia immediately and destroy orreturn to Ventia all copies of this Presentation, whether held inelectronic or printed form or otherwise. This Presentation is beingprovided to you on the basis that you are in Australia and you are theholder (or representative of a holder) of an Australian financial serviceslicence or the employee or representative of such holder.
If you are not such a person, then you are not an intended recipient ofthis Presentation and you must notify Ventia immediately and destroy orreturn to Ventia all copies of this Presentation, whether held inelectronic or printed form or otherwise.
The Presentation has been prepared by Ventia as at as at 24 September2021 for the sole purpose of providing the Recipient with backgroundinformation about Ventia. The Presentation is confidential andproprietary to Ventia and certain members of its Limited Parties andmust be kept strictly confidential by the Recipient. The distribution ofthis Presentation may be restricted by law. This Presentation is intendedonly for the Recipient and may not be copied, reproduced ordisseminated in whole or in part, nor may it or any of its contents beshared with, quoted to or referred to, or disclosed to any third-partieswithout the prior written approval of Ventia, which may be withheld inVentia’s absolute discretion. If requested, the Recipient must promptlydestroy all copies or records of the Presentation, whether held inelectronic or printed form or otherwise, and return this Presentation toVentia without retaining any copies.
This Presentation has been prepared at a time where the due diligenceinvestigations and verification procedures in connection with a draftprospectus have not been completed and drafting of a prospectus hasnot been finalised (including the risk factor disclosure and financialdisclosure). Accordingly, you acknowledge that the information in thePresentation is subject to change and may differ materially in bothcontent and presentation from any information that may be containedin the prospectus.
No reliance may be placed on the Presentation for any purpose. None of
the Limited Parties make any representation or warranty, express orimplied, as to the fairness, accuracy, reliability, adequacy orcompleteness of the Presentation or as to the reasonableness of anyunderlying assumptions supporting the Presentation (including anyforward-looking statements). No representation or warranty, express orimplied, is made that the presentation contains all material informationabout Ventia, or which a prospective investor may require in evaluatinga possible investment in Ventia. To the maximum extent permitted bylaw, Ventia and the Limited Parties expressly disclaim any and all liabilityfor loss (including, without limitation, damages, expenses, costs,interest, loss of profits, or special loss or damage) suffered by anyperson, directly or indirectly, arising from any error, inaccuracy,incompleteness or similar defect (including because of negligence orotherwise) in the information contained in the Presentation or as aresult of the Recipient (or any other person) relying on anythingcontained in, or omitted from, the Presentation or otherwise arising inconnection with the Presentation. The Presentation does not, and willnot, form the basis of any contract or commitment. Neither Ventia northe Limited Parties have any responsibility or obligation to inform you ofany matter arising, or coming to their notice, after the date of thePresentation which may affect any matter referred to in thePresentation.
None of the Advisers or their related bodies corporate (as defined in theCorporations Act), securityholders or affiliates, nor any of theirrespective directors, officers, employees, partners, representatives,agents, advisers and consultants (together the Adviser Group) haveauthorised, permitted or caused the issue or lodgement, submission,dispatch or provision of this Presentation, and there is no statement orinformation in this Presentation that is made by any of the members ofthe Adviser Group. To the maximum extent permitted by law, eachmember of the Adviser Group expressly disclaims all liability (whetherfor fault, negligence or otherwise) in respect of, and make norepresentations regarding, and take no responsibility for, any part of thisPresentation.
None of Ventia nor any other Limited Parties act, or are responsible, as afiduciary to any recipient of this Presentation or to any directors,officers, employees, affiliates, partners, representatives, consultants,agents, advisers, securityholders, creditors or any other person. You andeach of Ventia and the other Limited Parties expressly disclaim anyfiduciary relationship.
The Presentation contains summary information about Ventia and itsindustry. The information in the Presentation does not purport to becomplete and is subject to change without notice. The views expressed
in this presentation contain information that has been derived fromreports commissioned by third parties, including BIS Oxford Economicsand publicly available sources that have not been independentlyverified. Neither Ventia nor any of the other Limited Parties has carriedout due diligence investigations in connection with the preparation ofthe Presentation, nor has any such party verified the contents of thePresentation.
Some of the information contained in the Presentation may constituteforward-looking statements and comments about future events,including expectations about the performance of Ventia’s businessesand certain strategic transactions that are subject to various risks anduncertainties. Forward-looking statements can generally be identified bythe use of forward looking words such as, “expect”, “anticipate”, “likely”,“intend”, “should”, “could”, “outlook”, “may”, “predict”, “plan”,“propose”, “will”, “believe”, “forecast”, “estimate”, “goals”, “aims”,“target” and other similar expressions within the meaning of securitieslaws of applicable jurisdictions. Indications of, and guidance or outlookon, future growth opportunities, potential market opportunities andestimates of total addressable market sizes and potential growth in suchmarkets are also forward-looking statements. Forward-lookingstatements contained in the Presentation that reference past trends oractivities should not be taken as a representation that such trends oractivities will necessarily continue in the future. Such forward-lookingstatements, which speak only as of the date of the Presentation, includestatements about industry and market trends, statements about Ventia’sfuture strategies and the progress of current strategies and the likelyoutcomes of those strategies. Any forward-looking statementscontained in the Presentation are based on current expectations aboutfuture events, and are by their nature subject to significant risks,uncertainties and contingencies that could cause Ventia’s actual resultsto differ materially from the expectations described.
Recipients should not place undue reliance on forward-lookingstatements, particularly in light of the current economic climate and thesignificant volatility, uncertainty and disruption caused by the COVID-19pandemic, and should make their own independent assessment of anyforward-looking statements contained in the Presentation and take theirown independent professional advice in this regard.

NOT FOR DISTRIBUTION OR RELEASE IN THE UNITED STATES
Important information and disclaimer c o n t i n u e d
Past performance is not necessarily a guide to future performance. Noneof Ventia or the Limited Parties, makes any representation or warrantyas to the accuracy of any forward looking statements contained in thePresentation. Nothing contained in this Presentation is, or shall be reliedupon as, a recommendation, promise, representation, warranty orguarantee by Ventia or the Limited Parties, whether as to the past,present or future. To the maximum extent permitted by law, none ofVentia or the Limited Parties undertake any obligation to update orrevise any forward-looking statements, whether as a result of newinformation, future events or otherwise.
The Presentation is not, and does not constitute, or form part of, anyoffer, recommendation, advice, solicitation or invitation to subscribe for,or purchase, any securities in the United States or any other jurisdiction,nor should the Presentation form the basis of, or be relied upon inconnection with, any contract or commitment or investment decisionwhatsoever. The Presentation may not be distributed or released in theUnited States. None of Ventia’s securities have been, or will be,registered under the U.S. Securities Act, and no securities may beoffered or sold, directly or indirectly, in the United States unless theyhave been registered under the U.S. Securities Act or are offered andsold pursuant to an exemption from, or in a transaction not subject to,the registration requirements of the U.S. Securities Act and any otherapplicable state securities laws.
The Presentation is not, and does not constitute, a prospectus, productdisclosure statement, or offering document or other form of disclosuredocument under Australian law (or any other law) and does not containall the information which would be required to be disclosed in aprospectus, product disclosure statement, or other offering documentor other form of disclosure document under Australian law (or any otherlaw). The Presentation has been provided for information purposes only.Provision of the Presentation is not a representation to any Recipient (orthe advisors or associated persons of any Recipient) or any other personthat a transaction will be entered into. Any transaction would beundertaken solely on the basis of disclosure documentation specific tothat transaction. The Presentation is general only and does not take intoaccount a Recipient’s individual investment objectives, taxationposition, financial situation or needs and must not be relied on to makean investment decision. Any reliance placed on the Presentation, andany use of the Presentation, by a Recipient is solely at their own risk.Recipients of the Presentation should seek and rely upon their ownindependent review, investigation and analysis and obtain any taxation,legal, financial or other professional advice in relation to thePresentation as appropriate to the Recipient’s jurisdiction.
All dollar values are in AU dollars ($ or A$) unless stated otherwise.
A number of figures, amounts, percentages, estimates, calculations ofvalue and fractions in this Presentation are subject to the effect ofrounding. Accordingly, the actual calculation of these figures may differfrom the figures set out in this Presentation.
Recipients of the Presentation should be aware that this Presentationcontains references to the CY2018, CY2019, CY2020, CY2021F andCY2022F financial results for Ventia. These results are presented on a proforma basis and comprise the aggregation of the historical financialinformation for Ventia (before the Broadspectrum acquisition) andBroadspectrum as if they were one entity for these periods. The proforma results included in this presentation have been derived from theaudited accounts of Ventia (before the Broadspectrum acquisition) andBroadspectrum, adjusted for the effects of certain pro formaadjustments. Recipients are cautioned that the historical pro formaaccounts have not been audited or reviewed and, accordingly,Recipients should not place undue reliance on this information.
In addition, certain financial data included in the Presentation may beconsidered “non-IFRS financial information” under Regulatory Guide 230Disclosing non-IFRS financial information published by the AustralianSecurities and Investments Commission and also “non-GAAP financialmeasures” within the meaning of Regulation G under the U.S. SecuritiesExchange Act of 1934, as amended. These measures include EBITDAmargins and work-in-hand. Recipients should understand that suchnon-IFRS/non-GAAP financial measures do not have standardisedmeanings prescribed by Australian Accounting Standards orInternational Financial Reporting Standards and therefore may not becomparable to similarly titled measures presented by other entities, norshould they be construed as an alternative to other financial measuresdetermined in accordance with Australian Accounting Standards orInternational Financial Reporting Standards. Recipients are cautionednot to place undue reliance on any such measures.
This Presentation contains statistics, data and other information(including forecasts and projections) relating to: (i) markets, marketsizes, market shares, market positions and other industry data; and (ii)macroeconomic trends, positions and other data, in each casepertaining to Ventia’s business and the markets in which Ventiaoperates. Ventia commissioned a report (Industry Report) by BIS OxfordEconomics, which covered market drivers, the estimated addressablemarket size of Maintenance Services, Ventia’s estimated market share bySector, and the outlook for each industry segment in which Ventiaoperates. The Industry Report is prepared on an FY 30 June basis, and
covers the historical twelve month periods ended 30 June 2018 (FY18),30 June 2019 (FY19), 30 June 2020 (FY20) and the twelve month forecastperiods ending 20 June 2021 (FY21), 30 June 2022 (FY22), 30 June 2023(FY23), 30 June 2024 (FY24) and 30 June 2025 (FY25).
Because Ventia’s fiscal year ends on 31 December of each year, in orderto derive Ventia’s market share information for FY21 on a consistentbasis with the BIS estimates of addressable markets in the IndustryReport, Ventia has adjusted its revenue data from its financialstatements to a 30 June 2021 basis by subtracting its revenue from itsfinancial statements for the six months ended 30 June 2020 (whichfinancial statements are unaudited but have been subject to review)from its revenue from its financial statements for the year ended 31December 2020 (which financial statements have been audited), toderive Ventia revenue for the six months ended 31 December 2020,which were then added to Ventia’s revenue from its financial statementsfor the six months ended 30 June 2021 (which financial statements areunaudited but are currently subject to review) to derive Ventia’s revenuefor the twelve months ended 30 June 2021 (which financial informationis unaudited and has not been subject to review).
In addition, Ventia has not independently verified, and cannot give anyassurances as to the accuracy and completeness of, the market andindustry data contained in this Presentation that has been extracted orderived from the Industry Report. Accordingly, the accuracy andcompleteness of such information is not guaranteed. There is noassurance that any of the forecasts or projections contained in theIndustry Report which are referred to in this Presentation will beachieved.
All logos displayed in this presentation may not be replicated,distributed or shared.
Page | 3

NOT FOR DISTRIBUTION OR RELEASE IN THE UNITED STATES
Overview of VentiaNOT FOR DISTRIBUTION OR RELEASE IN THE UNITED STATES

NOT FOR DISTRIBUTION OR RELEASE IN THE UNITED STATES
$1.9bn42%
$1.2bn27%
$0.9bn21%
$0.5bn11%
Infrastructure Services (IS)
Tele-communication Transport
Defence & Social Infrastructure (D&SI)
Sector
◼ Defence◼ Social Infrastructure◼ Critical Infrastructure◼ Local Government◼ Property
◼ Resources & Industrial ◼ Water◼ Electricity & Gas◼ Environmental Services◼ Technology Solutions
◼ Fixed Networks◼ New Zealand◼ Essential Services◼ Wireless ◼ nbn Operations & Assurance
◼ Roads Transport Operations Australia
◼ Transport New Zealand◼ Rail Operations
Business Units
CY2021F pro forma services revenue1
% of CY2021F pro forma services revenue2
Services
Company overviewVentia provides essential infrastructure services in Australia and New Zealand across four Sectors
◼ Defence agencies◼ Commonwealth, State
and Local Government agencies
◼ Healthcare and education providers
◼ Utility network owners◼ Mining operators◼ Energy and industrial clients
◼ Telecommunications network carriers
◼ Private non-carrier networks
◼ Road and rail network owners◼ Government agencies
Page | 5
Ventia provides a broad range of Maintenance Services, spanning the full infrastructure asset lifecycle including: Operations and Maintenance, Soft Facilities Management, Hard Facilities Management, Environmental Services, Minor Capital Works and other solutions3
Select clients
1. Excludes other income.2. Sum of Sector contributions exceeds 100% due to rounding.
3. Includes technology solutions, property and consulting.

NOT FOR DISTRIBUTION OR RELEASE IN THE UNITED STATES
Service delivery across Australia and New Zealand
Australia and New Zealand footprint1
Ventia’s project sites as at 30 June 2021
Page | 6
40% of CY2020 total
revenue ($4.6bn) generated in regional and rural areas
400+ project sites across
Australia & New Zealand
No single state or territory
contributed more 29% of
total revenue in CY2020
QLD: 14% of CY2020 total revenue
NSW: 29% of CY2020 total revenue
VIC: 20% of
CY2020 total revenue
TAS: 1% of
CY2020 total revenue
SA: 6% of
CY2020 total revenueWA: 10% of
CY2020 total revenue
NT: 5% of CY2020 total revenue
NZ: 15% of
CY2020 total revenue
Diverse portfolio of Maintenance Services delivered across urban, regional and rural communities
1. All percentages refer to CY2020 pro forma total revenue.

NOT FOR DISTRIBUTION OR RELEASE IN THE UNITED STATES
Addressable market for Maintenance ServicesVentia operates in a $62.0bn market which is expected to grow at 5.5% from FY2021F to FY2025F1
Estimated addressable market size across Australia and New Zealand ($bn)1
FY2021F-2025F CAGR:5.5%
Maintenance Services market drivers1
Size and growth of asset base
Technology adoption and automation
Environmental regulations
Population growth
Outsourcing rates
1. BIS Oxford Economics (2021). Refers to the financial years ended / ending 30 June.
5.3
21.1
22.2
7.8
5.6
63.5 64.4 64.562.0
64.767.7
72.3
76.9
FY2018 FY2019 FY2020 FY2021F FY2022F FY2023F FY2024F FY2025F
Transport
Telecommunications
IS
D&SI
New Zealand
Page | 7

NOT FOR DISTRIBUTION OR RELEASE IN THE UNITED STATES
Client and contract profileAs a Maintenance Services provider, Ventia has a low contribution from Fixed Price contract profiles. Ventia has client relationships exceeding 30 years
Overview of clients and contracts2
Schedule of Rates3 80%
Fixed Price4 11%
Cost Reimbursable5 9%
Revenue by contract
profile
Public 70%
Private 30%
Revenue by client type
Ventia provided services to over 100 clients in CY2020. Average contract renewal rates of > 80%1 since 2016
Client 1 16%
Client 2 14%
Client 3 6%
Client 4 6%
Client 5 5%
Client 6-10 13%
Other clients 40%
Longevity of client relationships
Revenue by client
Relationship (years)
Sector Client description
30+ D&SI Defence and national security agency
25+ D&SI Government transport agency
25+ IS NZ electricity network owner
25+ Telecommunications Major telecommunications agency
20+ IS Energy generator, wholesaler and retailer
20+ IS Water network owner
20+ Transport Government transport agency
15+ D&SI Government social housing provider
15+ D&SI Government works agency
15+ IS Government electricity T&D
15+ Transport Global toll-road operator
10+ IS Global resources company
10+ Telecommunications Major telecommunications agency
10+ Telecommunications Telecommunications network owner
In CY2020, Ventia delivered services to its top 5 clients across 31 separate contracts
1. Average renewal rate for the period CY2016-CY2020. Calculated as the contract value of renewal opportunities won divided by the contract value of total renewal opportunities tendered2. Revenue by client, client type and contract profile reflects CY2020 pro forma total revenue.3. Contracts that predominantly have a combination of unit pricing and variable volume of works (typically based on work activit ies or number of client assets maintained, with the ability to remeasure
work volumes over time).4. Contracts that predominantly have a fixed price (subject to variations) for an agreed outcome, where Ventia is paid for the p roportion of works as they are performed, with a fixed price that is not
affected by the cost of delivery.5. Contracts that are predominantly structured to pass the actual costs through to the client plus a margin. Page | 8
NOT FOR DISTRIBUTION OR RELEASE IN THE UNITED STATES
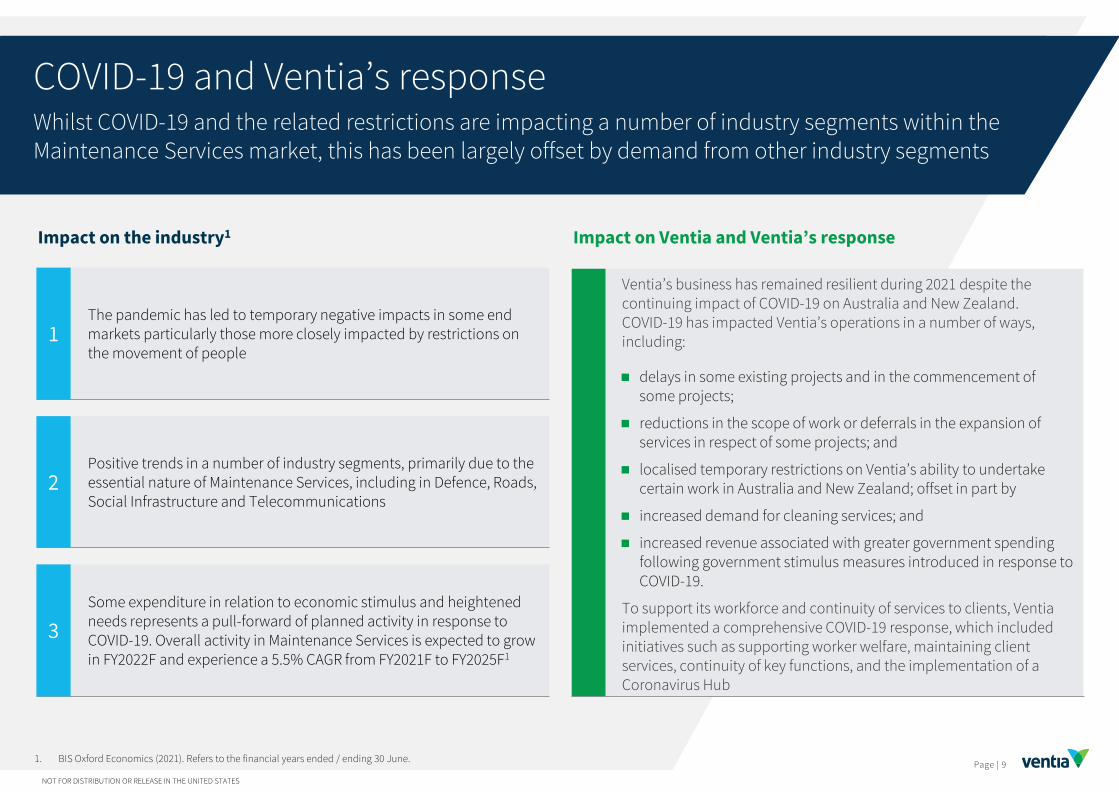
COVID-19 and Ventia’s responseWhilst COVID-19 and the related restrictions are impacting a number of industry segments within the Maintenance Services market, this has been largely offset by demand from other industry segments
Impact on the industry1 Impact on Ventia and Ventia’s response
The pandemic has led to temporary negative impacts in some end markets particularly those more closely impacted by restrictions on the movement of people
1
Positive trends in a number of industry segments, primarily due to the essential nature of Maintenance Services, including in Defence, Roads, Social Infrastructure and Telecommunications
2
Some expenditure in relation to economic stimulus and heightened needs represents a pull-forward of planned activity in response to COVID-19. Overall activity in Maintenance Services is expected to grow in FY2022F and experience a 5.5% CAGR from FY2021F to FY2025F1
3
Ventia’s business has remained resilient during 2021 despite the continuing impact of COVID-19 on Australia and New Zealand. COVID-19 has impacted Ventia’s operations in a number of ways, including:
◼ delays in some existing projects and in the commencement of some projects;
◼ reductions in the scope of work or deferrals in the expansion of services in respect of some projects; and
◼ localised temporary restrictions on Ventia’s ability to undertake certain work in Australia and New Zealand; offset in part by
◼ increased demand for cleaning services; and
◼ increased revenue associated with greater government spending following government stimulus measures introduced in response to COVID-19.
To support its workforce and continuity of services to clients, Ventia implemented a comprehensive COVID-19 response, which included initiatives such as supporting worker welfare, maintaining client services, continuity of key functions, and the implementation of a Coronavirus Hub
1. BIS Oxford Economics (2021). Refers to the financial years ended / ending 30 June.Page | 9

NOT FOR DISTRIBUTION OR RELEASE IN THE UNITED STATES
Pro forma financialsNOT FOR DISTRIBUTION OR RELEASE IN THE UNITED STATES

NOT FOR DISTRIBUTION OR RELEASE IN THE UNITED STATES
Basis of preparation and forecast assumptionsPro forma financials include adjustments to reflect Ventia’s business composition, capital structure post-IPO, and other pro forma adjustments. Forecast financial information has been prepared making a number of specific and general assumptions
Notes to Basis of preparation:1. Broadspectrum audited financials for CY2018 and CY2019, unaudited management accounts for H1CY2020. Other adjustments: exclusion of Broadspectrum
Americas (carved out of the acquisition), impact of changes in Broadspectrum JV ownerships, exclusion of fees charged by Ferrovial (vendor of Broadspectrum), exclusion of immigration contracts exited by Broadspectrum, exclusion of financials of APP Corporation (divested 19 March 2021).
2. Non-recurring expenses include transaction/integration costs, accelerated amortisation relating to software and brand which will not be used post integration of Broadspectrum, Offer costs and fees to Existing Shareholders (which will no longer be payable post-IPO).
3. Includes additional public company costs and remuneration changes post-IPO.
Broadspectrum adjustments
1
◼ Broadspectrum was acquired on 30 June 2020
◼ Pro forma financials include Broadspectrum’s pre-acquisition financials, as well as other adjustments1
◼ Impact of the issue of new equity and the drawdown of New Banking Facilities to repay existing debt facilities
◼ Exclusion of non-recurring expenses2
◼ Inclusion of additional costs post-IPO3
◼ Application of AASB 16 as though it had been adopted on 1 January 2018 (lease standard was adopted on 1 January 2019)
◼ Inclusion of tax impacts of the pro forma adjustments and the application of a pro forma effective income tax rate which is expected to be applicable going forward
Statutory financials
Pro forma financials
+ + + =Post-IPO capital structure
2Other pro forma adjustments
3
Basis of preparation
1. there is no material change in the competitive and operating environments in which Ventia operates;
2. there is no change in applicable AAS and IFRS that would have a material impact on Ventia’s accounting policies, financial reporting or disclosure requirements;
3. there is no significant deviation from current market expectations of the broader economic conditions including exchange rates relevant to the Australian and New Zealand operations under which Ventia and its key clients operate;
4. there are no material changes in the legislative regimes (including taxation) and regulatory environment in which Ventia and its clients operate;
5. there are no material losses of customers or contracts beyond those incorporated in the forecasts;
6. there are no material industrial actions or other disturbances, environmental costs or legal claims;
7. no material acquisitions or divestments are completed; 8. there is a reducing impact from the COVID-19 pandemic on operations for the
remainder of CY2021F, and no material ongoing impact on operations in CY2022F
Forecast assumptions
In preparing the forecast financial information for CY2021F and CY2022F, Ventia has made specific and general assumptions including, but not limited to, the following:
Page | 11

NOT FOR DISTRIBUTION OR RELEASE IN THE UNITED STATES
0.9%
1.3%
0.7%
0.9% 0.8%
CY2018 CY2019 CY2020 CY2021F CY2022F
EBITDA and EBITDA Margin (pro forma, $m / %) are stable and growing
Financial trendsRevenue and earnings have remained stable, converting to ~80-90% Operating Cash Flows
Work in hand1 (pro forma, $bn) provides forward earnings visibility
Capital Expenditure as a % total of revenue typically less than 1% (pro forma, %)
1. Work in hand comprises the total contractually agreed future revenue for projects with agreed scope and volume, plus an assessment of the future revenue that is likely to be generated from existing contractual arrangements where the project scope and volumes are variable.
2. Operating Cash Flow represents EBITDA plus any non-cash share-based payments, less changes in Net Working Capital. Operating Cash Flow Conversion reflects Operating Cash Flow divided by EBITDA, expressed as a percentage.
Total revenue (pro forma, $m) is stable and resilient to COVID-19
Growth Capital Expenditure Maintenance Capital Expenditure
354.1 351.5 354.5 365.8408.6
7.4% 7.3% 7.7% 8.1% 8.3%
0.0%
2.0%
4.0%
6.0%
8.0%
10.0%
12.0%
--
50.0
100.0
150.0
200.0
250.0
300.0
350.0
400.0
450.0
CY2018 CY2019 CY2020 CY2021F CY2022F
4,754.5 4,803.8 4,591.9 4,501.74,942.6
CY2018 CY2019 CY2020 CY2021F CY2022F
Page | 12
309.8289.7
308.4 309.7
373.7
87.5%82.4%
87.0% 84.7%
91.4%
50.0%
60.0%
70.0%
80.0%
90.0%
100.0%
110.0%
--
50.0
100.0
150.0
200.0
250.0
300.0
350.0
400.0
CY2018 CY2019 CY2020 CY2021F CY2022F
Operating Cash Flow (OCF) (pro forma, $m) and OCF Conversion2 (pro forma, %) have remained high
12.5 11.8 13.1 12.5
15.5
31-Dec-18 31-Dec-19 31-Dec-20 30-Jun-21 31-Jul-21

NOT FOR DISTRIBUTION OR RELEASE IN THE UNITED STATES
Work in hand profile provides forward earnings visibilityVentia has a high degree of forward earnings visibility from its work in hand1 profile
Work in hand1 profile (pro forma, $bn)
◼ Approximately 70-80%2 of Ventia’s next 12 months revenue historically supported by work in hand1
◼ 98% of CY2021F total revenue covered by work in hand1
◼ 80% of CY2022F total revenue covered by work in hand1
Work in hand1 by Sector, as at 31 July 2021
D&SI39%
IS30%
Telecom-munications11%
Transport20%
Visible and recurring revenue
1. Work in hand comprises the total contractually agreed future revenue for projects with agreed scope and volume, plus an assessment of the future revenue that is likely to be generated from existing contractual arrangements where the project scope and volumes are variable. All figures on a pro forma basis.
2. From CY2018 to CY2020.
3. Forms part of the pro forma forecast, but is not included in 31 July 2021 work in hand given the preferred bidder status.
Recent public announcements in 2021
5+ year contract plus three 2-year options
Government of South Australia
10 year maintenance master contract
Chevron Australia
2.5 year contractnbn
O&M provider to the Spark Consortium, which has been announced as the preferred bidder for the North East Link project3
North East Link project
Page | 13
12.5 11.8
13.1 12.5
15.5
31-Dec-18 31-Dec-19 31-Dec-20 30-Jun-21 31-Jul-21

NOT FOR DISTRIBUTION OR RELEASE IN THE UNITED STATES
RevenueA forecast 10% increase in CY2022F total revenue reflects growth across all reporting segments1, underpinned by work in hand coverage of 80%
Pro forma total revenue ($m)
◼ Historical (CY2018 – CY2020) drivers
– Relatively steady, with declining revenue in the Telecommunications segment resulting from the completion of the construction phase of the NBN in June 2020 offset by growth in non-Telecommunications segments which have grown at a CAGR of 5.4% between CY2018 and CY2020
◼ Forecast (CY2020 – CY2022F) drivers
– $90.1m (2.0%) decrease in CY2021F is expected to be driven by declines in Telecommunications, IS and Transport, partly offset by growth in D&SI
– $440.8m (9.8%) increase in CY2022F is expected to be driven by growth in all segments, including a return to growth in Telecommunications
– Work in hand as at 31 July 2021 is expected to cover 98% of CY2021F revenue and 80% of CY2022F revenue
– Assumed that COVID-19 will have a reducing impact on operations for the remainder of CY2021F and no material ongoing impact in CY2022F
1,289.0 1,401.9 1,556.51,871.5 2,079.6
1,234.61,270.9
1,229.6
1,206.31,350.1448.7
415.7514.5
492.2
517.31,780.6 1,712.6 1,290.0 931.3
995.5
4,754.5 4,803.84,591.9 4,501.7
4,942.6
CY2018 CY2019 CY2020 CY2021F CY2022F
Defence & Social Infrastructure Infrastructure Services
Transport Telecommunications
Other income
9.4%CY2020-2022Fnon-Telecom-municationsforecast revenue CAGR
~80%$3.9bn
1. Ventia has four reporting segments as outlined on page 5 (referred to as Sectors).2. Includes other income of $1.5m in CY2018, $2.5m in CY2019, $1.2m in CY2020 and $0.4m in CY2021F.
2
Page | 14

NOT FOR DISTRIBUTION OR RELEASE IN THE UNITED STATES
EBITDAVentia’s EBITDA is forecast to grow in CY2021F and CY2022F. Increased services revenue and leverage over cost base in CY2022F underpins margin improvement
Pro forma EBITDA ($m) and EBITDA Margin (%) ◼ Historical drivers (CY2018 – CY2020)
– Stable between CY2018 and CY2020
– Reflects growth in D&SI and IS and a reduction in Net Corporate Costs, partly offset by the decline in Telecommunications
◼ Forecast drivers (CY2020 – CY2022F)
– $11.2m (3.2%) increase in CY2021F and $42.8m (11.7%) increase in CY2022F reflects expected growth in D&SI, Transport and IS services revenue and further reduction in Net Corporate Costs
◼ Acquisition of Broadspectrum
– As part of the acquisition of Broadspectrum, as required by AASB 3 Business Combinations, Ventia performed an assessment to allocate the purchase consideration against the fair value of acquired assets and assumed liabilities
– This process included the:
– Harmonisation of accounting principles
– Fair value determination of PP&E and Intangibles
– Assessment of provisions related to employee entitlements, Unfavourable Contracts, Onerous Contracts, and Other Specific Contract Provisions
– Components of these provisions are released to earnings in line with AASB 3
Page | 15
354.1 351.5 354.5365.8
408.6
7.4% 7.3%
7.7%
8.1% 8.3%
CY2018 CY2019 CY2020 CY2021F CY2022F
Total EBITDA EBITDA Margin

NOT FOR DISTRIBUTION OR RELEASE IN THE UNITED STATES
Defence & Social Infrastructure
Infrastructure Services
Tele-communications
TransportDefence & Social Infrastructure
Pro forma historical and forecast financial performance
1,289.01,401.9
1,556.5
1,871.5
2,079.6
6.3% 6.0%
7.1% 6.6% 6.5%
(1.0%)
1.0%
3.0%
5.0%
7.0%
9.0%
11.0%
13.0%
15.0%
--
500.0
1,000.0
1,500.0
2,000.0
2,500.0
CY2018 CY2019 CY2020 CY2021F CY2022F
Services revenue ($m) EBITDA Margin (%)
Page | 16
◼ Historical drivers
– $112.9m (8.8%) increase in services revenue in CY2019 and $154.6m (11.0%) in CY2020 reflect increased volumes and new contracts (including full year contributions)
– Margin uplift in CY2020 driven by operational improvements, mix of work performed, provision releases relating to Unfavourable Contracts and removal of duplicate costs
◼ Forecast drivers
– $315.0m (20.2%) increase in services revenue in CY2021F and $208.1m (11.1%) in CY2022F reflect expected increases in volumes (including higher demand for cleaning services in CY2021F) and new contracts (including full year contributions)
– Reduced margins driven by expected change in mix of work performed, partly offset by provision releases relating to Unfavourable Contracts and operational improvements
EBITDA ($m) 81.1 83.9 110.2 124.4 135.9
The D&SI segment has delivered steady historical growth, with recent contract wins and anticipated volume increases expected to drive services revenue growth of 11% in CY2022F

NOT FOR DISTRIBUTION OR RELEASE IN THE UNITED STATES
Infrastructure Services
Infrastructure Services
Tele-communications
TransportDefence & Social Infrastructure
Pro forma historical and forecast financial performance
EBITDA ($m) 77.4 91.9 116.2 120.0 135.4
1,234.6 1,270.91,229.6 1,206.3
1,350.1
6.3% 7.2%
9.4% 9.9% 10.0%
(1.0%)
1.0%
3.0%
5.0%
7.0%
9.0%
11.0%
13.0%
15.0%
--
200.0
400.0
600.0
800.0
1,000.0
1,200.0
1,400.0
1,600.0
CY2018 CY2019 CY2020 CY2021F CY2022F
Services revenue ($m) EBITDA Margin (%)
Page | 17
◼ Historical drivers
– $36.4m (2.9%) increase in services revenue in CY2019 reflects increased volumes and new contracts (including full year contributions)
– $41.3m (3.2%) decrease in services revenue in CY2020 reflects a contract non-renewal, completed contracts and reduced volumes
– Margin uplift driven by completion of an unprofitable contract, mix of work performed, operational improvements, provision releases relating to Unfavourable Contracts and removal of duplicate costs
◼ Forecast drivers
– $23.3m (1.9%) decrease in services revenue in CY2021F mainly reflects expected completion of contracts and reduced volumes
– $143.8m (11.9%) increase in services revenue in CY2022F mainly reflects expected increases in volumes, full year contribution of new contracts and new opportunities
– Margin uplift driven by increased services revenue and operational improvements
The IS segment has demonstrated steady historical EBITDA growth, which is forecast to continue in CY2021F and CY2022F

NOT FOR DISTRIBUTION OR RELEASE IN THE UNITED STATES
Telecommunications
Infrastructure Services
Tele-communications
TransportDefence & Social Infrastructure
Pro forma historical and forecast financial performance
EBITDA ($m) 271.2 247.5 174.2 124.9 133.0
1,780.61,712.6
1,290.0
931.3995.5
15.2% 14.5%
13.5% 13.4% 13.4%
6.0%
8.0%
10.0%
12.0%
14.0%
16.0%
18.0%
20.0%
22.0%
24.0%
--
200.0
400.0
600.0
800.0
1,000.0
1,200.0
1,400.0
1,600.0
1,800.0
2,000.0
CY2018 CY2019 CY2020 CY2021F CY2022F
Services revenue ($m) EBITDA Margin (%)
Page | 18
◼ Industry context1
– The estimated addressable market of the Telecommunications industry segment in Australia reduced over the period from FY2018 to FY2021F2 as the construction phase of the NBN reached completion
– The estimated addressable market for the Telecommunications industry segment in Australia is forecast to grow in FY2022F2 with the key driver being additional NBN investment3 and the roll-out of new technologies by network carriers, partly offset by the forecast contraction in the New Zealand market as the rollout of the Ultra-Fast Broadband network progresses towards completion
◼ Historical drivers
– $68.0m (3.8%) decrease in services revenue in CY2019 and $422.6m (24.7%) decrease in services revenue in CY2020 reflect the completion of the initial fibre network build and reduced volumes, partly offset by new contracts
– Reduced margins driven by lower services revenue and mix of work, partly offset by cost management initiatives
◼ Forecast drivers
– $358.7m (27.8%) decrease in services revenue in CY2021F reflects expected decrease in volumes, partly offset by new contracts
– $64.2m (6.9%) increase in services revenue in CY2022F reflects expected contract renewals and the full year contribution of new contracts, partly offset by lower volumes
– Reduced margins expected to be driven by lower services revenue, partly offset by operational improvements
Following completion of the initial fibre network build, the Telecommunications segment is expected to grow in CY2022F driven by new contracts commenced in CY2021F
1. BIS Oxford Economics (2021).2. Refers to the financial years ended / ending 30 June.
3. Refers to the Federal Government’s $4.5 billion NBN investment announced in September 2020.
NOT FOR DISTRIBUTION OR RELEASE IN THE UNITED STATES
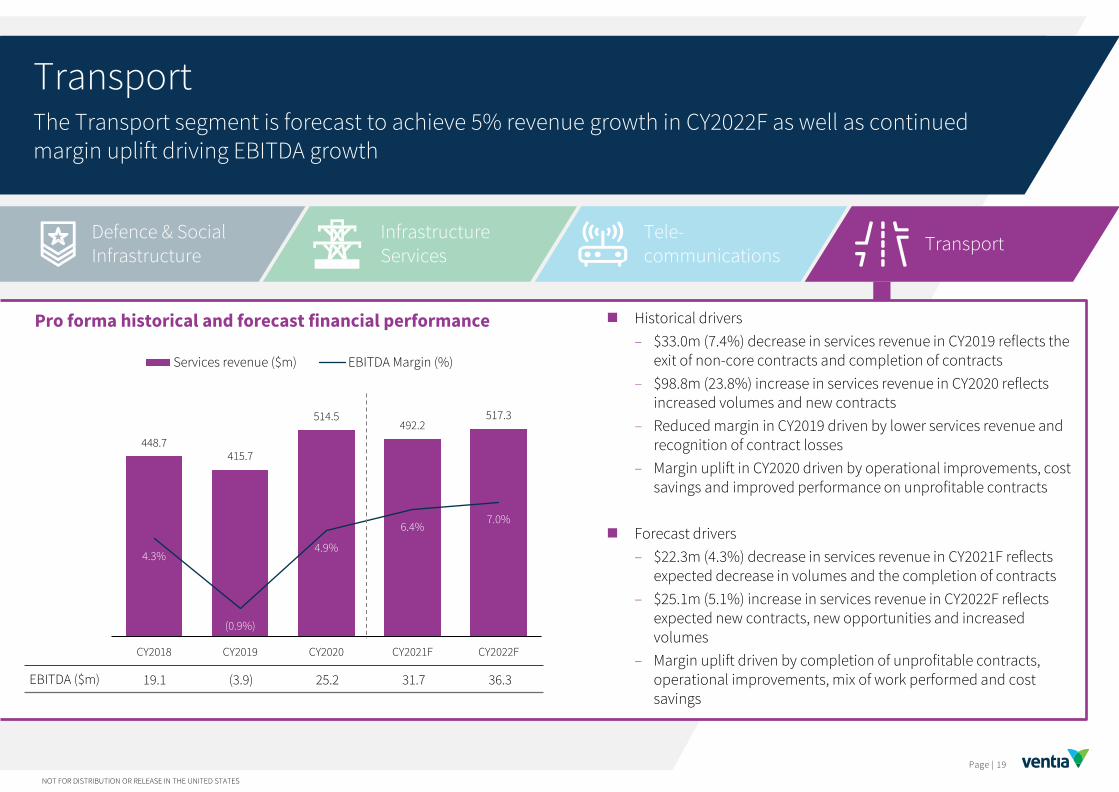
Transport
Infrastructure Services
Tele-communications
TransportDefence & Social Infrastructure
Pro forma historical and forecast financial performance
EBITDA ($m) 19.1 (3.9) 25.2 31.7 36.3
448.7415.7
514.5492.2
517.3
4.3%
(0.9%)
4.9%
6.4% 7.0%
(3.0%)
(1.0%)
1.0%
3.0%
5.0%
7.0%
9.0%
11.0%
13.0%
15.0%
--
100.0
200.0
300.0
400.0
500.0
600.0
CY2018 CY2019 CY2020 CY2021F CY2022F
Services revenue ($m) EBITDA Margin (%)
Page | 19
◼ Historical drivers
– $33.0m (7.4%) decrease in services revenue in CY2019 reflects the exit of non-core contracts and completion of contracts
– $98.8m (23.8%) increase in services revenue in CY2020 reflects increased volumes and new contracts
– Reduced margin in CY2019 driven by lower services revenue and recognition of contract losses
– Margin uplift in CY2020 driven by operational improvements, cost savings and improved performance on unprofitable contracts
◼ Forecast drivers
– $22.3m (4.3%) decrease in services revenue in CY2021F reflects expected decrease in volumes and the completion of contracts
– $25.1m (5.1%) increase in services revenue in CY2022F reflects expected new contracts, new opportunities and increased volumes
– Margin uplift driven by completion of unprofitable contracts, operational improvements, mix of work performed and cost savings
The Transport segment is forecast to achieve 5% revenue growth in CY2022F as well as continued margin uplift driving EBITDA growth

NOT FOR DISTRIBUTION OR RELEASE IN THE UNITED STATES
Net Corporate Costs
Pro forma Net Corporate Costs ($m)1
◼ Historical drivers
– $26.8m decrease in CY2019 reflects the implementation of operational improvements and increased cost recharges from higher services revenue
– $3.2m increase in CY2020 reflects lower cost recharges from reduced services revenue and higher employee incentive costs, partly offset by cost savings
◼ Forecast drivers
– $35.9m decrease in CY2021F reflects the expected full year contribution of cost savings initiatives, further operational improvements and cost savings following the Broadspectrumacquisition, partly offset by investments in business development and data analytics
– $3.2m decrease in CY2022F reflects the expected full year contribution of cost savings from the Broadspectrum acquisition and increased cost recharges from higher services revenue
94.7
67.971.1
35.232.0
CY2018 CY2019 CY2020 CY2021F CY2022F
Page | 20
The reduction in Net Corporate Costs between CY2018 and CY2022F reflects operational improvements, cost savings and increased cost recharges
1. Corporate costs include those related to: Segment based management and support functions; Group-wide corporate support functions (including Finance, Legal, Digital Services, People & Capability, Safety, Procurement, Shared Services and Strategy); Board fees; and other public company costs. Segment results include the allocation of corporate costs that can be directly attributed to a segment. Where corporate
costs cannot be directly attributed, a portion is recharged to the segments based on an assessment of services provided. Corporate costs not allocated or recharged to segments are reported as Net Corporate Costs.

NOT FOR DISTRIBUTION OR RELEASE IN THE UNITED STATES
Page | 21
Summary P&LVentia’s P&L reflects growth in both NPAT and NPATA over the historical and forecast period
Pro Forma Historical Pro Forma Forecast
$ millions CY2018 CY2019 CY2020 CY2021F CY2022F
Total revenue 4,754.5 4,803.8 4,591.9 4,501.7 4,942.6
% growth N/A 1.0% (4.4%) (2.0%) 9.8%
Total operating expenses (4,409.5) (4,458.6) (4,240.6) (4,141.3) (4,536.8)
Share of profits in JV entities 9.1 6.4 3.3 5.4 2.9
EBITDA 354.1 351.5 354.5 365.8 408.6
% margin 7.4% 7.3% 7.7% 8.1% 8.3%
Depreciation (133.8) (127.5) (116.1) (104.8) (105.4)
Amortisation of software (47.5) (49.0) (37.4) (31.0) (27.1)
EBITA 172.8 175.0 201.0 229.9 276.2
% margin 3.6% 3.6% 4.4% 5.1% 5.6%
Amortisation of acquired intangibles (30.5) (27.9) (19.2) (23.4) (23.3)
EBIT 142.3 147.1 181.8 206.5 252.9
Net finance costs (29.9) (30.0) (30.4) (30.2) (30.8)
Profit (loss) before tax 112.3 117.1 151.5 176.3 222.1
Tax expense (33.7) (35.1) (45.4) (52.9) (66.6)
NPAT 78.6 82.0 106.0 123.4 155.5
Amortisation of acquired intangibles (after-tax) 21.4 19.5 13.4 16.4 16.3
NPATA 100.0 101.5 119.5 139.8 171.8
Pro forma historical and forecast consolidated statement of profit or loss
◼ Reduction in depreciation reflects lower levels of plant and equipment, and reduction in right-of-use assets, through enhanced plant and property management
◼ Reduction in amortisation of software reflects decrease in the assessed fair value of Broadspectrum’s IT systems
◼ Net finance costs reflect New Banking Facilities
◼ Tax expense consistent with Australian corporate tax rate

NOT FOR DISTRIBUTION OR RELEASE IN THE UNITED STATES
Cash flows
Pro forma historical and forecast cash flows
Pro Forma Historical Pro Forma Forecast
$ millions CY2018 CY2019 CY2020 CY2021F CY2022F
EBITDA 354.1 351.5 354.5 365.8 408.6
Non-cash share-based payments 7.5 7.5 7.5 7.5 7.5
Changes in Net Working Capital (51.8) (69.3) (53.6) (63.6) (42.5)
Operating Cash Flow1 309.8 289.7 308.4 309.7 373.7
Operating Cash Flow Conversion2 87.5% 82.4% 87.0% 84.7% 91.4%
Lease payments (88.8) (82.1) (80.8) (78.0) (78.0)
Maintenance Capital Expenditure (21.2) (15.6) (15.1) (30.3) (33.6)
Growth Capital Expenditure (21.3) (45.0) (14.9) (11.3) (7.4)
Cash flow before financing and tax 178.4 146.9 197.6 190.1 254.7
Total Capital Expenditure (42.5) (60.6) (30.0) (41.6) (41.0)
Capital intensity (Capital Expenditure / total revenue)
0.9% 1.3% 0.7% 0.9% 0.8%
1. Operating Cash Flow represents EBITDA plus any non-cash share-based payments, less changes in Net Working Capital.2. Operating Cash Flow divided by EBITDA expressed as a percentage.
◼ Stable historical Operating Cash Flow Conversion of +80%, forecast to increase to +90% in CY2022F
◼ Increased Maintenance Capital Expenditure in forecast period reflects maintenance on assets acquired during CY2019 and CY2020 and variability in ongoing maintenance schedules
◼ Reduced Growth Capital Expenditure in forecast period reflects lower required levels of capital investment
◼ Capital light business model, with Capital Expenditure typically less than 1% of total revenue
Page | 22
Operating Cash Flow Conversion remains stable at +80%. Capital intensity is low (as measured by Capital Expenditure / total revenue)

NOT FOR DISTRIBUTION OR RELEASE IN THE UNITED STATES
Capital structure at IPOAt IPO Ventia will have net total indebtedness equal to 2.0x CY2021F EBITDA and 1.8x CY2022F EBITDA
Pro forma consolidated indebtedness as at 30 June 2021
$m
Before completion of
the Offer
Offer proceeds net of Offer
Costs
Net impact of New Banking
Facilities
Pro forma reflecting
Completion of the Offer
Debt 1,284.6 – (541.3) 743.4
Upfront fees 38.0 – (31.4) 6.6
Lease liabilities 125.1 – – 125.1
Gross total indebtedness 1,447.7 – (572.7) 875.1
Cash and cash equivalents (459.2) (351.1) 657.1 (153.2)
Cash flow hedging reserve 8.1 – (8.1) –
Derivative at fair value 82.0 – (82.0) –
Net total indebtedness 1,078.7 (351.1) (5.7) 721.9
Net total indebtedness to CY2021F pro forma EBITDA 2.0x
Net total indebtedness to CY2022F pro forma EBITDA 1.8x
◼ Net total indebtedness as at 30 June 2021 (including lease liabilities) of $721.9m
– 2.0x CY2021F EBITDA
– 1.8x CY2022F EBITDA
◼ New Banking Facilities at IPO to comprise:
– $750m of term loan facilities, spread equally across 3-, 4-and 5-year tranches fully drawn at Completion
– $400m 4-year revolving cash facility, undrawn at Completion
– Variable interest rates (BBSY plus a margin)
1. The net total indebtedness does not include the impact of other operational, financing or investing activities from 1 July 2021 to the date of the Offer.
Page | 23

NOT FOR DISTRIBUTION OR RELEASE IN THE UNITED STATES
Thank youNOT FOR DISTRIBUTION OR RELEASE IN THE UNITED STATES