vapor intrusion pathway feasibility study · connection with the property at 2010 east hennepin...
TRANSCRIPT
4300 MarketPointe Drive, Suite 200
Minneapolis, MN 55435
Phone: 952.832.2600
Fax: 952.832.2601
Vapor Intrusion Pathway Feasibility Study
East Hennepin Avenue Site
Minneapolis, Minnesota
Prepared for
General Mills, Inc.
April 2016

i
Vapor Intrusion Pathway Feasibility Study
April 2016
Contents
Executive Summary .............................................................................................................................................................................. 1
1.0 Introduction ........................................................................................................................................................................... 3
1.1 Scope of Feasibility Study ........................................................................................................................................... 4
2.0 Site Characterization........................................................................................................................................................... 6
2.1 Background ....................................................................................................................................................................... 6
2.1.1 Central Area Setting ................................................................................................................................................. 6
2.2 Previous Investigations and Response Action Activities ................................................................................. 6
2.3 Site Conceptual Model ................................................................................................................................................. 8
2.3.1 Vapor Sources ............................................................................................................................................................. 9
2.3.2 Geology and Hydrogeology .................................................................................................................................. 9
2.3.3 Spatial Distribution of Contaminants ................................................................................................................ 9
2.3.4 Potential Receptors.................................................................................................................................................10
2.3.5 Vapor Transport Mechanisms ............................................................................................................................10
2.3.6 Building Vapor Mitigation ....................................................................................................................................10
2.3.6.1 Central Area Building Mitigation Status ...............................................................................................11
2.4 Risk Assessment ............................................................................................................................................................11
3.0 Regulatory Considerations .............................................................................................................................................13
3.1 Remedial Action Objectives ......................................................................................................................................13
3.2 ARARs and TBCs ............................................................................................................................................................13
3.2.1 Classification of ARARs and TBCs .....................................................................................................................14
3.3 Preliminary Remediation Goals ...............................................................................................................................14
4.0 Technology Screening .....................................................................................................................................................16
4.1 Development of General Response Actions ......................................................................................................16
4.2 Evaluation and Screening of Technologies ........................................................................................................18
4.3 Retained Technologies ...............................................................................................................................................19
5.0 Development of Remedial Alternatives ....................................................................................................................21
5.1 Alternative 1 – No Further Action Beyond Previous Response Actions ..................................................21
5.2 Alternative 2 – Monitored Natural Attenuation ...............................................................................................21
5.3 Alternative 3 – Long Term O&M of SSD Systems ............................................................................................22

ii
5.4 Alternative 4 – Enhanced Bioremediation via Injection Events ..................................................................23
5.5 Alternative 5 – Enhanced Bioremediation via Recirculating System ........................................................24
6.0 Detailed Analysis of Alternatives .................................................................................................................................26
6.1 Detailed Analysis Overview .......................................................................................................................................26
6.1.1 Alternative Definition .............................................................................................................................................26
6.1.2 Evaluation Criteria ...................................................................................................................................................26
6.1.2.1 Threshold Criteria ..........................................................................................................................................26
6.1.2.2 Balancing Criteria...........................................................................................................................................27
6.1.2.3 Modifying Criteria .........................................................................................................................................28
6.1.2.4 Additional Considerations .........................................................................................................................28
6.1.3 Comparative Analysis of Alternatives ..............................................................................................................29
6.2 Detailed Analysis of Remedial Alternatives ........................................................................................................29
6.2.1 Alternative 1 – No Further Action Beyond Previous Response Actions .............................................29
6.2.1.1 Alternative 1 – Threshold Criteria ...........................................................................................................29
6.2.1.2 Alternative 1 – Balancing Criteria ............................................................................................................29
6.2.1.3 Alternative 1 – Additional Considerations ...........................................................................................30
6.2.1.4 Alternative 1 – Summary ............................................................................................................................30
6.2.2 Alternative 2 – Monitored Natural Attenuation ..........................................................................................30
6.2.2.1 Alternative 2 – Threshold Criteria ...........................................................................................................30
6.2.2.2 Alternative 2 – Balancing Criteria ............................................................................................................31
6.2.2.3 Alternative 2 – Additional Considerations ...........................................................................................31
6.2.2.4 Alternative 2 – Summary ............................................................................................................................31
6.2.3 Alternative 3 – Long-Term O&M of SSD Systems ......................................................................................32
6.2.3.1 Alternative 3 – Threshold Criteria ...........................................................................................................32
6.2.3.2 Alternative 3 – Balancing Criteria ............................................................................................................32
6.2.3.3 Alternative 3 – Additional Considerations ...........................................................................................33
6.2.3.4 Alternative 3 – Summary ............................................................................................................................34
6.2.4 Alternative 4 – Enhanced Bioremediation via Injection Events .............................................................34
6.2.4.1 Alternative 4 – Threshold Criteria ...........................................................................................................34
6.2.4.2 Alternative 4 – Balancing Criteria ............................................................................................................35
6.2.4.3 Alternative 4 – Additional Considerations ...........................................................................................36
6.2.4.4 Alternative 4 – Summary ............................................................................................................................36
6.2.5 Alternative 5 – Enhanced Bioremediation via Recirculation ...................................................................37
6.2.5.1 Alternative 5 – Threshold Criteria ...........................................................................................................37

iii
6.2.5.2 Alternative 5 – Balancing Criteria ............................................................................................................37
6.2.5.3 Alternative 5 – Additional Considerations ...........................................................................................38
6.2.5.4 Alternative 5 – Summary ............................................................................................................................39
6.3 Recommended Alternative .......................................................................................................................................39
7.0 Summary and Conclusions .............................................................................................................................................41
References .............................................................................................................................................................................................43
List of Tables
Table 1 Potential Action-Specific ARARs and TBCs
Table 2 Potential Location-Specific ARARs and TBC
Table 3 Potential Chemical-Specific ARARs and TBCs
Table 4 Remedial Technology and Process Option Screening
Table 5 Amendment Sensitivity Analysis
Table 6 Comparative Analysis Summary by Alternatives
Table 7 Alternative 2 Cost Estimate
Table 8 Alternative 3 Cost Estimate
Table 9 Alternative 4 Cost Estimate
Table 10 Alternative 5 Cost Estimate
List of Figures
Figure 1 Location Map
Figure 2 Study Area
Figure 3 Potential Off-Site TCE Sources
Figure 4 MPCA SA249 Groundwater and Soil Gas Sampling – TCE Results
Figure 5 Building Mitigation Status – April 2016
Figure 6 Glacial Drift Groundwater Monitoring Network
Figure 7 Alternative 4 – Enhanced Bioremediation via Injection Event(s)
Figure 8 Alternative 5 – Enhanced Bioremediation via Recirculation
List of Appendices
Appendix A Supporting Cost Details
Appendix B Sustainability Evaluation Summary
iv
Certifications
I hereby certify that this report was prepared by me or under my direct supervision and that I am a duly Licensed
Professional Engineer under the laws of the state of Minnesota.
April 6, 2016
Alec Danielson
PE #: 48763
Date

1
Executive Summary
This report describes the vapor intrusion (VI) pathway feasibility study completed by Barr Engineering Co.
(Barr) on behalf of General Mills, Inc. (General Mills) in Minneapolis, Minnesota. Feasibility study activities
were informed by the results of numerous soil, soil gas, and groundwater investigations conducted by
General Mills, the Minnesota Pollution Control Agency (MPCA), and others to assess volatile organic
compound (VOC) concentrations, primarily trichloroethylene (TCE) at and in the vicinity of the property at
2010 East Hennepin Avenue (Site), and a human health risk assessment (HHRA) prepared by Haley &
Aldrich, Inc. on behalf of General Mills (H&A, 2015). The Study Area, the larger area where investigations
have been conducted, is divided into four geographic regions, including the Site, Northeast Area, Central
Area, and Southwest Area. Feasibility study activities focus on the Central Area, only a portion of which
may be down-gradient of the Site.
Although off-Site sources are impacting shallow groundwater in the Central Area and the HHRA
concluded that exposure pathways in the Central Area currently are either incomplete or insignificant and
are not expected to be significant in the future, this feasibility study was prepared for the Central Area at
the direction of MPCA in its letter that provided comments to the Vapor Intrusion Pathway Investigation
Report (VIPI Report; Barr, 2015c, MPCA, 2015a). By preparing this study for the Central Area, General Mills
does not acknowledge or agree that TCE impacts in the Central Area or elsewhere in the Study Area are
associated with its former operations at the Site.
A great deal of remedial action work was completed at the Site and in the Study Area prior to beginning
this feasibility study. General Mills has completed sub-slab soil gas and/or indoor air sampling at 344
properties and installed sub-slab depressurization (SSD) systems for vapor mitigation at 189 properties in
the Study Area since November 2013. This work is documented in the Sub-Slab Sampling and Building
Mitigation Implementation Report (Implementation Report; Barr, 2015b). In addition to the numerous
investigations conducted by General Mills, this feasibility study follows 25 years of groundwater
remediation performed by General Mills.
The remedial action objective (RAO) developed for the Central Area as part of this feasibility study is to
maintain insignificant potential risk to human health from inhalation exposure to TCE in indoor air
resulting from TCE concentrations in soil gas and groundwater. As stated in the Remedial Action Plan
(RAP) Modification #1, dated March 11, 2014 (MPCA, 2014a) to the Response Order by Consent between
General Mills and the MPCA, dated October 23, 1984 (Consent Order; MPCA, 1984), General Mills is
responsible only for implementing response actions to address impacts that are due to its former
operations at the Site. By preparing this feasibility study and developing this RAO, General Mills does not
acknowledge or agree that TCE impacts in the Central Area or elsewhere in the Study Area are associated
with its former operations at the Site. The preliminary remediation goal (PRG) selected to evaluate the
remedial alternatives developed as part of the feasibility study is the MPCA intrusion screening values
(ISVs) for TCE in indoor air.
2
Various response action technologies were screened based on their ability to meet the RAO and PRG.
Appropriate technologies were then assembled into a range of remedial action alternatives that are
evaluated in the detailed analysis phase of the feasibility study. Response action technologies may target
the TCE-impacted soil vapor itself and/or the shallow groundwater that may act as a source of the TCE
impacts in soil vapor.
The response action technologies that were retained following the screening and used to develop
comprehensive remedial alternatives for further evaluation included:
Installation of additional SSD systems (at residential properties within the Central Area that
currently do not have active SSD systems);
Operations and maintenance (O&M) of SSD systems;
Institutional controls;
Monitored natural attenuation;
Expanded/modified groundwater extraction; and
In-situ groundwater bioremediation.
The five remedial alternatives developed as part of the feasibility study were:
Alternative 1 – No further action beyond previous response actions;
Alternative 2 – Monitored natural attenuation;
Alternative 3 – Long-term O&M of SSD systems;
Alternative 4 – Enhanced groundwater bioremediation via injection events; and
Alternative 5 – Enhanced groundwater bioremediation via recirculating system.
A detailed evaluation of each remedial alternative against criteria set forth in the Comprehensive
Environmental Response Compensation and Liability Act (CERCLA) was performed. The CERCLA
evaluation criteria include overall protection of human health and the environment, compliance with
applicable or relevant and appropriate requirements, long-term effectiveness and permanence, reduction
of toxicity, mobility or volume through treatment, short-term effectiveness, implementability, and cost.
Additional considerations with the potential to impact the community also were evaluated.
Alternative 3 – Long-term O&M of SSD systems presented the best balance of tradeoffs of the primary
balancing criteria and was selected as the recommended alternative based on the detailed analysis.

3
1.0 Introduction
This report describes the vapor intrusion (VI) pathway feasibility study activities completed by Barr
Engineering Co. (Barr), on behalf of General Mills, Inc. (General Mills). Feasibility study activities were
informed by the results of numerous soil, soil gas, and groundwater investigations completed in
connection with the property at 2010 East Hennepin Avenue (Site), including the VI pathway investigation
conducted in 2014 and 2015, and documented in the Vapor Intrusion Pathway Investigation Report (VIPI
Report; Barr, 2015c). The investigations assessed volatile organic compound (VOC) concentrations in soil,
soil gas, and groundwater at and in the vicinity of the Site, including impacts from off-Site sources where
elevated concentrations of trichloroethylene (TCE) are present in groundwater. The VI pathway
investigation work was conducted in accordance with the Remedial Action Plan (RAP) Modification #1,
dated March 11, 2014 (MPCA, 2014a) to the Response Order by Consent between General Mills and the
Minnesota Pollution Control Agency (MPCA), dated October 23, 1984 (Consent Order; MPCA, 1984). This
feasibility study is also informed by investigation work MPCA is conducting in the vicinity of the Site at a
recently established project area named the Southeast Hennepin Area Groundwater and Vapor Site
(SA249).
Since November 2013, sub-slab soil gas and/or indoor air sampling has been completed at 344 properties
and sub-slab depressurization (SSD) systems for vapor mitigation have been installed at 189 properties in
the Study Area. This work was completed in accordance with the RAP Modification #1 and is documented
in the Sub-Slab Sampling and Building Mitigation Implementation Report (Implementation Report; Barr,
2015b). In addition to the numerous investigations conducted by General Mills, this feasibility study
follows 25 years of groundwater remediation performed by General Mills pursuant to the Consent Order.
Thus a great deal of remedial action work was completed at the Site and in the Study Area prior to
beginning this feasibility study.
This feasibility study also is informed by the results of the human health risk assessment (HHRA) prepared
in 2015 by Haley & Aldrich, Inc. on behalf of General Mills. Although not required by the RAP
Modification #1, the HHRA was prepared to evaluate exposures to soil, groundwater, and indoor air
associated with residential and commercial property uses at and in the vicinity of the Site. The HHRA is
documented in the Human Health Risk Assessment Report (HHRA Report; H&A, 2015).
The Consent Order uses the term “Site” to refer to the former General Mills property at 2010 East
Hennepin Avenue (Figures 1 and 2). This terminology is retained in this report, and thus references to the
Site are intended to refer only to the property at 2010 East Hennepin Avenue. General Mills investigated
soil, groundwater, and soil gas at the Site and at locations northeast, south, and southwest of the Site as
part of the VI pathway investigation and other investigations. These areas are collectively referred to in
this report as the Study Area. The Study Area is divided into four geographical regions, including the Site,
the Northeast Area, the Central Area, and the Southwest Area (Figure 2). For the purpose of this feasibility
study, the southeast portion of the Site is included in the Central Area as shown on Figure 2.

4
This feasibility study was completed for the Central Area for the reasons described in Section 1.1. By
preparing this study for the Central Area, General Mills does not acknowledge or agree that TCE impacts
in the Central Area or elsewhere in the Study Area are associated with its former operations at the Site.
1.1 Scope of Feasibility Study
The RAP Modification #1 provides that a feasibility study be performed, as necessary, to mitigate the VI
pathway potential and reduce VOC concentrations in soil, soil gas, and groundwater due to General Mills’
former operations at the Site. Feasibility study activities are focused on the Central Area, only a portion of
which may be down-gradient of the Site. The feasibility study does not include the Northeast Area, which
is located hydraulically up-gradient of the Site and where off-Site sources have impacted shallow
groundwater with TCE, or the Southwest Area, where the evidence indicates that TCE impacts in
groundwater are not related to General Mills’ former operations at the Site. As noted above, by preparing
this study for the Central Area, General Mills does not acknowledge or agree that TCE impacts in the
Central Area or elsewhere in the Study Area are associated with its former operations at the Site.
This feasibility study was completed in general accordance with the United States Environmental
Protection Agency (EPA) guidance document for conducting remedial investigations and feasibility studies
under the Comprehensive Environmental Response, Compensation, and Liability Act (CERCLA). Based on
EPA guidance, a feasibility study should either be scaled down, as appropriate to the site and its potential
hazard, or eliminated altogether if a risk assessment indicates that a site poses little or no threat to human
health or the environment (EPA, 1988). The HHRA prepared for the Study Area concluded that the only
exposure pathway that may be potentially complete and of potential significance is vapor intrusion of
VOCs from shallow groundwater in the Northeast Area. The HHRA concluded that exposure pathways in
other areas, including the Central Area, were currently either incomplete or insignificant and not expected
to be significant in the future. Therefore, the scope of the feasibility study will be substantially informed
by CERCLA and associated EPA guidance and includes feasibility study components as appropriate for
conditions at the Central Area.
Although off-Site sources are impacting shallow groundwater in the Central Area and the HHRA
concluded that exposure pathways in the Central Area are currently either incomplete or insignificant and
not expected to be significant in the future, this feasibility study was prepared for the Central Area at the
direction of MPCA in its letter that provided comments to the VIPI Report (MPCA, 2015a).
TCE from one or more potential releases up-gradient of the Central Area are the predominant cause of
TCE concentrations in groundwater. Groundwater impacts up-gradient of the Central Area and the Site
are outside of the scope of this feasibility study. Until the extent and magnitude of the impacts associated
with the off-Site sources are defined and addressed, remedial action to address groundwater will not be
effective at reducing TCE concentrations in groundwater in the Central Area due to continuing re-
contamination from these up-gradient sources. It is assumed for the purposes of this feasibility study that
off-Site sources will be investigated and addressed by others.

5
The scope of work for the VI pathway feasibility study included the following tasks which are described in
the indicated report sections:
Summarizing site characterization information – Section 2.0;
Discussing regulatory considerations – Section 3.0;
Screening available remedial technologies – Section 4.0;
Developing remedial alternatives – Section 5.0;
Evaluating remedial alternatives – Section 6.0; and
Reporting results and summarizing conclusions – Section 7.0.

6
2.0 Site Characterization
This section summarizes the site characterization data collected to date. It provides background
information and summarizes investigation and response action work completed from the early 1980s to
the present. It presents the current understanding of the site conceptual model as it relates to the Central
Area and summarizes the HHRA.
2.1 Background
TCE, a widely used industrial and commercial solvent, is present in groundwater throughout the Study
Area with the highest concentrations measured up-gradient of the Site in the Northeast Area. The 700-
acre Mid-City Industrial neighborhood occupies the northeast portion of the Study Area. The Central Area
primarily includes residential properties intermixed with industrial and commercial properties.
A limited review of MPCA files in 2014 identified documented TCE releases to groundwater at several off-
Site properties and a review of various historic resources including city directories, fire insurance maps,
and regulatory database reports identified properties with potential solvent use and/or releases (Barr,
2015c). The approximate locations of these properties are shown on Figure 3.
Separately, in recognition that other sources of chlorinated solvents up-gradient and side-gradient of the
Site exist, MPCA is conducting soil, soil gas, and groundwater sampling in connection with SA249. In early
2015, MPCA completed a CERCLA pre-screening assessment for the purposes of listing SA249 on
Minnesota’s Permanent List of Priorities to conduct further investigations. Data collected to date by
MPCA at SA249 is summarized in Section 2.2 and the data was evaluated and incorporated into the site
conceptual model described in Section 2.3. The nature and extent of contamination from off-Site sources
in the Northeast Area have not yet been defined.
2.1.1 Central Area Setting
The Central Area is a primarily residential urban neighborhood covering approximately 40 acres. The
Central Area was first developed in the late 1800s with mature trees and tight road and alleyway spacing
consistent with development from this era. Within the Central Area there are 177 individual properties
(including the Site) with buildings covering approximately 8 acres and roads and alleyways covering
approximately 5 acres.
2.2 Previous Investigations and Response Action Activities
The VIPI Report provides an overview of the investigations and response actions completed by General
Mills (Barr, 2015c). Previous investigations and response actions conducted to date are summarized
chronologically below:
Multiple investigations have been conducted since the early 1980s to characterize soil and
groundwater conditions at and near the Site and the Central Area. The early investigations
detected VOCs, primarily benzene, toluene, ethyl benzene, and xylenes (BTEX) and, to a lesser
extent, chlorinated VOCs (cVOCs) including TCE, tetrachloroethylene (PCE), and 1,1,1-
7
trichloroethane (1,1,1-TCA) in soil and shallow groundwater in the southeastern corner of the Site
near a former disposal area. In contrast, TCE was the predominant constituent detected in
groundwater off-Site in the Central Area.
General Mills agreed to install and operate a groundwater extraction and treatment system
beginning in 1985 to limit the migration of TCE. The system was installed, operated, and
monitored as a groundwater remedial action under the Consent Order until 2010 when MPCA
suggested and then approved shutting down the system as the remedial objectives set forth in
the Consent Order had been met.
Once the remedial action objectives were met and the groundwater extraction and treatment
system was shut down, steps toward delisting the Site were initiated, including vapor intrusion,
potable water well, and surface water pathway evaluations. From 2011 into 2013, phased
investigations of shallow groundwater and soil gas were completed in accordance with MPCA-
approved work plans.
Sub-slab soil gas sampling and mitigation work began in November 2013 under MPCA oversight.
Sub-slab soil gas and/or indoor air sampling has been completed at 344 properties and SSD
systems have been installed at 189 properties since November 2013. The sub-slab soil gas
sampling results pointed to the likely existence of multiple TCE sources unrelated to the Site. This
work was completed in accordance with the RAP Modification #1 and is documented in the
Implementation Report (Barr, 2015b). The status of SSD systems in the Central Area is discussed
in Section 2.3.6.
In 2014, soil gas and groundwater investigation work was conducted under MPCA-approved work
plans at areas northeast, south, and southwest of the Site, and at the former disposal area on the
Site. TCE was detected in groundwater and soil gas at multiple locations northeast of the Site,
providing further evidence of the presence of off-Site TCE sources including sources up-gradient
of the Site (Barr, 2014b). No evidence of source material was found at the former disposal area at
the Site that could act as a continuing source of TCE to shallow groundwater (Barr, 2014c).
The VI pathway investigation was implemented in late 2014 and early 2015 under a work plan
approved by MPCA. The results of the investigation indicated that off-Site sources were
impacting TCE concentrations in groundwater and confirmed that the Site is not an ongoing
source of TCE to groundwater at concentrations that would contribute to the VI pathway in the
Study Area. The VIPI Report concluded that no current TCE source areas have been found on the
Site and that multiple sources in the Northeast Area, up-gradient of the Site, are the predominant
cause of TCE concentrations in groundwater in the Study Area (Barr, 2015c). Additionally, the VIPI
Report concluded that multiple potential sources of chlorinated solvents, unrelated to the Site,
exist throughout the Study Area. MPCA acknowledged multiple potential release sources of TCE
in the vicinity of the Site in its letter that provided comments to the VIPI Report and has started
investigating those potential sources (MPCA, 2015a).

8
A HHRA was prepared in 2015 to evaluate exposures to soil, groundwater, and indoor air
associated with residential and commercial property uses in the Study Area (H&A, 2015). The
HHRA is summarized in Section 2.4.
Sentinel vapor monitoring points and new groundwater monitoring wells were installed at the
Study Area in late 2014. Quarterly sampling of the sentinel monitoring network was completed in
December 2014, March 2015, June 2015, and September 2015. The results were documented in
the 2015 Sentinel Monitoring Network Report (2015 Sentinel Report; Barr, 2015d). The results
showed that the sentinel monitoring network locations are positioned appropriately to measure
changes in soil gas or groundwater concentrations at the perimeter of the soil gas monitoring
area developed for this project. The sentinel monitoring results collected to date indicate that
sources in the Northeast Area continue to impact the Central Area. The highest TCE
concentrations in soil gas and groundwater are detected at locations up-gradient and side-
gradient of the Site. The 2015 Sentinel Report recommended collecting an additional four
quarters of samples from the sentinel monitoring network beginning in the first quarter of 2016.
MPCA approved the 2015 Sentinel Report and concurred with the recommendation for another
four quarters of sampling in their letter, dated January 28, 2016 (MPCA, 2016).
In December 2015, Bay West LLC (Bay West), on behalf of MPCA, conducted an investigation
associated with SA249. Bay West installed 18 soil borings (SP-01 through SP-18) and six vapor
probes (VP-01 through VP-06) for the purposes of collecting soil, groundwater, and soil gas
samples for VOC analysis. The majority of the investigation locations were advanced in the
Northeast Area with several locations in the Central Area. Investigation results from SA249
indicate that sources in the Northeast Area continue to impact the Central Area and that multiple
sources may also be present in the Central Area. The highest TCE concentrations in soil gas and
groundwater were measured at locations up-gradient of the Site. TCE groundwater and soil gas
sampling results are shown on Figure 4.
Additionally, as described in the VIPI Report, several types of institutional controls (ICs) have been
implemented for protection of public health and the environment, limiting access to impacted soil and/or
groundwater at the Site and the Central Area to assure long-term protectiveness. The controls already in
place include a restrictive covenant that limits soil disturbance and groundwater use at the Site, and
required notification to the Minnesota Department of Health (MDH) of proposed groundwater well
construction, including water supply wells and wells or borings located in Special Well and Boring
Construction Areas, per Minnesota statutes and rules.
Sampling of the sentinel soil gas and groundwater monitoring network and glacial drift groundwater
monitoring network is planned for 2016 (Barr, 2015d; Barr, 2016).
2.3 Site Conceptual Model
The site conceptual model (SCM) for vapor intrusion in the Study Area presented in the VIPI Report has
been focused on the Central Area for purposes of this feasibility study and is further refined with data
collected from MPCA’s investigations associated with SA249 and sentinel monitoring conducted by Barr

9
on behalf of General Mills. The data collected to date indicates the presence of multiple TCE sources that
are impacting soil, groundwater, and soil gas in the Central Area. Information regarding documented
releases to groundwater and potential vapor sources, the physical characteristics of the area, the spatial
distribution of TCE, vapor transport mechanisms and migration pathways, potential receptors, and
mitigation measures installed as part of response actions completed by General Mills has been
incorporated into the discussion below.
2.3.1 Vapor Sources
As described previously, TCE was a commonly-used industrial and household solvent between the 1930s
and the 1990s and is still in use today. Documented releases of TCE to shallow groundwater are present
in the Northeast Area and potential users of TCE are present in the Central Area. The highest TCE
concentrations in groundwater in the glacial drift are present in the Northeast Area, which is hydraulically
up-gradient from the Central Area.
The extensive investigations conducted at the Site found no evidence of DNAPL or other source material
at or emanating from the Site. TCE is not detected in unsaturated soils at the Site, and only low
concentrations of TCE (less than 1 mg/kg) are reported in the soil below the water table near the former
disposal area based on recent investigations. These low concentrations are consistent with the dissolved
TCE measured in the shallow groundwater and do not indicate the presence of DNAPL or source material.
The Site is not an ongoing source of TCE to groundwater that would contribute to the potential vapor
intrusion pathway in the Central Area.
2.3.2 Geology and Hydrogeology
Glacial drift in the Central Area generally consists of heterogeneous fine- to medium-grained sand, with
lesser amounts of coarse sand and gravelly sand. In some locations, the sand and gravel deposits are
overlain by up to 20 feet of fill or peat. Glacial drift is underlain by discontinuous glacial till and/or shale
at the Central Area which together act as a confining unit. Groundwater within the glacial drift is present
at depths of 15 to 25 feet below ground surface (bgs). The shallow groundwater flow direction is and has
consistently been to the southwest, with little to no seasonal variation, since at least the early 1980s,
including the periods before and during the 25-year operating period of the legacy groundwater
extraction system. The groundwater flow direction and gradient are influenced locally by the saturated
thickness of the glacial drift above the glacial till and/or bedrock and other factors including: hydraulic
conductivity distribution, surface topography, and drainage features such as the Mississippi River.
Groundwater from the Northeast Area flows to the southwest into the Central Area.
2.3.3 Spatial Distribution of Contaminants
TCE is present in groundwater at various locations and varying concentrations within the Central Area.
The varying distribution, presence, and concentrations of TCE within the Central Area indicate multiple
sources. The TCE concentrations in groundwater in the Northeast Area are higher than concentrations in
the Central Area. The magnitude and extent of TCE in the groundwater in the Northeast Area are
undefined and the presence of DNAPL and other continuing sources of TCE to groundwater in the
10
Northeast Area are unknown. The down-gradient extent of TCE in groundwater is defined in the Central
Area.
2.3.4 Potential Receptors
The land use in the Central Area is primarily single- and multi-family residential development with some
interspersed commercial and industrial properties. Commercial and industrial buildings are the primary
land use at the Site and at several properties along Como Avenue SE. There are currently 14 buildings
present at the Site that are numbered Buildings 1 through 12, 14, and 15. Some buildings at the Site have
basements or crawlspaces, while others are slab-on-grade construction. Observed building slab
thicknesses at the Site ranged from 4 to 24 inches. The basement floor slabs of the residential properties
in the Central Area are typically 10 feet or more above the groundwater table.
Based on these land uses the following populations of receptors would be expected to reside or work
within the Central Area:
Long term residents, including young children, older children, adults and elderly adults;
Short term residents, including occupants of rental properties such as college students;
Commercial workers such as employees at commercial and industrial establishments; and
Visitors and patrons.
2.3.5 Vapor Transport Mechanisms
Based on the results of the various investigations conducted to date, the primary transport mechanism for
soil vapor within the Central Area is diffusion of vapors from groundwater into the shallow glacial drift.
Diffusion of vapors from groundwater occurs as a result of a concentration gradient between the
groundwater and the soil gas in the overlying glacial drift.
Vapor migration through preferential pathways may occur via natural and man-made pathways in the
subsurface (e.g., buried utilities) such that the feature creates a pathway from a source to a receptor.
Although utility plans indicate that sanitary sewers and other utilities are present, this potential pathway is
unlikely since the utility bedding materials are likely similar to the native sandy unsaturated zone soils. In
addition, no preferential pathways were identified based on the results of the extensive sub-slab soil gas
sampling performed throughout the Study Area.
2.3.6 Building Vapor Mitigation
Building mitigation systems, specifically active SSD systems, have been installed at 166 of the 177
properties in the Central Area (94 percent) as part of the sub-slab soil gas sampling and mitigation
project. The SSD systems are operating as designed and are considered by MPCA and EPA to be among
the most effective vapor intrusion mitigation strategies for existing or new buildings (MPCA, 2010; EPA,
2015). Additionally, post-mitigation indoor air sampling was performed at the 19 properties in the Central
Area with sub-slab soil gas TCE results greater than 2,000 g/m3 (Barr, 2015b). This sampling confirmed

11
that the SSD systems were operating effectively at properties with the highest TCE concentrations in sub-
slab soil gas. The current status of building mitigation in the Central Area and the larger Study Area is
shown on Figure 5. Information regarding the 11 properties in the Central Area that do not have SSD
systems is provided below.
2.3.6.1 Central Area Building Mitigation Status
Of the 11 properties in the Central Area that do not have active SSD systems, three properties (including
the Site) had indoor air sampling results below the applicable MPCA intrusion screening value (ISV), three
property owners declined SSD systems, and owners of five properties could not be reached or did not
provide access to participate in the sub-slab soil gas sampling and mitigation project.
Indoor air sampling was performed at five buildings (Buildings 8, 10, 11, 12, and 14) located at the Site
where at least one sub-slab soil gas sample had a reported TCE concentration greater than 60 g/m3 (10
times the industrial ISV). Reported TCE concentrations in indoor air were below the applicable ISV for all
samples collected (Barr, 2015a). Two residential properties in the Central Area had two rounds of indoor
air sampling with reported TCE concentrations in indoor air below the residential ISV (2.0 g/m3) for both
sampling events. Additionally, the owner of one of the two properties declined the installation of an
active SSD system due to the presence of an existing passive SSD system for radon mitigation and
because indoor air results were below the residential ISV.
Reported sub-slab soil gas TCE concentrations were below 20g/m3 (10 times the residential ISV),
indicating the VI pathway is insignificant, at two of the three properties where owners declined SSD
systems. Owners of these two properties were offered SSD systems because they were bounded by
properties with reported sub-slab soil gas TCE concentrations greater than 20 g/m3. TCE was greater
than 20 g/m3 in sub-slab soil gas at the other property where the owner declined a SSD system. A
minimum of three, good-faith attempts were made to obtain access to install SSD systems at the three
properties and the properties were referred to MPCA when access was not obtained.
Owners of five properties in the Central Area could not be reached or did not provide access after a
minimum of three good-faith attempts were made to obtain access and entry to each property to collect
samples as part of the sub-slab soil gas and mitigation project. These properties were referred to MPCA.
2.4 Risk Assessment
MPCA recommended preparation of a comprehensive risk assessment for all exposure pathways in its
most recent Five-Year Review for the Site (MPCA, 2014b). The HHRA prepared for the Study Area by
Haley & Aldrich, Inc. on behalf of General Mills considered all potential exposure pathways, including soil,
groundwater, and vapor intrusion (H&A, 2015). Direct exposure pathways to soil were either incomplete
or insignificant based on soil data collected from the Study Area. Similarly, direct exposure pathways to
groundwater were incomplete because groundwater in the Study Area is not used as a source of potable
water. The vapor intrusion pathway was evaluated further, and the HHRA concluded that the only
exposure pathway that may be potentially complete and of potential significance is vapor intrusion of
VOCs from shallow groundwater in the Northeast Area. The HHRA concluded that exposure pathways in

12
other areas, including the Central Area, were currently either incomplete or insignificant and not expected
to be significant in the future.
The MPCA provided comments on the HHRA in their letter dated November 3, 2015, and MDH provided
comments in a letter from MPCA dated November 12, 2015 (MPCA, 2015a; MPCA, 2015b). Responses to
MPCA and MDH/MPCA comments are in the letters from General Mills and Haley & Aldrich, Inc. to MPCA
dated April 6, 2016 (GMI, 2016; H&A, 2016).

13
3.0 Regulatory Considerations
This section presents remedial action objectives (RAOs), identifies potentially applicable or relevant and
appropriate requirements (ARARs) and to-be-considered criteria (TBCs), and presents preliminary
remediation goals (PRGs) for the vapor intrusion pathway at the Central Area that is the subject of this
feasibility study. The remedial action objectives, potential ARARs and TBCs, and PRGs are based on the
understanding of Central Area conditions developed during the various investigations and response
actions that have been completed and the results of the HHRA.
3.1 Remedial Action Objectives
In general, the RAOs provide the goals for protecting human health and the environment. The RAOs
address the contaminants of concern (COCs) and potential exposure routes and receptors, and provide an
acceptable contaminant level or range of levels for each exposure route that exceeds threshold criteria for
protection of human health, as defined by CERCLA and the National Contingency Plan (NCP), to human
health or the environment. The RAOs are to be as specific as possible without limiting the range of
remedial alternatives that can be developed for screening and detailed analysis.
The HHRA prepared for the Study Area considered all current and potential (future) exposure pathways,
and focused on the vapor intrusion pathway for further evaluation. The HHRA concluded that exposure
pathways in the Central Area were currently either incomplete or insignificant and not expected to be
significant in the future. The RAO developed for the Central Area focuses on maintaining protectiveness of
human health and the environment. TCE is the primary COC and drives potential human health risk in the
Central Area.
Accordingly, the remedial action objective (RAO) for the Central Area is to maintain insignificant potential
risk to human health from inhalation exposure to TCE in indoor air resulting from TCE concentrations in
soil gas and groundwater. As stated in the RAP Modification #1, General Mills is responsible only for
implementing response actions to address impacts that are due to its former operations at the Site. By
preparing this feasibility study and developing this RAO, General Mills does not acknowledge or agree
that TCE impacts in the Central Area or elsewhere in the Study Area are associated with its former
operations at the Site.
3.2 ARARs and TBCs
The NCP provides that remedial action alternatives be assessed to evaluate whether they attain applicable
or relevant and appropriate requirements (ARARs) under federal and state environmental laws or facility
siting laws, or provide grounds for obtaining a waiver. In addition to ARARs, the identification and
evaluation of remedial action alternatives may consider, as appropriate, other advisories, criteria, or
guidelines, collectively called to-be-considered criteria (TBCs). The final acceptable exposure levels should
be determined on the basis of the results of the risk assessment and the evaluation of the expected
exposures and associated risks for each alternative (EPA, 1988).

14
3.2.1 Classification of ARARs and TBCs
ARARs and TBCs are classified as action-specific, location-specific, or chemical-specific in the evaluation
process:
Action-specific ARARs and TBCs are technology- or activity-based requirements or limitations on
actions or conditions. They establish performance, design, or other similar specific controls or
regulations on actions. Action-specific ARARs and TBCs potentially applicable to the Central Area
are identified in Table 1.
Location-specific ARARs and TBCs are those requirements that relate to the geographical location
of a site and restrict actions or contaminant concentrations in certain environmentally sensitive
areas. Examples of areas regulated under such ARARs and TBCs include floodplains, wetlands,
and locations where endangered species or historically significant cultural resources are present.
Location-specific ARARs and TBCs potentially applicable to the Central Area are identified in
Table 2.
Chemical-specific ARARs and TBCs are usually health- or risk-based numerical values or
methodologies used to calculate acceptable chemical concentrations that may be found in or
discharged to the environment. Chemical-specific ARARs and TBCs include those that regulate
the release to the environment of specific substances having certain chemical or physical
characteristics or materials containing specific chemical compounds. Chemical-specific ARARs
and TBCs potentially applicable to the Central Area are identified in Table 3.
3.3 Preliminary Remediation Goals
PRGs are developed on the basis of chemical-specific ARARs, when available, other available information,
and site-specific risk-related factors (EPA, 1988). PRGs serve as goals for the remedial action alternatives
and typically consist of chemical concentrations that are considered protective of human health and the
environment (chemical-specific PRGs). There are two general sources of chemical-specific PRGs: (1)
concentrations based on ARARs and TBCs (ARAR/TBC-based PRGs); and (2) concentrations based on a risk
assessment (risk-based PRGs). Where chemical-specific ARARs exist for a COC, these ARARs are the basis
of the PRG. Where chemical-specific ARARs are not available, risk-based or TBC-based PRGs are applied.
There are no chemical-specific ARARs available for TCE that are applicable to the vapor intrusion pathway.
Vapor intrusion guidance documents prepared by both EPA and MPCA contain risk-based, generic
screening values for TCE concentrations in indoor air (EPA, 2015; MPCA, 2008). MPCA’s intrusion
screening values (ISVs), which were developed in conjunction with MDH and are based on an incremental
cancer risk threshold of one in 100,000 (1 x 10⁻⁵) and a non-cancer hazard quotient of 1, guided the sub-
slab soil gas sampling and mitigation project. The current TCE ISV for residential property use is 2 g/m3
and the current TCE ISV for commercial or industrial property use is 6 g/m3. MDH considers the
residential ISV a safe level that protects all people from health effects and the commercial/industrial ISV a
safe level for people who may have exposures in the work place over many years (MDH, 2016a). MPCA
ISVs for TCE were selected as PRGs for indoor air.

15
In general, there is a relationship between VOC-impacted groundwater concentrations and VOC
concentrations in overlying soil gas. Many factors can influence the relationship including chemical-
specific characteristics (e.g., Henry’s Law Constant) and site-specific conditions such as subsurface geology
(e.g., soil type and stratification) and the presence of preferential pathways. EPA and MPCA vapor
intrusion guidance provide generic screening values for groundwater that can be useful in initial
evaluation stages to help define the magnitude and extent of potential vapor intrusion impacts. However,
MPCA guidance states that their groundwater screening values (groundwater ISVs) “are designed to be
used as an additional line of evidence to help refine the SCM and to help determine the scope of further
investigation, and should not be applied alone to screen out vapor intrusion risk at a site or for remedial
action levels” (MPCA, 2010). EPA guidance states that vapor intrusion screening levels for groundwater
are not intended to be used as cleanup levels (EPA, 2015). Accordingly, a specific concentration-based
groundwater PRG was not developed for this feasibility study.

16
4.0 Technology Screening
The objective of developing and screening remedial action technologies is to compile an appropriate
range of technologies and processes for the media and location(s) where remedial action(s) may occur.
Appropriate technologies and process options are then assembled into a range of remedial action
alternatives that are evaluated in the detailed analysis phase of the feasibility study. Appropriate remedial
technology processes that meet the RAOs may involve the elimination or destruction of hazardous
substances, the reduction of hazardous substance concentrations to acceptable health-based levels,
prevention of exposure to hazardous substances via engineering or institutional controls, or a
combination of the above. Remedial alternatives are developed by assembling technology processes into
alternatives that address impacts for the identified media and locations of concern.
4.1 Development of General Response Actions
General response actions are medium-specific actions that satisfy RAOs (EPA, 1988). Response actions
may target the TCE-impacted soil vapor itself and/or the shallow groundwater that acts as a source of the
TCE impacts in soil vapor. General response actions for mitigating risks posed by soil vapor may be
applied individually or in combination.
Potential response actions and their ability to achieve the RAO and the PRG are summarized as follows
and in Table 4.
No Further Action: No further action is evaluated as a basis for comparison during the feasibility
study process, even though it typically does not achieve the RAOs and PRGs at sites where no
response actions have been implemented. However, as noted previously, General Mills has
already implemented significant response actions in the Central Area including operation of a
groundwater extraction system for 25 years and installation of SSD systems at 94 percent of the
properties. No further action beyond previous response actions is retained for consideration.
Vapor Mitigation: Vapor mitigation involves installing and operating building controls, such as
SSD systems or control of HVAC systems to maintain positive pressure, to disconnect the VI
pathway on a property-specific basis. Currently, buildings at 166 of the 177 properties (94
percent) within the Central Area have active SSD systems. Vapor mitigation is retained as a
general response action.
Institutional Controls: Institutional Controls (ICs) are legal and administrative tools used to
maintain protection of human health and the environment at sites where exposure to
contaminated materials could occur. EPA defines institutional controls as “non engineered
instruments that help minimize the potential for human exposure to contamination and protect the
integrity of the remedy” (EPA, 2012). ICs are generally consolidated into the following four
categories:
o Government controls (e.g., zoning, local ordinances)

17
o Proprietary controls (e.g., easements, restrictive covenants)
o Enforcement and permit tools (e.g., consent decrees, administrative orders)
o Informational tools (e.g., notices filed in the land records, advisories)
ICs restrict access to contaminated media by notifying property owners, perspective property
purchasers, and workers of contamination. ICs help ensure the effectiveness of remedial actions
by limiting activities that could degrade the effectiveness of the remedy, by providing access for
regulatory agencies to monitor the effectiveness of the remedy, and by requiring periodic
reporting. Institutional controls were retained as a general response action.
Containment: Containment technologies consist of physical or hydraulic containment to provide
a barrier between impacted groundwater and overlying structures to disconnect the VI pathway.
Possible containment remedial technologies include installing a buried horizontal grout cap over
impacted groundwater and horizontal hydraulic barriers. Containment was not retained as a
general response action for the Central Area due to lack of implementability and uncertain
effectiveness.
Physical Removal: Physical removal involves removing impacted soil, groundwater and/or soil
vapor. Remedial technologies for this general response action include soil excavation, soil vapor
extraction systems, in-situ thermal treatment, and groundwater extraction and treatment.
Physical removal has previously been implemented in the Central Area via operation of the legacy
groundwater extraction system and the reported excavation of the disposal area in 1981 (Barr,
2015c). Vapor extraction and in-situ thermal treatment were not retained due to the limited
radius of influence and access limitations. Soil excavation was not retained due to access
limitations and lack of source material. Expansion or modification of the groundwater extraction
system was retained as a general response action.
Biological: This general response action involves using biological processes, enhanced or natural,
to remediate impacted groundwater (bioremediation). Remedial technologies for biological
treatment vary, but may include monitored natural attenuation (MNA), phyto-remediation, and
various in-situ amendments to promote/support bioremediation. Several biological processes
have been effective for remediating TCE-impacted groundwater under appropriate conditions,
including: enhanced reductive dechlorination, aerobic co-metabolism, and biogeochemical
processes. Each of the biological processes occurs under different conditions, but the processes
can occur simultaneously within an impacted area or at different times with varying subsurface
conditions. Biological treatment was retained as a general response action.
Chemical: Chemical technologies involve adding chemicals to the subsurface that cause reactions
that destroy the chemical of concern. Chemical technologies are primarily composed of in-situ
chemical oxidation (ISCO), which uses a strong oxidant or in-situ chemical reduction (ISCR), which
uses a strong reducing agent. ISCO and ISCR have been used effectively at locations with high
TCE concentrations (e.g., source areas) but have not been used at locations with low-level
18
groundwater concentrations over a large area like the Central Area. Chemical treatment was not
retained as a general response action due to lack of implementability and unlikely effectiveness.
Electrical: Electrical technologies involve applying a voltage via an array (similar to a reactive
barrier) to electrically break down contaminants within the groundwater. This technology is still in
development and its effectiveness is unknown at locations similar in size to the Central Area.
Electrical treatment was not retained as a general response action due to unproven effectiveness
and lack of implementability.
4.2 Evaluation and Screening of Technologies
In this section, the general response actions that are retained in Section 4.1 for further evaluation are
subdivided into remedial technologies and are further screened. Descriptions of the retained remedial
technologies and associated process options are discussed in Section 4.3.
Remedial technologies are general categories of technologies within a general response action, and
process options are specific processes within a technology category. For example, in-situ bioremediation
and monitored natural attenuation are two remedial technology categories within the biological general
response action. Aerobic co-metabolism via injection wells and enhanced reductive dechlorination via
injection wells are two process options within the remedial technology category of in-situ bioremediation.
Potentially viable technologies and associated process options for each retained general response action
are summarized in Table 4. The potentially viable technologies and associated process options were then
screened based on effectiveness, implementability, and relative cost as required by the NCP. These
screening criteria are defined as follows:
Effectiveness: the ability of the remedial technology or process option to perform adequately to
achieve the RAO(s) alone or as part of an overall system. The evaluation considered whether the
remedial technology or process option has demonstrated effectiveness at other TCE-impacted
sites similar to the Central Area.
Implementability: the degree of difficulty expected in implementing a particular remedial
technology or process option under practical technical, regulatory, and access limitations and
schedule constraints. The evaluation considered whether the remedial technology or process
option has been implemented at other locations with similar technical, regulatory, and logistical
constraints.
Relative Cost: qualitative costs of each remedial technology or process option were developed
for comparative purposes and include construction and long-term O&M costs. The comparison
of relative cost is used to preclude further evaluation of technologies that are very costly where
other choices perform similar functions with comparable effectiveness at a lower cost. Relative
cost was assigned to each remedial technology for this evaluation; however, relative cost was not
used as a rationale to screen out a remedial technology or process option.

19
Screening was based on professional experience and judgment; published sources; knowledge of
chemical, geologic, and physical conditions in the Central Area; and experience with the previous
implementation of remedial actions in the Central Area.
4.3 Retained Technologies
Retained technologies were reviewed based upon effectiveness, implementability, and relative cost as
described within Section 4.2. Relative cost was not used to screen out remedial technologies during this
evaluation. A short description of each retained technology and its associated process options as applied
to the Central Area follows.
Install SSD Systems at Un-Mitigated Residences in the Central Area
This remedial technology involves installing mitigation systems at the remaining residences in the Central
Area without mitigation systems, provided receipt of property owner consent. Process options include
active SSD systems or positive pressure HVAC systems designed to provide a pressure barrier for sub-slab
vapors to enter the buildings. Active SSD systems are retained as the process option for this technology.
Operation and Maintenance (O&M) of SSD Systems
This remedial technology requires an O&M plan (process option) to be developed and implemented for
SSD systems within the Central Area. The objective of this plan will be to help ensure that the SSD
systems continue to disconnect the VI pathway by remaining functional over time. In addition, the SSD
systems will remain operational until they are no longer needed (e.g., sub-slab soil gas concentrations are
below risk-based levels). This process option is retained for further evaluation.
Institutional Controls Pertaining to SSD Systems
The process option for this remedial technology is area-wide institutional controls (ICs) pertaining to
active SSD systems. The ICs can be developed as a city-wide ordinance or other area-wide control, which
will require regulatory cooperation. ICs may be a component of an O&M plan. This process option is
retained for further evaluation.
Expanded/Modified Groundwater Extraction
This remedial technology has been implemented previously at the Central Area. Both process options for
this remedial technology involve removal of the contaminated groundwater via submersible pumps. The
removed groundwater will be treated and discharged to the storm sewer of via an existing, or separately
acquired, National Pollution Discharge Elimination System (NPDES) permit (process option 1) or the
contaminated groundwater will be treated and reinjected into the subsurface (process option 2). Both
process options are retained for further evaluation.
Monitored Natural Attenuation
The process option of this remedial technology is to allow the native microorganisms and natural
processes to reduce TCE concentrations and associated daughter products and to monitor the progress.

20
This process option can be achieved by developing and implementing a groundwater monitoring well
network and associated sampling plan. This process option is retained for further evaluation.
In Situ Bioremediation
Various in situ bioremediation process options exist. Process options using permeable reactive barriers
(PRBs) were not retained due to lack of implementability (limited access within the Central Area) and bio-
geochemical process options were not retained due to uncertain effectiveness (unlikely that the aquifer
matrix will support the chemical processes) and lack of implementability (engineered geochemical process
alternatives typically involve constructing PRBs). Aerobic co-metabolism via injection wells and enhanced
reductive dechlorination via injection wells are the process options retained for further evaluation. Both
process options require injection of a carbon substrate into the glacial drift groundwater. Aerobic co-
metabolism has an additional requirement of adding oxygen to the groundwater along with the carbon
substrate.

21
5.0 Development of Remedial Alternatives
Remedial technologies and associated process options that were retained for alternative development in
Section 4.0 are combined to form comprehensive remedial action alternatives. Assembly of alternatives
provides a method of identifying and screening the inter-relationships between remedial technologies
and process options applicable to the Central Area. Five alternatives are described in the following
sections.
Natural attenuation of TCE in groundwater will occur during all alternatives which leads to a reduction in
TCE concentrations over time. Additionally, the SSD systems previously installed in the Central Area will
continue to provide protection from vapor intrusion. These aspects will not be discussed in detail below.
5.1 Alternative 1 – No Further Action Beyond Previous Response
Actions
No further action includes no additional work beyond the past operation of the legacy groundwater
extraction system, previous installation of SSD systems, and existing institutional controls (ICs) already
implemented.
General Mills installed a groundwater extraction and treatment system in 1985 and operated the system
until 2010. The system was installed, operated, and monitored to limit the migration of TCE in
groundwater and reduce concentrations of TCE in groundwater as a remedial action under the Consent
Order. Approximately six billion gallons of groundwater were treated and an estimated 7,000 pounds of
TCE were removed from the glacial drift and deeper bedrock aquifers (Barr, 2015c). The system was shut
down in 2010 with approval from the MPCA.
As described in Section 2.3.6, active SSD systems have been installed at 166 of the 177 properties in the
Central Area. Additional detail regarding the sub-slab soil gas sampling and building mitigation work can
be found in the Implementation Report (Barr, 2015b).
Several types of ICs have been implemented for protection of public health and the environment, limiting
access to impacted soil and/or groundwater at the Site and the Study Area to assure long-term
protectiveness, as described in Section 2.2.
5.2 Alternative 2 – Monitored Natural Attenuation
Monitored natural attenuation (MNA) includes developing and implementing a groundwater monitoring
plan that will assess natural degradation of TCE. The groundwater monitoring plan will use the existing
groundwater monitoring well network (see Figure 6) and will include sampling for TCE, TCE daughter
compounds (e.g. dichloroethene, vinyl chloride, methane), electron acceptors (e.g., iron, manganese,
nitrate, sulfate, dissolved oxygen) and general chemistry parameters (e.g., total organic carbon, alkalinity,
hardness, pH). The suite of parameters was developed to be consistent with the parameters
recommended for evaluating MNA (EPA, 1998). It is assumed that VOC sampling (for TCE and daughter
compounds) will be conducted annually at 25 wells and that the full suite of MNA parameters will be

22
analyzed at samples collected from 10 wells within the monitoring well network. A report summarizing
the results of the monitoring will be provided to MPCA annually. The objective of this alternative is to
monitor natural processes within the glacial drift groundwater that act to decrease contaminants to levels
that would eliminate the need for SSD systems in the Central Area.
5.3 Alternative 3 – Long Term O&M of SSD Systems
Alternative 3 includes preparing a long-term O&M plan that would detail routine monitoring and
maintenance of the SSD systems in the Central Area. This alternative assumes that residences within the
Central Area have, or will have installed, a functioning SSD system (assuming cooperation from property
owners).
Initial Installation/Sampling
Alternative 3 includes installing active SSD systems at the 10 remaining residential properties within the
Central Area that do not currently have an active SSD system, provided property owner consent and
coordination. SSD system installation will include coordinating access, diagnostic testing, designing the
system for each property, installing the system, and evaluating initial performance, consistent with the
existing work plan (Barr, 2014a).
Alternative 3 also assumes that subsequent indoor air and sub-slab soil gas sampling will be conducted at
five commercial buildings (Buildings 8, 10, 11, 12, and 14) at the Site. Based on the indoor air results
collected to date, it is assumed that indoor air TCE results will be below the applicable ISV and that
installation of SSD systems at the five buildings will be unnecessary. However, if the applicable TCE ISV is
exceeded during the additional sampling, and assuming cooperation of the property owner, SSD systems
would be installed at one or more of the five buildings, as appropriate.
Operations and Monitoring
Alternative 3 includes preparing and implementing a long-term O&M plan for the SSD systems within the
Central Area. The developed O&M plan would include the methods and procedures to verify fan
operation, visually inspect the vent pipe, and visually inspect the manometer pressure gage. For the
purposes of this feasibility study, Alternative 3 assumes that the inspections would be completed by the
property owners with support provided by a technical resource on operation of SSD systems and support
provided for coordination and communication with contractors for routine maintenance. Due to the
demonstrated long-term reliability and simple operation of the SSD systems, it was assumed that visual
inspections completed by the property owners would be the least intrusive option to monitor the SSD
systems. On the rare occasion that maintenance is required, it was assumed that access would be
coordinated for an engineer and/or contractor to inspect and complete routine maintenance (e.g., fan
replacement). Additionally, a city ordinance could be developed to provide requirements for disclosure of
property-specific vapor data and existence of SSD systems in connection with property transactions.

23
5.4 Alternative 4 – Enhanced Bioremediation via Injection Events
Alternative 4 involves installing injection wells within the rights-of-way, delivering carbon substrate and
other amendments to promote enhanced biodegradation of TCE in the glacial drift groundwater, and
conducting performance monitoring. Access to rights-of-way is contingent upon negotiations with right-
of-way administrators (e.g. City of Minneapolis and the railroad). There is uncertainty associated with the
ability to gain access for the purposes of installing injection wells and delivering amendment. Subsurface
conditions, access limitations, and technology limitations provide significant uncertainty regarding the
effectiveness of Alternative 4. The appropriate substrate and amendment dosing would need to be
evaluated during the design phase, if selected.
Injection Well Construction and Initial Amendment Delivery
Alternative 4 includes construction of approximately 40 injection wells as tentatively shown on Figure 7.
The injection well locations were designed along transects perpendicular to groundwater flow along the
railroad tracks or road rights-of-way that provide the greatest access and space for injection well
installation. The injection well spacing was based on the anticipated radius of influence that could be
achieved with a fully penetrating well in the glacial drift, estimated hydraulic conductivity ranging from 20
meters per day (m/day) to 100 m/day, injection rates ranging from 25 gallons per minute (gpm) to 50
gpm, and limiting groundwater mounding adjacent to the injection wells below the depth of utilities and
basements. There is uncertainty regarding the radius of influence that could be achieved and injection
well spacing would be determined during the design phase. There is the potential that the radius of
influence varies significantly and delivery will not be successfully applied to significant portions of the
Central Area with limited access. It is assumed that reductive dechlorination would be the primary
biological process adjacent to the injection wells. The aerobic co-metabolic process would likely occur
near the periphery and other biogeochemical processes would occur as conditions are suitable.
Many factors influence the amount of carbon substrate required to create reducing conditions in the
aquifer supportive of anaerobic reductive dechlorination. Factors that significantly affect the estimated
quantity of substrate required include: natural demand from competing electron acceptors within the
aquifer (e.g., naturally occurring sulfate), the design period or treatment timeframe, and the design or
safety factor employed. The natural demand from the aquifer has been estimated based on site-specific
dissolved phase concentrations of major competing electron acceptors using a substrate estimating tool
(Parsons, 2010b). The design period and design factor can vary by amendment type and injection
program. A sensitivity analysis was performed using a range of recommended design periods and design
factor values (Parsons, 2010a). Results of the sensitivity analysis are presented in Table 5. Based on the
sensitivity analysis, it is estimated for the purposes of this feasibility study that approximately seven
million pounds of carbon substrate would be required for treatment of the Central Area. Emulsified
vegetable oil was selected as the carbon substrate based on its longevity in the subsurface for quantity
and cost estimating purposes; however, there is significant uncertainty regarding the carbon substrate
type and amendments that would perform most effectively.

24
Operations and Monitoring
For the purposes of this feasibility study, Alternative 4 assumes that the majority of the carbon substrate
and amendments will be delivered during initial injections and that the substrate will be distributed across
the treatment area via natural advective flow. However, there is significant uncertainty regarding
substrate distribution in the subsurface. Thus, the behavior of substrate distribution would need to be
evaluated as part of the design stage. Subsequent injections are assumed to occur periodically for three
years at the injection well network installed for the initial injection. Performance monitoring is included to
identify locations that would need subsequent injection.
After three years of injection at the initial injection wells, it is assumed that additional wells would be
needed to target specific locations within the Central Area where substrate delivery may have been
limited by natural advective flow. For the purposes of this feasibility study, Alternative 4 assumes that 20
new injection wells would be installed at locations to be identified during performance monitoring
conducted during the first three years. It is assumed that a higher initial dose would be used at the 20
additional wells, followed by subsequent injections for three additional years consistent with the initial
injection procedures.
5.5 Alternative 5 – Enhanced Bioremediation via Recirculating
System
Similar to Alternative 4, Alternative 5 involves installing injection wells within the rights-of-way for carbon
substrate delivery to the aquifer to promote biodegradation of TCE in the glacial drift groundwater. In
contrast to Alternative 4, Alternative 5 uses extraction wells within the Central Area and conveyance piping
to recirculate the amended groundwater within the Central Area. Alternative 5 also includes constructing
treatment control buildings where the extracted groundwater would be amended prior to reinjection and
assumes that access for treatment control buildings can be obtained within the Central Area. Given the
density of residential development in the Central Area, the treatment control buildings are assumed to
require two typical lots for construction of each treatment control building. There is significant
uncertainty regarding the ability to obtain access for the treatment control buildings. Access to rights-of-
way for injection well installation is contingent upon negotiations with right-of-way administrators (City of
Minneapolis and the railroad). There is uncertainty associated with the ability to gain access to install the
injection wells and piping. Subsurface conditions, access limitations, and technology limitations provide
significant uncertainty regarding the effectiveness of Alternative 5. The appropriate substrate and
amendment dosing that would be required would need to be evaluated during the design phase.
The recirculation system would have the flexibility to deliver high concentration solutions of carbon
substrate and other amendments at the beginning of operations while also having the ability to add
smaller quantities of amendments during recirculation. This functionality allows for amendment
distribution in the subsurface to be more precisely controlled than with Alternative 4; however, there is
significant uncertainty regarding the degree to which substrate distribution could be controlled. As with
Alternative 4, the behavior of substrate distribution would need to be evaluated during the design phase.
The recirculation system would have functionality to switch from promoting anaerobic conditions to
promoting aerobic conditions in the aquifer as necessary to promote the reductive dechlorination or the

25
aerobic co-metabolic process, respectively. Assumptions and costs for construction of appropriate
treatment facilities, maintenance to the system and wells, design phase considerations, performing
supplemental amendment delivery, and performance monitoring are all included within Alternative 5 as
discussed below.
Full Scale Recirculation System Construction and Initial Amendment Delivery
For purposes of this feasibility study, Alternative 5 assumes constructing 40 injection wells as conceptually
shown on Figure 8, constructing two new extraction wells and connecting to four existing extraction wells,
constructing conveyance piping, and constructing treatment control buildings that would contain pumps,
piping, valves, instrumentation, and controls. The treatment control buildings are assumed to be 3,500
square feet in size and constructed similar to a warehouse to provide sufficient capacity for tanks, pumps,
piping, and controls. Extraction well spacing is based on previous performance of the legacy groundwater
extraction system. The injection well locations were designed along transects perpendicular to
groundwater flow along the railroad tracks or road rights-of-way that provide the greatest access and
space for injection well installation. The injection well spacing is based on the anticipated radius of
influence that could be achieved with a fully penetrating well in the glacial drift unit, estimated hydraulic
conductivity ranging from 20 m/day to 100 m/day, injection rates ranging from 25 to 50 GPM, and
limiting groundwater mounding adjacent to the injection wells to depths below utilities and basements.
There is uncertainty regarding the achievable radius of influence; as such injection well spacing and
injection rate would need to be evaluated during the design phase.
Given the greater control and ability to adjust to conditions observed during implementation, it is
unknown what amendments would be added for Alternative 5. The recirculation system for Alternative 5
could be operated to promote either anaerobic reductive dechlorination or aerobic co-metabolic
processes. For preparing cost estimates, it was assumed that a carbon substrate of a similar dose to
Alternative 4 would initially be applied and that subsequent operations could be adjusted to maintain
reducing conditions or modified to promote aerobic co-metabolic degradation. Selection of the
dominant biological process and dosing requirements would be determined during the design phase.
Operations and Monitoring
For the purposes of this feasibility study, Alternative 5 assumes an initial injection of amendments
followed by operation of the recirculation system for up to 10 years. The first five years of operations will
include performance monitoring and system modifications based on conditions measured at the
treatment control buildings and at monitoring wells located within the Central Area. The recirculation
system would have the flexibility to adjust amendment type and dosing rates and would be operated by a
full-time operator to maximize the effectiveness of treatment.
Following five years of treatment, it is assumed that a sufficient amount of amendment would have been
delivered throughout the Central Area and the system would operate primarily for recirculation of
groundwater to promote uniform treatment across the Central Area.

26
6.0 Detailed Analysis of Alternatives
This section presents the detailed analysis of the remedial alternatives described in Section 5.0. The
purpose of the detailed analysis is to gather sufficient information to adequately compare the alternatives
and select a remedy.
6.1 Detailed Analysis Overview
The detailed analysis of the five alternatives consists of the following three components: 1) further
definition of each alternative with respect to volumes or areas of contaminated media to be addressed,
the technologies to be used, and the primary performance requirements associated with those
technologies; 2) an assessment and a summary of each alternative against the evaluation criteria; and 3) a
comparative analysis among the alternatives to assess the relative performance of each alternative with
respect to each evaluation criteria.
6.1.1 Alternative Definition
Each alternative was reviewed to determine if additional definition was required to apply the evaluation
criteria consistently and appropriately and to develop order-of-magnitude cost estimates. Information
considered to refine the alternatives consisted of preliminary design concepts and an evaluation of the
limitations, assumptions, and uncertainties associated with each alternative. An important factor in the
decisions was to provide a reasonable set of design assumptions for each alternative sufficient to provide
a reasonable detailed analysis.
6.1.2 Evaluation Criteria
EPA has established evaluation criteria to address the technical and policy considerations that have
proven to be important for selecting remedial alternatives. These criteria serve as the basis for conducting
the detailed analyses of the feasibility study and for subsequently selecting a remedial action. EPA
evaluation criteria are divided into the following three groups:
threshold criteria,
balancing criteria, and
modifying criteria.
In addition to the EPA evaluation criteria, this analysis evaluates additional considerations with the
potential to impact the community.
6.1.2.1 Threshold Criteria
Threshold criteria are defined as statutory requirements that each alternative must satisfy to be eligible for
selection.
Overall Protection of Human Health and the Environment – This criteria draws on assessments conducted
under other criteria, especially long-term effectiveness and permanence, short-term effectiveness,

27
compliance with ARARs and consideration of TBCs. It focuses on whether the alternative meets the RAO
and PRG and describes how risks are eliminated, reduced, or controlled.
As detailed in Section 2.4, a risk assessment was completed to evaluate potential risk to human health
(H&A, 2015). The risk assessment concluded that the exposure pathways in the Central Area were
currently either incomplete or insignificant and not expected to be significant in the future. Accordingly,
overall protection of human health and the environment is assessed by evaluating the additional
protection offered by each alternative compared to the no further action alternative (Alternative 1).
Radon is a naturally occurring radioactive gas that is present in shallow soils in Minnesota. While not
evaluated as part of this feasibility study, the SSD systems installed by General Mills also provides
protection to human health from radon. SSD systems are considered by MDH to be an effective
technology for mitigating radon and operate for many years with minimal maintenance requirements
(MDH, 2016b).
Compliance with ARARs – This evaluation criterion is used to evaluate whether the alternative complies
with federal, state, and local ARARs. It also addresses other information from advisories, criteria, and
guidance that is “to be considered” in the detailed analysis of an alternative.
6.1.2.2 Balancing Criteria
Balancing criteria are technical criteria upon which the detailed analysis is primarily based. The
assessment of the technical balancing criteria informs the assessment of the threshold criteria, modifying
criteria, and additional considerations.
Long-Term Effectiveness and Permanence – This assessment evaluates the long-term effectiveness and
permanence of the alternative in maintaining protection of human health and the environment after
response objectives have been met.
Reduction of Toxicity, Mobility, or Volume through Treatment – This assessment evaluates the anticipated
performance of the specific treatment technologies an alternative may employ.
Short-Term Effectiveness – This assessment evaluates the effectiveness of the alternative in protecting
human health and the environment during construction and implementation of a remedy until response
objectives have been met.
Implementability – This assessment evaluates the technical and administrative feasibility of the alternative
and the availability of required goods and services.
Cost – This assessment evaluates the capital and O&M costs of the alternative. The cost estimate is
prepared to an accuracy of plus 50 to minus 30 percent with the exception of those items noted to have
greater uncertainty. Anticipated accuracy range for FS cost estimates is consistent with EPA guidance
(EPA, 1988). This accuracy range is associated with the most likely cost of the project based on the level
of design that has been completed and the uncertainties in the project as scoped (e.g., quantity
uncertainties for wells and other capital cost items, pricing changes for amendments, variability in project

28
schedule/phasing, etc.). It does not include costs for future scope changes that are not part of the
planned project or risk contingency (e.g., additional media cleanup, change in technologies, new
contaminants of concern or expanded treatment areas, etc.). The present worth estimate is calculated
assuming a discount rate of 7 percent and a timeframe of 30 years. Supporting cost details for each
alternative are provided in Appendix A.
6.1.2.3 Modifying Criteria
Modifying criteria evaluate state and community acceptance of implemented remedial actions.
Assessments of the modifying criteria are not provided in this detailed analysis and will be completed
after the public comment period. The assessment of balancing criteria and additional considerations are
intended to inform the evaluation of state and community acceptance.
State Acceptance – This assessment reflects the state’s (or support agency’s) apparent preferences among
or concerns about alternatives.
Community Acceptance – This assessment reflects the community’s apparent preference among or
concerns about alternatives.
6.1.2.4 Additional Considerations
Additional considerations could be threshold or balancing criteria, but are evaluated separately in this
feasibility study to provide further details on distinct items with the potential to impact the community.
The assessment of threshold and balancing criteria incorporates the assessment of the additional
considerations.
Incremental Reduction in Vapor Intrusion Risk – This assessment provides a comparison of the reduction
in vapor intrusion risk associated with implementation of each remedial alternative relative to Alternative
1 (no further action beyond previous response actions).
Secondary Impacts – This assessment evaluates potential secondary impacts of implementing the
remedial alternative. In some cases, the risk of secondary impacts may be greater than the vapor
intrusion risk. Secondary impacts are considered during the evaluation of short-term effectiveness.
Sustainability – This assessment provides a comparison of sustainability impacts (e.g., greenhouse gas
impacts, energy footprint, and worker injury risk) associated with implementing each remedial alternative
relative to Alternative 1 (no further action beyond previous response actions). SiteWise™, a tool
developed for green and sustainable remediation, was the assessment method used to estimate
sustainability impacts. SiteWise™ estimates sustainability metrics by considering impacts associated with
the production of materials used in the remedy, transportation of personnel and equipment, equipment
use (e.g., pumps), and residual handling (e.g., waste disposal) throughout each phase of the remedial
action including construction, operation, and long-term monitoring. Further information regarding the
sustainability impacts evaluation is in Appendix B.

29
Construction Time – This assessment provides an estimate of the time required to implement the remedial
alternative.
6.1.3 Comparative Analysis of Alternatives
A comparative analysis of alternatives is conducted to evaluate the performance of each alternative
relative to the specific evaluation criteria and to identify the relative advantages and disadvantages of
each alternative. The comparative analysis of alternatives is summarized in Table 6.
6.2 Detailed Analysis of Remedial Alternatives
The alternatives described in Section 5.0 of this report are evaluated in detail using the evaluation criteria
presented in Section 6.1.2.
6.2.1 Alternative 1 – No Further Action Beyond Previous Response Actions
Alternative 1 includes no further action beyond the already-completed installation and operation of the
legacy groundwater extraction system, installation of the existing SSD systems, and existing institutional
controls already implemented. Natural attenuation of TCE in groundwater will occur as part of all
alternatives, including Alternative 1, which leads to a reduction in TCE concentrations over time.
6.2.1.1 Alternative 1 – Threshold Criteria
Overall Protection of Human Health and the Environment – Operation of the legacy groundwater
extraction system reduced TCE concentrations in groundwater in the Central Area. Installation of SSD
systems reduced potential exposure to TCE resulting from vapor intrusion. Significant effort has been
completed through installation and operation of these systems to protect human health and the
environment. The HHRA concluded that the exposure pathways in the Central Area were currently either
incomplete or insignificant and not expected to be significant in the future (H&A, 2015).
Compliance with ARARs – Alternative 1 would comply with chemical-, action-, and location-specific
ARARs.
6.2.1.2 Alternative 1 – Balancing Criteria
Long-Term Effectiveness and Permanence – SSD systems have a demonstrated track record of reliable
long-term performance. Alternative 1 does not include a systematic plan for O&M of the SSD systems to
verify and maintain long-term performance. Over the long term, natural attenuation processes will
eventually reduce TCE concentrations in groundwater.
Reduction of Toxicity, Mobility, or Volume through Treatment – The legacy groundwater extraction system
provided significant reduction in toxicity, mobility, and volume of TCE through the removal and treatment
of approximately six billion gallons of groundwater and removal of approximately 7,000 pounds of TCE.
The existing SSD systems significantly reduce the mobility of sub-slab soil gas to migrate into buildings.
Short-Term Effectiveness – Since Alternative 1 requires no further construction, there are no
implementation-related risks to workers, the community, or the environment from Alternative 1.

30
Implementability – Implementation has already been completed. Alternative 1 does not involve the
implementation of further actions.
Cost – No additional costs are associated with Alternative 1. General Mills has performed extensive
investigation and response action work in the Study Area since the early 1980s. General Mills spent over
$3.5 million on early investigation work and the installation and operation for 25 years of the legacy
groundwater extraction system. General Mills has spent over $11 million since late 2013 on vapor
intrusion investigation and installation of SSD systems.
6.2.1.3 Alternative 1 – Additional Considerations
Incremental Reduction in Vapor Intrusion Risk – Installation of existing SSD systems reduced potential
exposure to TCE resulting from vapor intrusion. Alternative 1 is the baseline for comparison.
Secondary Impacts – There are no secondary impacts resulting from implementation of Alternative 1.
Sustainability – Alternative 1 is used as the baseline for comparison for sustainability.
Construction Time – Alternative 1 does not require construction for further implementation.
6.2.1.4 Alternative 1 – Summary
The RAO has been substantially achieved through installing SSD systems at approximately 94 percent of
properties in the Central Area. Alternative 1 does not provide a systematic plan for O&M of the SSD
systems or address future VI risk as robustly as Alternative 3, but it has already been implemented and
poses no short-term risks due to construction activities or potential secondary impacts from remedial
activities like Alternatives 4 and 5.
6.2.2 Alternative 2 – Monitored Natural Attenuation
Alternative 2 relies on naturally occurring degradation of TCE in the groundwater and includes monitoring
of the natural attenuation process by collecting groundwater samples from the existing monitoring well
network and analyzing the samples for TCE, TCE daughter compounds, and common electron acceptors.
Additionally, the SSD systems previously installed in the Central Area will continue to provide protection,
although Alternative 2 does not provide a systematic plan for O&M of the SSD systems.
6.2.2.1 Alternative 2 – Threshold Criteria
Overall Protection of Human Health and the Environment – The natural degradation rates observed in the
Central Area indicate that it will take a long time to reduce groundwater TCE concentrations to a level that
would eliminate the need for SSD systems. Alternative 2 evaluates groundwater conditions and assesses
the timeframe for natural treatment until it is not necessary to operate SSD systems to maintain
protection of human health and the environment.
Compliance with ARARs – Alternative 2 would comply with chemical-specific, action-specific, and location-
specific ARARs.

31
6.2.2.2 Alternative 2 – Balancing Criteria
Long-Term Effectiveness and Permanence – Similar to Alternative 1, Alternative 2 does not include a
systematic plan for long-term O&M of the SSD systems. Over the long-term, natural attenuation
processes will eventually reduce groundwater concentrations.
Reduction of Toxicity, Mobility, or Volume through Treatment – Alternative 2 does not provide additional
treatment of soil gas or groundwater beyond naturally occurring degradation, which over time will reduce
groundwater concentrations. The existing SSD systems significantly reduce the mobility of sub-slab soil
gas to migrate into buildings.
Short-Term Effectiveness – Since Alternative 2 requires no further construction, there are minimal
implementation-related risks to workers, the community, or the environment. There would be a minimal
increased presence of workers in the neighborhood for completing groundwater monitoring events. The
groundwater monitoring events would involve an environmental professional driving to monitoring wells,
collecting groundwater samples, and transporting them to a laboratory for chemical analysis.
Implementability – Alternative 2 is readily implementable using the existing monitoring well network. The
services, materials, and technologies are available and implementation is technically and administratively
feasible.
Cost – The present worth cost to complete Alternative 2 is estimated to be $1.3 million with a range of
costs estimated between $0.9 million and $1.9 million. The cost estimate for Alternative 2 is summarized
in Table 7.
6.2.2.3 Alternative 2 – Additional Considerations
Incremental Reduction in Vapor Intrusion Risk – The incremental reduction in vapor intrusion risk is
negligible in the short-term when compared to Alternative 1. The additional monitoring of natural TCE-
degradation processes conducted for Alternative 2 does not directly address vapor intrusion risk.
Secondary Impacts – There are no secondary impacts resulting from implementation of Alternative 2.
Sustainability – The greenhouse gas emissions, energy footprint, and worker injury risk for Alternative 2
are similar to Alternative 1.
Construction Time – Alternative 2 could be implemented in less than a year. The existing monitoring well
network is considered sufficient for an effective monitored natural attenuation program.
6.2.2.4 Alternative 2 – Summary
Similar to Alternative 1, the RAO has been substantially achieved through installing SSD systems at
approximately 94 percent of properties in the Central Area. There is a long anticipated timeframe for
natural processes to degrade TCE to a level that would eliminate the need for SSD systems in the Central
Area. However, Alternative 2 provides a plan for monitoring of natural attenuation processes which is not
included in Alternative 1. Similar to Alternative 1, Alternative 2 does not provide a systematic plan for

32
O&M of the SSD systems or address future VI risk as robustly as Alternative 3, but it is easy to implement
and poses no short-term risks due to construction activities or potential secondary impacts from remedial
activities like Alternatives 4 and 5.
6.2.3 Alternative 3 – Long-Term O&M of SSD Systems
Alternative 3 includes preparing and implementing a long-term O&M plan that would provide measures
for routine monitoring and maintenance of the SSD systems. Elements of the O&M plan would include
verifying fan operation, visually inspecting the vent pipe, and visually inspecting the manometer pressure
gage. Alternative 3 assumes communication with and cooperation from property owners to conduct
visual inspections and coordinate routine maintenance needs.
Alternative 3 also includes installing active SSD systems at the remaining residential buildings within the
Central Area where active SSD systems have not been installed. This assumes cooperation from property
owners for access and installation of the SSD systems.
Additionally, natural attenuation of TCE in groundwater will occur as part of all alternatives, including
Alternative 3, which leads to a reduction in TCE concentrations over time. Monitoring of natural
attenuation processes is not included in Alternative 3.
6.2.3.1 Alternative 3 – Threshold Criteria
Overall Protection of Human Health and the Environment – Long-term O&M provides added assurance
that the existing SSD systems will continue to operate safely and reliably. Alternative 3 provides
controllable protection of human health and the environment regardless of TCE concentrations in
groundwater and of the level of reduction in future TCE groundwater concentrations needed to eliminate
the vapor intrusion pathway. It provides confidence that the vapor intrusion pathway is disconnected, and
therefore, the SSD systems remain protective of human health and the environment.
Compliance with ARARs – Alternative 3 would comply with chemical-, action-, and location-specific
ARARs. Additionally, Alternative 3 most directly addresses the indoor air ISV as a TBC by providing
confidence that the VI pathway is disconnected.
6.2.3.2 Alternative 3 – Balancing Criteria
Long-Term Effectiveness and Permanence – Alternative 3 provides a systematic plan for O&M of the SSD
systems to maintain long-term performance. Property owners can easily assess the operation of the SSD
systems through simple visual and auditory methods, as readily as they assess other home appliances. In
addition, an SSD systems are a simple technology that is regarded by MPCA and EPA as one of most
effective vapor intrusion mitigation strategies for existing or new buildings (MPCA, 2010; EPA, 2015). They
effectively disconnect the potential vapor pathway into a building, providing protection when uncertainty
exists regarding the level of reduction in future groundwater TCE concentrations needed to eliminate the
VI pathway.
Additionally, over the long term, natural attenuation processes will eventually reduce TCE concentrations
in groundwater.

33
Reduction of Toxicity, Mobility, or Volume through Treatment – The existing SSD systems significantly
reduce the mobility of sub-slab soil gas to migrate into buildings. A systematic approach for O&M of the
SSD systems provides a method to maintain the reduction in mobility of sub-slab soil gas into buildings
through verification and maintenance of the SSD systems. Alternative 3 does not provide additional
treatment of soil gas or groundwater beyond naturally occurring degradation, which over time will reduce
groundwater concentrations.
Short-Term Effectiveness – There would be negligible short-term exposure to TCE because there is no
handling of impacted groundwater or soil gas as part of Alternative 3. Because Alternative 3 directly
addresses the vapor intrusion pathway and can be implemented quickly, the risk of exposure while
implementing the remedy is significantly less than alternatives with a significant implementation stage
(e.g., Alternatives 4 and 5).
There would be disturbance to property owners and an increased presence in the neighborhood for
construction of up to 10 new SSD systems and maintenance of SSD systems. Maintenance events would
entail a contractor coordinating with a property owner for installing or repairing SSD system components
(e.g., fan, riser pipe, suction pit, manometer). Repair activities would be comparable to other appliances
or building maintenance activities performed by property owners. The short-term construction and
maintenance impacts for Alternative 3 are similar to Alternatives 1 and 2 and significantly less than
Alternatives 4 and 5.
Implementability – Alternative 3 is readily implementable using standard techniques for SSD installation
and O&M assuming cooperation from property owners for access during installation and routine O&M.
The services, materials, and technologies are available and proven, and implementation is technically and
administratively feasible.
Cost – The present worth cost to complete Alternative 3 is estimated to be $2 million with a range of costs
estimated between $1.4 million and $3.0 million. The cost estimate for Alternative 3 is summarized in
Table 8.
6.2.3.3 Alternative 3 – Additional Considerations
Incremental Reduction in Vapor Intrusion Risk – Alternative 3 provides the greatest incremental reduction
in current and future risk based on the reliability and effectiveness of the SSD systems in disconnecting
the potential VI pathway. Disconnecting the pathway helps assure the VI risk reduction since there is
uncertainty of the TCE groundwater concentration necessary to eliminate VI risk and long-term O&M
helps assure that the SSD systems continue to operate.
Secondary Impacts – There are no secondary impacts resulting from implementation of Alternative 3.
Sustainability – The greenhouse gas emissions, energy footprint, and worker injury risk for Alternative 3
are similar to Alternatives 1 and 2.

34
Construction Time – Alternative 3 could be implemented in less than a year assuming cooperation of
property owners.
6.2.3.4 Alternative 3 – Summary
Alternative 3 builds on the progress made by operating the legacy groundwater extraction system and
installing the existing SSD systems by installing additional systems and providing long-term O&M of the
SSD systems. SSD systems have been shown to be effective and reliable over the long term for mitigating
VI risk and directly disconnect the potential VI pathway. Long-term O&M with Alternative 3 is easy to
implement and will be only minimally intrusive for property owners in the Central Area. Alternative 3 has
minimal short-term risks due to construction activities and no secondary impacts from remedial activities
like Alternatives 4 and 5.
6.2.4 Alternative 4 – Enhanced Bioremediation via Injection Events
Alternative 4 involves installing injection wells within the rights-of-way and performing periodic injection
of carbon substrate and other amendments to support bioremediation of approximately 100 million
gallons of impacted groundwater over 40 acres in the Central Area. Within this area there are
approximately 177 individual property owners with buildings covering approximately eight acres. Road
and alleyway rights-of-way cover approximately five acres with significant infrastructure consisting of
water, stormwater, wastewater, electrical, and other underground utilities present beneath the rights-of-
way and throughout the Central Area. Due to the urban residential development, it is assumed for this
feasibility study that the injection wells would be installed primarily along two transects through the
Central Area. The carbon substrate and amendments would be injected using mobile tanker trucks.
The SSD systems previously installed in the Central Area will continue to provide protection, although
Alternative 4 does not provide a systematic plan for O&M of the SSD systems. Additionally, natural
attenuation of TCE in groundwater will occur as part of all alternatives, including Alternative 4. Monitoring
of natural attenuation processes is not included in Alternative 4, however, performance monitoring of the
remedy will be conducted.
6.2.4.1 Alternative 4 – Threshold Criteria
Overall Protection of Human Health and the Environment – Although Alternative 4 would reduce TCE
concentrations in groundwater within the Central Area, the overall protection of human health and the
environment would not necessarily be improved through a reduction in TCE concentrations in
groundwater beyond the protection already offered by the existing SSD systems. It is unlikely that
Alternative 4 could achieve an effective and consistent reduction in groundwater concentrations
throughout the Central Area to a level that would eliminate the need for SSD systems.
Additionally, Alternative 4 has the potential to generate methane and vinyl chloride which may pose a
greater human health risk than the existing risk of TCE vapor intrusion as described in Section 6.2.4.3.

35
Compliance with ARARs – Alternative 4 would comply with chemical-, action-, and location-specific ARARs
with appropriate design and planning. It is unlikely that Alternative 4 can reduce the groundwater
concentrations sufficiently to meet the RAO.
6.2.4.2 Alternative 4 – Balancing Criteria
Long-Term Effectiveness and Permanence – The effectiveness of Alternative 4 in reducing the
groundwater concentrations to a level that that would eliminate the need for SSD systems is highly
uncertain due to the size of the Central Area, limitations of advective flow distribution within a
heterogeneous aquifer with many preferential flowpaths, and access limitations due to the high density
residential development. If groundwater remediation is successfully implemented, the long-term
effectiveness of Alternative 4 may be somewhat better than Alternatives 1 and 2, similar to Alternative 5,
but less effective than Alternative 3. Similar to Alternatives 1 and 2, Alternative 4 does not provide a
systematic plan for long-term O&M of the SSD systems.
Reduction of Toxicity, Mobility, or Volume through Treatment – Alternative 4 would likely reduce the
volume of impacted-groundwater through treatment. There is a potential risk that complete degradation
would not be achieved by implementing Alternative 4 and that daughter-compounds with higher toxicity
(e.g., vinyl chloride) could be created. There is also a risk that complete degradation in an uncontrolled
manner would lead to generation of methane. Alternative 4 would provide greater reduction of volume
than Alternatives 1, 2, and 3, but less reduction in volume than Alternative 5. Alternative 4 does not
provide a reduction in mobility beyond the existing SSD systems that reduce the mobility of sub-slab soil
gas to migrate into buildings, and could potentially increase toxicity of the contaminants in groundwater.
Short-Term Effectiveness – Alternative 4 would expose workers to chemicals used as amendments in the
injection solution. It would also expose the neighborhood to increased construction traffic during
injection well installation and tanker traffic during injection delivery events.
Implementability – Alternative 4 is implementable assuming rights-of-way work permits, railroad access,
and underground injection control program approvals can be obtained. Alternative 4 is implementable
using standard well drilling techniques and fluid injection using tanker trucks and temporary piping
connections. Installing the series of injection wells in close proximity to one another will be challenged by
the urban setting and the presence of underground utilities and mature trees. The services, materials, and
technologies are available and implementation is technically and administratively feasible, but potentially
difficult to implement given the numerous stakeholders and approvals required. Alternative 4 is more
difficult to implement than Alternatives 1, 2, and 3, but easier to implement than Alternative 5.
Cost – The present worth cost to complete Alternative 4 is estimated to be $26 million with a range of
costs estimated between $6 million to $90 million. There is significant uncertainty regarding the cost
estimate for Alternative 4 due to the influence of amendment quantity on total cost. Given the
approximate treatment volume of 100 million gallons, the estimated cost per volume of groundwater
targeted for treatment is approximately $0.26 per gallon. A review of TCE groundwater treatment projects
from the Remediation Technology Cost Compendium (EPA, 2001) and EPA’s database of Superfund
decision documents (EPA, 2016) indicates that groundwater treatment costs are typically between the
36
estimated cost and the high end of the estimated range calculated for Alternative 4. Groundwater
treatment completed at those sites was also not completed to a level that would eliminate the need for
SSD systems in the Central Area. The cost estimates are prepared to an accuracy of plus 50 to minus 30
percent, with the exception of items involving amendment quantity which have a larger range. The cost
estimate for Alternative 4 is summarized in Table 9.
6.2.4.3 Alternative 4 – Additional Considerations
Incremental Reduction in Vapor Intrusion Risk – It is uncertain whether Alternative 4 will be effective at
reducing TCE concentrations in groundwater throughout the Central Area sufficiently to eliminate the
need to operate the SSD systems.
Secondary Impacts – There are numerous potential secondary impacts associated with implementing
enhanced bioremediation. Providing a carbon substrate to the subsurface creates reducing conditions
that can lead to metals liberation in groundwater. The breakdown of TCE via the reductive dechlorination
process can generate daughter-compounds that may pose a higher risk to residents than TCE. Two
examples of this are the generation of vinyl chloride as a result of incomplete reductive dechlorination
and the generation of methane as a result of complete reductive dechlorination. While additional
controls of these compounds could be designed, such as an area-wide vapor extraction system, the access
limitations present in the Central Area and the limited radius of influence of vapor extraction systems
would not provide coverage for the entire Central Area. Vapor extraction systems were screened out as a
technology due to the lack of coverage as summarized in Table 4. The process of injecting carbon and
amendments can also lead to changes in color, turbidity, and odor of the groundwater. The risk of
secondary impacts for Alternative 4 may be greater than the existing risk of TCE vapor intrusion.
Sustainability – The greenhouse gas impacts are estimated at 3,800 metric tons CO2-equivalent and the
energy footprint is estimated at 66,000 million British Thermal Units (MMBTU) for implementation of
Alternative 4. The greenhouse gas impacts for Alternative 4 are equivalent to the impact of driving 800
passenger vehicles for one year or consuming 428,000 gallons of gasoline. The estimated worker injury
risk associated with implementing Alternative 4 is 1.0 accidents. Additional details regarding the
sustainability impact evaluation are provided in Appendix B.
Construction Time – Alternative 4 could be implemented in +/- five years assuming necessary permits can
be obtained. The timeframe for construction would be dependent on the results of final design,
performance monitoring, and the need for installation of additional wells.
6.2.4.4 Alternative 4 – Summary
It is unlikely that Alternative 4 would be effective at reducing groundwater concentrations to a level that
meets the RAO given the technical and logistical constraints in the Central Area. Alternative 4 is more
intrusive during implementation than Alternatives 1, 2, and 3 and it would have short-term risks due to
construction activities and secondary impacts from completing remedial activities. The potential benefit
of reducing groundwater concentrations provided by Alternative 4 may be less than the potential risks of
implementing this alternative.

37
6.2.5 Alternative 5 – Enhanced Bioremediation via Recirculation
Alternative 5 includes installing extraction and injection wells and conveyance piping within the rights-of-
way, and constructing two treatment control buildings for operating a groundwater recirculation system.
The recirculation system would inject carbon substrate and other amendments, extract groundwater, mix
amendments with the groundwater to maintain conditions suitable for bioremediation, and reinject the
amended groundwater. The treatment control buildings would be constructed to allow for adjustments to
the substrate and amendment solutions and to switch from anaerobic to aerobic conditions, as necessary
to promote reductive dechlorination or aerobic co-metabolic processes.
The SSD systems previously installed in the Central Area will continue to operate, although Alternative 5
does not provide a systematic plan for O&M of the SSD systems. Additionally, natural attenuation of TCE
in groundwater will occur as part of all alternatives, including Alternative 5. Monitoring of natural
attenuation processes is not included in Alternative 5, however, performance monitoring of the remedy
will be conducted.
6.2.5.1 Alternative 5 – Threshold Criteria
Overall Protection of Human Health and the Environment – Although Alternative 5 would reduce TCE
concentrations in groundwater within the Central Area, the overall protection of human health and the
environment would not necessarily be improved through a reduction in TCE concentrations in
groundwater beyond the protection already offered by the existing SSD systems. There is also significant
uncertainty whether Alternative 5 could achieve an effective and consistent reduction in groundwater
concentrations throughout the Central Area to a level that would eliminate the need for SSD systems due
to the size of the Central Area, access limitations, and the heterogeneity of the glacial aquifer.
Additionally, Alternative 5 has the potential to generate methane and vinyl chloride which may pose a
greater human health risk than the existing risk of TCE vapor intrusion as described in Section 6.2.4.3.
Compliance with ARARs – Alternative 5 would comply with chemical-, action-, and location-specific ARARs
with appropriate design and planning.
6.2.5.2 Alternative 5 – Balancing Criteria
Long-Term Effectiveness and Permanence – The effectiveness of Alternative 5 in reducing the
groundwater concentrations to a level that that would eliminate the need for SSD systems is highly
uncertain due to the size of the Central Area, limitations of advective flow distribution within a
heterogeneous aquifer with many preferential flowpaths, and access limitations due to the high-density
residential development. If groundwater remediation is successfully implemented, the long-term
effectiveness of Alternative 5 may be somewhat better than Alternatives 1 and 2, similar to Alternative 4,
but less effective than Alternative 3. Similar to Alternatives 1, 2, and 4, Alternative 5 does not provide a
systematic plan for long-term O&M of the SSD systems.
Reduction of Toxicity, Mobility, or Volume through Treatment – Alternative 5 provides for the greatest
potential for reduction of volume of groundwater impacts through treatment. There is a potential risk

38
that complete degradation would not be completed as part of implementing Alternative 5 and daughter-
compounds with higher toxicity (e.g. vinyl chloride) could be created. Alternative 5 does not provide a
reduction in mobility beyond the existing SSD systems that reduce the mobility of sub-slab soil gas to
migrate into buildings, and could potentially increase toxicity of contaminants in groundwater.
Short-Term Effectiveness – Alternative 5 would expose workers to chemicals used as amendments in the
treatment control buildings. Alternative 5 would also expose the neighborhood to heavy equipment
traffic during extraction and injection well installation, conveyance piping and treatment control building
installation, and maintenance of the control buildings, piping, and wells. Construction of the treatment
control buildings would require demolition of several buildings within the Central Area to provide
centralized locations for treatment process control. Construction of the conveyance piping would disturb
roads during installation and would require temporary road closures.
Implementability - Alternative 5 is implementable assuming access for the treatment control buildings,
rights-of-way work permits, railroad access, and underground injection control program approval can be
obtained. Alternative 5 is implementable using standard well drilling techniques, standard trenching and
conveyance piping installation techniques, water treatment and control plant installation processes, and
water treatment systems operations. Constructing the treatment control buildings will be challenged by
the need to acquire property or obtain access within the Central Area for the buildings. Installing the
series of injection wells, extraction wells, and conveyance piping will be challenged by the urban setting
and the presence of underground utilities and mature trees. The services, materials, and technologies are
available and implementation is technically and administratively feasible, but potentially difficult to
implement given the numerous stakeholders and approvals required. Alternative 5 is more difficult to
implement than Alternatives 1, 2, 3, and 4.
Cost – The present worth cost to complete Alternative 5 is estimated to be $42 million with a range of
costs estimated at $19 million to $100 million. There is significant uncertainty regarding the cost estimate
for Alternative 5 due to the influence of amendment quantity on total cost. Given the approximate
treatment volume of 100 million gallons, the estimated cost per volume of groundwater targeted for
treatment is approximately $0.42 per gallon. A review of TCE groundwater treatment projects from the
Remediation Technology Cost Compendium (EPA, 2001) and EPA’s database of Superfund decision
documents (EPA, 2016) indicates that groundwater treatment costs per volume are typically between the
estimated cost and the high end of the estimated range calculated for Alternative 5. Groundwater
treatment completed at those sites was also not completed to a level that would be protective of VI risk.
The cost estimates are prepared to an accuracy of plus 50 to minus 30 percent with the exception of items
involving amendment quantity which have a larger range. The cost estimate for Alternative 5 is
summarized in Table 10.
6.2.5.3 Alternative 5 – Additional Considerations
Incremental Reduction in Vapor Intrusion Risk – It is uncertain whether Alternative 5 will be effective at
reducing TCE concentrations in groundwater throughout the Central Area sufficiently to eliminate the
need to operate the SSD systems.

39
Secondary Impacts – There are numerous secondary impacts associated with implementing enhanced
bioremediation. Providing a carbon substrate to the subsurface creates reducing conditions that can lead
to metals liberation in groundwater. The breakdown of TCE via the reductive dechlorination process can
generate daughter-compounds that pose a higher risk to residents than TCE. Two examples of this
include the generation of vinyl chloride as a result of incomplete reductive dechlorination and generation
of methane as a result of complete reductive dechlorination. The process of injecting carbon and
amendments can also lead to a change in color, turbidity, and odor of the groundwater. Alternative 5
provides greater control over subsurface conditions than Alternative 4 by modifying the system
operations as appropriate to minimize secondary impacts. Alternative 5 provides relatively greater control
to promote complete dechlorination to reduce vinyl chloride generation, to promote aerobic conditions
for breakdown of methane, and/or to flush groundwater to promote stabilizing color, turbidity, and odor
alterations. The secondary impacts associated with Alternative 5 are less than the secondary impacts
associated with Alternative 4, but greater than the secondary impacts of Alternatives 1, 2, and 3.
Sustainability – The greenhouse gas emissions are estimated at 4,400 metric tons CO2-equivalent and the
energy footprint is estimated at 70,000 MMBTU for implementation of Alternative 5. The greenhouse gas
impacts for Alternative 5 are equivalent to the impact of 925 passenger vehicles driven for one year or
495,000 gallons of gasoline consumed. The greenhouse gas impacts and energy footprint estimated for
Alternative 5 are slightly higher than Alternative 4. The estimated worker injury risk associated with
implementing Alternative 5 is 4.0 accidents, approximately four times higher than Alternative 4.
Additional details regarding the sustainability impact evaluation are provided in Appendix B.
Construction Time – Alternative 5 could be implemented in +/- 10 years assuming treatment control
building locations can be identified and purchased, and the necessary approvals can be obtained. The
construction timeframe would be dependent on the results of final design and obtaining access for the
treatment control buildings.
6.2.5.4 Alternative 5 – Summary
There is significant uncertainty whether Alternative 5 would be effective at reducing groundwater
concentrations to a level that meets the RAO given the technical and logistical constraints in the Central
Area. Alternative 5 is the most intrusive of the remedial alternatives during implementation and would
have short-term risks due to construction activities and secondary impacts from completing remedial
activities. The potential benefit of potential VI risk reduction provided by Alternative 5 may be less than
the potential risks of implementing this alternative.
6.3 Recommended Alternative
The results of the detailed analysis were compiled to evaluate the performance of each alternative relative
to the specific criterion and to compare the advantages and disadvantages of each alternative. A
summary of the detailed analysis and the comparative evaluation is provided in Table 6.
Alternative 3 is the recommended alternative. This alternative provides the best balance of tradeoffs of
the five balancing criteria including cost effectiveness as required by CERCLA and the NCP. This

40
alternative provides the greatest protection to human health and the environment and complies with
ARARs.

41
7.0 Summary and Conclusions
This feasibility study was performed to evaluate alternatives to address the VI pathway in the Central Area
and included alternatives that directly mitigate vapor intrusion and alternatives that decrease the potential
for VI through a decrease in soil gas and groundwater concentrations. This feasibility study was
completed in general accordance with EPA guidance (EPA, 1988) and RAP Modification #1.
This feasibility study was performed for the Central Area, which has been impacted by up-gradient off-Site
sources in the Northeast Area, and only a portion of which is down-gradient of the Site. The HHRA
concluded that exposure pathways in the Central Area, including the VI pathway, are currently either
incomplete or insignificant and not expected to be significant in the future. Moreover, because multiple
sources of TCE exist in the Northeast Area that have yet to be characterized, remedial actions to address
groundwater will not be effective at reducing TCE concentrations in groundwater due to continuing re-
contamination from these up-gradient sources. Nevertheless, General Mills completed this feasibility
study at the request of MPCA. The remedial action objective for this feasibility study focuses on
maintaining insignificant potential VI risk.
A thorough screening of technology and process options was completed to evaluate technologies for
inclusion in remedial alternatives that could be implemented throughout the Central Area. The
technologies were screened based on demonstrated effectiveness at similar sites and on implementability
given the technical, logistical, and physical access constraints of the Central Area. The technologies that
were retained following the technology screening included:
Installation of additional SSD systems (at residential properties within the Central Area that
currently do not have active SSD systems),
O&M of SSD systems,
Institutional controls,
Monitored natural attenuation,
Expanded/modified groundwater extraction, and
In-situ bioremediation (considering both reductive dechlorination and aerobic co-metabolic
treatment and multiple process delivery options).
The five remedial alternatives assessed during detailed analysis were:
Alternative 1 – No Further Action Beyond Previous Response Actions,
Alternative 2 – Monitored Natural Attenuation,
Alternative 3 – Long-Term O&M of SSD Systems,
Alternative 4 – Enhanced Bioremediation via Injection Events, and

42
Alternative 5 – Enhanced Bioremediation via Recirculation.
Alternative 3 – Long-Term O&M of SSD Systems was selected as the recommended alternative. This
alternative provides the best balance of tradeoffs of the five balancing criteria. This alternative provides
protection to human health and the environment, complies with ARARs, and is cost effective as required
by CERCLA and the NCP.

43
References
Barr Engineering Co. (Barr), 2014a. Final Sub-Slab Sampling and Building Mitigation Work Plan, East
Hennepin Avenue Site. Prepared for General Mills, Inc. February 2014.
Barr Engineering Co. (Barr), 2014b. Summary of Phase 2G Vapor Intrusion Evaluation Results, East
Hennepin Avenue Site. Prepared for General Mills, Inc. May 11, 2014.
Barr Engineering Co. (Barr), 2014c. Disposal Area Investigation Results, 2010 East Hennepin Avenue Site.
Prepared for General Mills, Inc. May 23, 2014.
Barr Engineering Co. (Barr), 2015a. Indoor Air Sampling Report, 2010 E Hennepin Avenue, East Hennepin
Avenue Site. Prepared for General Mills, Inc. May 13, 2015.
Barr Engineering Co. (Barr), 2015b. Sub-Slab Sampling and Building Mitigation Implementation Report, East
Hennepin Avenue Site. Prepared for General Mills, Inc. June 2015.
Barr Engineering Co. (Barr), 2015c. Vapor Intrusion Pathway Investigation Report, East Hennepin Avenue
Site. Prepared for General Mills, Inc. July 2015.
Barr Engineering Co. (Barr), 2015d. 2015 Sentinel Monitoring Network Report, East Hennepin Avenue Site.
Prepared for General Mills, Inc. December 2015.
Barr Engineering Co. (Barr), 2016. 2016 Glacial Drift Network Groundwater Monitoring Plan, East Hennepin
Avenue Site. Prepared for General Mills, Inc. April 6, 2016.
General Mills, Inc. (GMI), 2016. Letter to Timothy Grape (MPCA) from Larry Deeney (General Mills)
regarding Vapor Intrusion Pathway Investigation – Response to MPCA Comments; East Hennepin
Avenue Site. April 6, 2016.
Haley & Aldrich, Inc. (H&A), 2015. Human Health Risk Assessment Report, East Hennepin Avenue Site.
Prepared for General Mills, Inc. July 31, 2015.
Haley & Aldrich, Inc. (H&A), 2016. Letter to Timothy J. Grape (MPCA) from Jay Peters (H&A) regarding
Response to the Human Health Risk Assessment Report for the General Mills/Henkel Corporation Site;
Minnesota Pollution Control Agency Site ID#: SR3. April 6, 2016.
Minnesota Department of Health (MDH), 2016a. Trichloroethylene (TCE) in Air, Site Assessment and
Consultation Unit, available at
http://www.health.state.mn.us/divs/eh/hazardous/topics/vapintrustce.pdf. January 26, 2016.
Minnesota Department of Health (MDH), 2016b. Vapor Intrusion, Site Assessment and Consultation Unit,
available at http://www.health.state.mn.us/divs/eh/hazardous/topics/vaporintrusion.pdf. February 2,
2016.
Minnesota Pollution Control Agency (MPCA), 1984. Response Order by Consent (Consent Order) between
General Mills and the Minnesota Pollution Control Agency (MPCA). October 1984.
Minnesota Pollution Control Agency (MPCA), 2008. Risk Based Guidance for the Vapor Intrusion Pathway,
Superfund, RCRA, and Voluntary Cleanup Section, MPCA Document Number c-s4-06. September
2008.

44
Minnesota Pollution Control Agency (MPCA), 2010. Vapor Intrusion Technical Support Document,
Remediation Division, MPCA Document Number c-rem3-01. August 2010.
Minnesota Pollution Control Agency (MPCA), 2014a. Remedial Action Plan Modification #1 (Exhibit B) to
the Response Order By Consent between General Mills and the Minnesota Pollution Control Agency
(MPCA), October 1984. March 11, 2014.
Minnesota Pollution Control Agency (MPCA), 2014b. Five-Year Review Report General Mills/Henkel Corp
Superfund Site, Minneapolis, Minnesota. Prepared by Minnesota Pollution Control Agency, December
2014.
Minnesota Pollution Control Agency (MPCA), 2015a. Letter to Larry Deeney (General Mills) from Timothy J.
Grape (MPCA) regarding Minnesota Pollution Control Agency Response to the Vapor Intrusion Pathway
Investigation Report for the General Mills/Henkel Corporation Site; Site ID#: SR3. November 3, 2015.
Minnesota Pollution Control Agency (MPCA), 2015b. Letter to Larry Deeney (General Mills) from Timothy J.
Grape (MPCA) regarding Response to the Human Health Risk Assessment Report for the General
Mills/Henkel Corporation Site; Minnesota Pollution Control Agency Site ID#: SR3. November 12, 2015.
Minnesota Pollution Control Agency (MPCA), 2016. Letter to Larry Deeney (General Mills) from Timothy
Grape (MPCA) regarding MPCA Response to the 2015 Sentinel Monitoring Network Report for the
General Mills/Henkel Corporation Site ; Site ID#: SR3. January 28, 2016.
Parsons Infrastructure & Technology Group, Inc. (Parsons), 2010a. Addendum to the Principles and
Practices Manual Loading Rates and Impacts of Substrate Delivery for Enhanced Anaerobic
Bioremediation. Prepared for Environmental Security Technology Certification Program (ESTCP)
Project ER-20067. January 2010.
Parsons Infrastructure & Technology Group, Inc. (Parsons), 2010b. Substrate Estimating Tool for Enhanced
Anaerobic Bioremediation of Chlorinated Solvents, Version 2.1. Prepared for Environmental Security
Technology Certification Program (ESTCP). November 2010.
United States Environmental Protection Agency (EPA), 1988. Guidance for Conducting Remedial
Investigations and Feasibility Studies under CERCLA. Office of Emergency and Remedial Response.
October 1988.
United States Environmental Protection Agency (EPA), 1998. Technical Protocol for Evaluating Natural
Attenuation of Chlorinated Solvents in Ground Water. Office of Research and Develop. September
1998.
United States Environmental Protection Agency (EPA), 2000. A Guide to Developing and Documenting Cost
Estimates During the Feasibility Study. Office of Emergency and Remedial Response. July 2000.
United States Environmental Protection Agency (EPA), 2001. Remediation Technology Cost Compendium.
Office of Solid Waste and Emergency Response, Technology Innovation Office. September 2001.
United States Environmental Protection Agency (EPA), 2012. Institutional Controls: A Guide to Planning,
Implementing, Maintaining, and Enforcing Institutional Controls at Contaminated Sites. Office of Solid
Waste and Emergency Response, Office of Enforcement and Compliance Assurance. December 2012.

45
United States Environmental Protection Agency (EPA), 2015. OSWER Technical Guidance for Assessing and
Mitigating the Vapor Intrusion Pathway from Subsurface Vapor to Sources to Indoor Air, Office of Solid
Waste and Emergency Response. June 2015.
United States Environmental Protection Agency (EPA), 2016. Search for Superfund Decision Documents,
available at http://www.epa.gov/superfund/search-superfund-decision-documents. Accessed March
2016.

Tables

Table 1
Potential Action-Specific ARARs and TBCs
East Hennepin Avenue Site
Minneapolis, MN
Standard Requirement Citation
Potentially Applicable/
Relevant and Appropriate TBC1
Comments
RCRA Identification of Hazardous
Waste
Waste generator shall determine if the waste is
hazardous waste.40 CFR 261 No/No
Applicable for any remedial action where waste would be generated.
Generation of a hazardous waste is not anticipated.
RCRA Generators of Hazardous
Waste
Generation of contaminated media that is
characterized as a hazardous waste.40 CFR 262 No/No
Applicable where hazardous waste would be generated. Generation
of a hazardouse waste is not anticipated.
RCRA Transporters of Hazardous
Waste
Transportation of hazardous waste to off-site
facilities.40 CFR 263 No/No ARARs pertain only to activities conducted on-site.
RCRA Owners and Operators of
Hazardous Waste Treatment, Storage,
and Disposal Facilities
Management of hazardous waste. 40 CFR 264 No/No
Applicable for remedial action where hazardous waste would be
treated, stored or disposed of. Generation of a hazardouse waste is
not anticipated.
RCRA Management of Specific
Hazardous Waste and Specific Types
of Facilities
Management of specific hazardous wastes. 40 CFR 266 No/No These standards do not apply to remedial actions in the Central Area.
RCRA Land Disposal RestrictionsRestricts certain hazardous wastes from land
disposal.40 CFR 268 No/No
Applicable where hazardous wastes with land disposal restrictions
are generated. Generation of a hazardous waste is not anticipated.
Disposal of Solid Waste that is not a
Hazardous WasteGenerator of RCRA Subtitle D regulated waste. 40 CFR 257 Yes/-- Applicable if RCRA Subtitle D waste is generated (e.g., drill cuttings).
USDOT General Information,
Regulations and Definitions
Requirements for packaging, labeling, marking,
placarding, and motor vehicles used for
transportation of hazardous materials.
49 CFR 171 No/No ARARs pertain only to activities conducted on-site.
USDOT Hazardous Materials Table,
special provisions, communications,
emergency response, training and
security plans
Each person who offers hazardous material for
transportation or each carrier that transports it shall
mark each package, container, and vehicle in the
manner required.
49 CFR 172 No/No ARARs pertain only to activities conducted on-site.
USDOT Requirements for Shipments
and Packagings
Definitions of hazardous materials for
transportation purposes; requirements for
preparing hazardous materials for shipment.
49 CFR 173 No/No ARARs pertain only to activities conducted on-site.
OSHA Work on Contaminated Sites
Requirements for workers on uncontrolled
hazardous waste sites such as training, personal
protective equipment, recording and reporting work-
related fatalities/injuries/illnesses.
29 CFR 1904 - Recording and
Reporting Occupational
Injuries and Illnesses
29 CFR 1910 - Occupational
Safety and Health
29 CFR 1926 – Safety and
Health Regulations for
Construction
Yes/--Appropriate health and safey procedures would be implemented
during remedial actions.
Federal
Table 1
Page 1 of 5
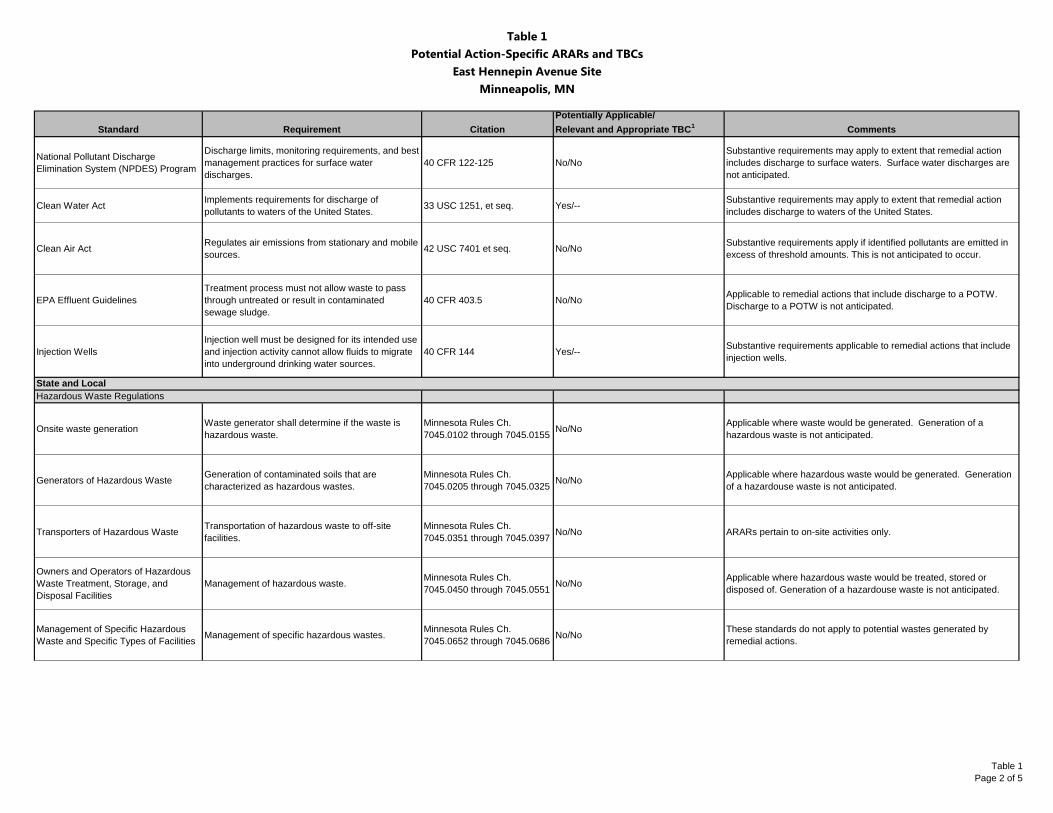
Table 1
Potential Action-Specific ARARs and TBCs
East Hennepin Avenue Site
Minneapolis, MN
Standard Requirement Citation
Potentially Applicable/
Relevant and Appropriate TBC1
Comments
National Pollutant Discharge
Elimination System (NPDES) Program
Discharge limits, monitoring requirements, and best
management practices for surface water
discharges.
40 CFR 122-125 No/No
Substantive requirements may apply to extent that remedial action
includes discharge to surface waters. Surface water discharges are
not anticipated.
Clean Water ActImplements requirements for discharge of
pollutants to waters of the United States.33 USC 1251, et seq. Yes/--
Substantive requirements may apply to extent that remedial action
includes discharge to waters of the United States.
Clean Air ActRegulates air emissions from stationary and mobile
sources.42 USC 7401 et seq. No/No
Substantive requirements apply if identified pollutants are emitted in
excess of threshold amounts. This is not anticipated to occur.
EPA Effluent Guidelines
Treatment process must not allow waste to pass
through untreated or result in contaminated
sewage sludge.
40 CFR 403.5 No/NoApplicable to remedial actions that include discharge to a POTW.
Discharge to a POTW is not anticipated.
Injection Wells
Injection well must be designed for its intended use
and injection activity cannot allow fluids to migrate
into underground drinking water sources.
40 CFR 144 Yes/--Substantive requirements applicable to remedial actions that include
injection wells.
Onsite waste generationWaste generator shall determine if the waste is
hazardous waste.
Minnesota Rules Ch.
7045.0102 through 7045.0155No/No
Applicable where waste would be generated. Generation of a
hazardous waste is not anticipated.
Generators of Hazardous WasteGeneration of contaminated soils that are
characterized as hazardous wastes.
Minnesota Rules Ch.
7045.0205 through 7045.0325No/No
Applicable where hazardous waste would be generated. Generation
of a hazardouse waste is not anticipated.
Transporters of Hazardous WasteTransportation of hazardous waste to off-site
facilities.
Minnesota Rules Ch.
7045.0351 through 7045.0397No/No ARARs pertain to on-site activities only.
Owners and Operators of Hazardous
Waste Treatment, Storage, and
Disposal Facilities
Management of hazardous waste.Minnesota Rules Ch.
7045.0450 through 7045.0551 No/No
Applicable where hazardous waste would be treated, stored or
disposed of. Generation of a hazardouse waste is not anticipated.
Management of Specific Hazardous
Waste and Specific Types of FacilitiesManagement of specific hazardous wastes.
Minnesota Rules Ch.
7045.0652 through 7045.0686No/No
These standards do not apply to potential wastes generated by
remedial actions.
Hazardous Waste Regulations
State and Local
Table 1
Page 2 of 5

Table 1
Potential Action-Specific ARARs and TBCs
East Hennepin Avenue Site
Minneapolis, MN
Standard Requirement Citation
Potentially Applicable/
Relevant and Appropriate TBC1
Comments
County Regulation of Hazardous
Waste Management
Procedures for the MPCA’s overview of county
hazardous waste programs.
Minnesota Rules Ch.
7045.1000 through 7045.1030No/No
Hennepin County has an MPCA-approved county ordinance detailing
their hazardous waste programs. Generation of hazardouse waste is
not anticipated.
Land Disposal RestrictionsRestricts certain hazardous wastes from land
disposal.
Minnesota Rules Ch.
7045.1390No/No
Applicable where hazardous wastes with land disposal restrictions
are generated. Generation of a hazardous waste is not anticipated.
General requirements for management
of solid wasteRequirements and standards for solid waste.
Minnesota Rules Ch.
7035.0300 through 7035.0605No/No
Remedial action is not anticipated to include on-site disposal of solid
waste. Off-site disposal, if any, will be conducted in accordance with
RCRA Subtitle D requirements.
Individual Properties Responsibility for management of solid waste.Minnesota Rules Ch.
7035.0700 through 7035.0805Yes/--
Solid waste requirements would be applicable for storage, transport
and disposal of contaminated media generated during remedial
activities (e.g. drill cuttings).
Industrial Solid Waste Land Disposal
Facilities
Requirements for industrial solid waste land
disposal facilities.
Minnesota Rules Ch.
7035.1590 through 7035.2500No/No
Remedial actions do not involve an industrial solid waste land
disposal facility.
Solid Waste Management Facilities
Financial Requirements
Requirements for cost estimates and financial
assurances documentation.
Minnesota Rules Ch.
7035.2665 through 7035.2805No/No
Remedial actions would not involve construction of an industrial solid
waste storage facility.
Solid Waste Management Facility
Specific Technical Requirements
Requirements for facilities that dispose of mixed
municipal solid waste in or on the land.
Minnesota Rules Ch.
7035.2815 through 7035.2915No/No
Remedial actions would not involve management of a mixed
municipal waste landfill.
Abandonment of motor vehicles and
scrap metal
Requirement for disposal and reuse of abandoned
motor vehicles and other scrap metal.
Minnesota Rules Ch.
7035.3000 through 7035.3600No/No
Remedial activities would not involve disposal or reuse of abandoned
motor vehicles or scrap metal.
Solid Waste Programs and Projects
Requirements for application procedure for grants-
in-aid, state requirements, approval of applications,
and payments for programs or projects which will
encourage both the reduction of the amount of
material entering the solid waste stream and the
reuse and recycling of solid waste.
Minnesota Rules Ch.
7035.4000 through 7035.4600No/No
Remedial activities would not involve construction or management of
a solid waste management facility.
Infectious Waste
Requirements for owners and operators of
facilities, commercial transporters, and all
infectious waste.
Minnesota Rules Ch.
7035.9100 through 7035.9150No/No Remedial activities would not involve infectious waste.
Solid Waste
Table 1
Page 3 of 5
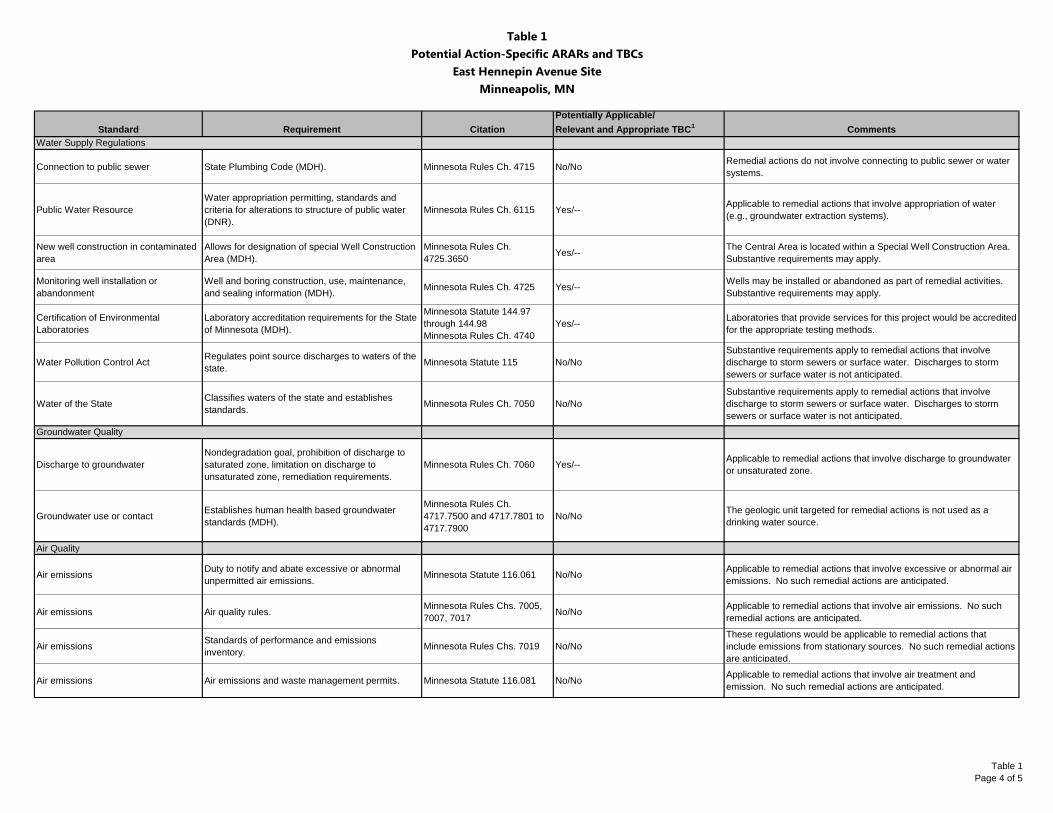
Table 1
Potential Action-Specific ARARs and TBCs
East Hennepin Avenue Site
Minneapolis, MN
Standard Requirement Citation
Potentially Applicable/
Relevant and Appropriate TBC1
Comments
Connection to public sewer State Plumbing Code (MDH). Minnesota Rules Ch. 4715 No/NoRemedial actions do not involve connecting to public sewer or water
systems.
Public Water Resource
Water appropriation permitting, standards and
criteria for alterations to structure of public water
(DNR).
Minnesota Rules Ch. 6115 Yes/--Applicable to remedial actions that involve appropriation of water
(e.g., groundwater extraction systems).
New well construction in contaminated
area
Allows for designation of special Well Construction
Area (MDH).
Minnesota Rules Ch.
4725.3650Yes/--
The Central Area is located within a Special Well Construction Area.
Substantive requirements may apply.
Monitoring well installation or
abandonment
Well and boring construction, use, maintenance,
and sealing information (MDH).Minnesota Rules Ch. 4725 Yes/--
Wells may be installed or abandoned as part of remedial activities.
Substantive requirements may apply.
Certification of Environmental
Laboratories
Laboratory accreditation requirements for the State
of Minnesota (MDH).
Minnesota Statute 144.97
through 144.98
Minnesota Rules Ch. 4740
Yes/--Laboratories that provide services for this project would be accredited
for the appropriate testing methods.
Water Pollution Control ActRegulates point source discharges to waters of the
state.Minnesota Statute 115 No/No
Substantive requirements apply to remedial actions that involve
discharge to storm sewers or surface water. Discharges to storm
sewers or surface water is not anticipated.
Water of the StateClassifies waters of the state and establishes
standards.Minnesota Rules Ch. 7050 No/No
Substantive requirements apply to remedial actions that involve
discharge to storm sewers or surface water. Discharges to storm
sewers or surface water is not anticipated.
Discharge to groundwater
Nondegradation goal, prohibition of discharge to
saturated zone, limitation on discharge to
unsaturated zone, remediation requirements.
Minnesota Rules Ch. 7060 Yes/--Applicable to remedial actions that involve discharge to groundwater
or unsaturated zone.
Groundwater use or contactEstablishes human health based groundwater
standards (MDH).
Minnesota Rules Ch.
4717.7500 and 4717.7801 to
4717.7900
No/NoThe geologic unit targeted for remedial actions is not used as a
drinking water source.
Air Quality
Air emissionsDuty to notify and abate excessive or abnormal
unpermitted air emissions.Minnesota Statute 116.061 No/No
Applicable to remedial actions that involve excessive or abnormal air
emissions. No such remedial actions are anticipated.
Air emissions Air quality rules.Minnesota Rules Chs. 7005,
7007, 7017No/No
Applicable to remedial actions that involve air emissions. No such
remedial actions are anticipated.
Air emissionsStandards of performance and emissions
inventory.Minnesota Rules Chs. 7019 No/No
These regulations would be applicable to remedial actions that
include emissions from stationary sources. No such remedial actions
are anticipated.
Air emissions Air emissions and waste management permits. Minnesota Statute 116.081 No/NoApplicable to remedial actions that involve air treatment and
emission. No such remedial actions are anticipated.
Groundwater Quality
Water Supply Regulations
Table 1
Page 4 of 5

Table 1
Potential Action-Specific ARARs and TBCs
East Hennepin Avenue Site
Minneapolis, MN
Standard Requirement Citation
Potentially Applicable/
Relevant and Appropriate TBC1
Comments
Sound generation Standards for noise generated during operations. Minnesota Rules Ch. 7030 Yes/--May need a waiver of this requirement if operation of construction
equipment exceeds noise standards.
Health and Safety
Worker protection Standards for worker health, safety and training. Minnesota Rules Ch. 5205 Yes/-- Requirements would be met for health and safety of workers.
1 "Yes/--": If a requirement is potentially applicable , determination of relevant and appropriate or TBC status is not made.
Noise Pollution Control
Table 1
Page 5 of 5

Table 2Potential Location-Specific ARARs and TBC
East Hennepin Avenue SiteMinneapolis, MN
Table 2Page 1 of 2
Standard Requirement CitationPotentially Applicable/ Relevant and Appropriate TBC1 Comments
National Archaeological and Historical Preservation Act
Construction on previously undisturbed land would require an archaeological survey of the area.
16 USC 469-469c Substantive requirements of 36 CFR 65, National Historic Landmarks Program.
No/No There are no known archaeological or historical sites located in the Central Area.
Federal National Historic Preservation Act, Section 106
Action to preserve historic properties; planning of action to minimize harm to properties listed on or eligible for listing on the National Register of Historic Places (NRHP).
Substantive Requirements of 36 CFR 800, Protection of Historic Properties16 USC 470, et seq.
No/No
There are five historic structures currently inventoried by the Minnesota State Historic Preservation Office located in the Central Area; none have been listed on the NRHP or are eligible for listing on the NRHP.
Endangered Species Act of 1973
Action to conserve endangered species or threatened species, including consultation with the Department of the Interior. Reasonable mitigation and enhancement measures must be taken, including live propagation, transplantation and/or habitat acquisition and improvement.
16 USC 1531, et seq. No/No There are no known records of endangered plant or animal species located in the Central Area.
Migratory Bird Treaty Act of 1972Protects almost all species of native birds in the U.S. from unregulated “take” which can include poisoning at contaminated sites.
16 USC 703, et seq. No/No There are no known records of the presence of migratory birds in the Central Area.
Wilderness ActArea must be administered in such a manner as will leave it unimpaired as wilderness and preserve its wilderness character.
16 USC 1131 et seq. No/No There are no Federally-owned wilderness areas located in the Central Area.
National Wildlife Refuge SystemOnly actions allowed under the provisions of 16 USC Section 688 dd(c) may be undertaken in areas that are part of the National Wildlife Refuge System.
50 CFR 35.1 et seq. No/No There are no National Wildlife Refuge areas located in the Central Area.
Fish and Wildlife Coordination Act, Fish and Wildlife Improvement Act of 1978, Fish and Wildlife Conservation Act of 1980
Provides protection for actions that would affect streams, wetlands, other water bodies or protected habitats. Any action taken should protect fish or wildlife.
16 USC 661-667e16 USC 742a-l16 USC 2901, et seq.
No/No There are no streams, wetlands, or other water bodies that could potentially be impacted by activities in the Central Area.
Clean Water Act, Section 404 Permitting requirements for dredge and fill materials to waters of the United States. 33 CFR 320-330 No/No No wetlands will be affected by remedial action.
Wild and Scenic Rivers ActAvoid taking or assisting in an action that will have direct adverse effect on a national, wild, or scenic recreational river.
16 USC 1271 et seq. 36 CFR 29740 CFR 6.302(e)
No/No There are no designated wild, scenic, or recreational areas in the Central Area.
Coastal Zone Management Act
Regulates activities affecting the coastal zone including lands thereunder and adjacent shoreline. Must conduct activities in a manner consistent with the approved State management programs.
16 USC 1451, et seq.15 CFR 93015 CFR 923
No/No The Central Area is not located within a designated coastal zone.
Coastal Barrier Resources Act, Section 3504
Prohibits any new federal expenditure within the Coastal Barrier Resource System. 16 USC 3501, et seq. No/No The Central Area is not located within a designated coastal zone.
Clean Water Act Establishes regulations pertaining to activities that affect the navigation of the waters of the United States.
33 CFR 320-32933 USC 1341, et seq. No/No There are no navigable waters in the Central Area. No discharge to
navigable waters is anticipated.
Federal

Table 2Potential Location-Specific ARARs and TBC
East Hennepin Avenue SiteMinneapolis, MN
Table 2Page 2 of 2
Standard Requirement CitationPotentially Applicable/ Relevant and Appropriate TBC1 Comments
Magnuson Fishery Conservation and Management Act
Provides for conservation and management of specified fisheries within specified fishery conservation zones (in federal waters).
16 USC 1801, et seq. No/No There are no fisheries located in the Central Area.
RCRA Standards for Identification of Hazardous Waste and Hazardous Waste Generator Requirements
Regulates generators of hazardous waste. 40 CFR 261, 262 No/No
Applicable for identification of hazardous wastes. Substantive requirements may be applicable if hazardous waste is generated as part of remedial action. Generation of hazardous waste is not anticipated.
RCRA Hazardous Waste Treatment, Storage, and Disposal Requirements
Regulates treatment, storage, and disposal of hazardous waste. 40 CFR 264 No/No Remedial action unlikely to include treatment, storage, or disposal
of hazardous waste.
EO 11988, Protection of Floodplains
Actions taken should avoid adverse effects, minimize potential harm, restore and preserve natural and beneficial values.
40 CFR 6, Appendix A; excluding Sections 6(a)(2), 6(a)(4), 6(a)(6); 40 CFR 6.302
No/No The Central Area is not located within a flood plain.
Rivers and Harbors Act of 1972 Permits are required for structures or work affecting navigable waters. 33 USC 403 No/No There are no navigable waters in the Central Area.
Endangered Species Protection of endangered species (DNR). Minnesota Rules Ch. 6134 No/No There are no known records of endangered plant or animal species in the Central Area.
Public Water Resources Classifies lakes and wetlands, appropriation permitting (DNR). Minnesota Rules Ch. 6115 No/No There are no streams, wetlands, or other water bodies impacted by
activities in the Central Area.
Shoreland and Floodplain Management Shoreland alterations or structures (DNR). Minnesota Rules Ch. 6120 No/No There is no shoreland in the Central Area.
Wetlands Conservation Act Protection of wetlands. Minnesota Statute 103G.221-2373 No/No There are no known wetlands in the Central Area.
Wetlands conservation Protection of wetlands, wetland functions for determining public values. Minnesota Rules 8420 No/No There are no known wetlands in the Central Area.
Ordinance for work in street right-of-way
Regulates obstructions and excavations in the city right-of-way through issuance of permits.
City of Minneapolis Code of Ordinances, Chapter 430 Yes/-- Substantive requirements applicable to on-site activities pertaining
to obstruction, excavation, and restoration.
1 "Yes/--": If a requirement is potentially applicable , determination of relevant and appropriate or TBC status is not made.
State and Local

Table 3Potential Chemical-Specific ARARs and TBCs
East Hennepin Avenue SiteMinneapolis, MN
Table 3Page 1 of 2
Standard Requirement CitationPotentially Applicable/ Relevant and Appropriate TBC1 Comments
Safe Drinking Water ActNational Primary Drinking Water Standards setting maximum contaminant levels (MCLs).
40 CFR 14140 CFR 14240 CFR 143
No/No
Groundwater is not utilized as a drinking water source. Institutional controls at the Site and Central Area, including a Special Well and Boring Construction Area, require approval from MDH prior to new well construction.
Underground Injection Control Requirements Regulates subsurface injection of fluids. 40 CFR 144 Yes/-- Substantive UIC requirements may apply if remedial action
includes injection into groundwater.
Clean Water ActFederal Water Quality Standards (WQS)
Ambient Water Quality Criteria established to protect aquatic life and human consumers of water or aquatic life.
40 CFR 131 No/No Federal WQS are not ARARs.
Clean Water ActWetlands ProtectionSection 104
Protection of Wetlands 33 CFR 238 No/No No wetlands are anticipated to be affected by remedial action.
General Pre-Treatment Regulations for Existing and New Sources of POTWs
Effluent limitations and pre-treatment standards and guidelines for existing sources, new sources.
40 CFR 403 No/No Remedial action unlikely to involve discharge of wastewater.
National Pollution Discharge Elimination System (NPDES)
Regulates discharge of pollutant from point source into waters of the United States. 40 CFR 122 No/No
Substantive requirements may be applicable if discharge to surface water is part of a remedial action. Discharge to surface water is not anticipated.
National Ambient Air Quality Standards (NAAQS)
Establishes acceptable ambient air concentrations. 40 CFR 50 No/No NAAQS are not ARARs.
Clean Air ActNESHAP/NSPS/PSD
Establishes emission standards for hazardous air pollutants for which no ambient air quality standards exist.
40 CFR Part 53,60,61 No/NoSubstantive requirements applicable only if identified pollutants will be emitted in excess of threshold amounts. This is not anticipated to occur.
Vapor intrusion pathway
For evaluating the potential risks to human health caused by vapor intrusion (the migration of volatile compounds from contaminated soil or groundwater to the indoor air of occupied buildings).
OSWER Technical Guide for Assessing and Mitigating the Vapor Intrusion Pathway from Subsurface Vapor Sources to Indoor Air, OSWER Publication 9200.2-154, June 2015
TBC
EPA guidance document. The guidance contains vapor intrusion screening levels (VISLs) for indoor air, soil gas, and groundwater concentrations for use when evaluating the vapor intrusion pathway at contaminated sites. The guidance states that vapor intrusion screening levels for groundwater are not intended to be used as cleanup levels.
Federal

Table 3Potential Chemical-Specific ARARs and TBCs
East Hennepin Avenue SiteMinneapolis, MN
Table 3Page 2 of 2
Standard Requirement CitationPotentially Applicable/ Relevant and Appropriate TBC1 Comments
Health Risk Limits for groundwater
Establishes human health based groundwater standards (MDH) known as Health Risk Limits (HRLs).
Minnesota Rules Ch. 4717.7500 and 4717.7801 to 4717.7900 No/No
Groundwater is not utilized as a drinking water source. Institutional controls at the Site and Central Area, including a Special Well and Boring Construction Area, require approval from MDH prior to new well construction.
Groundwater Guidance Document
Framework for evaluating groundwater contamination and managing remediation decisions.
MPCA Groundwater Guidance Document, September 1998 TBC
Groundwater is not utilized as a drinking water source. Institutional controls at the Site and Central Area, including a Special Well and Boring Construction Area, require approval from MDH prior to new well construction.
Ambient Air Quality Standards Establishes acceptable air concentrations. Minnesota Rules Ch. 7009 No/No Remedial actions do not have emissions that will affect air quality.
Standards for Stationary Air Sources
Compliance with applicable state air pollution control rules for new and existing emission facilities.
Minnesota Rules Ch. 7011 No/No Substantive requirements applicable only if identified pollutants will be emitted in excess of threshold amounts.
Vapor intrusion pathway
For evaluating the potential risks to human health caused by vapor intrusion (the migration of volatile compounds from contaminated soil or groundwater to the indoor air of occupied buildings).
MPCA Risk-Based Guidance for the Vapor Intrusion Pathway, Superfund RCRA and Voluntary Cleanup Section, September 2008. MPCA Vapor Intrusion Technical Support Document, Remediation Division, August 2010.
TBC
MPCA guidance documents. The guidance contains intrusion screening values (ISVs) for indoor air, soil gas, and groundwater concentrations for use when evaluating the vapor intrusion pathway at contaminated sites. ISVs for trichloroethylene (TCE) were used to guide the sub-slab soil gas sampling and building mitigation project. The guidance states that groundwater ISVs should not be used for remedial action levels.
1 "Yes/--": If a requirement is potentially applicable , determination of relevant and appropriate or TBC status is not made.
State and Local

Table 4Remedial Technology and Process Option Screening
East Hennepin Avenue SiteMinneapolis, MN
Table 4Page 1 of 5
Remedial Technology 1,2,3 Process Option Description Effectiveness 3,4 Implementability 3,5 Relative Cost 6 Screening Comment
No Further Action None
No further action beyond completed operation of legacy groundwater extraction system, installation of vapor mitigation systems, and institutional controls already implemented.
Effective at addressing vapor risk to buildings with mitigation systems.
Legacy groundwater extraction system, vapor mitigation systems, and institutional controls already implemented.
Zero Retained for consideration.
Sub-slab depressurization (SSD) systems and floor sealing
Mitigate remaining buildings within the Central Area as appropriate based on sub-slab and/or indoor air sampling and where access is provided.
Very effective. Addresses risk to remaining residences within the Central Area.
Readily implementable as long as access is provided. Moderate Retained for consideration.
HVAC system to maintain positive pressure in building
Modify HVAC systems that maintain a positive pressure in the building basement to prevent soil gas migration to indoor air.
Effective. Addresses vapor intrusion risk where it can be implemented.
Not implementable due to the type, age, and variety of HVAC systems. Moderate Not retained for consideration due to lack of
implementability.
Operation and Maintenance of Mitigation Systems Operation and Maintenance (O&M) Plan
Develop and implement an O&M plan for vapor mitigation systems.
Very effective. Addresses long-term risk to buildings within the Central Area.
Readily implementable as long as access is provided. Low Retained for consideration.
ICs pertaining to mitigation systems City ordinance or other area-wide control
Ordinance or other area-wide control pertaining to mitigation systems.
Very effective for preventing potential exposure at locations with mitigation systems.
Requires city (or other regulatory agency) cooperation. Low Retained for consideration.
Physical Barrier Grout capPlace buried horizontal grout cap over groundwater impacts via grout injection (horizontal or vertical injection) to cut off the groundwater to indoor air exposure pathway.
Uncertain effectiveness as this technology has not been applied to mitigate vapor intrusion over a large area with access limitations.
Not implementable due to access limitations. HighNot retained for consideration due to lack of implementability and uncertain effectiveness.
Hydraulic Barrier Extraction wells with infiltration galleries
Promote a strong downward vertical gradient and clean shallow groundwater by extracting water from the bottom of the surficial aquifer and replenishing it at the top with treated water and/or stormwater via infiltration galleries.
Uncertain effectiveness in disconnecting the groundwater to soil gas pathway (unproven technology). Risk that residual soil gas may still be present for many years after implementation.
Readily implementable at select locations (within rights-of-way). Moderate Not retained for consideration due to
uncertain effectiveness.
Soil Excavation at Site Excavators, trucks Excavate source material at the Site. Recent investigations have not identified source material present at the Site.
Disposal area drums removed in 1981. Implementation on a small scale constrained by buildings, streets, and railroads.
Low Not retained since no source material has been identified at the Site.
Soil Excavation of Central Area Excavators, trucks Excavate soil impacted by groundwater beneath and throughout the Central Area.
This would require a very large volume of excavation to remove a small amount of TCE mass. Not effective as the residual groundwater impacts would not be removed by soil excavation. No source material from the Site has been found in the Central Area.
Not implementable due to access limitations. This alternative would require demolition and excavation of the entire Central Area.
Very high Not retained due to lack of implementability and effectiveness.
Restart Legacy Groundwater Extraction SystemExtraction wells with submersible pumps and treatment
Remove and/or contain contaminated groundwater for treatment and/or disposal.
Legacy groundwater system was effective at reducing groundwater concentrations 1-3 orders of magnitude. The groundwater extraction system was turned off after asymptotic recovery was measured. Not effective as a sole remedial technology because restarting the legacy groundwater extraction system would not significantly reduce groundwater concentrations in a reasonable timeframe.
Legacy Groundwater Extraction System removed approximately 7,000 lbs of TCE. Implementable if existing NPDES permit can be modified appropriately.
Low Not retained for consideration due to limited effectiveness.
No Action
Vapor Mitigation - Additional Installations
Install vapor mitigation systems at residences within the Central Area that do not currently have mitigation systems. There are 10 residences that do not currently have mitigation systems in the Central Area (5 owners did not provide access; 3 owners declined mitigation systems; and 2 properties with indoor air sampling TCE concentrations below applicable MPCA intrusion screening values or indoor air criteria).
Vapor Mitigation - O&M
Institutional Controls (ICs)
Containment
Physical Removal

Table 4Remedial Technology and Process Option Screening
East Hennepin Avenue SiteMinneapolis, MN
Table 4Page 2 of 5
Remedial Technology 1,2,3 Process Option Description Effectiveness 3,4 Implementability 3,5 Relative Cost 6 Screening Comment
Extraction wells with submersible pumps, treatment, and discharge to storm sewer
Remove and/or contain contaminated groundwater for treatment and/or disposal.
Not effective as sole remedial technology because it does not remove risk of vapor intrusion until a distant timeframe as demonstrated by operation of the legacy groundwater extraction system. Groundwater extraction is effective at altering groundwater flow and providing containment/capture when used in combination with other remedial alternatives.
Readily implementable at select locations (within right-of-way) assuming existing NPDES permit can be modified appropriately.
Moderate Retained for consideration as part of a combined remedial approach.
Extraction with submersible wells and reinjection via injection wells
Remove and/or contain contaminated groundwater for treatment and/or injection.
Not effective as sole remedial technology because it does not remove risk of vapor intrusion until a distant timeframe as demonstrated by operation of the legacy groundwater extraction system. Groundwater extraction is effective at altering groundwater flow and providing containment/capture when used in combination with other remedial alternatives.
Readily implementable at select locations (within rights-of-way) assuming underground injection control program approval can be obtained.
Moderate Retained for consideration as part of a combined remedial approach.
Vertical injection and extraction wells
Use vertical wells to inject air into the groundwater and extract soil vapor from the vadose zone.
Moderate effectiveness within the sparge curtain where volatilization within air-flow channels is occurring. Likely not effective area-wide as right-of-way spacing (150-200 feet) is greater than radius of influence (10-20 feet) of sparge wells. Sparging may increase TCE vapor concentrations if SVE system does not adequately capture vapors.
Readily implementable at select locations (within rights-of-way). High Not retained for consideration due to limited
effectiveness.
Horizontal injection and extraction wells installed by directional drilling
Use horizontal wells to inject air into the groundwater and extract soil vapor from the vadose zone.
Moderate effectiveness within the sparge curtain where volatilization within air-flow channels is occurring. Likely not effective area-wide due to access limitations and width of influence (10-20 feet) of sparge wells. Sparging may increase TCE vapor concentrations if SVE system does not adequately capture vapors.
Not implementable throughout the Central Area due to presence of utilities and the offset distance required for directional drilling to reach target depth.
High Not retained for consideration due to lack of implementability and limited effectiveness.
Air Sparging with Soil Vapor Extraction (AS/SVE)
Expanded/Modified Groundwater Extraction
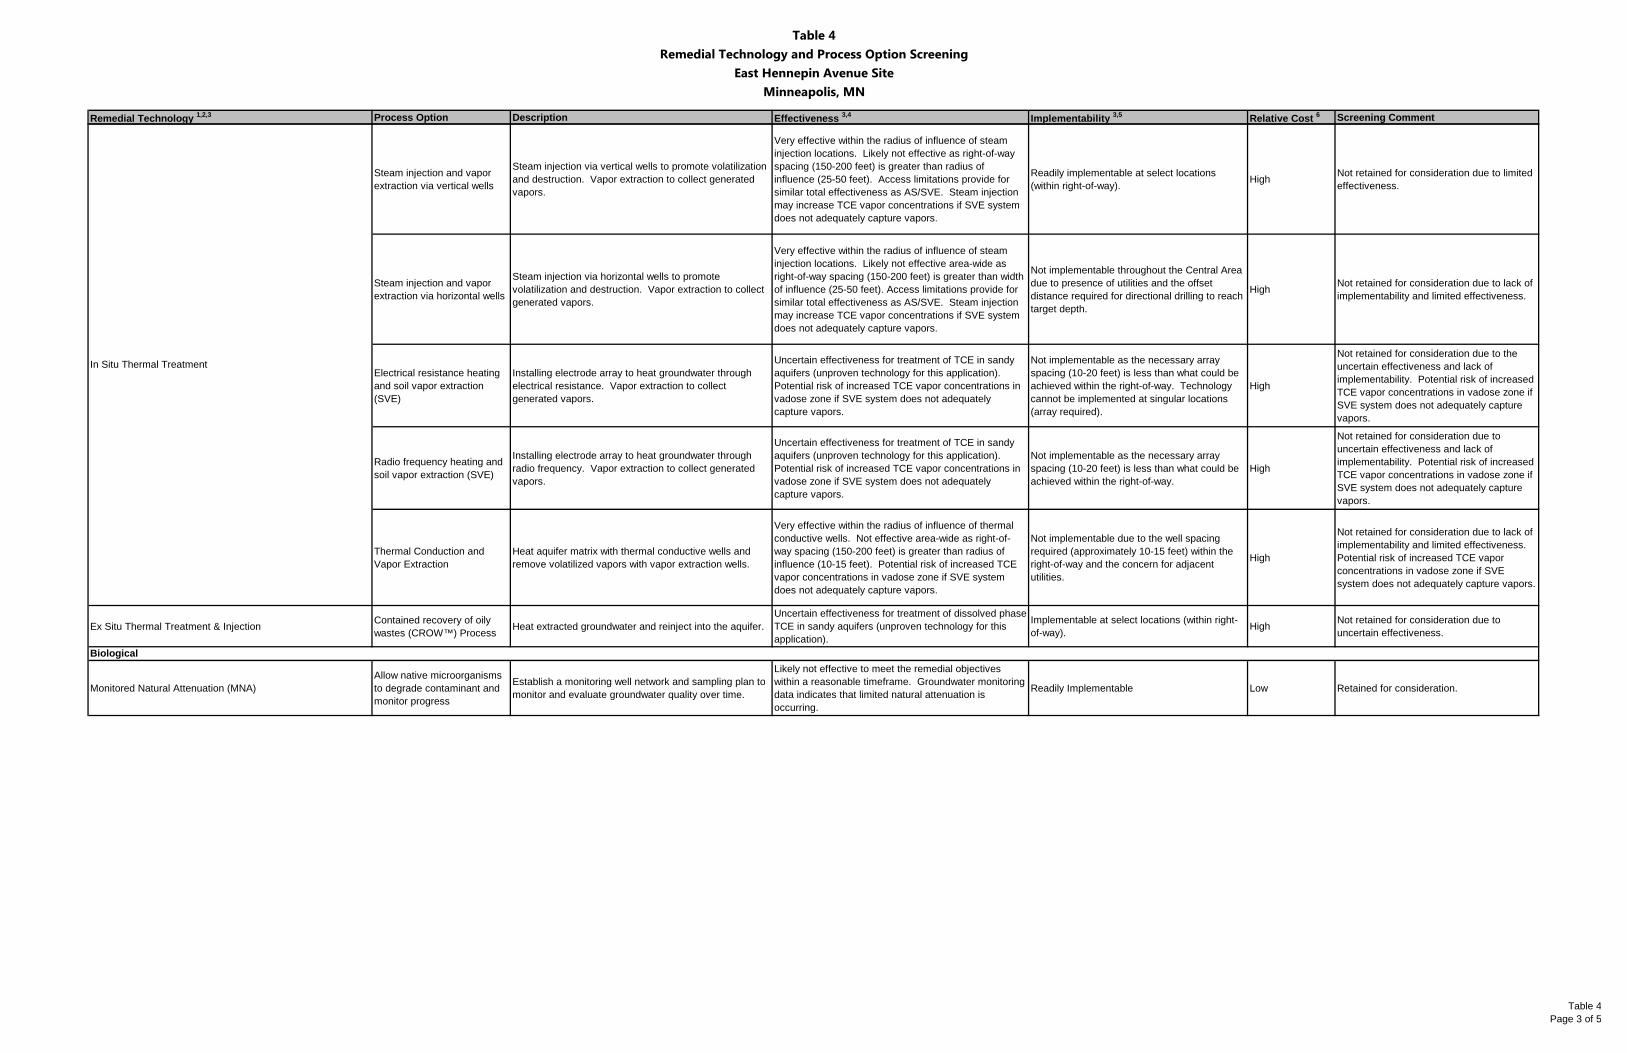
Table 4Remedial Technology and Process Option Screening
East Hennepin Avenue SiteMinneapolis, MN
Table 4Page 3 of 5
Remedial Technology 1,2,3 Process Option Description Effectiveness 3,4 Implementability 3,5 Relative Cost 6 Screening Comment
Steam injection and vapor extraction via vertical wells
Steam injection via vertical wells to promote volatilization and destruction. Vapor extraction to collect generated vapors.
Very effective within the radius of influence of steam injection locations. Likely not effective as right-of-way spacing (150-200 feet) is greater than radius of influence (25-50 feet). Access limitations provide for similar total effectiveness as AS/SVE. Steam injection may increase TCE vapor concentrations if SVE system does not adequately capture vapors.
Readily implementable at select locations (within right-of-way). High Not retained for consideration due to limited
effectiveness.
Steam injection and vapor extraction via horizontal wells
Steam injection via horizontal wells to promote volatilization and destruction. Vapor extraction to collect generated vapors.
Very effective within the radius of influence of steam injection locations. Likely not effective area-wide as right-of-way spacing (150-200 feet) is greater than width of influence (25-50 feet). Access limitations provide for similar total effectiveness as AS/SVE. Steam injection may increase TCE vapor concentrations if SVE system does not adequately capture vapors.
Not implementable throughout the Central Area due to presence of utilities and the offset distance required for directional drilling to reach target depth.
High Not retained for consideration due to lack of implementability and limited effectiveness.
Electrical resistance heating and soil vapor extraction (SVE)
Installing electrode array to heat groundwater through electrical resistance. Vapor extraction to collect generated vapors.
Uncertain effectiveness for treatment of TCE in sandy aquifers (unproven technology for this application). Potential risk of increased TCE vapor concentrations in vadose zone if SVE system does not adequately capture vapors.
Not implementable as the necessary array spacing (10-20 feet) is less than what could be achieved within the right-of-way. Technology cannot be implemented at singular locations (array required).
High
Not retained for consideration due to the uncertain effectiveness and lack of implementability. Potential risk of increased TCE vapor concentrations in vadose zone if SVE system does not adequately capture vapors.
Radio frequency heating and soil vapor extraction (SVE)
Installing electrode array to heat groundwater through radio frequency. Vapor extraction to collect generated vapors.
Uncertain effectiveness for treatment of TCE in sandy aquifers (unproven technology for this application). Potential risk of increased TCE vapor concentrations in vadose zone if SVE system does not adequately capture vapors.
Not implementable as the necessary array spacing (10-20 feet) is less than what could be achieved within the right-of-way.
High
Not retained for consideration due to uncertain effectiveness and lack of implementability. Potential risk of increased TCE vapor concentrations in vadose zone if SVE system does not adequately capture vapors.
Thermal Conduction and Vapor Extraction
Heat aquifer matrix with thermal conductive wells and remove volatilized vapors with vapor extraction wells.
Very effective within the radius of influence of thermal conductive wells. Not effective area-wide as right-of-way spacing (150-200 feet) is greater than radius of influence (10-15 feet). Potential risk of increased TCE vapor concentrations in vadose zone if SVE system does not adequately capture vapors.
Not implementable due to the well spacing required (approximately 10-15 feet) within the right-of-way and the concern for adjacent utilities.
High
Not retained for consideration due to lack of implementability and limited effectiveness. Potential risk of increased TCE vapor concentrations in vadose zone if SVE system does not adequately capture vapors.
Ex Situ Thermal Treatment & Injection Contained recovery of oily wastes (CROW™) Process Heat extracted groundwater and reinject into the aquifer.
Uncertain effectiveness for treatment of dissolved phase TCE in sandy aquifers (unproven technology for this application).
Implementable at select locations (within right-of-way). High Not retained for consideration due to
uncertain effectiveness.
Monitored Natural Attenuation (MNA)Allow native microorganisms to degrade contaminant and monitor progress
Establish a monitoring well network and sampling plan to monitor and evaluate groundwater quality over time.
Likely not effective to meet the remedial objectives within a reasonable timeframe. Groundwater monitoring data indicates that limited natural attenuation is occurring.
Readily Implementable Low Retained for consideration.
In Situ Thermal Treatment
Biological

Table 4Remedial Technology and Process Option Screening
East Hennepin Avenue SiteMinneapolis, MN
Table 4Page 4 of 5
Remedial Technology 1,2,3 Process Option Description Effectiveness 3,4 Implementability 3,5 Relative Cost 6 Screening Comment
Aerobic co-metabolism via injection wells
Use injection wells to deliver carbon substrate and oxygen to the sub-surface to promote aerobic co-metabolism.
Moderate effectiveness demonstrated at sites with low-level impacts over large areas. Pilot testing necessary to confirm site-specific effectiveness. Potential risk of secondary groundwater impacts (e.g. metals liberation).
Readily implementable at select locations (within right-of-way). High
Retained for consideration as part of a combined remedial approach. Potential risk of secondary groundwater impacts.
Aerobic co-metabolism via permeable reactive barrier
Install trenches with reactive media to support aerobic co-metabolism.
Moderate effectiveness demonstrated at sites with low-level impacts over large areas. Pilot testing necessary to confirm site-specific effectiveness. Potential risk of secondary groundwater impacts (e.g. metals liberation).
Not implementable as there are not accessible locations for reactive barriers within the Central Area due to utilities and other interferences.
High Not retained for consideration due to lack of implementability.
Enhanced reductive dechlorination via injection wells
Use injection wells to deliver carbon substrate to the sub-surface to promote biodegradation of contaminants.
Moderate effectiveness demonstrated at sites with low-level impacts over large areas. Additional testing likely necessary to evaluate site-specific effectiveness. Potential risk of methane or low-chlorinated compound (e.g. vinyl chloride) accumulation. Potential risk of secondary groundwater impacts (e.g. metals liberation).
Readily implementable at select locations (within right-of-way). High
Retained for consideration. Potential risk of methane or low-chlorinated compound (e.g. vinyl chloride) accumulation. Potential risk of secondary groundwater impacts.
Enhanced reductive dechlorination via permeable reactive barrier or biowall
Install trench with reactive media to support enhanced reductive dechlorination.
Moderate effectiveness demonstrated at sites with low-level impacts over large areas. Additional testing likely necessary to evaluate site-specific effectiveness. Potential risk of methane or low-chlorinated compound (e.g. vinyl chloride) accumulation. Potential risk of secondary groundwater impacts (e.g. metals liberation).
Not implementable as there are not accessible locations for reactive barriers within the Central Area due to utilities and other interferences.
High Not retained for consideration due to lack of implementability.
Bio-geochemical via injection wells
Stimulate subsurface micro-organisms to convert naturally occurring minerals or added materials into reducing minerals that abiotically degrade contaminants.
Effectiveness is limited by aquifer mineralology. Effectiveness has not been demonstrated with injection wells at sites with low-level impacts over large areas.
Readily implementable at select locations (within right-of-way). High Not retained for consideration due to
uncertain effectiveness.
Bio-geochemical via permeable reactive barrier
Install trench with reactive media to support abiotic bio-geochemical degradation of contaminants.
Moderate effectiveness demonstrated at sites with low-level impacts over large areas. Additional testing likely necessary to evaluate site-specific effectiveness.
Not implementable as there are not accessible locations for reactive barriers within the Central Area due to utilities and other interferences.
High Not retained for consideration due to lack of implementability.
Phyto-remediation Plant trees across the Central Area
Selected species of trees are planted across the Central Area to uptake, contain, degrade, or eliminate contaminants
Moderate effectiveness demonstrated at similar sites with no access limitations.
Not implementable (most of the treatment area is developed) Moderate Not retained for consideration due to lack of
implementability.
Inject chemical oxidants via temporary probes
Inject chemical oxidants with temporary injection points across the treatment area
Uncertain effectiveness as this technology has not been applied effectively to remediate low-level impacts over large areas. Likely not effective due to access limitations, radius of influence (5-10 feet), and one time application of oxidants. Potential risk of secondary groundwater impacts (e.g., metals liberation).
Readily implementable at select locations (within right-of-way). High
Not retained for consideration due to lack of effectiveness and risk of secondary groundwater quality impacts.
Inject chemical oxidants via injection wells
Inject chemical oxidants with permanent wells placed across the treatment area
Uncertain effectiveness as this technology has not been applied effectively with low-level impacts over large areas. Likely not effective due to access limitations and radius of influence (10-20 feet). Potential risk of secondary groundwater impacts (e.g., metals liberation).
Readily implementable at select locations (within right-of-way). High
Not retained for consideration due to uncertain effectiveness and risk of secondary groundwater quality impacts.
In Situ Bioremediation
In Situ Chemical Oxidation
Chemical

Table 4Remedial Technology and Process Option Screening
East Hennepin Avenue SiteMinneapolis, MN
Table 4Page 5 of 5
Remedial Technology 1,2,3 Process Option Description Effectiveness 3,4 Implementability 3,5 Relative Cost 6 Screening Comment
Add chemical reductants to the subsurface via temporary probes
Add chemical reductants to the subsurface via temporary injection points across the treatment area
Uncertain effectiveness as this technology has not been applied effectively with low-level impacts over large areas. Likely not effective due to access limitations, radius of influence (5-10 feet), and one time application of reductants. Potential risk of secondary groundwater impacts (e.g., metals liberation).
Readily implementable at select locations (within right-of-way). High
Not retained for consideration due to lack of effectiveness and risk of secondary groundwater quality impacts.
Add chemical reductants to the subsurface via injection wells
Add chemical reductants to the subsurface via injection wells across the treatment area.
Uncertain effectiveness as this technology has not been applied effectively with low-level impacts over large areas. Likely not effective due to access limitations and radius of influence. Potential risk of secondary groundwater impacts (e.g., metals liberation).
Readily implementable at select locations (within right-of-way). High
Not retained for consideration due to uncertain effectiveness and risk of secondary groundwater quality impacts.
Add chemical reductants to the subsurface via permeable reactive barrier
Add chemical reductants to the subsurface by constructing a permeable reactive barrier.
Moderate effectiveness demonstrated at sites with low-level impacts over large areas. Pilot testing necessary to confirm site-specific effectiveness. Effectiveness is uncertain based on right-of-way spacing (150 - 200 feet), advective flow rate (800 feet per year) and ability to treat groundwater down-gradient of the barrier. Potential risk of secondary groundwater impacts (e.g., metals liberation).
Not implementable as there are not accessible locations for reactive barriers within the Central Area due to utilities and other interferences.
High Not retained for consideration due to lack of implementability.
Electrolytic Reactive BarrierVoltage is applied to electrodes within a permeable reactive barrier (PRB)
Electrical potential is applied to spaced electrodes within the PRB. Dissolved contaminants are subject to oxidation-reduction (or reduction-oxidation) dependent on the sequence of charges applied.
Uncertain effectiveness as this technology has not been demonstrated. The technology is effective at reducing flux, but the effectiveness for a larger area is dependent on advective transport to the barrier and diffusion from the aquifer matrix.
Implementable at select locations (within right-of-way). High Not retained for consideration due to
uncertain effectiveness.
Notes:
Electrical
6 Relative cost is for comparative purposes only and is judged relative to the other processes and technologies that involve similar functions.
1 The remedial action objective is defined as the following: Maintain insignificant potential risk to human health from inhalation exposure to TCE in indoor air resulting from TCE concentrations in soil gas and groundwater. 2 The feasibility study area is defined as the Central Area.3 TCE from one or more potential releases up-gradient of the Central Area are the predominant cause of TCE concentrations in groundwater. Groundwater impacts up-gradient of the Central Area are outside of the scope of this feasibility study. Until the extent and magnitude of the impacts associated with the off-Site sources are defined and addressed, remedial action to address groundwater will not be effective at reducing TCE concentrations in groundwater in the Central Area due to continuing re-contamination from these up-gradient sources. 4 Effectiveness is defined as the ability to perform as part of an overall alternative that can meet the objectives within 30 years under conditions and limitations that exist onsite.5 Implementability is defined as the likelihood that the process could be implemented as part of the remedial action plan under the physical (work completed from public rights-of-way), regulatory, technical, and schedule constraints.
In Situ Chemical Reduction
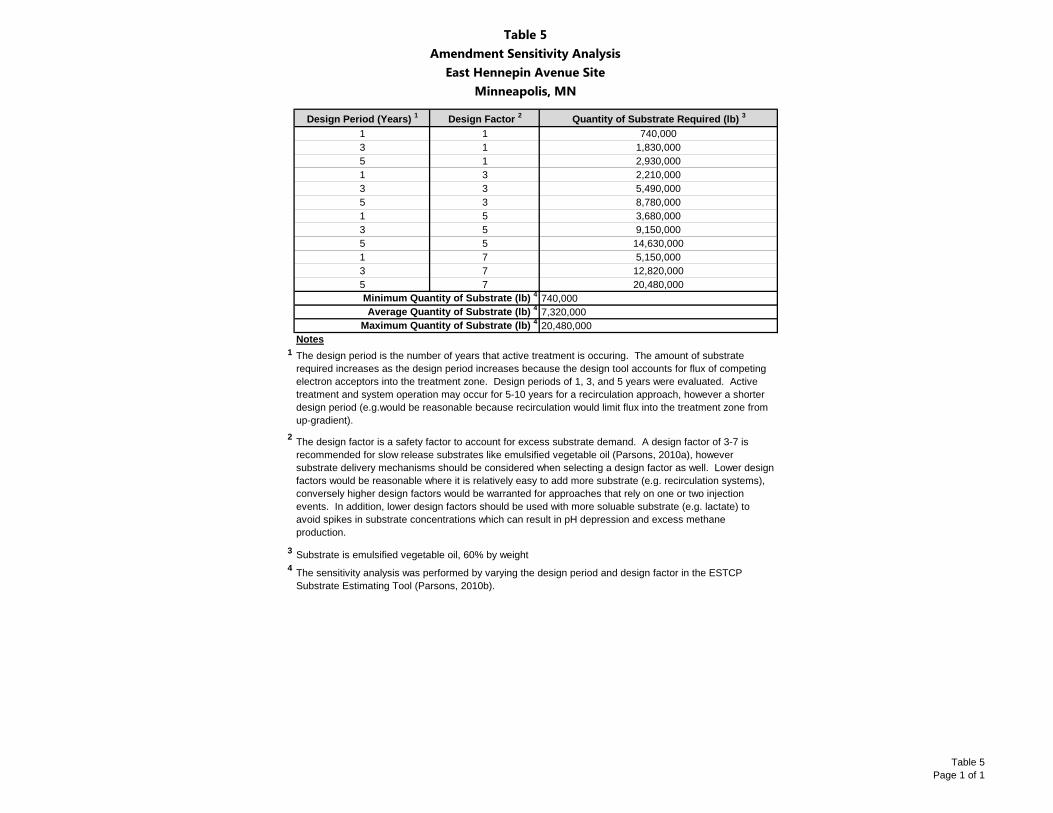
Table 5Amendment Sensitivity Analysis
East Hennepin Avenue SiteMinneapolis, MN
Table 5Page 1 of 1
Design Period (Years) 1 Design Factor 2 Quantity of Substrate Required (lb) 3
1 1 740,000 3 1 1,830,000 5 1 2,930,000 1 3 2,210,000 3 3 5,490,000 5 3 8,780,000 1 5 3,680,000 3 5 9,150,000 5 5 14,630,000 1 7 5,150,000 3 7 12,820,000 5 7 20,480,000
740,0007,320,00020,480,000
Notes1
2
3
4 The sensitivity analysis was performed by varying the design period and design factor in the ESTCP Substrate Estimating Tool (Parsons, 2010b).
Minimum Quantity of Substrate (lb) 4
Average Quantity of Substrate (lb) 4
Maximum Quantity of Substrate (lb) 4
Substrate is emulsified vegetable oil, 60% by weight
The design period is the number of years that active treatment is occuring. The amount of substrate required increases as the design period increases because the design tool accounts for flux of competing electron acceptors into the treatment zone. Design periods of 1, 3, and 5 years were evaluated. Active treatment and system operation may occur for 5-10 years for a recirculation approach, however a shorter design period (e.g.would be reasonable because recirculation would limit flux into the treatment zone from up-gradient).
The design factor is a safety factor to account for excess substrate demand. A design factor of 3-7 is recommended for slow release substrates like emulsified vegetable oil (Parsons, 2010a), however substrate delivery mechanisms should be considered when selecting a design factor as well. Lower design factors would be reasonable where it is relatively easy to add more substrate (e.g. recirculation systems), conversely higher design factors would be warranted for approaches that rely on one or two injection events. In addition, lower design factors should be used with more soluable substrate (e.g. lactate) to avoid spikes in substrate concentrations which can result in pH depression and excess methane production.

Table 6Comparative Analysis Summary by Alternatives
East Hennepin Avenue SiteMinneapolis, MN
Table 6Page 1 of 2
Overall Protection of Human Health
and the Environment6
Compliance with ARARs7
Long-Term Effectiveness
and Permanence8
Reduction of Toxicity, Mobility,
or Volume through
Treatment9Short Term
Effectiveness10 Implementability11Estimated
Cost12Cost
Range13State
Acceptance14Local
Acceptance15
Incremental Reduction in
Vapor Intrusion Risk16
Adverse Secondary Impacts17
Adverse Sustainability
Impacts18Construction
Time19
Alternative 1 - No Further Action Beyond Previous Response Actions
◒ ◒ ◒ ○ ● ● $0 $0 Baseline None Baseline None
Alternative 2 - Monitored Natural Attenuation (MNA)
◒ ◒ ◒ ○ ● ● $1.3M $0.9M-$1.9M Minimal None Similar to baseline None
Alternative 3 - Long Term O&M of SSD Systems
● ● ● ○ ● ● $2.0M $1.4M-$3.0MAdded long-term benefit with O&M
None Similar to baseline < 1 year
Alternative 4 - Enhanced Bioremediation via Injection Event(s)
◒ ◒ ◒ ◒ ◒ ◒ $26M $6M-$90MSignificant Uncertainty20
Risk of methane generation, vinyl chloride generation, and metals liberation.
GHG impacts:3,800 metric tons CO2-eqEnergy footprint:66,000 MMBTUWorker injury risk:1.0 accidents
+/- 5 years
Alternative 5 - Enhanced Bioremediation via Recirculating System
◒ ◒ ◒ ● ◒ ◒ $42M $19M-$100MSignificant Uncertainty20
Risk of methane generation, vinyl chloride generation, and metals liberation.
GHG impacts:4,400 metric tons CO2-eqEnergy footprint:70,000 MMBTUWorker injury risk:4.0 accidents
+/- 10 years
Scale
○◒
Comments:
●
Remedial action objective:
Remedial Alternatives1
Additional Considerations5
Does not meet criteria
Potentially meets criteria
Meets criteria
Maintain insignificant potential risk to human health from inhalation exposure to TCE in indoor air resulting from TCE concentrations in soil gas and groundwater. As stated in the RAP Modification #1, General Mills is responsible only for implementing response actions to address impacts that are due to General Mills operations at the Site. The feasibility study area is defined as the Central Area. TCE from one or more potential releases up-gradient of the Central Area are the predominant cause of TCE concentrations in groundwater. Groundwater impacts up-gradient of the Central Area are outside of the scope of this feasibility study. Until the extent and magnitude of the impacts associated with the off-Site sources are defined and addressed, remedial action to address groundwater will not be effective at reducing TCE concentrations in groundwater in the Central Area due to continuing re-contamination from these up-gradient sources.
Modifying Criteria4Balancing Criteria3Threshold Criteria2
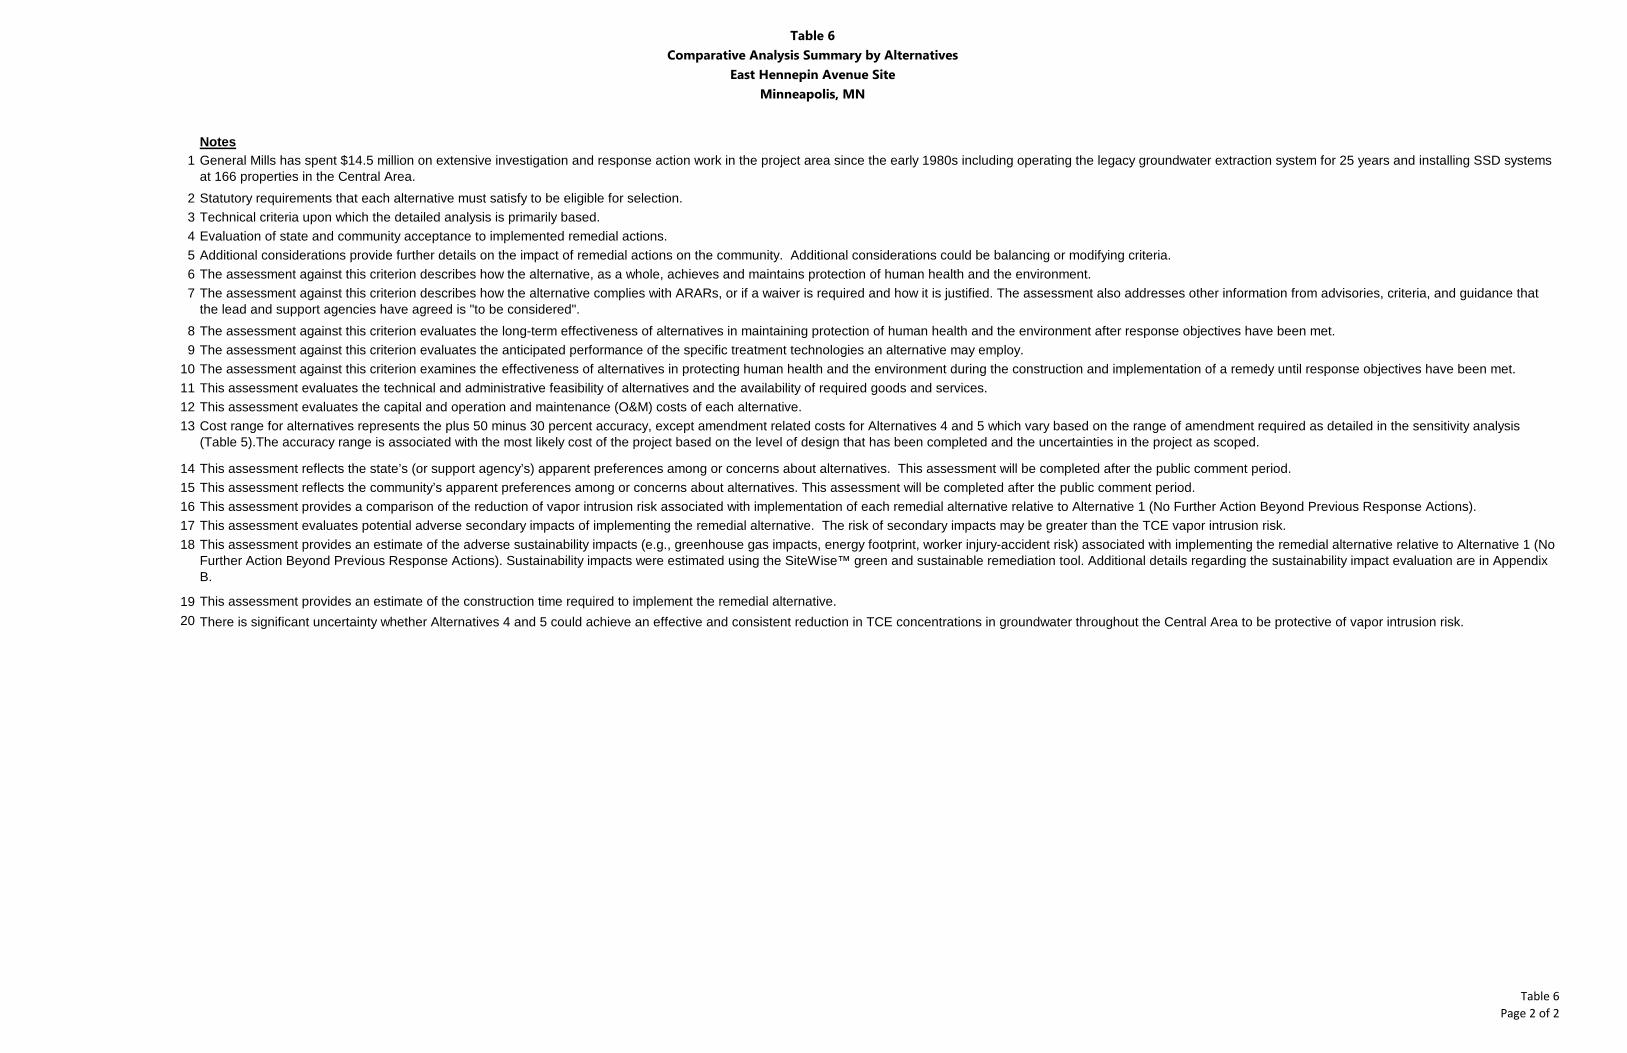
Table 6Comparative Analysis Summary by Alternatives
East Hennepin Avenue SiteMinneapolis, MN
Table 6Page 2 of 2
Notes1
234567
89
10111213
1415161718
1920
General Mills has spent $14.5 million on extensive investigation and response action work in the project area since the early 1980s including operating the legacy groundwater extraction system for 25 years and installing SSD systems at 166 properties in the Central Area.
This assessment provides an estimate of the construction time required to implement the remedial alternative.
Statutory requirements that each alternative must satisfy to be eligible for selection.Technical criteria upon which the detailed analysis is primarily based.
This assessment evaluates potential adverse secondary impacts of implementing the remedial alternative. The risk of secondary impacts may be greater than the TCE vapor intrusion risk.This assessment provides an estimate of the adverse sustainability impacts (e.g., greenhouse gas impacts, energy footprint, worker injury-accident risk) associated with implementing the remedial alternative relative to Alternative 1 (No Further Action Beyond Previous Response Actions). Sustainability impacts were estimated using the SiteWise™ green and sustainable remediation tool. Additional details regarding the sustainability impact evaluation are in Appendix B.
This assessment reflects the state’s (or support agency’s) apparent preferences among or concerns about alternatives. This assessment will be completed after the public comment period.This assessment reflects the community’s apparent preferences among or concerns about alternatives. This assessment will be completed after the public comment period.This assessment provides a comparison of the reduction of vapor intrusion risk associated with implementation of each remedial alternative relative to Alternative 1 (No Further Action Beyond Previous Response Actions).
Cost range for alternatives represents the plus 50 minus 30 percent accuracy, except amendment related costs for Alternatives 4 and 5 which vary based on the range of amendment required as detailed in the sensitivity analysis (Table 5).The accuracy range is associated with the most likely cost of the project based on the level of design that has been completed and the uncertainties in the project as scoped.
There is significant uncertainty whether Alternatives 4 and 5 could achieve an effective and consistent reduction in TCE concentrations in groundwater throughout the Central Area to be protective of vapor intrusion risk.
The assessment against this criterion examines the effectiveness of alternatives in protecting human health and the environment during the construction and implementation of a remedy until response objectives have been met.This assessment evaluates the technical and administrative feasibility of alternatives and the availability of required goods and services.This assessment evaluates the capital and operation and maintenance (O&M) costs of each alternative.
Evaluation of state and community acceptance to implemented remedial actions.Additional considerations provide further details on the impact of remedial actions on the community. Additional considerations could be balancing or modifying criteria.The assessment against this criterion describes how the alternative, as a whole, achieves and maintains protection of human health and the environment.The assessment against this criterion describes how the alternative complies with ARARs, or if a waiver is required and how it is justified. The assessment also addresses other information from advisories, criteria, and guidance that the lead and support agencies have agreed is "to be considered".The assessment against this criterion evaluates the long-term effectiveness of alternatives in maintaining protection of human health and the environment after response objectives have been met.The assessment against this criterion evaluates the anticipated performance of the specific treatment technologies an alternative may employ.

Table 7Alternative 2 Cost EstimateEast Hennepin Avenue Site
Minneapolis, MN
Table 7Page1 of 1
Quantity Unit Unit Cost
Estimated Cost
Low Estimate
Cost
High Estimate
Cost
1.0 Contractor Preparation Subtotal 30,000$ 21,000$ 45,000$ 1.1 Monitored Natural Attenuation Work Plan 1 LS 30,000$ 30,000$ 21,000$ 45,000$
30,000$ 20,000$ 50,000$
2.0 Annual Groundwater Sampling Costs Subtotal 80,000$ 50,000$ 120,000$ 2.1 Well Sampling - VOCs 25 Well/Year 1,000$ 25,000$ 17,500$ 37,500$ 2.2 Well Sampling - MNA Parameters and VOCs 10 Well/Year 2,200$ 22,000$ 15,400$ 33,000$ 2.3 Project Management 1 Year 10,000$ 10,000$ 7,000$ 15,000$ 2.4 Annual Groundwater Report 1 Year 20,000$ 20,000$ 14,000$ 30,000$
77,000$ 53,900$ 115,500$ 960,000$ 670,000$ 1,430,000$
3.0 Contingency on Total Cost, 25% 250,000$ 170,000$ 370,000$ $1,300,000 $900,000 $1,900,000
1.12.1
2.22.32.4
3.0
Alternative 2 - Monitored Natural Attenuation
Capital Costs
Sampling Costs (Annual)
Contingency
Total Capital Cost
Annual O&M CostO&M Yrs 1-30 NPV
Contingency based on range of scope and bid contingency recommended in A Guide to Developing and Documenting Cost Estimates During the Feasibility Study (EPA, 2000).Discount rate taken from A Guide to Developing and Documenting Cost Estimates During the Feasibility Study (EPA, 2000).
Costs include labor, expenses, and laboratory costs for sampling and analyzing groundwater samples for VOCs.
AssumptionsCosts include preparation of a MNA work plan that details the methods, procedures, locations, and frequency of monitoring.
SubtotalTotal Cost (NPV, 30 years, 7% discount rate)
Costs include labor, expenses, and laboratory costs for sampling and analyzing groundwater samples for VOCs and MNA parameters. MNA parameter list includes 13 parameters recommended in Technical Protocol for Evaluating Natural Attenuation of Chlorinated Solvents in Groundwater(EPA, 1998).Project management is assumed to be 15 percent of total cost.Assumes preparation of an annual groundwater monitoring report that summarizes groundwater quality trends and natural degradation rates.

Table 8Alternative 3 Cost EstimateEast Hennepin Avenue Site
Minneapolis, MN
Table 8Page 1 of 1
Quantity Unit Unit Cost
Estimated Cost
Low Estimate
Cost
High Estimate
Cost
1.0 Preparation Subtotal 25,000$ 17,500$ 37,500$ 1.1 Mitigation System O&M Plan 1 LS 50,000$ 50,000$ 35,000$ 75,000$ 1.2 Access and Mitigation System Design Meetings 10 Properties 2,500$ 25,000$ 17,500$ 37,500$ 2.0 Engineering and Administration Subtotal 25,000$ 17,500$ 37,500$ 2.1 Mitigation System Design Follow-up 5 Properties 5,000$ 25,000$ 17,500$ 37,500$ 3.0 Install Residential SSD Systems Subtotal 200,000$ 140,000$ 300,000$ 3.1 Contractor and Support for Installations 10 Properties 20,000$ 200,000$ 140,000$ 300,000$ 4.0 Indoor Air Sampling at 2010 E Hennepin Subtotal 150,000$ 105,000$ 225,000$ 4.1 Paired Indoor Air Sampling and Sub-Slab Soil Gas Sampling 1 LS 150,000$ 150,000$ 105,000$ 225,000$ 5.0 Project Management Subtotal 60,000$ 42,000$ 90,000$ 5.1 Project Management, Capital Phase 1 Year 60,000$ 60,000$ 42,000$ 90,000$
Total Capital Cost 460,000$ 320,000$ 690,000$
6.0 Mitigation Systems Subtotal 91,800$ 64,000$ 138,000$ 6.1 Electrical Bill for Properties 176 Building/Year 60$ 10,600$ 7,000$ 16,000$ 6.2 Replacement Fan Cost 18 Fan/Year 2,000$ 36,000$ 25,000$ 54,000$ 6.3 O&M Management and Access Coordination 176 Building/Year 200$ 35,200$ 25,000$ 53,000$ 6.4 Project Management, O&M Phase 1 Year 10,000$ 10,000$ 7,000$ 15,000$
Annual O&M Cost 91,800$ 64,000$ 138,000$ O&M Yrs 1-30 NPV 1,140,000$ 790,000$ 1,710,000$
7.0 Contingency on Total Cost, 25% Subtotal 400,000$ 277,500$ 600,000$ $2,000,000 $1,400,000 $3,000,000
1.11.22.1
3.1
4.15.1
6.1
6.26.36.47.0
Discount rate taken from A Guide to Developing and Documenting Cost Estimates During the Feasibility Study (EPA, 2000).
Assumes coordination of access and design meetings for engineer and mitigation contractor. Does not include multiple design meetings to satisfy extraordinatry property owner requests.
Assumes replacement of fans every 10 years, replacement of an average of 1/10 of the fans during a given year, half of the fans are RadonAway Model RP145 and half are RadonAway model RP265, half a day of contractor time to install a replacement fan, cost includes property access efforts, and no engineer oversight time is required. Costs include contacting property owners annually regarding systems operating status.Project management is assumed to be 15 percent of O&M costs.Contingency based on range of scope and bid contingency recommended in A Guide to Developing and Documenting Cost Estimates During the Feasibility Study (EPA, 2000).
Assumes follow-up meetings at 50 percent of the houses without mitigation systems.
Assumes installation of a mitigation system including diagnostic testing, contractor management, finish carpentry, and preparation of a property summary report. Not included are sub-slab soil-gas testing, indoor air testing, basement floor replacement, or extensive wall or floor patching.
Assumes three sampling events, 13 sub-slab soil gas samples per event, 13 indoor air samples per event, data quality and management costs are equal to laboratory costs (based on costs associated with previous project work), sub-slab sampling is a two week effort per event for one person, indoor air sampling is a two week effort per event for two people (includes chemical inventory), and preparation of a Property Summary Report. Project management is assumed to be 15 percent of the total capital costs (Sections 1.0 through 4.0). Does not include meetings with MPCA regarding specific properties.
Assumes fans are operated 24 hours a day, 365 days a year, half of the fans are RadonAway Model RP145 and half are RadonAway model RP265, fans operated in accordance with manufacturers standards, energy rates based on November 1, 2015 Xcel Energy ratecard for Minnesota, and 176 houses with mitigation systems installed within the Central Area.
AssumptionsAssumes preparation of a mitigation system O&M plan that details the methods, procedures, locations, and frequency of routine mitigation system monitoring.
Alternative 3 - Long-Term O&M of SSD Systems
O&M Costs (Annual)
Capital Costs
Contingency
Total Cost (NPV, 30 years, 7% discount rate)

Table 9Alternative 4 Cost EstimateEast Hennepin Avenue Site
Minneapolis, MN
Table 9Page 1 of 1
Quantity Unit Unit Cost
Estimated Cost
Low Estimate
Cost
High Estimate
Cost Capital Costs
1.0 Engineering and Administration Subtotal 160,000$ -$ -$ 1.1 Project Management, Capital Phase 1 Year 60,000$ 60,000$ 50,000$ 90,000$ 1.2 Engineering and Design 1 LS 60,000$ 60,000$ 50,000$ 90,000$ 1.3 Construction Quality Assurance, Monitoring, & Reporting 1 LS 40,000$ 40,000$ 30,000$ 60,000$ 2.0 Planning and Preparation Subtotal 740,000$ 518,000$ 1,110,000$ 2.1 Access for Injection Well Installation 1 LS 100,000$ 100,000$ 70,000$ 150,000$ 2.2 Permitting 1 LS 100,000$ 100,000$ 70,000$ 150,000$ 2.3 Injection Design Phase Bench and Pilot Testing 1 LS 500,000$ 500,000$ 350,000$ 750,000$ 2.4 Monitoring Wells 10 Well 4,000$ 40,000$ 28,000$ 60,000$ 3.0 Injection Array Construction and Initial Amendment Delivery Subtotal 9,200,000$ 1,100,000$ 36,300,000$ 3.1 Injection Wells 40 Well 10,000$ 400,000$ 280,000$ 600,000$ 3.2 Initial Amendment Delivery 40 Well 220,000$ 8,800,000$ 756,000$ 35,700,000$
Total Capital Cost 10,100,000$ 1,700,000$ 37,500,000$
4.0 Supplemental Amendment Delivery Subtotal 900,000$ 100,000$ 3,600,000$ 4.1 Supplemental Amendment Delivery 1 Year 900,000$ 900,000$ 76,000$ 3,570,000$ 5.0 Monitoring Subtotal 1,290,000$ 904,000$ 1,930,000$ 5.1 Performance Monitoring Yrs 1-3 180 Samples/Year 6,000$ 1,080,000$ 756,000$ 1,620,000$ 5.2 Injection Well Maintenance 40 EA 500$ 20,000$ 14,000$ 30,000$ 5.3 Annual Groundwater Report 1 Year 20,000$ 20,000$ 14,000$ 30,000$ 5.4 Project Management, O&M Phase 1 Year 170,000$ 170,000$ 120,000$ 250,000$
2,190,000$ 1,010,000$ 5,530,000$ 3,600,000$ 1,100,000$ 11,300,000$
O&M Costs (Annual Years 4-6)6.0 Amendment Delivery Subtotal 4,600,000$ 518,000$ 18,150,000$ 6.1 Supplemental Injection Wells 20 Well 10,000$ 200,000$ 140,000$ 300,000$ 6.2 Initial Amendment Delivery at Supplemental Wells 20 Well 220,000$ 4,400,000$ 378,000$ 17,850,000$
4,600,000$ 520,000$ 18,150,000$ 7.0 Monitoring Subtotal 1,740,000$ 949,000$ 3,735,000$ 7.1 Supplemental Amendment Delivery at Supplemental Wells 1 Year 440,000$ 440,000$ 38,000$ 1,790,000$ 7.2 Performance Monitoring Yrs 4-6 180 Samples/Year 6,000$ 1,080,000$ 756,000$ 1,620,000$ 7.3 Injection Well Maintenance 60 EA 500$ 30,000$ 21,000$ 45,000$ 7.4 Annual Groundwater Report 1 Year 20,000$ 20,000$ 14,000$ 30,000$ 7.5 Project Management, O&M Phase 1 Year 170,000$ 170,000$ 120,000$ 250,000$
1,740,000$ 950,000$ 3,740,000$ 6,000,000$ 1,800,000$ 19,100,000$
O&M Costs (Annual Years 7-30)8.0 Monitoring Subtotal 124,000$ 82,800$ 176,000$ 8.1 Performance Monitoring Yrs 7-30 35 Samples/Year 2,400$ 84,000$ 58,800$ 126,000$ 8.2 Annual Groundwater Report 1 Year 20,000$ 20,000$ 14,000$ 30,000$ 8.3 Project Management, O&M Phase 1 Year 20,000$ 20,000$ 10,000$ 20,000$
124,000$ 83,000$ 176,000$ 1,000,000$ 700,000$ 1,400,000$
Contingency9.0 Contingency on Total Cost, 25% Subtotal 6,325,000$ 1,455,000$ 21,862,500$
$26,100,000
1.11.21.3
2.1
2.2
2.3
2.4
3.1
3.2
4.1
5.1
5.25.35.4
6.1
6.27.1
7.2
7.37.47.5
8.1
8.28.3
9.0
Annual O&M Cost Yrs 7-30O&M Yrs 7-30 NPV
Annual O&M Cost Yr 4
Alternative 4 - Enhanced Bioremediation via Injection
O&M Costs (Annual Years 1-3)
Annual O&M Cost Yrs 5-6
Annual O&M Cost Yrs 1-3O&M Yrs 1-3 NPV
O&M Yrs 4-6 NPV
Project management is assumed to be 15 percent of O&M costs.It is assumed that 20 supplemental injection wells will be required to target areas of insufficient amendment delivery. This is assumed as a one time cost in year 4.
$6,100,000
Assumes installation of 2-inch stainless steel well screen with carbon steel riser.
Assumes well redevelopment by a licensed well driller using surging/pumping and biofouling treatment techniques.
It is assumed that supplemental amendment will be necessary to maintain conditions suitable for bioremediation. Supplemental amendments are assumed to be completed at the injection wells installed during initial construction. Supplemental amendment and delivery costs are assumed to be 10 percent of initial amendment and delivery costs per year. There is significant uncertainty regarding the quantity of amendments needed.
Costs include labor, expenses, and laboratory costs for quarterly sampling at 45 groundwater monitoring wells. Analysis inlcudes 25 parameters for monitoring anaerobic bioremediation processes and secondary water quality.
Assumes preparation of an annual groundwater monitoring report that summarizes groundwater quality trends and natural degradation rates.
Access includes costs associated with coordinating access to the public and railroad right-of-ways for injection well installation and amendment delivery operations.Permitting includes costs associated with applying for and securing permits for the work as required by local, State, and Federal regulations.
Injection pilot testing includes installation of one injection well and five monitoring wells for observation of in-situ conditions following injection. Assume 1 percent of amendment and delivery operations costs for full scale. Includes estimated labor and expenses for pilot and bench testing. It is assumed that methane mitigation measures will not be required during pilot testing.
Assumes installation of 2-inch stainless steel well screen with carbon steel riser, pitless adaptors, and traffic rated vaults.
Costs include amendment delivery to injection wells via tanker trucks assuming delivery of emulsified vegetable oil. Emulsified vegetable oil was selected based on in-situ longevity, advective flow rates, and delivery method. Given the uncertainty surrounding the quantity of amendments, a sensitivity analysis was completed using the Substrate Estimating Tool for Enhanced Anaerobic Bioremediation of Chlorinated Solvents, Version 1.2, November 2010, Parsons. The estimate cost assumes the average quantity developed during the sensitivity analysis. Costs were estimated using the range of amendment quantity developed during the sensitivity analysis.
$89,800,000Assumptions
Project management is assumed to be 15 percent of capital cost (excluding amendment expense).Engineering and design is assumed to be 15 percent of capital cost (excluding amendment expense).Construction quality assurance, monitoring, and reporting is assumed to be 10 percent of capital cost (excluding amendment expense).
Total Cost (NPV, 30 years, 7% discount rate)
Assumed as the same as initial amendment delivery costs on a per well basis. This is a one time cost in year 4.Costs assumed to be 10 percent of initial amendment delivery costs at the supplemental injection wells per year.Costs include quarterly sampling at 45 groundwater monitoring wells. Analysis inlcudes 25 parameters for monitoring anaerobic bioremediation processes and secondary water quality.
Assumes preparation of an annual groundwater monitoring report that summarizes groundwater quality trends and natural degradation rates.Project management is assumed to be 15 percent of O&M costs.
Assumes well redevelopment by a licensed well driller using surging/pumping and biofouling treatment techniques.
Costs include annual sampling at 35 groundwater monitoring wells. Analysis inlcudes 12 parameters for monitoring anaerobic bioremediation processes and secondary water quality.Assumes preparation of an annual groundwater monitoring report that summarizes groundwater quality trends and natural degradation rates.Project management is assumed to be 15 percent of O&M costs.
Contingency based on range of scope and bid contingency recommended in A Guide to Developing and Documenting Cost Estimates During the Feasibility Study (EPA, 2000).Discount rate taken from A Guide to Developing and Documenting Cost Estimates During the Feasibility Study (EPA, 2000).

Table 10Alternative 5 Cost EstimateEast Hennepin Avenue Site
Minneapolis, MN
Table 10Page 1 of 1
Table 10 - Alternative 5 Cost EstimateEast Hennepin Avenue SiteMinneapolis, MN
Quantity Unit Unit Cost
Estimated Cost
Low Estimate
Cost
High Estimate
Cost Capital Costs
1.0 Engineering and Administration Subtotal 1,650,000$ -$ -$ 1.1 Project Management, Capital Phase 1 Year 620,000$ 620,000$ 430,000$ 920,000$ 1.2 Engineering and Design 1 LS 620,000$ 620,000$ 430,000$ 920,000$ 1.3 Construction Quality Assurance, Monitoring, & Reporting 1 LS 410,000$ 410,000$ 290,000$ 620,000$ 2.0 Planning and Preparation Subtotal 2,200,000$ 1,600,000$ 3,300,000$ 2.1 Access for Wells, Operations Building, and Conveyance Piping 1 LS 1,400,000$ 1,400,000$ 980,000$ 2,100,000$ 2.2 Permitting 1 LS 100,000$ 100,000$ 70,000$ 150,000$ 2.3 Recirculation Design Phase Bench and Pilot Testing 1 LS 700,000$ 700,000$ 490,000$ 1,050,000$ 2.4 Monitoring Wells 10 Well 4,000$ 40,000$ 28,000$ 60,000$ 3.0 Full Scale Recirculation System Construction and Initial Amendment Delivery Subtotal 12,700,000$ 3,700,000$ 41,900,000$ 3.1 Injection Wells 40 Well 10,000$ 400,000$ 280,000$ 600,000$ 3.2 Extraction Wells 2 EA 15,000$ 30,000$ 21,000$ 45,000$ 3.3 Conveyance Piping 5100 LF 70$ 360,000$ 252,000$ 540,000$ 3.4 Operations Building Construction 2 EA 700,000$ 1,400,000$ 980,000$ 2,100,000$ 3.5 Operations Equipment Procurement and Installation (Tanks, pumps, valves, etc.) 2 EA 820,000$ 1,640,000$ 1,148,000$ 2,460,000$ 3.6 System Startup 1 LS 250,000$ 250,000$ 175,000$ 375,000$ 3.7 Initial Amendment Delivery via Recirculation System 1 LS 8,600,000$ 8,600,000$ 770,000$ 35,700,000$
Total Capital Cost 16,600,000$ 5,300,000$ 45,200,000$
4.0 System Operation Subtotal 1,400,000$ 500,000$ 4,300,000$ 4.1 Supplemental Amendment Delivery 1 Year 860,000$ 860,000$ 77,000$ 3,570,000$ 4.2 Operations and Management Yrs 1-5 1 Year 400,000$ 400,000$ 280,000$ 600,000$ 4.3 Electricity 1 Year 30,000$ 30,000$ 21,000$ 45,000$ 4.4 Treatment Control Building Maintenance 1 Year 20,000$ 20,000$ 14,000$ 30,000$ 4.5 Injection Well Maintenance 40 EA 500$ 20,000$ 14,000$ 30,000$ 5.0 Monitoring Subtotal 1,270,000$ 889,000$ 1,905,000$ 5.1 Performance Monitoring Yrs 1-5 180 Samples/Year 6,000$ 1,080,000$ 756,000$ 1,620,000$ 5.2 Annual Groundwater Report 1 Year 20,000$ 20,000$ 14,000$ 30,000$ 5.3 Project Management, O&M Phase 1 Year 170,000$ 170,000$ 119,000$ 255,000$
2,700,000$ 1,400,000$ 6,300,000$ 11,100,000$ 5,800,000$ 25,900,000$
O&M Costs (Annual Years 6-10)6.0 System Operation Subtotal 170,000$ 120,000$ 260,000$ 6.1 Operations and Management Yrs 6-10 1 Year 100,000$ 100,000$ 70,000$ 150,000$ 6.2 Electricity 1 Year 30,000$ 30,000$ 21,000$ 45,000$ 6.3 Treatment Control Building Maintenance 1 Year 20,000$ 20,000$ 14,000$ 30,000$ 6.4 Injection Well Maintenance 40 EA 500$ 20,000$ 14,000$ 30,000$ 7.0 Monitoring Subtotal 1,270,000$ 889,000$ 1,905,000$ 7.1 Performance Monitoring Yrs 6-10 180 Samples/Year 6,000$ 1,080,000$ 756,000$ 1,620,000$ 7.2 Annual Groundwater Report 1 Year 20,000$ 20,000$ 14,000$ 30,000$ 7.3 Project Management, O&M Phase 1 Year 170,000$ 170,000$ 119,000$ 255,000$
1,440,000$ 1,010,000$ 2,170,000$ 4,300,000$ 3,000,000$ 6,400,000$
O&M Costs (Annual Years 11-30)8.0 Monitoring Subtotal 260,000$ 182,000$ 390,000$ 8.1 Performance Monitoring Yrs 11-30 35 Samples/Year 6,000$ 210,000$ 147,000$ 315,000$ 8.2 Annual Groundwater Report 1 Year 20,000$ 20,000$ 14,000$ 30,000$ 8.3 Project Management, O&M Phase 1 Year 30,000$ 30,000$ 21,000$ 45,000$
260,000$ 182,000$ 390,000$ 1,410,000$ 990,000$ 2,110,000$
Contingency9.0 Contingency on Total Cost, 25% Subtotal 8,352,500$ 3,772,500$ 19,902,500$
$41,800,000
1.11.21.3
2.1
2.2
2.3
2.43.13.2
3.3
3.4
3.5
3.6
3.7
4.1
4.24.34.44.5
5.1
5.25.36.16.26.36.47.17.27.3
8.1
8.28.39.0
Project management is assumed to be 15 percent of O&M costs.Operations and management for years 6-10 is assumed to be 25 percent of operations and management costs for years 1-5.
Assumes installation of 2-inch stainless steel well screen with carbon steel riser.
Assumes full-time operations engineer onsite for 8 hours a day for 365 days a year and technical support for treatment evaluation and system modifications.Assumes utility expense to operate the equipment and heat the treatment control buildings.Capital maintenance includes expenses for maintaining and replacing equipment.Assumes well redevelopment by a licensed well driller using surging/pumping and biofouling treatment techniques.Costs include labor, expenses, and laboratory costs for quarterly sampling at 45 groundwater monitoring wells. Analysis inlcudes 25 parameters for monitoring anaerobic bioremediation processes and secondary water quality.
Assumes construction of 3,500-square foot climate controlled building for each treatment control building.Assumes purchase and installation of equipment to collect, amend, and reinject groundwater. Equipment includes 58,000 gallons tankage, redundant injection pumps, mixing vessel, amendment metering and transfer pumps, electrical, instrumentation and controls, safety equipment, valves, piping, and appurtenances.Costs include oversight, troubleshooting, and system modification associated with system startup.Costs include amendment delivery to injection wells utilizing the treatment control building. Assumes emulsified vegetable oil based on in-situ longevity and delivery method. Given the uncertainty surrounding the quantity of amendments, a sensitivity analysis was completed using the Substrate Estimating Tool for Enhanced Anaerobic Bioremediation of Chlorinated Solvents, Version 1.2, November 2010, Parsons. The estimate cost assumes the average quantity developed during the sensitivity analysis. Costs were estimated using the range of amendment quantity developed during the sensitivity analysis.It is assumed that supplemental amendment will be necessary to maintain conditions suitable for bioremediation. Supplemental amendments are assumed to be completed at the injection wells installed during initial construction. Supplemental amendment and delivery costs are assumed to be 10 percent of initial amendment and delivery costs per year. There is significant uncertainty regarding the quantity of amendments needed.
Annual O&M Cost Yrs 10-30O&M Yrs 10-30 NPV
Alternative 5 - Enhance Bioremediation via Recirculation System
Total Cost (NPV, 30 years, 7% discount rate)
Assumes preparation of an annual groundwater monitoring report that summarizes groundwater quality trends and natural degradation rates.
O&M Costs (Annual Years 1-5)
Annual O&M Cost Yrs 1-5
Annual O&M Cost Yrs 5-10O&M Yrs 5-10 NPV
O&M Yrs 1-5 NPV
$18,900,000 $99,600,000Assumptions
Project management is assumed to be 15 percent of capital cost (excluding amendment expense).Engineering and design is assumed to be 15 percent of capital cost (excluding amendment expense).Construction quality assurance, monitoring, and reporting is assumed to be 10 percent of capital cost (excluding amendment expense).Access includes costs associated with coordinating access to property for installation or construction of infrastructure. This cost is assumed to include purchasing four properties, demolishing existing structures, and negotiating access to public and railroad rights-of-way. Permitting includes costs associated with applying for and securing permits for the work as required by local, State, and Federal regulations. Assumes labor and analytical expense to conduct laboratory bench testing, extraction well pumping test, and injection pilot testing. Bench testing assumes column testing using site groundwater and a variety of amendments. Pump testing includes completion of a pumping test at an extraction well with multiple observation monitoring wells to better develop the radius of influence of extraction and reinjection wells. Pilot testing includes injection of amendments and monitoring at multiple wells. It is assumed that methane mitigation measures will not be necessary during pilot testing.
Assumes installation of 2-inch stainless steel well screen with carbon steel riser, pitless adaptors, and traffic rated vaults.Assumes installation of 4-inch stainless steel well screen with carbon steel riser, pitless adapters, and traffic rated vaults.Assumes construction of 5,100 feet conveyance piping between the operations building and the extraction and injection wells. Costs include installing 4-inch HDPE pipe at a depth of 8 feet. Assumes trenching will occur in unpaved right-of-way space with the exception of pavement replacement at street crossings where existing pavements and curbs will be demolished and replaced at eight cross-streets.
Assumes utility expense to operate the equipment and heat the treatment control buildings.Capital maintenance includes expenses for maintaining and replacing equipment.Assumes well redevelopment by a licensed well driller using surging/pumping and biofouling treatment techniques.Costs include quarterly sampling at 45 groundwater monitoring wells. Analysis inlcudes 25 parameters for monitoring anaerobic bioremediation processes and secondary water quality.Assumes preparation of an annual groundwater monitoring report that summarizes groundwater quality trends and natural degradation rates.
Discount rate taken from A Guide to Developing and Documenting Cost Estimates During the Feasibility Study (EPA, 2000)
Project management is assumed to be 15 percent of O&M costs.Costs include labor, expenses, and laboratory costs for quarterly sampling at 45 groundwater monitoring wells. Analysis inlcudes 25 parameters for monitoring anaerobic bioremediation processes and secondary water quality.Assumes preparation of an annual groundwater monitoring report that summarizes groundwater quality trends and natural degradation rates.Project management is assumed to be 15 percent of O&M costs.Contingency based on range of scope and bid contingency recommended in A Guide to Developing and Documenting Cost Estimates During the Feasibility Study (EPA, 2000)

Figures

LOCATION MAPEast Hennepin Avenue Site
Minneapolis, Minnesota
FIGURE 1
0 2,000 4,000
Feet
!;NService Layer Credits: Copyright:© 2013 National Geographic Society, i-cubedUSGS 7.5 Minute Quadrangle - Hennepin County
Note: Pink shaded areas in USGS map indicate residential areas.
2010 East Hennepin Ave

SOUTHWEST
NORTHEAST
CENTRAL
SITE§̈¦35W
456788
456730456752456727
456766
22nd
Ave S
E
Como Ave SE
Johnson St NE
30th
AveS
E
10th
AveS
E
18th
AveS
E
6th St SE
Como Ave
Winter St NE
Kennedy St NE
Traffic St NE
11th Av
e SE
Weeks Ave SE
Summer St NE
14th
Ave S
E
15th
AveS
E
7th St SE
Elm St SE
Cole Ave SE
Brook Ave SE
24th
AveS
E
Broadway St NE
Spring St NE
33rd
AveS
E
29th
AveS
E
Arth
urSt
NE
17th
AveS
E
16th
AveS
E
19th
A ve S
E
Garfi
eldSt
N E13
thAv
eSE
Delan
oStN
E
23rd
AveS
E
20th
AveS
E
21st
AveS
E
12th
AveS
E
Mckin
leySt
NE
Clev
el and
StNE
2 7th
AveS
E
25th
AveS
E
Taft
StNE
2 6th
AveS
E
Kasota Ave SE
Diagonal Rdwy
8th St SE
Wilso
nStN
E
Hard
ingSt
NE
Roos
evelt
StNE
Talmage Ave SE
Hoov
erSt
NE
Indus
trial
B lvd
G odw
ardS
tNE
E Hennepin Ave
STUDY AREAEast Hennepin Avenue Site
Minneapolis, Minnesota
FIGURE 2
0 600 1,200
Feet
!;N
Maximum sub-slab soil gas TCE concentrationat each building shown.
Imagery: USGS NAIP (2015)
2010 East Hennepin AveOff-Site Property withDocumented TCE in GroundwaterBased on Review of MPCA FilesOff-Site Property with PotentialSolvent Use, ApproximateLocation of Current and/orHistoric BusinessCentral Area
Sub-slab Soil Gas TCE Concentrations< 20 ug/m3
20 - 60 ug/m3
60 - 100 ug/m3
100 - 500 ug/m3
500 - 2000 ug/m3
> 2000 ug/m3
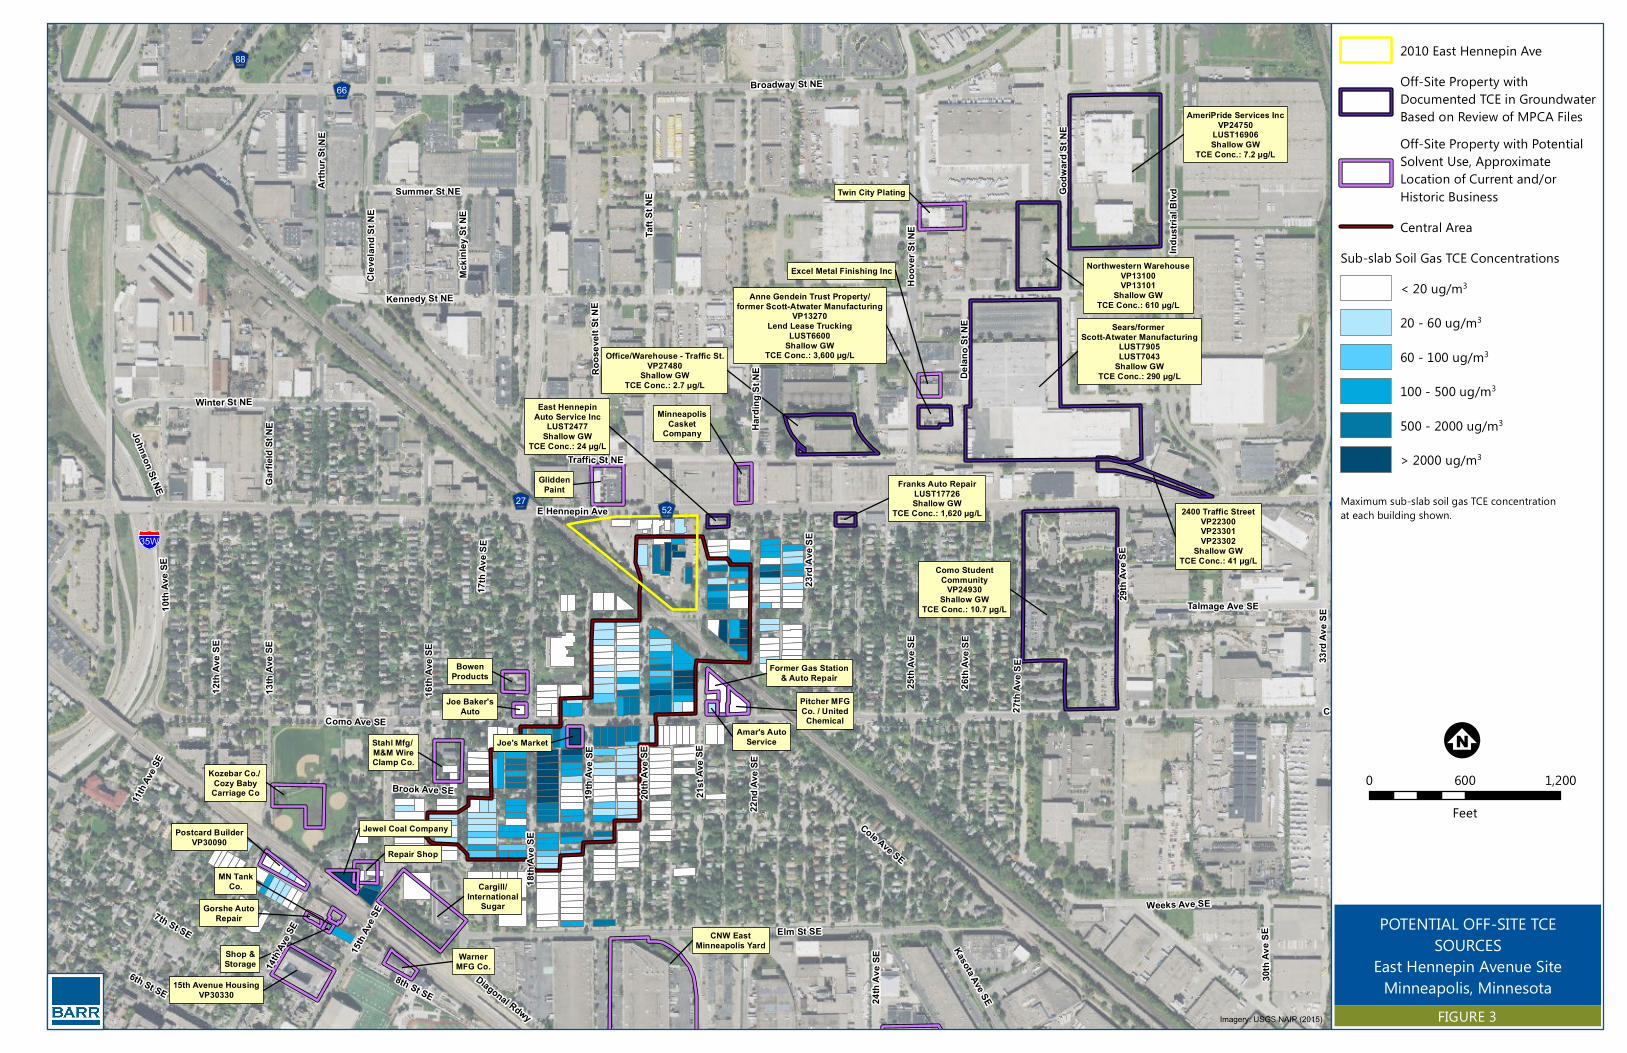
Kozebar Co./ Cozy Baby
Carriage Co
Repair Shop
Cargill/International
Sugar
Stahl Mfg/ M&M WireClamp Co.
BowenProducts
GliddenPaint
MinneapolisCasket
Company
Amar's AutoService
Jewel Coal Company
Anne Gendein Trust Property/former Scott-Atwater Manufacturing
VP13270Lend Lease Trucking
LUST6600Shallow GW
TCE Conc.: 3,600 µg/L
2400 Traffic StreetVP22300VP23301VP23302
Shallow GWTCE Conc.: 41 µg/L
AmeriPride Services IncVP24750
LUST16906Shallow GW
TCE Conc.: 7.2 µg/L
Office/Warehouse - Traffic St.VP27480
Shallow GWTCE Conc.: 2.7 µg/L
Northwestern WarehouseVP13100VP13101
Shallow GWTCE Conc.: 610 µg/L
Como StudentCommunity
VP24930Shallow GW
TCE Conc.: 10.7 µg/L
Joe's Market
CNW EastMinneapolis Yard
Sears/former Scott-Atwater Manufacturing
LUST7905LUST7043
Shallow GWTCE Conc.: 290 µg/L
Franks Auto RepairLUST17726Shallow GW
TCE Conc.: 1,620 µg/L
East HennepinAuto Service Inc
LUST2477Shallow GW
TCE Conc.: 24 µg/L
Excel Metal Finishing Inc
Twin City Plating
Former Gas Station& Auto Repair
Pitcher MFGCo. / United
Chemical
WarnerMFG Co.
Gorshe AutoRepair
Shop &Storage
MN TankCo.
Postcard BuilderVP30090
15th Avenue HousingVP30330
Joe Baker'sAuto
§̈¦35W
456788
456730456752456727
456766
22n d
AveS
E
Como Ave SE
Johnson St NE
30th
AveS
E
10th
AveS
E
18th
AveS
E
6th St SE
Como Ave
Winter St NE
Traffic St NE
11th Av
e SE
Weeks Ave SE
Summer St NE
Kennedy St NE
14th
Ave S
E
7th St SE Elm St SE
Cole Ave SE
Brook Ave SE
24th
AveS
E
Broadway St NE
15th
Ave S
E
17th
Ave S
E
33rd
AveS
E
29th
AveS
E
Arth
urSt
NE
23rd
Ave S
E
16th
AveS
E
19th
A ve S
E
Garfi
eldSt
N E13
thAv
eSE
Delan
oStN
E
20th
AveS
E
21st
AveS
E
12th
AveS
E
Mckin
leySt
NE
Clev
el and
StNE
2 7th
AveS
E
25th
AveS
E
Taft
StNE
2 6th
AveS
E
Kasota Ave SE
Diagonal Rdwy
8th St SE
Hard
ingSt
NERoos
evelt
StNE
Talmage Ave SE
Hoov
erSt
NE
Indus
trial
BlvdG o
dwar
dStN
E
E Hennepin Ave
POTENTIAL OFF-SITE TCESOURCES
East Hennepin Avenue SiteMinneapolis, Minnesota
FIGURE 3
0 600 1,200
Feet
!;N
Maximum sub-slab soil gas TCE concentrationat each building shown.
Imagery: USGS NAIP (2015)
2010 East Hennepin AveOff-Site Property withDocumented TCE in GroundwaterBased on Review of MPCA FilesOff-Site Property with PotentialSolvent Use, ApproximateLocation of Current and/orHistoric BusinessCentral Area
Sub-slab Soil Gas TCE Concentrations< 20 ug/m3
20 - 60 ug/m3
60 - 100 ug/m3
100 - 500 ug/m3
500 - 2000 ug/m3
> 2000 ug/m3

!(
!(
!(")
")
!(
!(
!(
!(
!(
!(
!(
!(!(")
")
!(
!(
!(
!(
")
")
S P-0321.4 ug/l (18-23')2.7 ug/l (50-54')
S P-0144.5 ug/l (15-20')13.6 ug/l (49-53')
S P-06742 ug/l (18-23')1080 ug/l (29-33')
S P-1779.1 ug/l (15-20')274 ug/l (38-42')
S P-16198 ug/l (15-20')316 ug/l (37-41')
S P-18253 ug/l (15-20')285 ug/l (36-40')
S P-05295 ug/l (12.5-17.5')685 ug/l (34-38')
S P-041.2 ug/l (15-20')75.4 ug/l (35-40')1260 ug/l (44-48')
S P-02<1.0 ug/l (15-20')1100 ug/l (35.5-39.5')
S P-077.1 ug/l (20-25')828 ug/l (39-43')
S P-08<1.0 ug/l (20-25')473 ug/l (35-40')584 ug/l (43-47')
S P-09<1.0 ug/l (20-25')1300 ug/l (41-45')
S P-12285 ug/l (25-30')
1810 ug/l (42.5-46.5')
S P-1335.8 ug/l (30-35')90.5 ug/l (45-50')
S P-14116 ug/l (37-41')78.9 ug/l (66-70')
S P-15132 ug/l (40-45')40.3 ug/l (53-57')
VP-05115 ug/m 3
VP-040.71 ug/m 3
VP-0244500 ug/m 3
VP-0318.8 ug/m 3
VP-01< 0.74 ug/m 3
VP-0662.7 ug/m 3
Com o Ave S E
S um m er S t NE
Johnson StNE
7th S t S E
EHennep in Ave
Weeks Ave S E
10t hAveSE
14th Ave S E
Winter S t NE
S E Elm S t
11th Ave S E
6th S t S E
8th S t S E
T a lm a d ge Ave S E
Hoover St NE
15th Ave SE
Hard ing S t NE
Fa irm ount Ave S E
K enned y S t NE
Tra ffic S tNE
Rollins Ave S E
Elm S t S E
Cole Ave S E
Brook Ave S E
18th Ave SE
25th Ave SE
26th Ave SE
29thAveSE
24thAveSE
27thAveSE
12th Ave SE
20th Ave SE
23rd Ave SE
13th Ave SE
19thAve SE
17th Ave SE 22nd Ave SE
21stA veSE
Garfield S t NE
Dela no St NE
Mckinley St NE
Clevela nd St NE
Stinson Blvd
Wilson St NE
Roosevelt St NE
Stin so nBl vd NE
Taft St NE
Dia gona l Rdwy
Industrial Blvd
16th Ave SE
Arthur St NE
K a sota Ave S E
456752
456727
§̈¦35W
MPCA S A249 GROU NDWATERAND S OIL GAS S AMPLING -
TCE RES U LT SEa st Hennep in Avenue S iteMinnea p olis, Minnesota
FIGU RE 4
0 500 1,000
Feet
!;N
Note: MPCA S A249 investiga tion d a ta fromNovem b er a nd Dec em b er 2015. S oil ga ssa m p ling d ep th of 8 ft b gs.
S a m p le IDTCE in Groundwa ter (Tem p Well S c reen
Dep th)
S a m p le IDTCE in S oil Ga s
Imagery: USGS NAIP (2015)
2010 East Hennepin AveMPCA Investiga tion Loc a tion
!( S oil Prob e Loc a tion
") S oil-Ga s S a m p le Loc a tion
Centra l AreaOff-S ite Prop erty withDoc um ented TCE in Groundwa terBa sed on Review of MPCA FilesOff-S ite Prop erty with Potentia lS olvent U se, Ap p roxim a teLoc a tion of Current a nd/orHistoric BusinessProp erty Inc lud ed in MPCA’sS A249 S tud y a s of Ma y 28, 2015

! ! !
! ! !
! ! !
! ! !
! ! !
! ! !
! ! ! ! ! !
! ! ! ! ! !
! ! ! ! ! !
! ! ! ! ! !
! ! ! ! ! !
! ! ! ! ! !
! ! ! ! ! !
! ! ! ! ! !
! ! ! ! ! !
! ! ! ! ! !
! ! ! ! ! !! ! ! ! ! !
! ! ! ! ! !
! ! ! ! ! !
! ! ! ! !
! ! ! ! !
! ! ! ! !
! ! ! !
! ! ! !
! ! ! !
! ! ! !
! ! ! !
! ! ! !
! ! ! !
! ! ! !
! ! ! !
! ! ! !
! ! ! !
! ! ! !
! ! ! !
! ! ! ! ! ! ! !
! ! ! ! ! ! ! !
! ! ! ! ! ! ! !
! ! ! ! ! ! ! !
! ! ! ! ! ! ! ! ! !
! ! ! ! ! ! ! ! ! !
! ! ! ! ! ! ! ! ! !
! ! ! ! ! ! ! ! ! !
SOUTHWEST
NORTHEAST
CENTRAL
SITE456752
456752
456727
22nd
AveS
E
Como Ave SE
Cole Ave SE
Garfi
eldSt
NE
Hard
ingSt
NE
Taft
StNE
18th
AveS
E
Talmage Ave SE
Fairmount Ave SE
14th
Ave S
E
15th
AveS
E
Rollins Ave SE
17th Av eS E
7th St SE
8th St SE
Brook Ave SE
16th
AveS
E
19t h
Ave S
E
13th
AveS
E
23rd
AveS
E
20th
AveS
E
21st
AveS
E
12th
AveS
EE Hennepin Ave
Elm St SE BUILDING MITIGATIONSTATUS - APRIL 2016
East Hennepin Avenue SiteMinneapolis, Minnesota
FIGURE 5
0 300 600
Feet
!;N
2010 E Hennepin Ave
Central AreaBuilding Mitigation SystemInstalledBuilding Mitigation SystemNot Installed in Central Area
Central Area DetailMitigation Declined by PropertyOwner - Sub-Slab Soil Gas TCE<20 ug/m3
Mitigation Declined by PropertyOwner - Sub-Slab Soil Gas TCE>20 ug/m3
! ! ! ! ! ! ! ! !
! ! ! ! ! ! ! ! !
! ! ! ! ! ! ! ! !
! ! ! ! ! ! ! ! !
! ! ! ! ! ! ! ! !
Indoor Air TCE < ApplicableMPCA Intrusion ScreeningValue (ISV)Did Not Participate in Sub-SlabSoil Gas Sampling StudyProperty with Post-MitigationIndoor Air SamplingResidential Properties withoutMitigation Systems
Imagery: USGS NAIP (2015)

*
*
*
**
!A
!A
!A
!A!A
!A
!A
!A
!A
!A
!A
!A
!A
!A
!A
!A
!A
!A
!A
!A
!A
!A
!A!A
!A!A
!A!A
!A!A
!A!A
!A!A
!A!A
!A!A
!A
!A!A
!A
!A!A
!A!A
456752
Weeks Ave SE
22nd
AveS
E
Como Ave SE
Winter St NE
7th St SE
Talmage Ave SE
24th
AveS
E
Fairmount Ave SE
8th St SE
15th
AveS
EKasota Ave SE
Cole Ave SE
17th
AveS
E
16th
AveS
E
1 9th
AveS
E
Garfi
eldSt
NE13
thAv
eSE
23rd
AveS
E
14th
AveS
E
20th
AveS
E
2 7th
A veS
E
25th
AveS
E
2 6th
AveS
E
Wils
onSt
NE
Taft
StNE
Traffic St NE
Elm St SE
E Hennepin Ave
21st
AveS
E
311GS
312GS
313GD
315GS
301GS
314GS
2
109
110
111
112 113
B
V
W
SMW1
311GD
SMW25
309GS
312GD
313GS
318GS
SMW3
SMW6
306GD306GS
315GD
301GD
SMW10
SMW19
SMW22
314GD
SMW16
308GS
305GD
Q
ST
X
308GD
307GD307GS
310GS
309GD
317GS
316GD
303GS
316GS
302GS
305GS
304GS
GLACIAL DRIFT GROUNDWATERMONITORING NETWORK
East Hennepin Avenue SiteMinneapolis, Minnesota
FIGURE 6
0 400 800
Feet
2010 East Hennepin Ave
Central AreaMonitoring Well Locations
!A Glacial Drift Monitoring Well
!AGlacial Drift NestedMonitoring Well
* Glacial Drift Pump-Out Well
!;N
Imagery: USGS NAIP (2015)
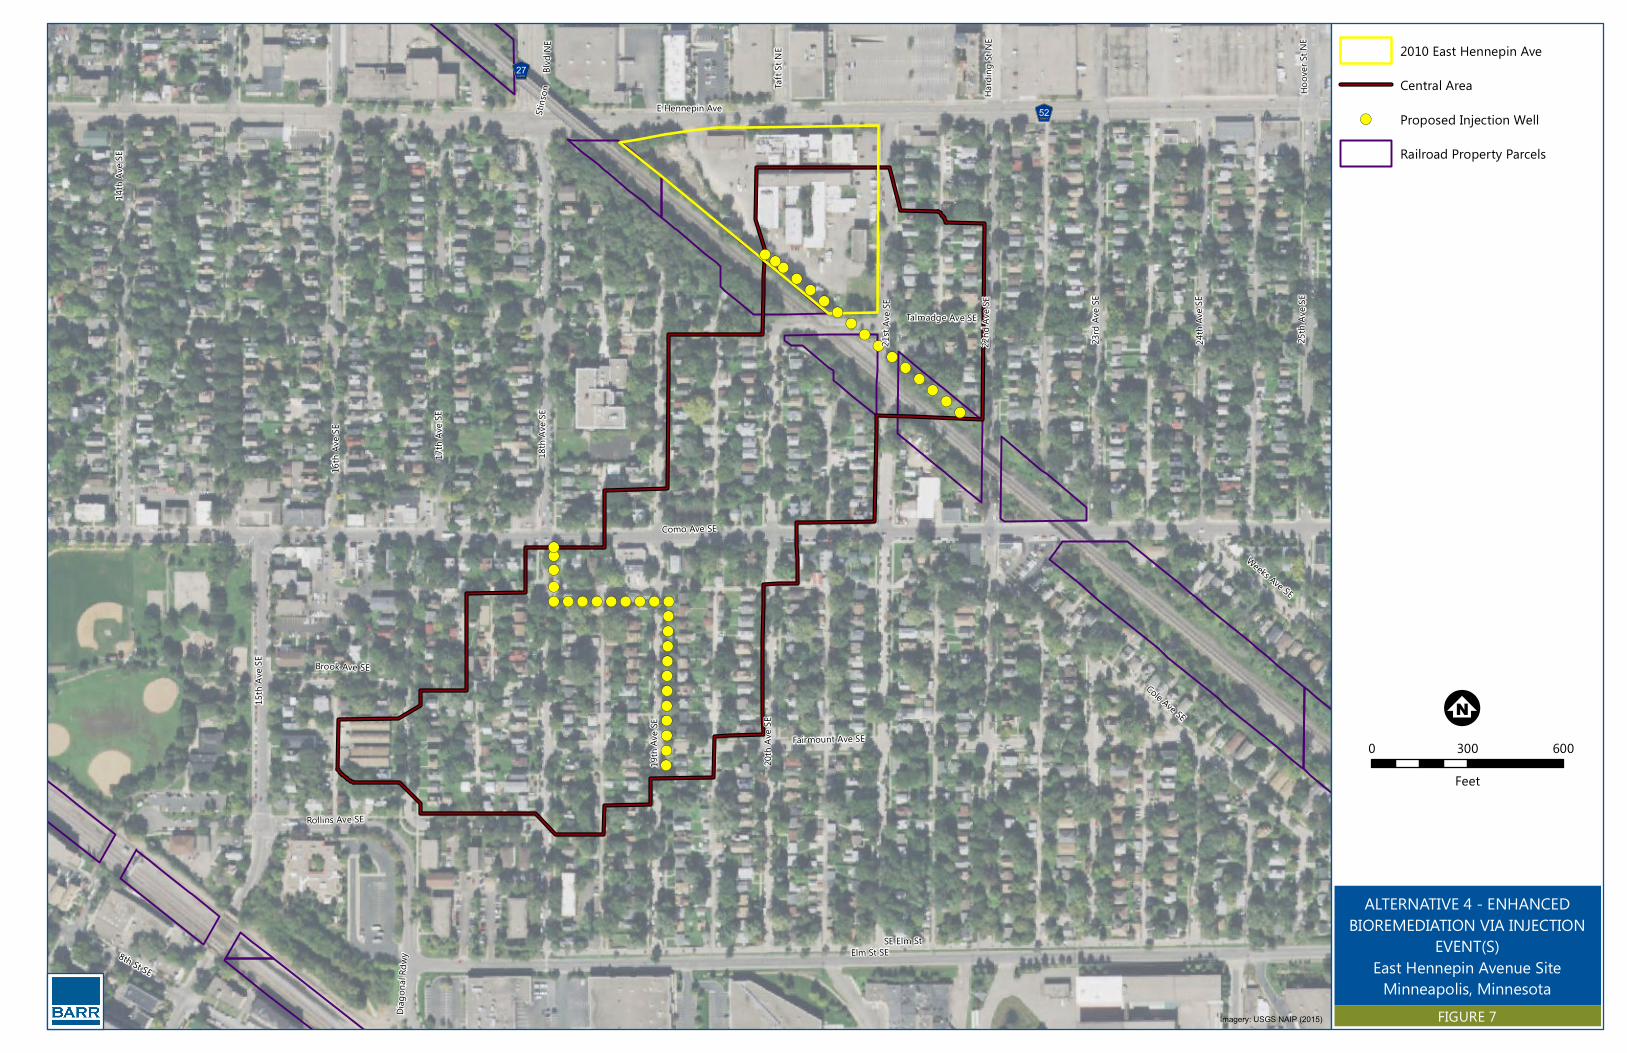
!(
!(
!(
!(
!(
!(
!(
!(
!(
!(!(!(!(
!(
!(
!(
!(
!(
!(
!(
!(
!(
!(
!(
!(
!(
!(
!(
!(
!(!(!(!(!(
!(
!(
!(
!(
!(!(
Como Ave SE
E Hennepin Ave
Talmadge Ave SE
Weeks Ave SE
15th
Ave S
E
8th St SE
Cole Ave SE
SE Elm St
Hoov
er St
NE
Hardi
ng St
NE
Taft
St NE
Elm St SE
Fairmount Ave SE
Rollins Ave SE
Brook Ave SE
18th
Ave S
E
25th
Ave S
E
24th
AveS
E
20th
Ave S
E
23rd
Ave S
E
19th
AveS
E
17th
Ave S
E
22nd
Ave S
E
2 1s t
AveS
E
Diago
nal R
dwy
Stins
onBl v
d NE
16th
Ave S
E
14th
Ave S
E
456727
456752
ALTERNATIVE 4 - ENHANCEDBIOREMEDIATION VIA INJECTION
EVENT(S)East Hennepin Avenue Site
Minneapolis, MinnesotaFIGURE 7
0 300 600
Feet
2010 East Hennepin Ave
Central Area
!( Proposed Injection Well
Railroad Property Parcels
!;N
Imagery: USGS NAIP (2015)

!?
!(
!(
!?
!?!?
!(
!(
!(
!(
!(
!(
!(
!(
!(
!(!(!(!(
!(
!(
!(
!(
!(
!(
!(
!(
!(
!(
!(
!(
!(
!(
!(
!(
!(!(!(!(!(
!(
!(
!(
!(
!(!(
Como Ave SE
E Hennepin Ave
Talmadge Ave SE
Weeks Ave SE
15th
Ave S
E
8th St SE
Cole Ave SE
SE Elm St
Hoov
er St
NE
Hardi
ng St
NE
Taft
St NE
Elm St SE
Fairmount Ave SE
Rollins Ave SE
Brook Ave SE
18th
Ave S
E
25th
Ave S
E
24th
AveS
E
20th
Ave S
E
23rd
Ave S
E
19th
AveS
E
17th
Ave S
E
22nd
Ave S
E
2 1s t
AveS
E
Diago
nal R
dwy
Stins
onBl v
d NE
16th
Ave S
E
14th
Ave S
E
456727
456752
ALTERNATIVE 5 - ENHANCEDBIOREMEDIATION VIA
RECIRCULATIONEast Hennepin Avenue Site
Minneapolis, MinnesotaFIGURE 8
0 300 600
Feet
2010 East Hennepin Ave
Central Area
!?Proposed Extraction Well(Existing Location)
!( Proposed Extraction Well
!( Proposed Injection Well
ForcemainTreatment System ControlBuilding (Typical / LocationNot Specified)Railroad Property Parcels
!;N
Imagery: USGS NAIP (2015)

Appendix A
Supporting Cost Details
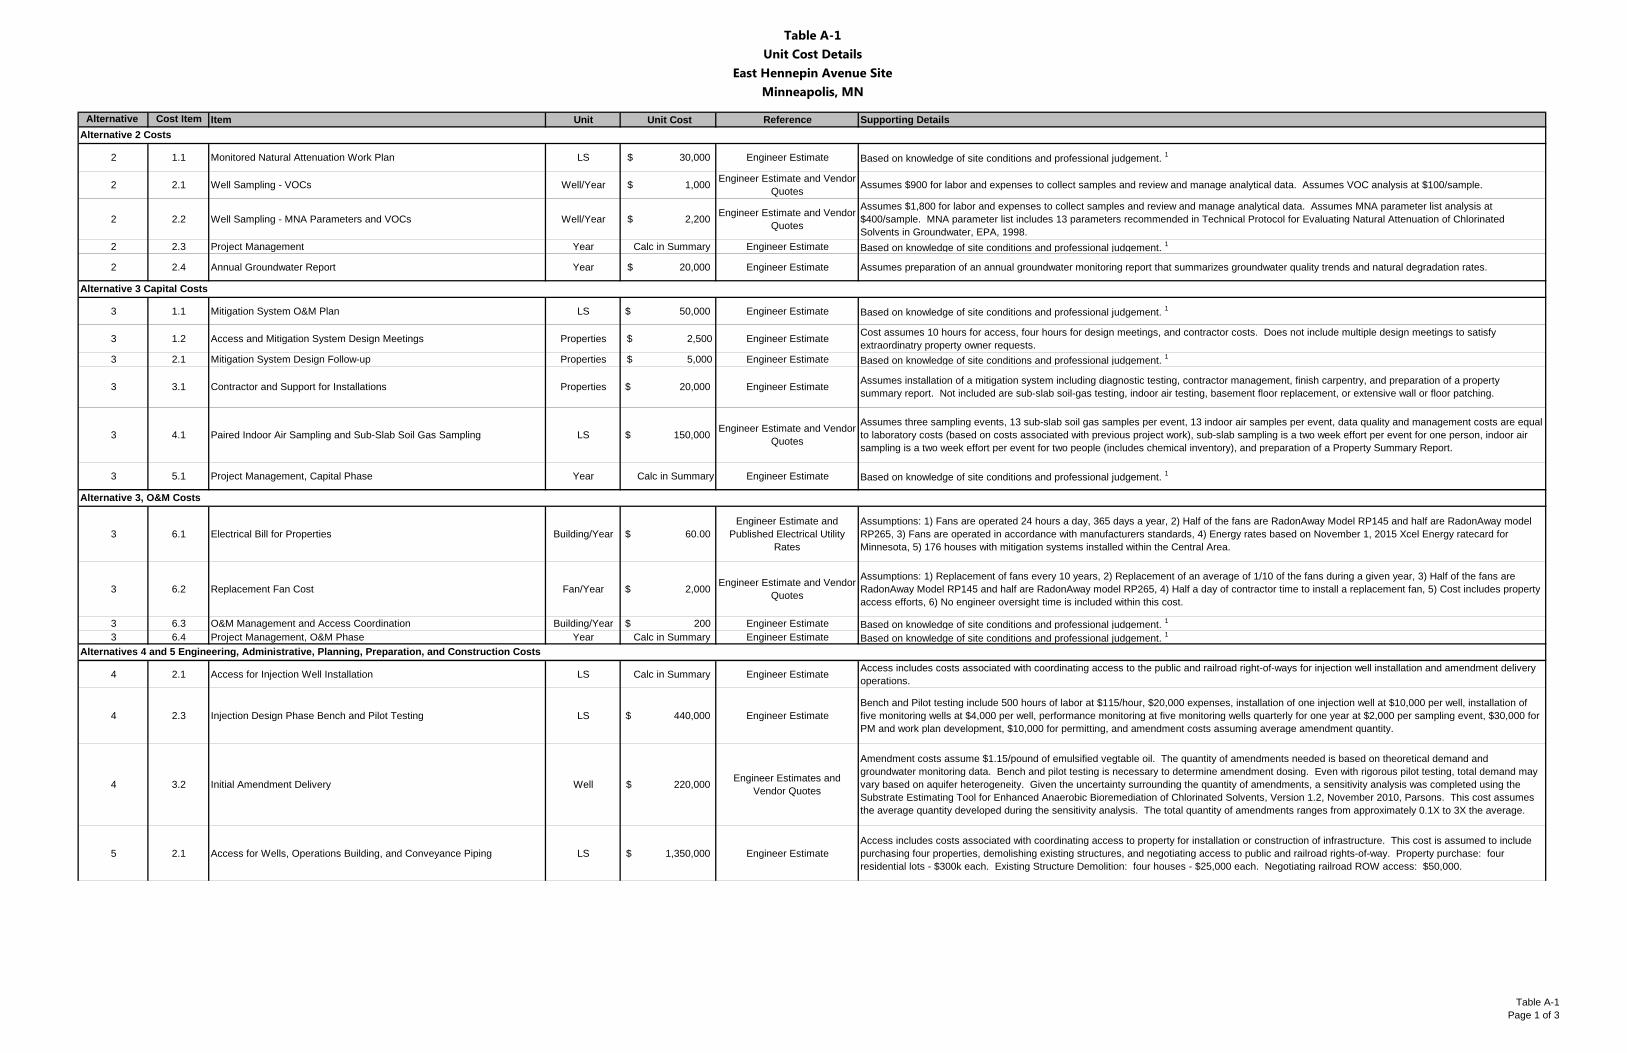
Table A-1Unit Cost Details
East Hennepin Avenue SiteMinneapolis, MN
Table A-1Page 1 of 3
Alternative Cost Item Item Unit Unit Cost Reference Supporting Details
2 1.1 Monitored Natural Attenuation Work Plan LS 30,000$ Engineer Estimate Based on knowledge of site conditions and professional judgement. 1
2 2.1 Well Sampling - VOCs Well/Year 1,000$ Engineer Estimate and Vendor Quotes Assumes $900 for labor and expenses to collect samples and review and manage analytical data. Assumes VOC analysis at $100/sample.
2 2.2 Well Sampling - MNA Parameters and VOCs Well/Year 2,200$ Engineer Estimate and Vendor Quotes
Assumes $1,800 for labor and expenses to collect samples and review and manage analytical data. Assumes MNA parameter list analysis at $400/sample. MNA parameter list includes 13 parameters recommended in Technical Protocol for Evaluating Natural Attenuation of Chlorinated Solvents in Groundwater, EPA, 1998.
2 2.3 Project Management Year Calc in Summary Engineer Estimate Based on knowledge of site conditions and professional judgement. 1
2 2.4 Annual Groundwater Report Year 20,000$ Engineer Estimate Assumes preparation of an annual groundwater monitoring report that summarizes groundwater quality trends and natural degradation rates.
3 1.1 Mitigation System O&M Plan LS $ 50,000 Engineer Estimate Based on knowledge of site conditions and professional judgement. 1
3 1.2 Access and Mitigation System Design Meetings Properties $ 2,500 Engineer Estimate Cost assumes 10 hours for access, four hours for design meetings, and contractor costs. Does not include multiple design meetings to satisfy extraordinatry property owner requests.
3 2.1 Mitigation System Design Follow-up Properties $ 5,000 Engineer Estimate Based on knowledge of site conditions and professional judgement. 1
3 3.1 Contractor and Support for Installations Properties $ 20,000 Engineer Estimate Assumes installation of a mitigation system including diagnostic testing, contractor management, finish carpentry, and preparation of a property summary report. Not included are sub-slab soil-gas testing, indoor air testing, basement floor replacement, or extensive wall or floor patching.
3 4.1 Paired Indoor Air Sampling and Sub-Slab Soil Gas Sampling LS $ 150,000 Engineer Estimate and Vendor Quotes
Assumes three sampling events, 13 sub-slab soil gas samples per event, 13 indoor air samples per event, data quality and management costs are equal to laboratory costs (based on costs associated with previous project work), sub-slab sampling is a two week effort per event for one person, indoor air sampling is a two week effort per event for two people (includes chemical inventory), and preparation of a Property Summary Report.
3 5.1 Project Management, Capital Phase Year Calc in Summary Engineer Estimate Based on knowledge of site conditions and professional judgement. 1
3 6.1 Electrical Bill for Properties Building/Year $ 60.00 Engineer Estimate and
Published Electrical Utility Rates
Assumptions: 1) Fans are operated 24 hours a day, 365 days a year, 2) Half of the fans are RadonAway Model RP145 and half are RadonAway model RP265, 3) Fans are operated in accordance with manufacturers standards, 4) Energy rates based on November 1, 2015 Xcel Energy ratecard for Minnesota, 5) 176 houses with mitigation systems installed within the Central Area.
3 6.2 Replacement Fan Cost Fan/Year $ 2,000 Engineer Estimate and Vendor Quotes
Assumptions: 1) Replacement of fans every 10 years, 2) Replacement of an average of 1/10 of the fans during a given year, 3) Half of the fans are RadonAway Model RP145 and half are RadonAway model RP265, 4) Half a day of contractor time to install a replacement fan, 5) Cost includes property access efforts, 6) No engineer oversight time is included within this cost.
3 6.3 O&M Management and Access Coordination Building/Year $ 200 Engineer Estimate Based on knowledge of site conditions and professional judgement. 1
3 6.4 Project Management, O&M Phase Year Calc in Summary Engineer Estimate Based on knowledge of site conditions and professional judgement. 1
4 2.1 Access for Injection Well Installation LS Calc in Summary Engineer Estimate Access includes costs associated with coordinating access to the public and railroad right-of-ways for injection well installation and amendment delivery operations.
4 2.3 Injection Design Phase Bench and Pilot Testing LS 440,000$ Engineer EstimateBench and Pilot testing include 500 hours of labor at $115/hour, $20,000 expenses, installation of one injection well at $10,000 per well, installation of five monitoring wells at $4,000 per well, performance monitoring at five monitoring wells quarterly for one year at $2,000 per sampling event, $30,000 for PM and work plan development, $10,000 for permitting, and amendment costs assuming average amendment quantity.
4 3.2 Initial Amendment Delivery Well 220,000$ Engineer Estimates and Vendor Quotes
Amendment costs assume $1.15/pound of emulsified vegtable oil. The quantity of amendments needed is based on theoretical demand and groundwater monitoring data. Bench and pilot testing is necessary to determine amendment dosing. Even with rigorous pilot testing, total demand may vary based on aquifer heterogeneity. Given the uncertainty surrounding the quantity of amendments, a sensitivity analysis was completed using the Substrate Estimating Tool for Enhanced Anaerobic Bioremediation of Chlorinated Solvents, Version 1.2, November 2010, Parsons. This cost assumes the average quantity developed during the sensitivity analysis. The total quantity of amendments ranges from approximately 0.1X to 3X the average.
5 2.1 Access for Wells, Operations Building, and Conveyance Piping LS 1,350,000$ Engineer EstimateAccess includes costs associated with coordinating access to property for installation or construction of infrastructure. This cost is assumed to include purchasing four properties, demolishing existing structures, and negotiating access to public and railroad rights-of-way. Property purchase: four residential lots - $300k each. Existing Structure Demolition: four houses - $25,000 each. Negotiating railroad ROW access: $50,000.
Alternative 2 Costs
Alternative 3 Capital Costs
Alternative 3, O&M Costs
Alternatives 4 and 5 Engineering, Administrative, Planning, Preparation, and Construction Costs

Table A-1Unit Cost Details
East Hennepin Avenue SiteMinneapolis, MN
Table A-1Page 2 of 3
Alternative Cost Item Item Unit Unit Cost Reference Supporting Details
5 2.3 Recirculation Design Phase Bench and Pilot Testing LS 670,000$ Engineer EstimateBench and Pilot testing include 750 hours of labor at $115/hour, $30,000 pumping test, $20,000 expenses, installation of one injection well at $10,000 per well, installation of five monitoring wells at $4,000 per well, performance monitoring at five monitoring wells quarterly for one year at $2,000 per sampling event, $30,000 for PM and work plan development, $10,000 for permitting, and amendment costs assuming average amendment quantity.
5 3.2 Extraction Wells EA 15,000$ Bid from Contractor with Additional Items and Scaling Assumes installation of 4-inch stainless steel well screen with carbon steel riser, pitless adapters, and traffic rated vaults.
5 3.3 Conveyance Piping LF 65$ Engineer Estimates and RS Means Unit Rates
Assumes construction of 5,100 feet conveyance piping between the operations building and the extraction and injection wells. Costs include installing 4-inch HDPE pipe at a depth of 8 feet. Assumes trenching will occur in unpaved right-of-way space with the exception of pavement replacement at street crossings where existing pavements and curbs will be demolished and replaced at eight cross-streets.
5 3.4 Operations Building Construction EA 660,000$ Engineer Estimate RS Means Unit Rates See the supporting details in Table A-2
5 3.5 Operations Equipment Procurement and Installation (Tanks, pumps, valves, etc.) LS 820,000$ Engineer Estimate and Vendor
Quotes See the supporting details in Table A-2
5 3.6 System Startup LS 250,000$ Engineer Estimate Based on knowledge of site conditions and professional judgement. 1
5 3.7 Initial Amendment Delivery via Recirculation System LS 8,600,000$ Engineer Estimate and Vendor Quote
Costs include amendment delivery to injection wells utilizing the treatment control building. Amendment costs assume $1.15/pound of emulsified vegtable oil. The quantity of amendments needed is based on theoretical demand and groundwater monitoring data. Bench and pilot testing is necessary to determine amendment dosing. Even with rigorous pilot testing, total demand may vary based on aquifer heterogeneity. Given the uncertainty surrounding the quantity of amendments, a sensitivity analysis was completed using the Substrate Estimating Tool for Enhanced Anaerobic Bioremediation of Chlorinated Solvents, Version 1.2, November 2010, Parsons. The average amendment quantity was estimated as 7,320,000 pounds. Assumes 2,000 liters of KB1 bioaugmentation culture.
5 3.7 Initial Amendment Delivery via Recirculation System - Low LS 1,100,000$ Vendor Quote and Engineer Estimate
Costs include amendment delivery to injection wells utilizing the treatment control building. Amendment costs assume $1.15/pound of emulsified vegtable oil (EVO). The quantity of amendments needed is based on theoretical demand and groundwater monitoring data. Bench and pilot testing is necessary to determine amendment dosing. Even with rigorous pilot testing, total demand may vary based on aquifer heterogeneity. Given the uncertainty surrounding the quantity of amendments, a sensitivity analysis was completed using the Substrate Estimating Tool for Enhanced Anaerobic Bioremediation of Chlorinated Solvents, Version 1.2, November 2010, Parsons. The low range of EVO quantity was estimated at 740,000 pounds. Assumes 2,000 liters of KB1 bioaugmentation culture.
5 3.7 Initial Amendment Delivery via Recirculation System - High LS 23,800,000$ Vendor Quote and Engineer Estimate
Costs include amendment delivery to injection wells utilizing the treatment control building. Amendment costs assume $1.15/pound of emulsified vegtable oil (EVO). The quantity of amendments needed is based on theoretical demand and groundwater monitoring data. Bench and pilot testing is necessary to determine amendment dosing. Even with rigorous pilot testing, total demand may vary based on aquifer heterogeneity. Given the uncertainty surrounding the quantity of amendments, a sensitivity analysis was completed using the Substrate Estimating Tool for Enhanced Anaerobic Bioremediation of Chlorinated Solvents, Version 1.2, November 2010, Parsons. The low range of EVO quantity was estimated as 20,480,000 pounds. Assumes 2,000 liters of KB1 bioaugmentation culture.
4, 5 1.1 Project Management, Capital Phase LS Calc in Summary Engineer Estimate Based on knowledge of site conditions and professional judgement. 1
4, 5 1.2 Engineering and Design LS Calc in Summary Engineer Estimate Based on knowledge of site conditions and professional judgement. 1
4, 5 1.3 Construction Quality Assurance, Monitoring, & Reporting LS Calc in Summary Engineer Estimate Based on knowledge of site conditions and professional judgement. 1
4, 5 2.2 Permitting LS 100,000$ Engineer Estimate Based on knowledge of site conditions and professional judgement. 1
4, 5 2.4 Monitoring Wells Well 4,000$ Bid from Contractor Assumes installation of 2-inch stainless steel well screen with carbon steel riser.
4, 5 3.1 Injection Wells Well 10,000$ Bid from Contractor with Additional Items Assumes installation of 2-inch stainless steel well screen with carbon steel riser, pitless adaptors, and traffic rated vaults.
4 5.1 Performance Monitoring Yrs 1-3 Samples/Year 6,000$ Engineer Estimate and Vendor Quotes
Assumes quarterly sampling at 45 groundwater monitoring wells, $4,500 for labor and expenses to collect samples and review and manage analytical data, parameter list analysis at $1,500 per sample. Analysis inlcudes 25 parameters for monitoring anaerobic bioremediation processes and secondary water quality.
4 6.1 Supplemental Injection Wells Well 9,674$ Bid from Contractor with Additional Items
It is assumed that 20 supplemental injection wells will be required to target areas of insufficient amendment delivery. This is assumed as a one time cost in year 4.
4 6.2 Initial Amendment Delivery at Supplemental Wells Well 219,412$ Engineer Estimate Assumed as the same as initial amendment delivery costs on a per well basis. This is a one time cost in year 4.4 7.1 Supplemental Amendment Delivery at Supplemental Wells Year Calc in Summary Engineer Estimate Costs assumed to be 10 percent of initial amendment delivery costs at the supplemental injection wells per year.
4 7.2 Performance Monitoring Yrs 4-6 Samples/Year $ 6,000 Engineer Estimate and Vendor Quotes
Assumes quarterly sampling at 45 groundwater monitoring wells, $4,500 for labor and expenses to collect samples and review and manage analytical data, parameter list analysis at $1,500/sample. Analysis inlcudes 25 parameters for monitoring anaerobic bioremediation processes and secondary water quality.
4 8.1 Performance Monitoring Yrs 7-30 Samples/Year $ 2,400 Engineer Estimate and Vendor Quotes
Assumes annual sampling at 35 groundwater monitoring wells, $2,000 for labor and expenses to collect samples and review and manage analytical data, parameter list analysis at $400/sample. Analysis inlcudes 12 parameters for monitoring anaerobic bioremediation processes and secondary water quality.
5 4.2 Operations and Management Yrs 1-5 Year 400,000$ Engineer Estimate Assumes full-time operations engineer onsite for 8 hours a day for 365 days a year and technical support for treatment evaluation and system modifications.
Alternatives 4 and 5, O&M Costs

Table A-1Unit Cost Details
East Hennepin Avenue SiteMinneapolis, MN
Table A-1Page 3 of 3
Alternative Cost Item Item Unit Unit Cost Reference Supporting Details 5 4.3, 6.2 Electricity Year 25,000$ Engineer Estimate Assumes utility expense to operate the equipment and heat the treatment control buildings.
5 4.4, 6.3 Treatment Control Building Maintenance Year Calc in Summary Engineer Estimate Capital maintenance includes expenses for maintaining and replacing equipment.
5 5.1 Performance Monitoring Yrs 1-5 Samples/Year 6,000$ Engineer Estimate and Vendor Quotes
Costs include labor, expenses, and laboratory costs for quarterly sampling at 45 groundwater monitoring wells. Analysis inlcudes 25 parameters for monitoring anaerobic bioremediation processes and secondary water quality.
5 6.1 Operations and Management Yrs 6-10 Year Calc in Summary Engineer Estimate Operations and management for years 6-10 is assumed to be 25 percent of operations and management costs for years 1-5.
5 7.1 Performance Monitoring Yrs 6-10 Samples/Year $ 6,000 Engineer Estimate and Vendor Quotes
Costs include labor, expenses, and laboratory costs for annual sampling at 35 groundwater monitoring wells. Analysis inlcudes 12 parameters for monitoring anaerobic bioremediation processes and secondary water quality.
5 8.1 Performance Monitoring Yrs 11-30 Samples/Year $ 6,000 Engineer Estimate and Vendor Quotes
Costs include labor, expenses, and laboratory costs for annual sampling at 35 groundwater monitoring wells. Analysis inlcudes 12 parameters for monitoring anaerobic bioremediation processes and secondary water quality.
4, 5 Multiple Injection Well Maintenance EA 500$ Vendor Quotes Assumes $350/hour for drilling crew and one hour at each well, plus $150 for biofouling treatment.
4, 5 Multiple Annual Groundwater Report Year 20,000$ Engineer Estimate Based on project specific costs for previous annual groundwater monitoring reports.4, 5 Multiple Project Management, O&M Phase Year Calc in Summary Engineer Estimate Based on project specific costs for previous annual groundwater monitoring reports.
4, 5 4.1 Supplemental Amendment Delivery Year Calc in Summary Engineer Estimate Assumed to be 10 percent of initial amendment and delivery costs per year. There is significant uncertainty regarding the quantity of amendments needed.
Notes1 The opinion of probable remedial action cost provided in this table is made on the basis of Barr’s experience and qualifications and represents our best judgment as experienced and qualified professionals familiar with the project.

Appendix B
Sustainability Evaluation Summary
B-1
B. Sustainability Evaluation Summary
Five potential remedial alternatives are evaluated in the vapor intrusion (VI) pathway feasibility study
completed by Barr Engineering Co. (Barr) on behalf of General Mills, Inc. (General Mills). The five remedial
alternatives are described in depth in the main text of the feasibility study. Of the five alternatives, the
costs and benefits of Alternative 4 (enhanced groundwater bioremediation via injection events) and
Alternative 5 (enhanced groundwater bioremediation via recirculation) were considered using a screening
level life cycle assessment (LCA) of the greenhouse gas (GHG) and total energy impacts. SiteWise™, a tool
developed for green and sustainable remediation, was the LCA method used. The impacts considered in
this LCA were the impacts above the baseline level of impacts associated with Alternative 1 (no further
action beyond previous response actions). Impacts associated with Alternative 2 (monitored natural
attenuation) and Alternative 3 (long-term operation and maintenance of SSD systems) were assumed to
be similar to the baseline. Impacts from activities and materials included in the LCA of Alternatives 4 and
5 include those with information readily available from data used in the feasibility study cost analysis.
Exclusions from the LCA are described in the details below.
B.1 Remedial Alternatives Evaluated
Alternative 4 involves installation of injection wells within public and railroad rights-of-way and periodic
injection of carbon substrate and other amendments to support bioremediation of impacted shallow
groundwater. The carbon substrate and amendments would be injected from mobile tanker trucks.
Alternative 5 involves installation of extraction and injection wells within public and railroad rights-of-way,
installation of conveyance piping within rights-of-way, and construction of two treatment control
buildings for operation of a groundwater recirculation system to support bioremediation of impacted
shallow groundwater.
Estimated quantities, equipment use, and fuel consumption were prepared for Alternatives 4 and 5 as part
of the feasibility study cost analysis.
B.2 LCA Type
The LCA presented in this report is a screening-level comparative analysis loosely based on the ISO 14040
framework (ISO, 2006). Although not fully ISO-compliant, the analysis provides useful insights about
tradeoffs. The findings are intended to be used to provide a comparative assessment between
Alternatives 4 and 5 and the baseline. The LCA framework used for this assessment is described in
Table B1.

B-2
Table B1. LCA Framework and Assumptions for Goal and Scope Definition
Goal of the Study:
To characterize potential life cycle impacts for consideration as an assessment comparing remediation alternatives.
To characterize the order of magnitude scale of the potential life cycle impacts for the design life of one or more alternatives.
The intended use of these estimates is for screening-level comparison of conceptual alternatives, similar to how feasibility cost estimates are used.
Functional Unit: Construction, 10 years of system operation, and an additional 20 years of groundwater monitoring.
System Boundary:
Activities related to bioremediation of shallow groundwater.
Operation of the sub-slab depressurization (SSD) systems at individual properties is excluded from the analysis. These impacts are considered to be "baseline" impacts.
Impacts related to bioremediation are considered to be in addition to the baseline impacts common to all alternatives.
Assumptions and
Limitations:
Impacts from certain activities or materials are excluded if reliable information is not available. These include: potential demolition of existing property on potential treatment plant sites, building materials for exterior of treatment buildings, equipment in treatment buildings (proprietary).
All excavated soil is assumed to be reused at the project (refilling trenches and soil cuttings from well installation) or beneficially used in the local area. It is assumed no soil will be landfilled.
End of life impacts are not included in this analysis.
The potential life cycle impact quantifications may not conform to specific global or national reporting methodology(s).
Impact Categories and
Assessment Method:
Assessment method is U.S. Army Corps of Engineers SiteWise™ and includes total energy and GHG impacts.
Normalization and Weighting:
Weighting is not included in this assessment. Normalization is only included in SiteWise™ in the global warming potential assessment as carbon dioxide equivalents for all GHG emissions.
B.3 Life Cycle Inventory (LCI)
B.3.1 Definition
A Life Cycle Inventory (LCI) is defined in ISO 14040 as “the phase of the life cycle assessment involving the
compilation and quantification of inputs and outputs for a product throughout its life cycle.”
The LCI is essentially a process analysis for the assumed functional unit and system boundaries. Data for
each material and process within the system boundary are quantified and generally allocated as energy
inputs, material inputs, outputs, waste, and emissions to air, water, or soil. The LCI input-output analysis
was performed using the SiteWise™ tool.
Per ISO 14040, the LCI results provide the starting point for the life cycle impact assessment.
B.3.2 Inventory Summary
This inventory is the functional unit and system boundary as defined at this time. Material and process
quantities are based on available feasibility designs and cost estimates. A summary of quantities used for
developing the LCI is shown in Table B2.

B-3
Table B2. Life Cycle Inventory for Alternatives 4 and 5
Work Item
Alternative 4 – Enhanced Groundwater Bioremediation via Injection Events
Alternative 5 – Enhanced Groundwater Bioremediation via Recirculating System
Well Construction Materials
Quantity 60 injection wells; 10 monitoring wells
40 injection wells; 10 monitoring wells; 2 extraction wells
Labor Construction (installation, earthwork) Construction (installation, earthwork)
Materials Sand, gravel, bentonite, cement, concrete, steel, stainless steel
Sand, gravel, bentonite, cement, concrete, steel, stainless steel
Transportation Truck trailer – local sourcing; approx. 20 miles
Truck trailer – local sourcing; approx. 20 miles
Well Drilling
Labor Construction (Drilling) Construction (Drilling)
Equipment Hollow stem auger drill rig Hollow stem auger drill rig
Other Local beneficial use of soil cuttings from drilling – no landfilling
Assume local beneficial use of soil cuttings from drilling – no landfilling
Piping
Quantity 5,100 linear feet + 10% for treatment building interior
Labor Construction (Trenching)
Equipment Excavator and roller
Transportation Truck trailer – local sourcing; approx. 20 miles
Materials HDPE
Other Assume excavated soil used to refill trenches – no landfilling
Amendment
Materials 60% vegetable oil, 40% water emulsion
60% vegetable oil, 40% water emulsion
Quantity1 12,100,000 pounds 8,050,000 pounds
Transportation Tanker truck – out of state sourcing; approx. 800 miles
Tanker truck – out of state sourcing; approx. 800 miles
Labor Technical (well monitoring) Technical (well monitoring)
Other 155,000 gallons chase water
Treatment Building
Quantity 2 buildings; 3,500 sq. ft. pad each
Labor Construction (installation, earthwork)
Equipment Excavator, roller
Transportation
Truck trailer – local sourcing; approx. 20 miles

B-4
Work Item
Alternative 4 – Enhanced Groundwater Bioremediation via Injection Events
Alternative 5 – Enhanced Groundwater Bioremediation via Recirculating System
Treatment Building, continued
Materials
Concrete and gravel – only pad materials included
Other
Assume local beneficial use of excavated soil – no landfilling
Recirculation/Treatment
Duration 10 years
Labor Operating engineer
Equipment Electric pumps, mixers, blowers 1 Initial amendment quantity (7,320,000 pounds) for both Alternatives estimated based on a sensitivity analysis as
described in Sections 5.4 and 5.5 of the feasibility study. Subsequent amendment delivery (732,000 pounds) to maintain amendment levels assumed for both Alternatives. Supplemental injection wells and amendment (4,030,000 pounds) assumed for Alternative 4 to target specific locations where substrate delivery may have been limited by advective flow.
B.4 Life Cycle Impact Assessment (LCIA)
B.4.1 Definition
Life Cycle Impact Assessment (LCIA) is defined in ISO 14040 as “the phase of the life cycle assessment
aimed at understanding and evaluating the magnitude and significance of the potential environmental
impacts for a product system throughout the life cycle of the product. LCIA assigns LCI results to impact
categories.”
The assessment serves to allocate the inventory items to predetermined environmental impact categories,
which are then characterized based on the methodology implemented. There was no regionalization of
impacts for this assessment.
B.4.2 Impact Assessment Summary
This study implements methodology set forth in the SiteWise™ Version 3 model. This impact assessment
is for the functional unit and system boundary as defined at this time. SiteWise™ results for project
impacts in categories of global warming potential, energy footprint, accident risk, and water and
electricity consumption are summarized in Table B3. The global warming potential includes the carbon
dioxide equivalent emissions associated with the production of materials used, fuels consumed, and
electricity used. Energy footprint includes the embodied energy of materials used, fuels consumed, and
electricity used. Accident risk is an estimate of potential injuries based on data from the U.S. Department
of Transportation and Bureau of Labor Statistics. Water consumption includes direct water use during
injection and cooling water consumed during the production of electricity used. Electricity used includes
the MWh of electrical usage. Findings for GHG emissions and total energy used (footprint) are also
illustrated on Figure B1 and Figure B2.

B-5
Table B3. Environmental Impact Assessment Summary
Impact Category Characterization Factor
Alternative 4 – Enhanced Groundwater Bioremediation via Injection Events
Alternative 5 – Enhanced Groundwater Bioremediation via Recirculating System
Global Warming Potential (GWP), Air
Metric tons CO2-eq
3,800 4,400
Energy Footprint MMBTU 66,000 70,000
Water Consumption Gallons 155,000 1,170,000
Electricity Consumption MWH 0 2,300
Accident Risk, Injury Potential accidents 1.0 4.0
Figure B1. Greenhouse Gas Footprint Comparison of Alternatives 4 and 5
0.00
500.00
1000.00
1500.00
2000.00
2500.00
3000.00
3500.00
4000.00
Alternative 4 Alternative 5
Me
tric
To
ns
GHG Emissions
Injection and recirculation
Construction Equipment
Transportation
Amendment
Construction Materials
Well Materials
0.00
500.00
1000.00
1500.00
2000.00
2500.00
3000.00
3500.00
4000.00
4500.00
5000.00
Alternative 4 Alternative 5
Met
ric
Ton
s
GHG Emissions
Injection and recirculation
Construction Equipment
Transportation
Amendment
Construction Materials
Well Materials
0
500
1000
1500
2000
2500
3000
3500
4000
4500
5000
Alternative 4 Alternative 5
Met
ric
Ton
s
GHG Emissions
Injection and recirculation
Construction Equipment
Transportation
Amendment
Construction Materials
Well Materials

B-6
Figure B2. Total Energy Footprint Comparison of Alternatives 4 and 5
Overall, GHG and total energy impacts from Alternatives 4 and 5 are similar. The details regarding which
activities contribute to overall impacts, however, is slightly different. Amendment use is a major driver to
GHG and total energy impacts for both Alternatives 4 and 5, although impacts from amendment use are
about 50% higher for Alternative 4 compared to Alternative 5. The lower impacts from amendment use in
Alternative 5, however, are more than offset by the GHG and total energy impacts from electrical use
associated with groundwater recirculation.
Impacts from transportation of materials are also sizable contributors to both alternatives and are
primarily associated with the transport of amendment. Impacts from transportation are approximately
50% higher for Alternative 4 compared to Alternative 5. Incremental impacts associated with well
construction are relatively small and similar for Alternatives 4 and 5. Impacts from construction materials
and equipment are also relatively small, but approximately two and a half times higher for Alternative 5
compared to Alternative 4.
The GHG impacts associated with each alternative are compared to equivalencies determined by the EPA
to provide an estimate of the order of magnitude of the impacts. The GHG impacts from Alternative 4 are
equivalent to the combined impact of 800 passenger vehicles driven for one year or 428,000 gallons of
gasoline consumed above the baseline. The GHG impacts from Alternative 5 are equivalent to the
combined impact of 925 passenger vehicles driven for one year or 495,000 gallons of gasoline consumed
above the baseline.
0.00E+00
1.00E+04
2.00E+04
3.00E+04
4.00E+04
5.00E+04
6.00E+04
7.00E+04
Alternative 4 Alternative 5
MM
BTU
Total Energy Used
Injection and recirculation
Construction Equipment
Transportation
Amendment
Construction Materials
Well Materials
0.00E+00
1.00E+04
2.00E+04
3.00E+04
4.00E+04
5.00E+04
6.00E+04
7.00E+04
8.00E+04
Alternative 4 Alternative 5
MM
BTU
Total Energy Used
Injection and recirculation
Construction Equipment
Transportation
Amendment
Construction Materials
Well Materials
0
10,000
20,000
30,000
40,000
50,000
60,000
70,000
80,000
Alternative 4 Alternative 5
MM
BTU
Total Energy Used
Injection and recirculation
Construction Equipment
Transportation
Amendment
Construction Materials
Well Materials

B-7
B.5 Limitations
The following limitations should be recognized for this LCA study:
The impact assessment should be used for evaluating the factors identified in the goal and scope.
The impact assessment is comparative and should be used for evaluating the scenarios as defined
herein.
The findings should not be used as an absolute, stand-alone footprinting assertion for any single
scenario assessed. Rather, the findings are intended to be used for comparative purposes for the
scenarios presented.
The methodology may not conform to the requirements of third-party reporting entities, such as
Climate Registry or other formalized reporting protocols.
The LCA does not provide estimates of actual risk and is simply a screening tool to allow
consideration and quantification of the potential for impacts.
This analysis focuses on normal operations and is not intended for assessment of accidental
situations (e.g. accidental amendment spills).
The findings are intended to be used to inform decision making and assist in scoping potential
detailed analyses in the future.
B.6 Conclusions
The boundaries of this LCA include impacts above the baseline level of Alternative 1. This assessment
indicates that both Alternative 4 and Alternative 5 have probable life cycle impacts significantly greater
than the baseline impacts associated with all five alternatives. The probable impacts associated with
Alternative 5 are higher than those associated with Alternative 4.
B.7 References
International Standards Organization (ISO), 2006. ISO 14040:2006, Environmental Management – Life Cycle
Assessment – Principles and Framework. 2006.
U.S. Environmental Protection Agency (EPA), 2016. Greenhouse Gas Equivalencies Calculator, available at
https://www.epa.gov/energy/greenhouse-gas-equivalencies-calculator. Accessed April 2016.
U.S. Environmental Protection Agency (EPA), 1993. Life-Cycle Assessment: Inventory Guidelines and
Principles, Office of Research and Development. February 1993.
U.S. Navy, U.S. Army Corps of Engineers, Battelle. SiteWise™ Version 3 Tool for Green and Sustainable
Remediation. 2013.