vapor intrusion pathway: a practical guideline - frtr.gov intrusion pathway: a practical guideline...
TRANSCRIPT
Vapor Intrusion Pathway: A Practical Guideline
John BoyerNew Jersey Dept. of Environmental Protection
November 2009
2
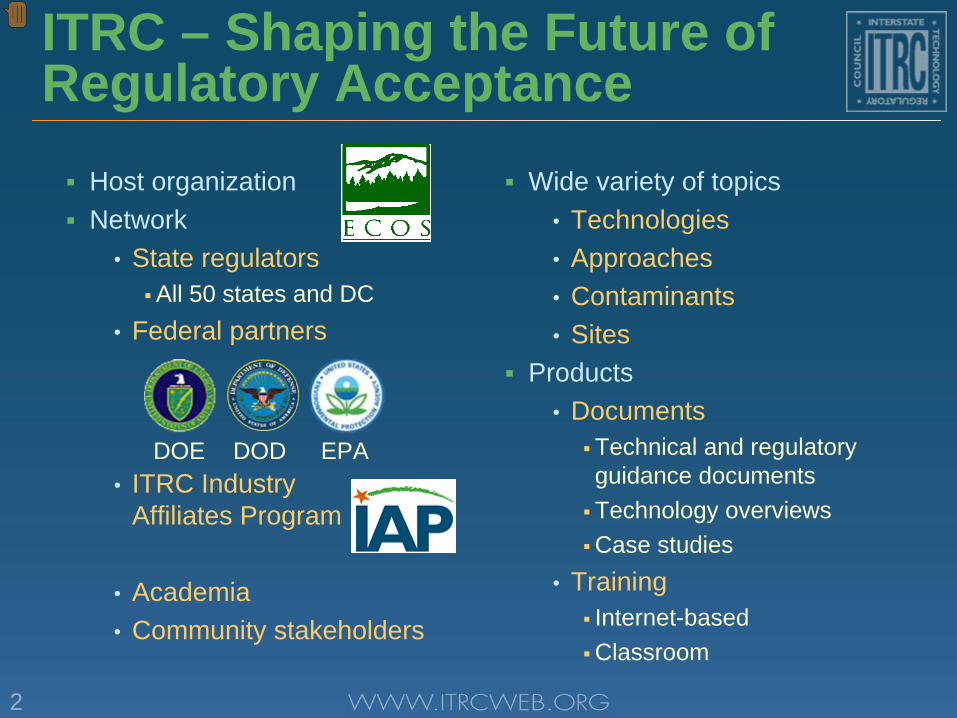
ITRC – Shaping the Future of Regulatory Acceptance
Host organization
Network• State regulators
All 50 states and DC• Federal partners
• ITRC Industry Affiliates Program
• Academia• Community stakeholders
Wide variety of topics• Technologies• Approaches• Contaminants• Sites
Products• Documents
Technical and regulatory guidance documents
Technology overviews
Case studies• Training
Internet-based
Classroom
DOE DOD EPA
3
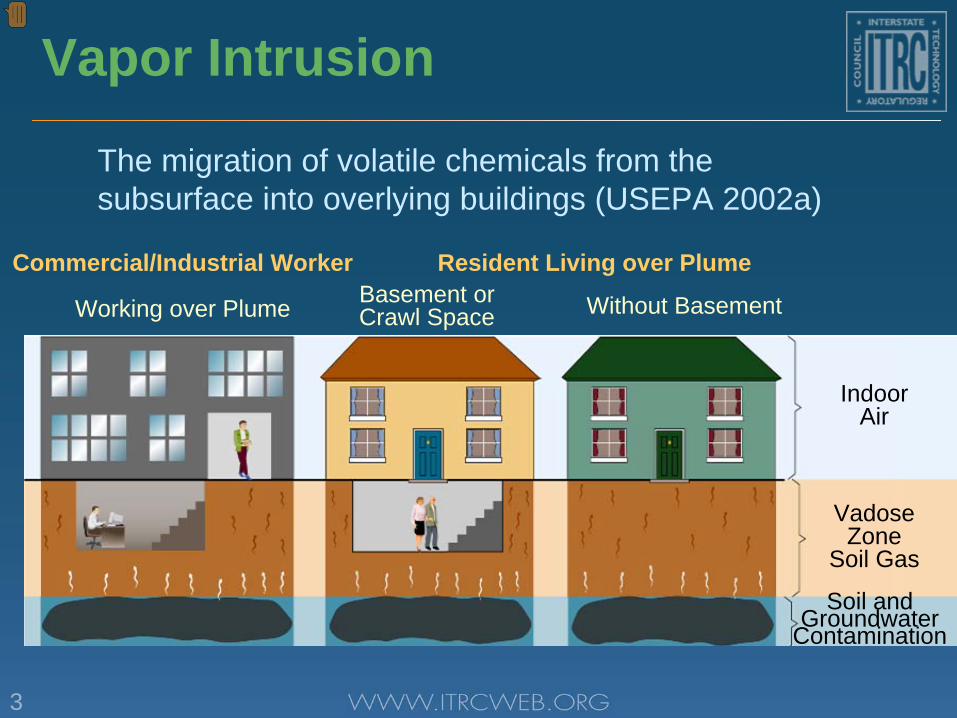
Vapor Intrusion
The migration of volatile chemicals from the subsurface into overlying buildings (USEPA 2002a)
IndoorAir
Vadose Zone
Soil Gas
Soil and Groundwater
Contamination
Commercial/Industrial Worker
Working over Plume Without Basement
Resident Living over PlumeBasement or Crawl Space

4
ITRC Vapor Intrusion Pathway: A Practical Guideline
Key vapor intrusion issues• Investigative strategies• Phased, iterative process• Background
contamination• The “toolbox”• Conceptual site model• Future land use• Remediation technologies• Closure strategies• Qualified consultants
http://www.itrcweb.org/VaporIntrusion
5
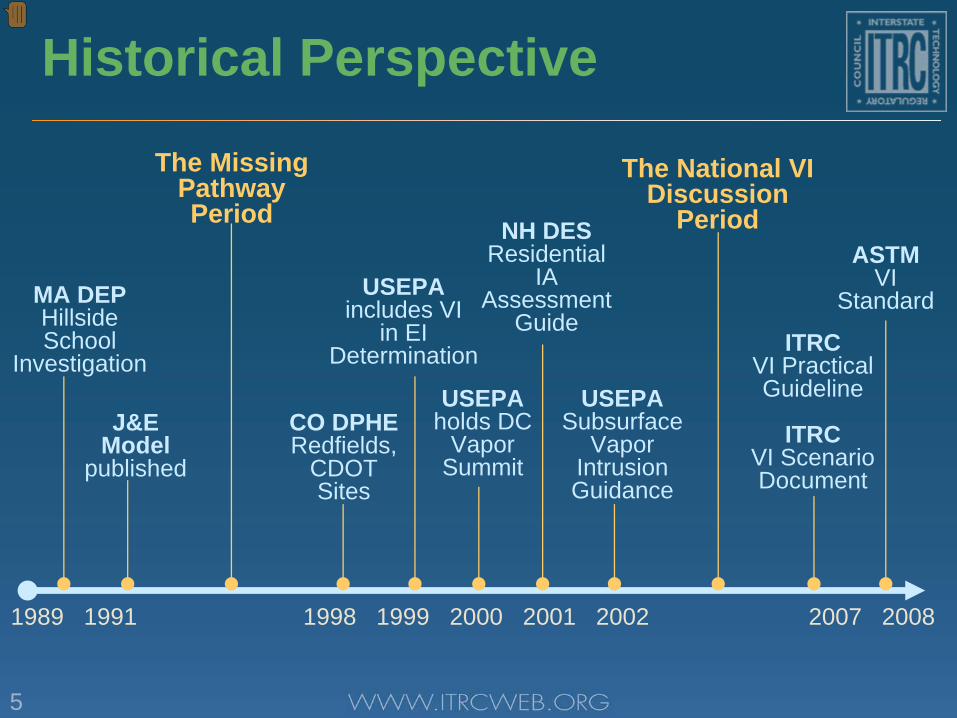
Historical Perspective
1989 1991 1998 1999 2000 2001 2002 2007 2008
MA DEPHillside School
Investigation
The Missing Pathway Period
CO DPHERedfields,
CDOT Sites
USEPA includes VI
in EI Determination
USEPAholds DC
Vapor Summit
J&E Model
published
ITRCVI Practical Guideline
ITRC VI Scenario Document
The National VI Discussion
PeriodASTM
VI Standard
NH DESResidential
IA Assessment
Guide
USEPA Subsurface
Vapor Intrusion Guidance

6
VI Regulatory State Guidance
States with Regulatory Guidance in 2009
States with Regulatory VI Guidance in 2004
7
Interdisciplinary Challenge
Risk assessor
Mechanical engineer
Community relations coordinator
Industrial hygienist
Environmental scientist
Soil scientist
Hydrogeologist
Analytical chemist
Legal professional
Real estate agents
Banks
Insurance agents
8
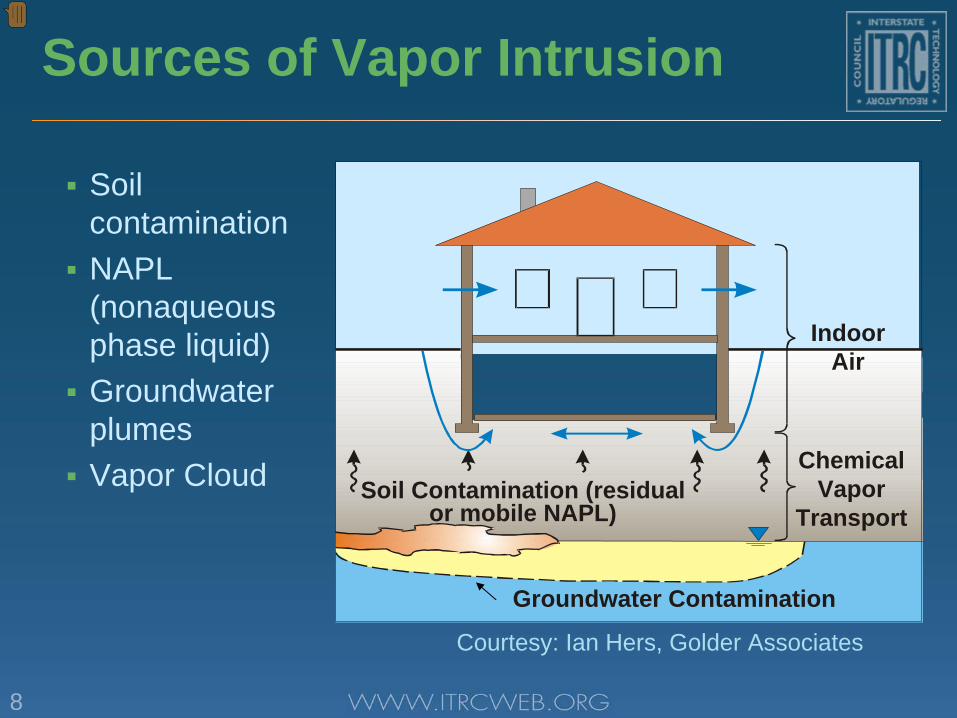
Sources of Vapor Intrusion
Soil contamination
NAPL (nonaqueous phase liquid)
Groundwater plumes
Vapor Cloud
Courtesy: Ian Hers, Golder Associates
Indoor Air
Chemical Vapor
TransportSoil Contamination (residual
or mobile NAPL)
Groundwater Contamination

9
Vapor Pathway into Structures
Pathway• Partitioning to vapor
phase• Diffusion in vadose zone• Advection near building• Dilution in building
10
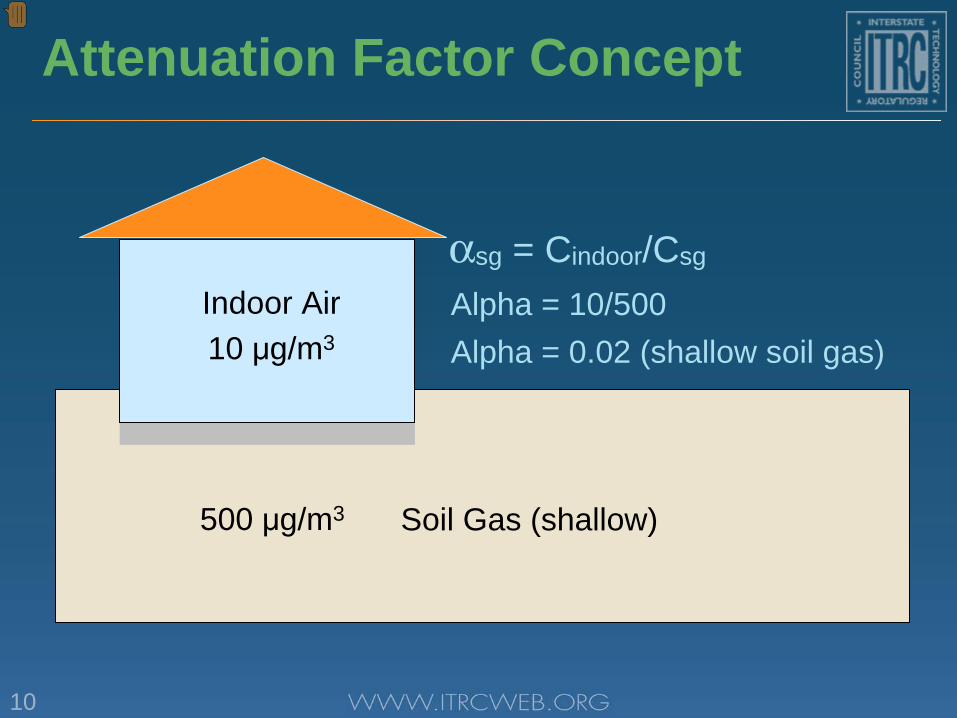
Attenuation Factor Concept
Indoor Air10 μg/m3
500 μg/m3
Alpha = 10/500
Soil Gas (shallow)
Alpha = 0.02 (shallow soil gas)
αsg = Cindoor/Csg
11
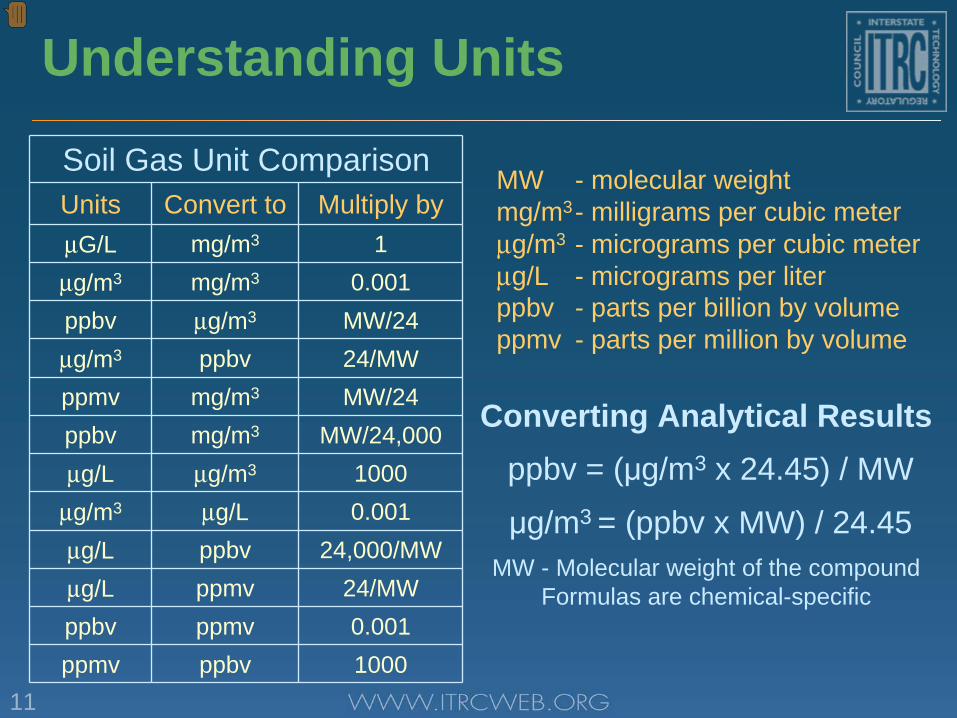
Understanding Units
Converting Analytical Resultsppbv = (μg/m3 x 24.45) / MW
μg/m3 = (ppbv x MW) / 24.45MW - Molecular weight of the compound
Formulas are chemical-specific
MW - molecular weightmg/m3- milligrams per cubic meterμg/m3 - micrograms per cubic meterμg/L - micrograms per literppbv - parts per billion by volumeppmv - parts per million by volume
Soil Gas Unit ComparisonUnits Convert to Multiply byμG/L mg/m3 1μg/m3 mg/m3 0.001ppbv μg/m3 MW/24μg/m3 ppbv 24/MWppmv mg/m3 MW/24ppbv mg/m3 MW/24,000μg/L μg/m3 1000
μg/m3 μg/L 0.001μg/L ppbv 24,000/MWμg/L ppmv 24/MWppbv ppmv 0.001ppmv ppbv 1000
12
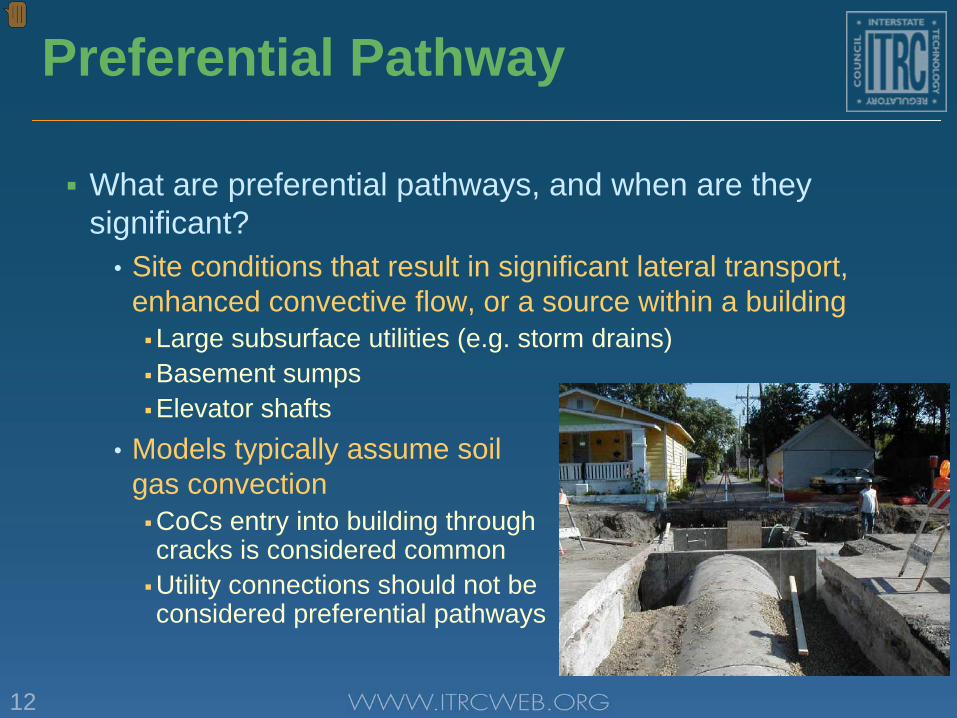
Preferential Pathway
What are preferential pathways, and when are they significant?
• Site conditions that result in significant lateral transport, enhanced convective flow, or a source within a building
Large subsurface utilities (e.g. storm drains)
Basement sumps
Elevator shafts• Models typically assume soil
gas convection
CoCs entry into building through cracks is considered common
Utility connections should not be considered preferential pathways
13
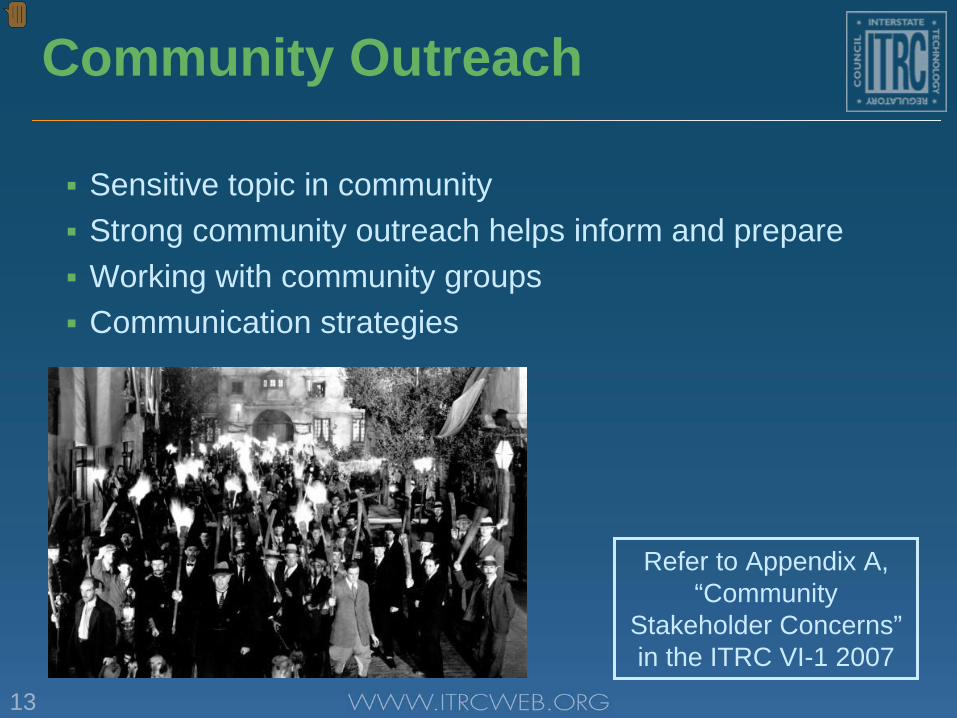
Community Outreach
Sensitive topic in community
Strong community outreach helps inform and prepare
Working with community groups
Communication strategies
Refer to Appendix A, “Community
Stakeholder Concerns” in the ITRC VI-1 2007
14
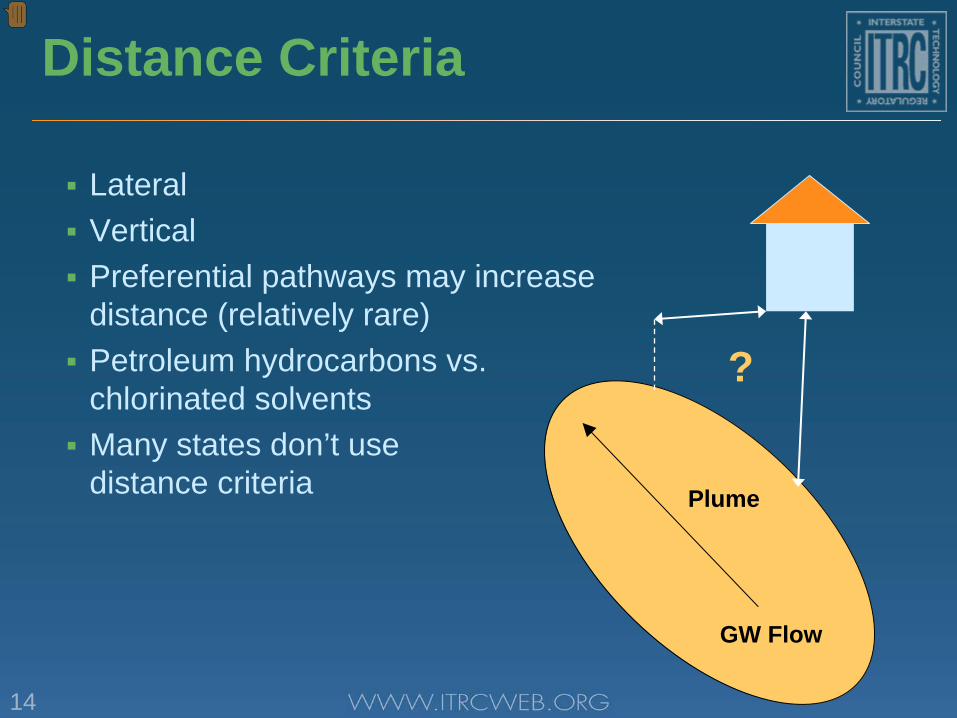
Plume
GW Flow
?
Distance Criteria
Lateral
Vertical
Preferential pathways may increase distance (relatively rare)
Petroleum hydrocarbons vs. chlorinated solvents
Many states don’t use distance criteria

15
Multiple Lines of Evidence (MLE)
Soil gas spatial concentrations
Groundwater spatial data
Background (internal and external / ambient) sources
Building construction and current condition
Sub-slab soil gas data
Soil gas data
Indoor air data
Constituent ratios
Soil stratigraphy
Temporal patterns
16
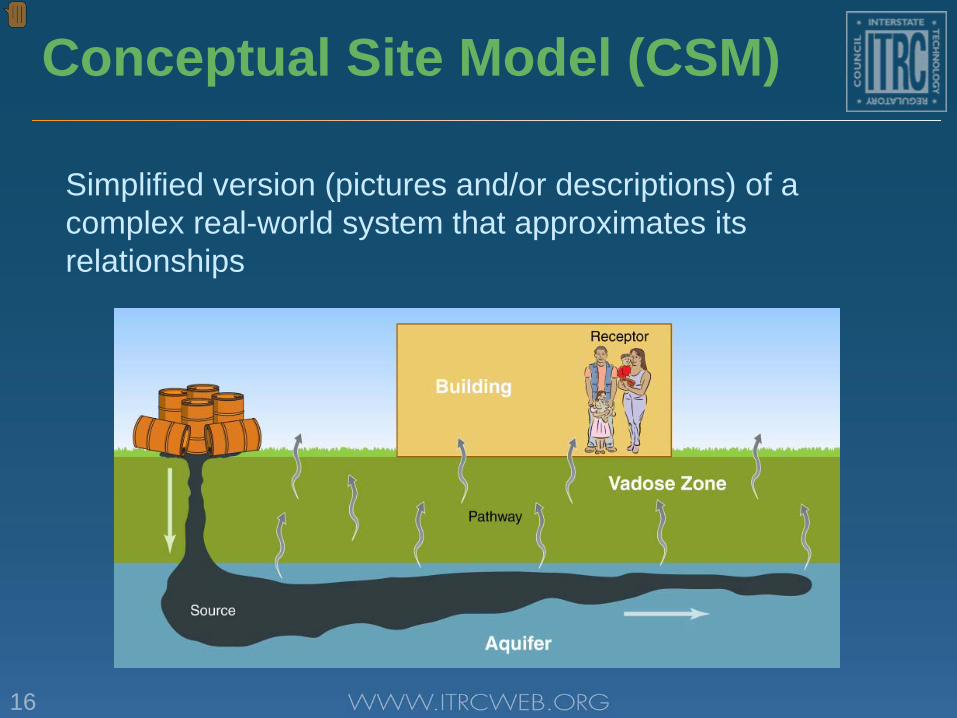
Conceptual Site Model (CSM)
Simplified version (pictures and/or descriptions) of a complex real-world system that approximates its relationships
17
Complicating Factors for VI Assessments
Ultra low screening levels• Increases chances for false positives
Inconsistent screening levels
Allowed assessment methods• Vary among agencies
Chlorinated vs. petroleum hydrocarbons• Treat same way?• Allow for bioattenuation – how?
18
“Exterior” Investigations
“Map” the contamination
Identify buildings with potential VI risks
Identify target compounds
Collect site-specific geologic/pneumatic data
Minimize inconvenience to occupants/ owners
“Bound the scope of the problem”
19
“Interior” Investigations
Public relations• Access agreements, fact sheets, meetings
Removal of interior sources (if practical)
Samples and “controls”• Outdoor, sub-slab, etc.
Analytical methods, analytes, reporting limits
Risk communication
Potential litigation
20
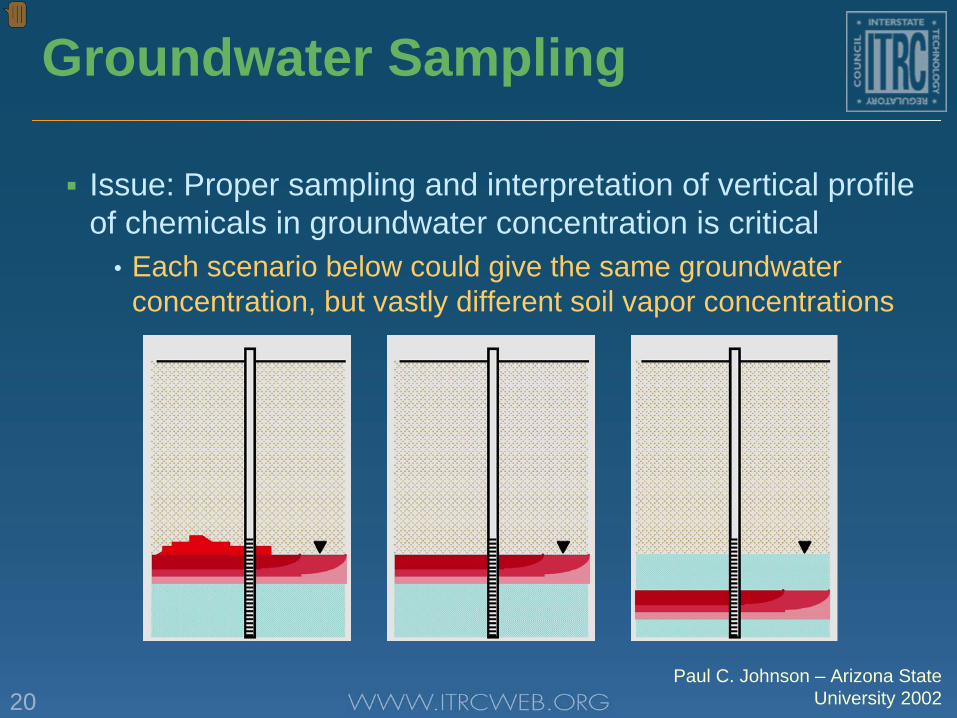
Groundwater Sampling
Issue: Proper sampling and interpretation of vertical profile of chemicals in groundwater concentration is critical
• Each scenario below could give the same groundwater concentration, but vastly different soil vapor concentrations
Paul C. Johnson – Arizona State University 2002
21
Soil Gas Sampling
METHOD
Active
Passive
Flux Chambers (supplemental tool)
Active method most often employed for VI
LOCATION
Exterior
Near Slab
Sub-Slab
Sub-slab soil gas sampling most often employed for VI
22
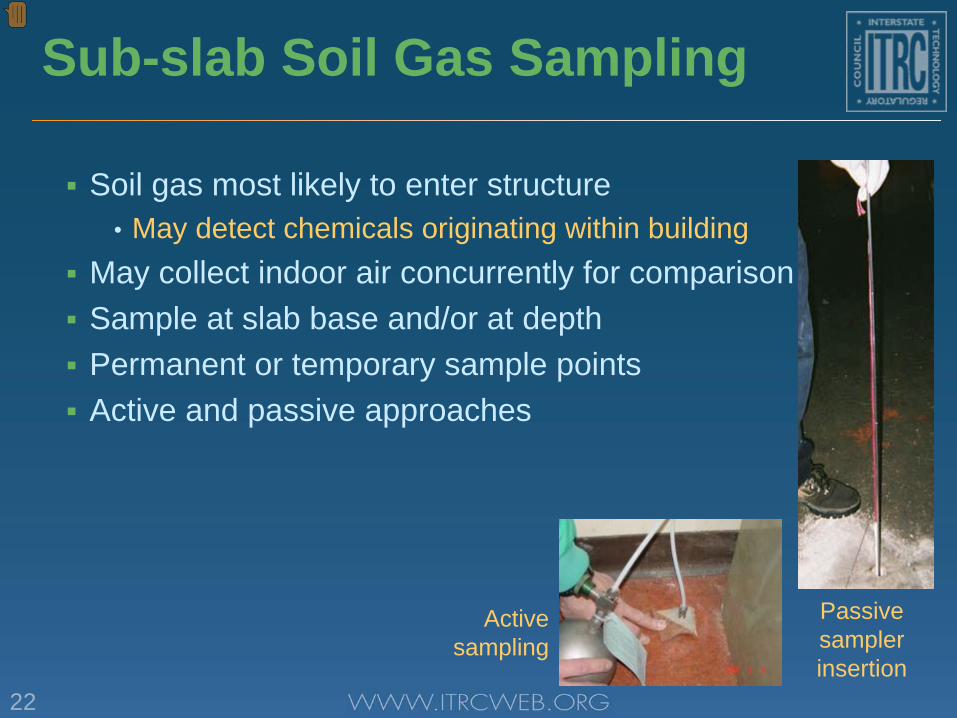
Sub-slab Soil Gas Sampling
Soil gas most likely to enter structure• May detect chemicals originating within building
May collect indoor air concurrently for comparison
Sample at slab base and/or at depth
Permanent or temporary sample points
Active and passive approaches
Passive sampler insertion
Active sampling
23
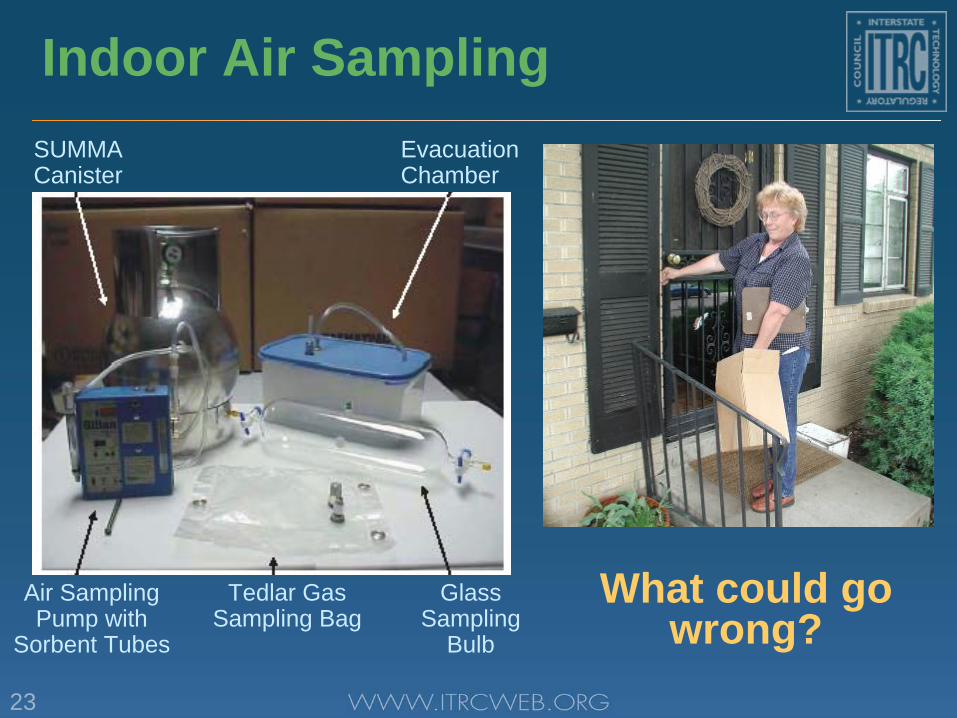
Indoor Air Sampling
What could go wrong?
SUMMA Canister
Evacuation Chamber
Air Sampling Pump with
Sorbent Tubes
Glass Sampling
Bulb
Tedlar Gas Sampling Bag
24
Indoor Air Measurement
Pros• Actual indoor concentration, no modeling required• Relatively quick, no drilling or heavy equipment• Less spatial variability than soil vapor
One sample often adequate for typical basements
Cons• Potential for background sources, typically addressed by:
Ambient air and sub-slab vapor samples
Survey of building materials and activities• No control (sample left unattended for up to 24 hours)• Typically more temporal variability than soil vapor
Up to one order of magnitude common for indoor air• Requires entering home
25
Supplemental Tools/Data
Site specific alpha using radon• Factor of 10 to 100 - $100/sample
Indoor air ventilation rate• Factor of 2 to 10 - <$1,000 per determination
Real-time, continuous analyzers • Can sort out noise/scatter
Pressure measurements • Can help interpret indoor air results
26
Biodegradation
Biodegradable Petroleum Hydrocarbon Volatile Chemicals of Concern (PH-VCoC) are
“petroleum hydrocarbons such as benzene, xylenes, toluene and ethylbenzene (or a mixture of such chemicals) that are a subset of volatile chemicals of concern and that are distinguished because they are known to readily biodegrade to carbon dioxide in the presence of oxygen by ubiquitous soil microbes.”
ASTM (American Society of Testing and Materials)
27
Background Sources
Background refers to concentrations not attributable to releases from a site, and is usually described as naturally occurring or anthropogenic (USEPA 2002)
• Background concentrations may exceed risk-based levels in indoor air for some common VOCs
• Background sources may be inside the building or present in ambient outdoor air
• The final remedy may or may not eliminate a source of risks caused by background sources
• Some states incorporate typical background concentrations into their screening values, but most do not
28
Consideration of Variability
Indoor air samples of 24-hours typically show up to an order of magnitude temporal variability
• Radon industry addressed this by requiring samples to be collected over a longer period
Deeper soil gas samples tend to have less temporal variability, but tend to overestimate risks for degradable compounds
Season climate changes (hot/cold, wet/dry) are minimal in some areas, significant in others
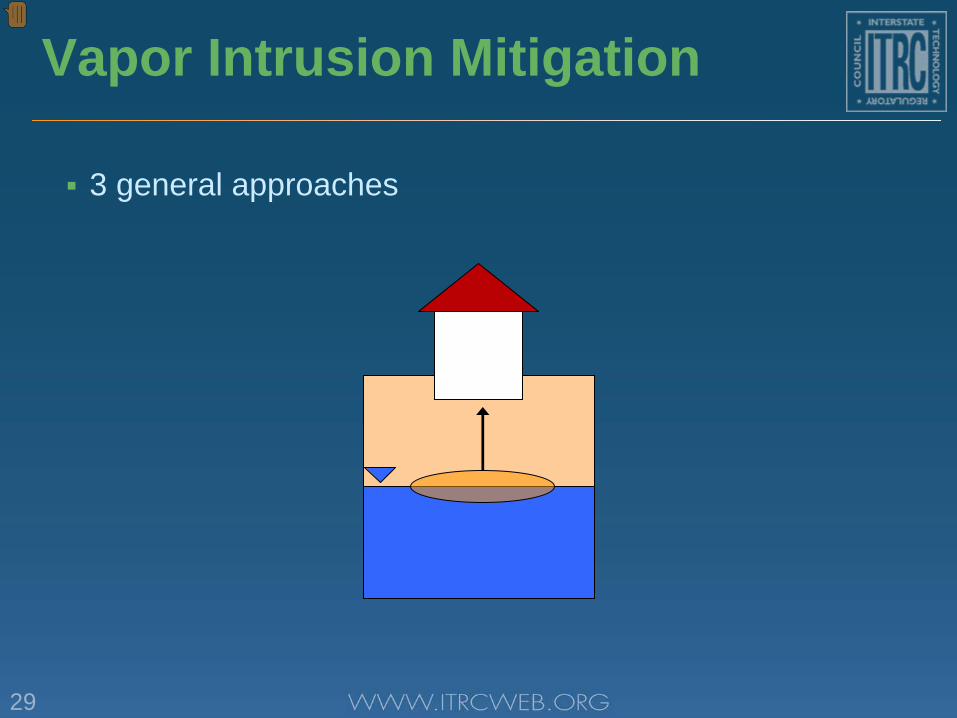
29
Vapor Intrusion Mitigation
3 general approaches
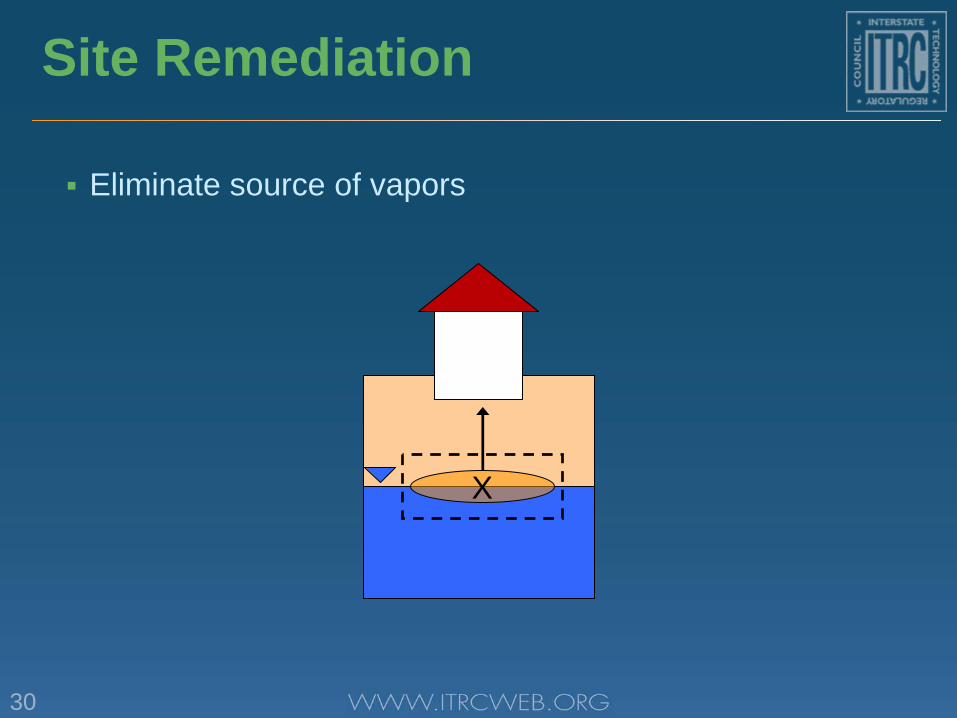
30
Site Remediation
Eliminate source of vapors
X
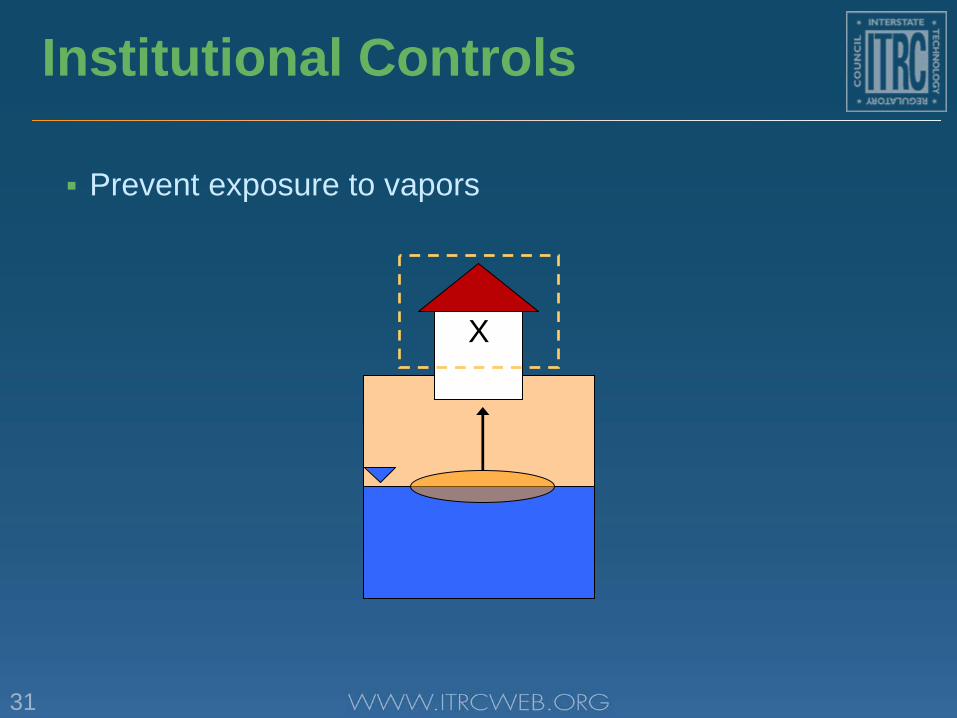
31
Institutional Controls
Prevent exposure to vapors
X
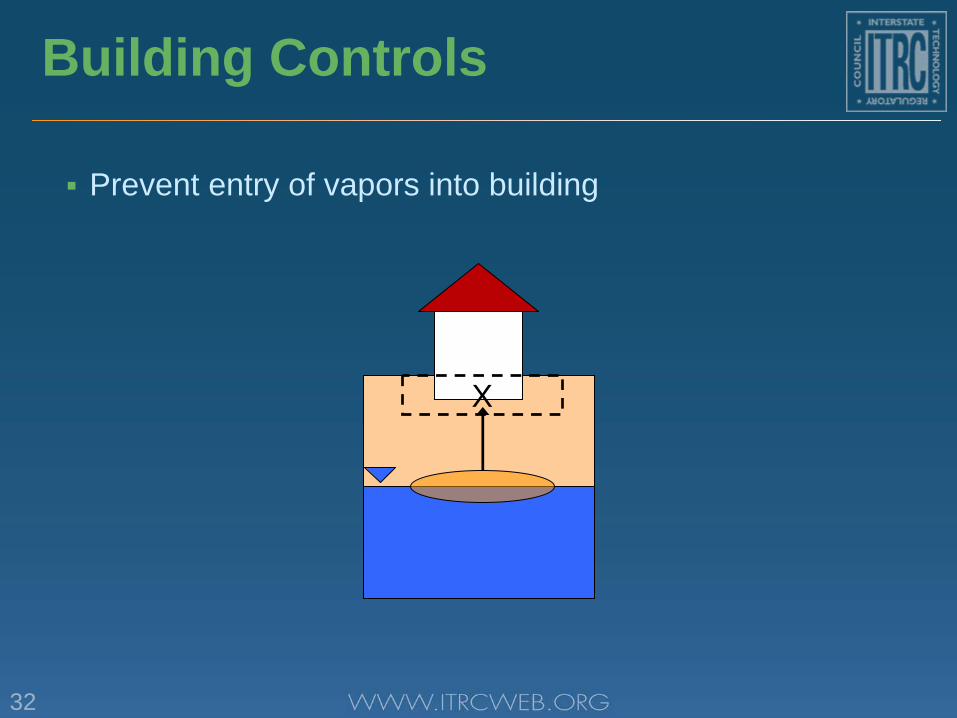
32
Building Controls
Prevent entry of vapors into building
X
33
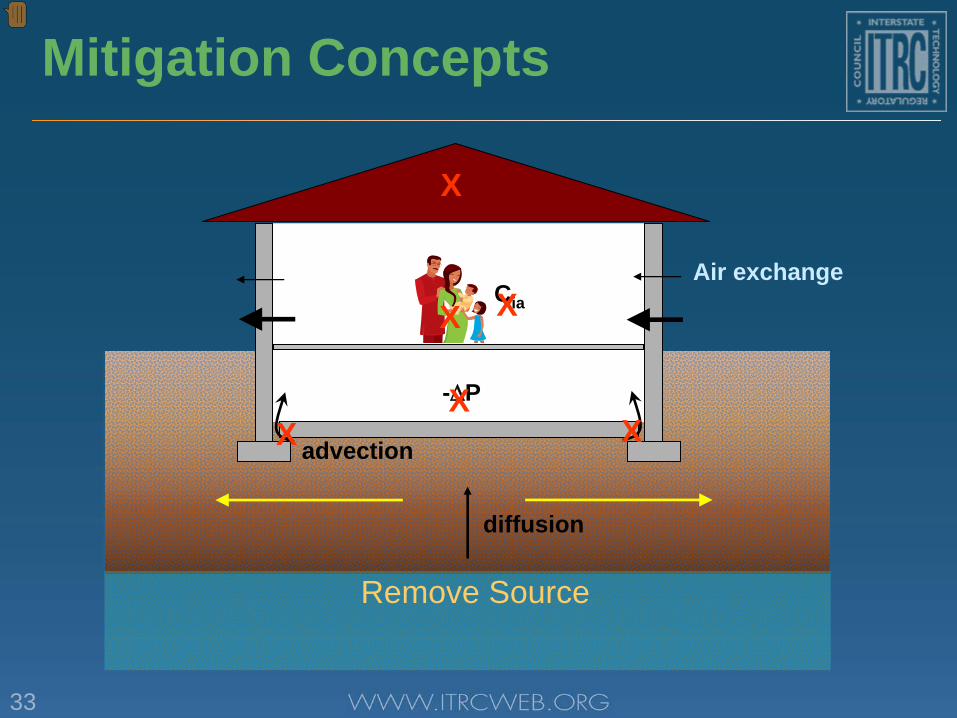
Mitigation Concepts
diffusion
advection
Air exchangeCia
-∆P
Remove Source
X
X XX
XX
34
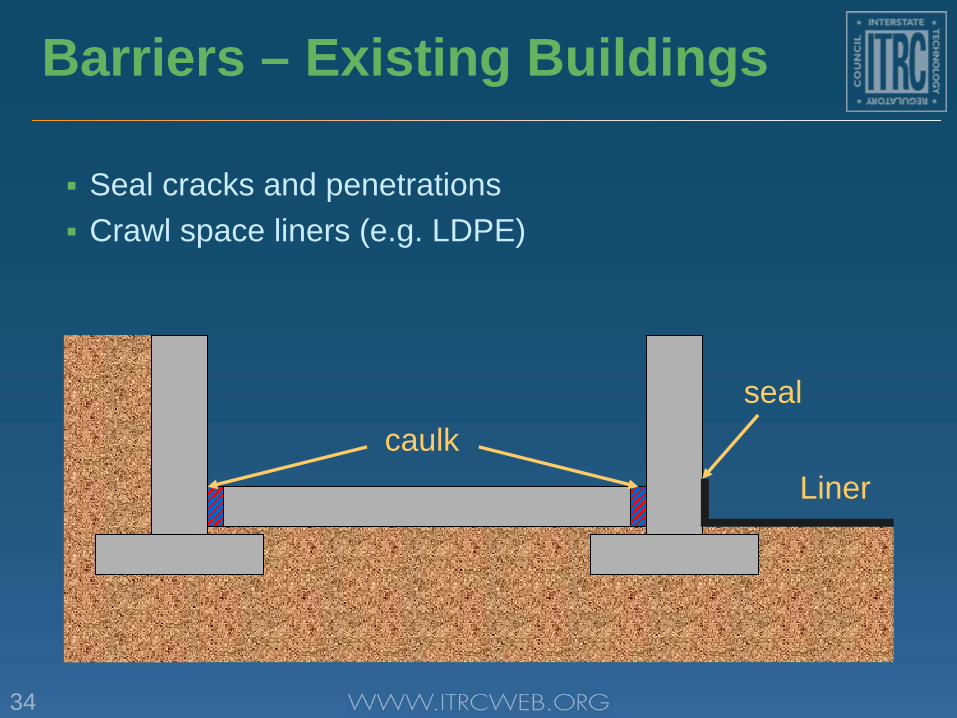
Barriers – Existing Buildings
Seal cracks and penetrations
Crawl space liners (e.g. LDPE)
caulkLiner
seal
35
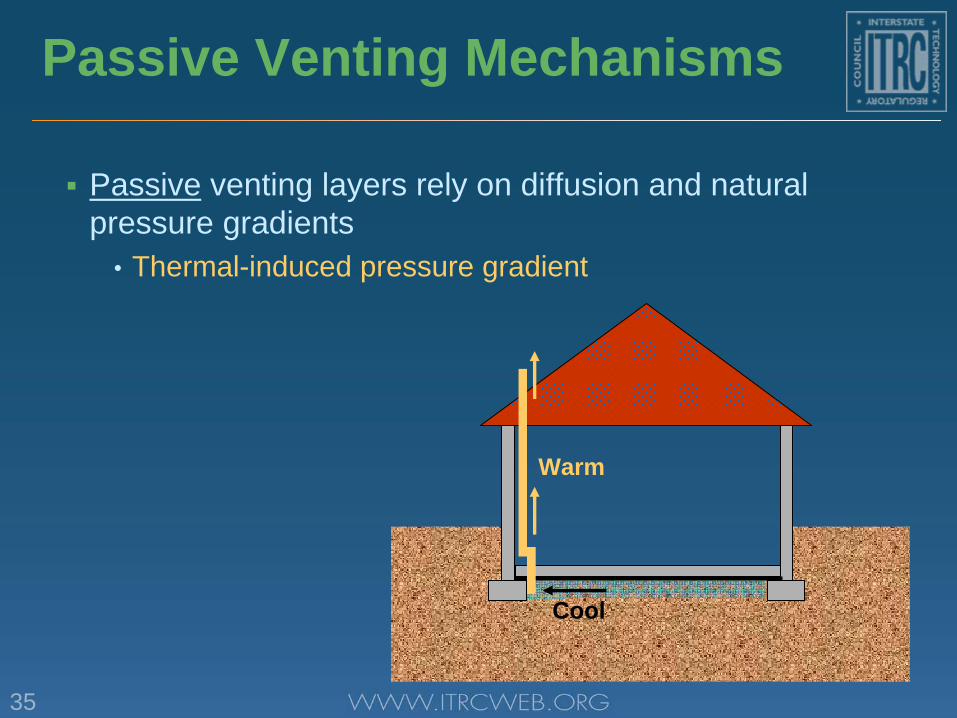
Passive Venting Mechanisms
Passive venting layers rely on diffusion and natural pressure gradients
• Thermal-induced pressure gradient
Warm
Cool
36
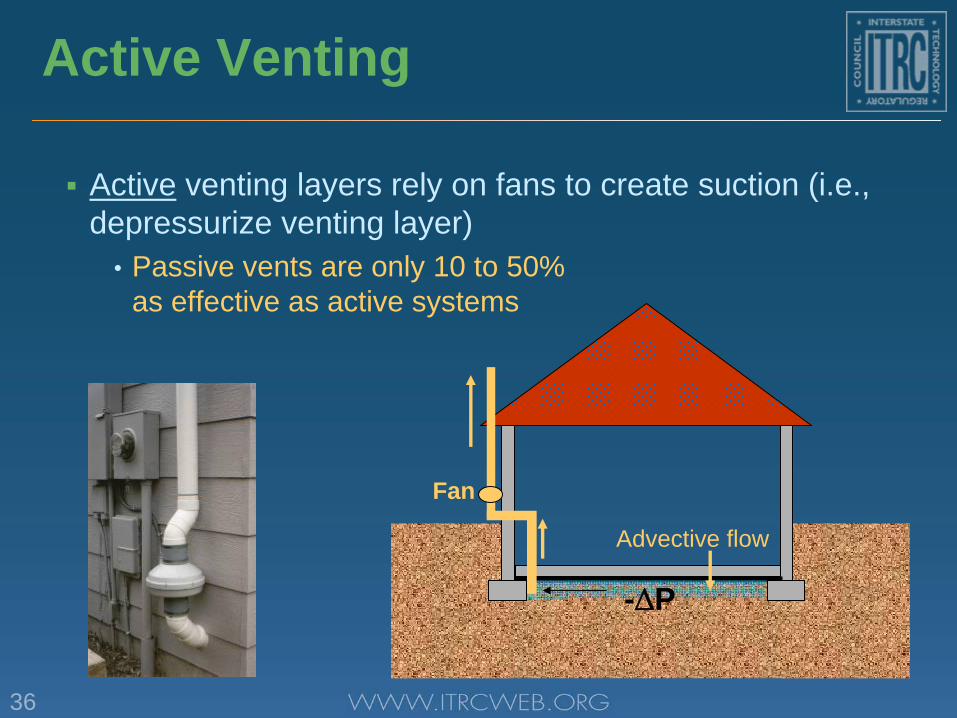
Active Venting
Active venting layers rely on fans to create suction (i.e., depressurize venting layer)
• Passive vents are only 10 to 50% as effective as active systems
-∆P
Advective flow
Fan
37
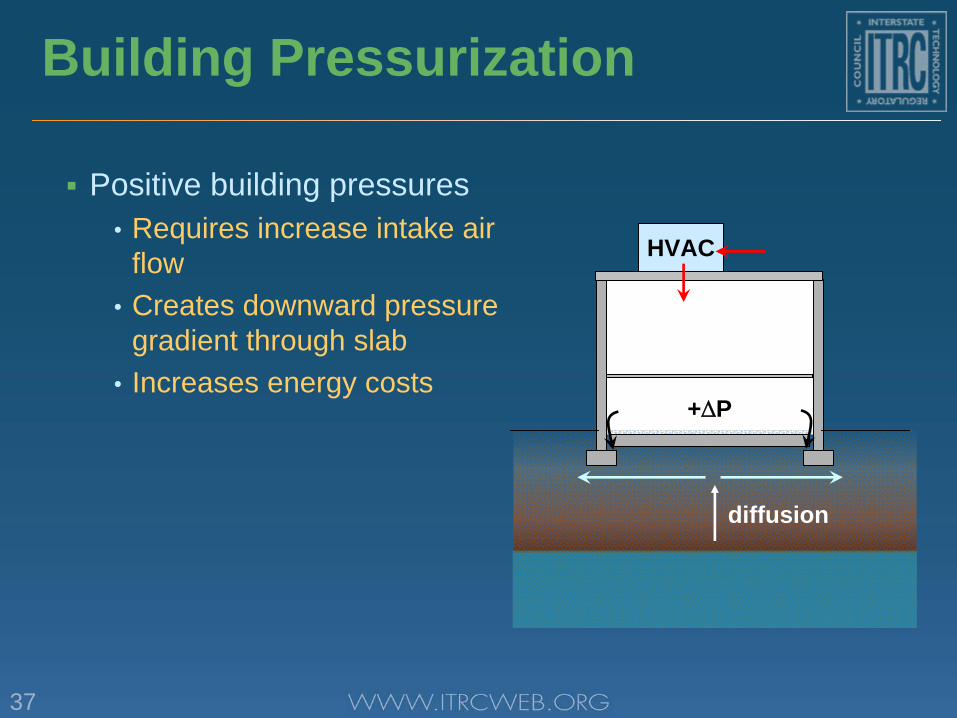
Building Pressurization
Positive building pressures• Requires increase intake air
flow• Creates downward pressure
gradient through slab• Increases energy costs
HVAC
diffusion
+∆P
38
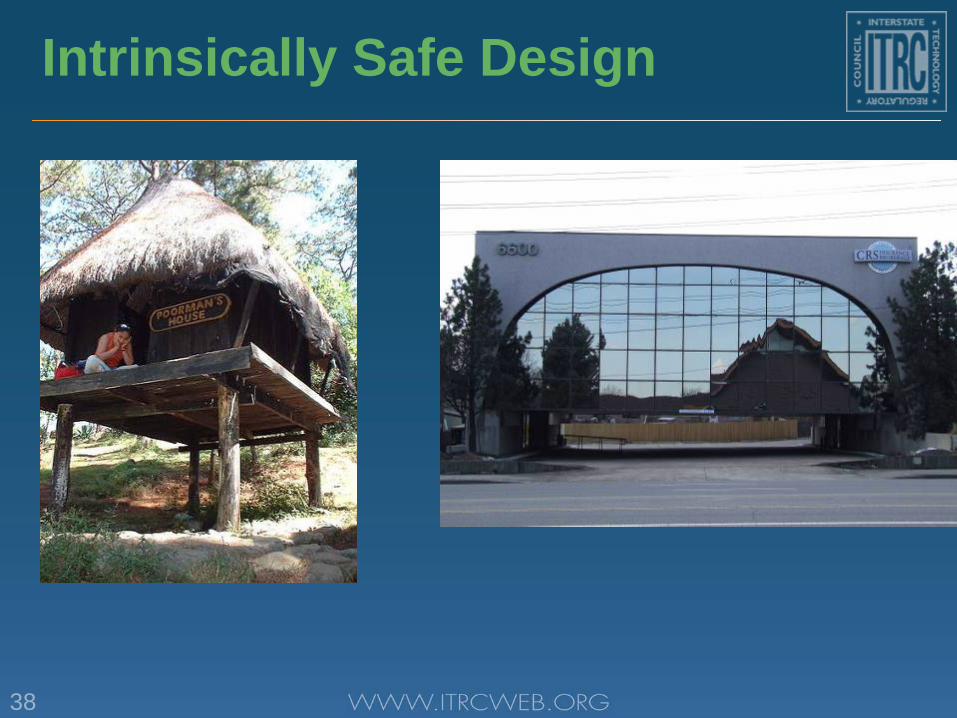
Intrinsically Safe Design
39
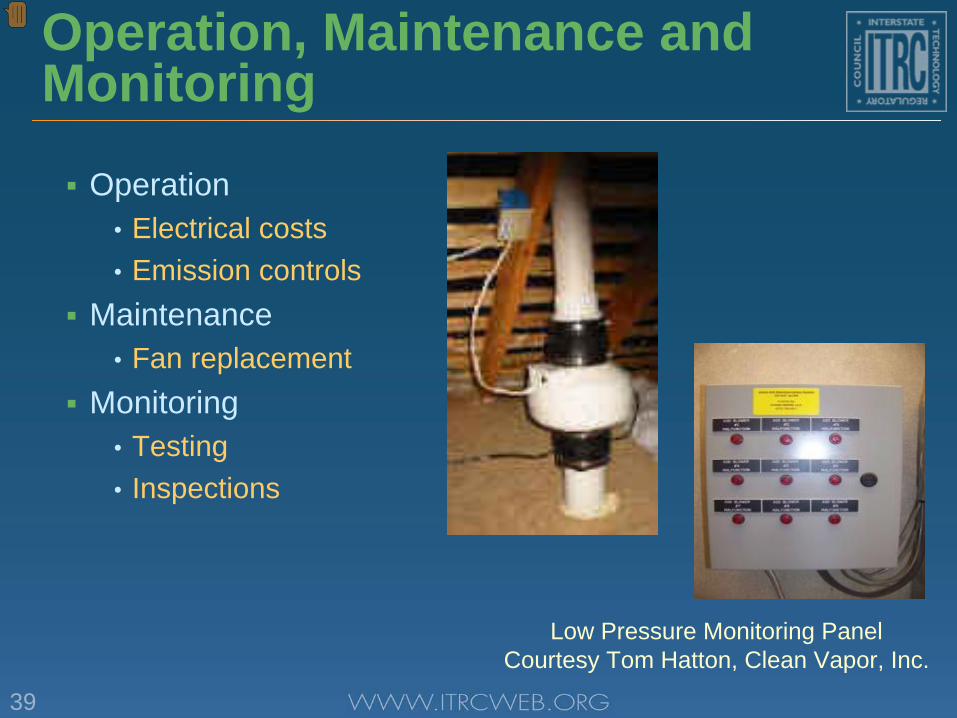
Operation, Maintenance and Monitoring
Operation• Electrical costs• Emission controls
Maintenance• Fan replacement
Monitoring• Testing• Inspections
Low Pressure Monitoring PanelCourtesy Tom Hatton, Clean Vapor, Inc.
40
Lessons Learned
Vapor intrusion is a complex pathway
Multiple lines of evidence approach is critical
The investigative “tool box” is large and growing
Background sources & physical processes complicate data interpretation
There are more mitigation options than just SSD
A community outreach program is essential
Science of vapor intrusion is advancing and changing
41
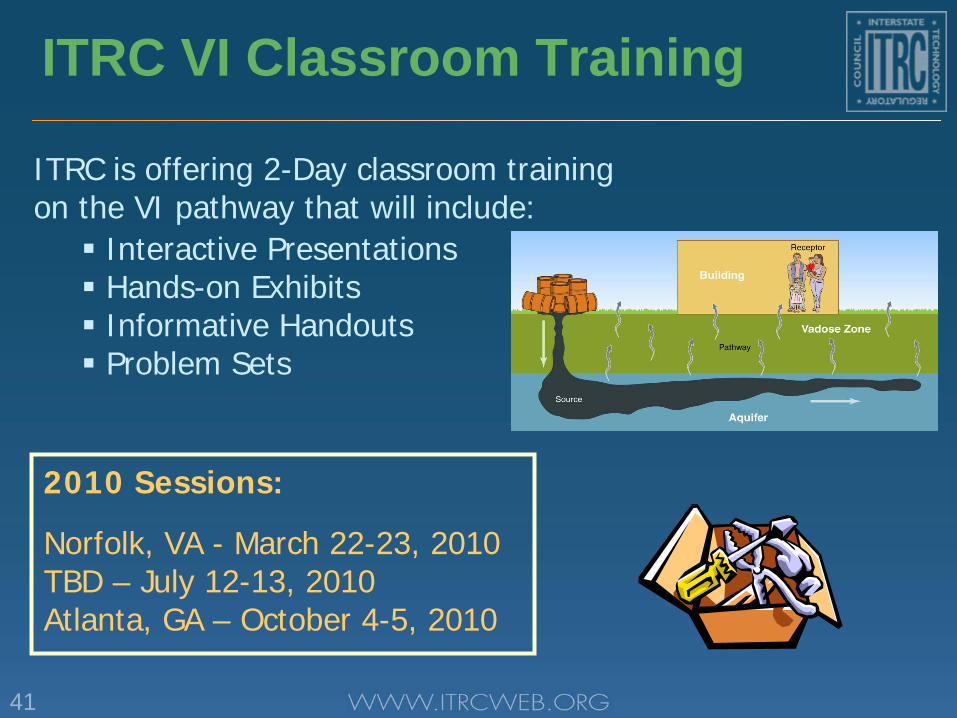
ITRC VI Classroom Training
ITRC is offering 2-Day classroom training on the VI pathway that will include: Interactive Presentations Hands-on Exhibits Informative Handouts Problem Sets
2010 Sessions:
Norfolk, VA - March 22-23, 2010TBD – July 12-13, 2010Atlanta, GA – October 4-5, 2010