validation of the alamarblue® assay as a fast screening ... · ever, data about antimicrobial...
TRANSCRIPT
RESEARCH ARTICLE
Validation of the AlamarBlue® Assay as a Fast
Screening Method to Determine the
Antimicrobial Activity of Botanical Extracts
Olaf Tyc1☯, Laura Tomas-Menor2☯, Paolina Garbeva1, Enrique Barrajon-Catalan2,3‡,
Vicente Micol2‡*
1 Netherlands Institute of Ecology (NIOO-KNAW), Department of Microbial Ecology, Wageningen, The
Netherlands, 2 Instituto de Biologıa Molecular y Celular (IBMC), Universidad Miguel Hernandez (UMH),
Avenida de la Universidad s/n, E-03202 Elche, Alicante, Spain, 3 INVITROTECNIA S.L., Santiago Grisolıa 2,
Tres Cantos, Madrid, Spain
☯ These authors contributed equally to this work.
‡ These authors share co-senior authorship.
Abstract
Plant compounds are a potential source of new antimicrobial molecules against a variety of
infections. Plant extracts suppose complex phytochemical libraries that may be used for the
first stages of the screening process for antimicrobials. However, their large variability and
complexity require fast and inexpensive methods that allow a rapid and adequate screening
for antimicrobial activity against a variety of bacteria and fungi. In this study, a multi-well
plate assay using the AlamarBlue® fluorescent dye was applied to screen for antimicrobial
activity of several botanical extracts and the data were correlated with microbial colony form-
ing units (CFU). This correlation was performed for three pathogenic model microorgan-
isms: Escherichia coli (Gram negative bacteria), Staphylococcus aureus (Gram positive
bacteria) and for the yeast-like fungi Candida albicans. A total of ten plant extracts from dif-
ferent Mediterranean plants, including several Cistus and Hibiscus species, were success-
fully tested. HPLC-DAD-ESI-MS/MS analysis was utilized for the characterization of the
extracts in order to establish structure-activity correlations. The results show that extracts
enriched in ellagitannins and flavonols are promising antibacterial agents against both Gram
positive and Gram negative bacteria. In contrast, phenolic acids, anthocyanidins and flavo-
nols may be related to the observed antifungal activity.
Introduction
Despite the numerous advances made in medicine and pharmacology, there is still a need for
new antimicrobial agents, especially due to outbreak of multi-drug-resistant forms of both
Gram negative and Gram positive bacteria to front-line antibiotics [1–4]. Antibiotic resistance
has become one of the major sanitary problems worldwide and disseminate rapidly amongst
patients in healthcare facilities. Although resistant bacteraemia rates seemed to decrease in sev-
eral EU countries within the past years, the European Medicine Agency (EMA) estimates that
PLOS ONE | DOI:10.1371/journal.pone.0169090 December 29, 2016 1 / 18
a1111111111
a1111111111
a1111111111
a1111111111
a1111111111
OPENACCESS
Citation: Tyc O, Tomas-Menor L, Garbeva P,
Barrajon-Catalan E, Micol V (2016) Validation of the
AlamarBlue® Assay as a Fast Screening Method to
Determine the Antimicrobial Activity of Botanical
Extracts. PLoS ONE 11(12): e0169090.
doi:10.1371/journal.pone.0169090
Editor: Vijai Gupta, National University of Ireland—
Galway, IRELAND
Received: August 16, 2016
Accepted: December 12, 2016
Published: December 29, 2016
Copyright: © 2016 Tyc et al. This is an open access
article distributed under the terms of the Creative
Commons Attribution License, which permits
unrestricted use, distribution, and reproduction in
any medium, provided the original author and
source are credited.
Data Availability Statement: All relevant data are
within the paper and its Supporting Information
files.
Funding: This work was supported by projects
AGL2011-29857-C03-03 and AGL2015-67995-C3-
1-R from Spanish Ministry of Science and
Innovation; Torres Quevedo grant PTQ-14-07243
from the Spanish Ministry of Economy and
Competitiveness (MINECO); PROMETEO/2012/007
and 2015/000, ACOMP/2013/093 and ACIF/2013/
064 from Generalitat Valenciana; CIBER (CB12/03/
these infections provoke a sanitary additional cost around 1.5 billion euro in the EU [5]. Only
two families of new antibiotics (lipopeptides and oxazolidinones) have reached clinic practice
in the last 40 years [5]. Given that fact, the actual therapeutic arsenal is clearly insufficient and
there is an urgent need for new treatments for these infections, in particular agents that sup-
press or abrogate the emergence of drug resistance.
Plant compounds are a potential source of new antimicrobial molecules against a range
of different pathogens. Nevertheless, the complexity of plant metabolites and the difficulty to
isolate pure compounds makes it challenging to extrapolate the results of the antimicrobial
screening studies. Currently, several plant polyphenolic compounds have demonstrated broad
spectrum antimicrobial biological activity [6–8]. In this work, four species of Cistus genus (Cis-tus ladanifer, Cistus clusii, Cistus albidus and Cistus salviifolius) and four other plant species
(Hypoxis rooperi, Hibiscus sabdariffa, Hibiscus arnottianus and Lippia citriodora) have been
selected for antimicrobial studies based on previous studies performed in our lab and ethnobo-
tanical knowledge.
The antimicrobial activity of extracts derived from Cistaceae against both Gram positive
and Gram negative bacteria has been reported [9–11]. Among them, Cistus salviifolius aqueous
extract, which mostly contains ellagitannins and flavonoids, was reported to be particularly
potent [11, 12]. The strong antimicrobial activity of the polyphenolic extract from Cistus salvii-folius against S. aureus has been related with the synergic pharmacological interaction between
ellagitannins and flavonols [13]. The antimicrobial activity of Hypoxis rooperi extract have also
been related to its polyphenolic content [14]. On the other hand, the antimicrobial activity of
Lippia citriodora has also been studied especially against Gram positive bacteria [15–17]. How-
ever, data about antimicrobial activity of white roselle (Hibiscus arnottianus) has not been pub-
lished so far.
The microplate AlamarBlue assay (MABA) is a sensitive, rapid, inexpensive, and nonra-
diometric method, which evaluates metabolic function and cellular health and offers the
potential for screening large numbers of antimicrobial compounds. MABA has offered sev-
eral advantages compared to other radiometric methods for high-throughput screening
[18] or for MIC50 determination [19]. MABA major advantage is that growth can be evalu-
ated fluorometrically or spectrophotometrically or visually [19], the last without the use of
specialized equipment.
The aim of the present study was to apply MABA to screen for antimicrobial activity of ten
different plant extracts and to correlate it with colony forming units (CFU/mL) measurement.
In addition, the composition of the main polyphenolic constituents of the plant extracts was
determined by using high performance liquid chromatography coupled to electrospray ioniza-
tion and ion trap tandem mass spectrometry (HPLC-ESI-IT-MS/MS) in order to identify the
main compounds of those extracts showing the highest activity against three different microor-
ganisms. The study was performed using a total of ten plant extracts and three clinically relevant
strains, Gram negative (Escherichia coli) and Gram-positive bacteria (Staphylococcus aureus)and the diploid fungus Candida albicans. With this method kinetics information about the
inhibitory effects of the different extracts on the microbial growth was obtained.
Material and Methods
Plant collection, extraction and fractionation
The Cistus species were selected based on our previous expertise on these plants [11]. Cistusplant material was obtained from natural reservations of Ciudad Real (Cistus. ladanifer; Puerto
Llano, 38˚41’18.6"N 4˚01’26.9"W), Valencia (Cistus clusii, Parque Natural Sierra Calderona, 39˚
41’31.5"N 0˚28’52.7"W) and Alicante (Cistus salviifolius, Monovar, 38˚25’22.9"N 0˚49’57.1"W)
Screening for New Antimicrobial Compounds using a HTS Method
PLOS ONE | DOI:10.1371/journal.pone.0169090 December 29, 2016 2 / 18
30038, Fisiopatologia de la Obesidad y la Nutricion,
CIBERobn, Instituto de Salud Carlos III). This is
publication 6186 the NIOO-KNAW. We would like
to state that the funder Invitrotecnia S.L. only
provided support in the form of salaries for author
EBC, but did not have any additional role in the
study design, data collection and analysis, decision
to publish, or preparation of the manuscript.
Competing Interests: We would like to state that
the funder Invitrotecnia S.L. only provided support
in the form of salaries for author EBC. This does
not alter author’s adherence to PLoS ONE policies
on sharing data and materials. We also declare no
competing interest for any of the authors related to
employment, consultancy, patents, products in
development, or marketed products.
provinces (Spain) in early spring, according to flowering time and reserves’ rules and were
extracted as previously reported [9, 11, 12]. Briefly, Cistus plants were extracted with distilled
water at a temperature below 65˚C, with gentle agitation for approximately 2 h and using a
plant–solvent ratio of 1:5. In the case of C. ladanifer, the extract was obtained by direct aqueous
extraction and latter affinity chromatography was performed as previously described [11].
Hibiscus arnottianus specimens were collected from the coast of Granada (37˚06’19.0"N 3˚
33’44.0"W) (Spain) and extracted as reported [20]. Permissions were obtained from local
authorities (Conselleria de Agricultura de la Generalitat Valenciana and Consejerıa de Agricul-
tura de la Comunidad Autonoma de Castilla La Mancha). Cistus species are not in danger and
are not protected according to Spanish legislation. All the other plant materials were obtained
from commercial source. All the plant materials were properly identified and labeled by the
authors and qualified personnel and deposited in the Universidad Miguel Hernandez facilities
(refs. CS30082013, CC30082013, CL30082013, CA30082013 and HA30082013). Lippia citrio-dora extracts PLX10 and PLX32 (containing 10 and 32% verbascoside w/w respectively) and
Hypooxis rooperi extract (containing 11% w/w polyphenols as measured by Folin-Ciocalteu
assay) were kindly provided by Monteloeder S.L. Hibiscus sabdariffa extract (containing 6%
w/w polyphenols by Folin-Ciocalteu) was provided by Nutrafur S.L. The polyphenolic enriched
extract of H. sabdariffa was obtained as described [20].
HPLC–DAD–MS/MS
The composition of the extracts that were not previously characterized was analyzed by
HPLC-DAD-ESI-MS/MS technique with an Agilent LC 1100 series (Agilent Technologies,
Inc., Palo Alto, CA, USA) controlled by the Chemstation software and equipped with a pump,
autosampler, column oven and UV–vis diode array detector. The HPLC instrument was cou-
pled to an Esquire 3000+ (Bruker Daltonics, GmbH, Germany) mass spectrometer equipped
with an ESI source and ion-trap mass analyzer, and operated by Esquire control and data anal-
ysis software. A Phenomenex Kinetex 2.6 μm C18, 150×4.6 mm column was used for the sepa-
ration. Detector conditions for DAD and ESI were applied as previously described [12]. The
mobile phases consisted of water:acetonitrile (90:10, v/v) with 1% of formic acid (A) and aceto-
nitrile (B). Gradient started with 5% B, 30%B at 20 min, 90% B at 30 min, 5% B at 35 min and
5 more minutes for re-equilibration. The flow was set to 0.5 mL/min. Identification of the
compounds was made by HPLC-DAD analysis, using Data Analysis Software v3.4 (Bruker
Daltonics) software and comparing the retention time, UV spectra and MS/MS data of the
peaks in the samples with those of authentic standards or data reported in the literature.
Total polyphenolic content
The total polyphenolic content was determined using the Folin–Ciocalteu method [21] with
gallic acid (SIGMA–ALDRICH, Europe) as a standard. The absorbance measurements were
performed using a UV–VIS spectrophotometer (Cecil 2041 2000 Series, UK).
Preculturing of target organisms
Two bacterial target organisms were applied in MABA: (1) Escherichia coli WA321 (DSMZ #
4509) as Gram negative model bacteria and (2) Staphylococcus aureus 533R4 Serovar 3 (DSMZ
# 20 231) as Gram positive model bacteria. To test for antimicrobial activity against yeast-like
microorganisms, the fungi Candida albicans BSMY 212 (DSMZ # 10697) was utilized. The two
bacterial strains E. coli WA321 and S. aureus 533R4 were precultured from -80˚C glycerol
stocks on lysogeny broth according to Bertani (LB) agar plates (10.0 g/L Merck NaCl, 10 g/L
BACTO™ Tryptone, 5 g/L BACTO™ Yeast extract, 20 g/L Merck Agar) [22] and incubated at
Screening for New Antimicrobial Compounds using a HTS Method
PLOS ONE | DOI:10.1371/journal.pone.0169090 December 29, 2016 3 / 18
37˚C for 24 h prior application. C. albicans was precultured from -80˚C glycerol stocks on
YEPD plates (20.0 g/L Merck Dextrose, 20.0 g/L BACTO™ Peptone, 10.0 g/L BACTO™ Yeast
extract, 20 g/L Merck Agar) [22] and incubated at 37˚C for one day prior application. All target
microorganisms used in this study are summarized in Table 1.
Microplate AlamarBlue® assay (MABA)
For the determination of antimicrobial activity of each plant extract, MABAs were performed
[19, 23, 24]. Stock solutions of all extracts at a concentration of 20 mg/mL were freshly pre-
pared on the same day of the S1MABA by re-suspending 200 mg powder of each plant extract
in 10 mL of sterile MQ- water. Solutions were vigorously shaken for 10 min in a vertical shaker
at 350 rpm followed by centrifugation for 10 min at 1,000 x g. After centrifugation the superna-
tant was filter sterilized through a 0.2 μm filter (GE™ Whatman™; Puradisc FP 30 cat# 10 462
200). The sterilized stock solutions were diluted into 5 mL liquid LB or YEPD media to a final
working concentration of 500 μg/mL, 1 mg/mL or 2 mg/mL. The overview of the workflow is
shown in Fig 1.
Table 1. Information about the used strains.
Species Strain
number
Assay function
Candida albicans BSMY 212 DSMZ 10697 Human pathogen model organism for yeast-like
fungi
Escherichia coli WA321 DSMZ 4509 Human pathogen model organism for Gram negative
bacteria
Staphylococcus aureus 533R4
Serovar 3
DSMZ 20231 Human pathogen model organism for Grampositive
bacteria
Target strains utilized in MABA for the detection of antimicrobial activity of the botanical extracts.
doi:10.1371/journal.pone.0169090.t001
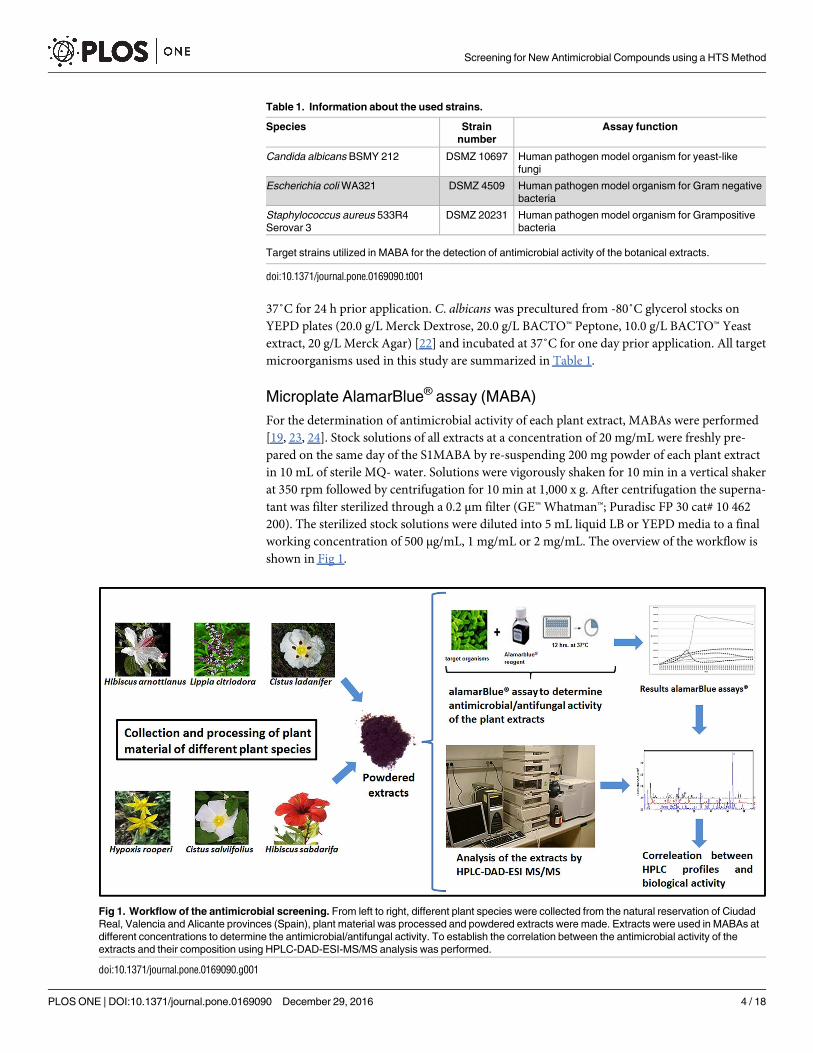
Fig 1. Workflow of the antimicrobial screening. From left to right, different plant species were collected from the natural reservation of Ciudad
Real, Valencia and Alicante provinces (Spain), plant material was processed and powdered extracts were made. Extracts were used in MABAs at
different concentrations to determine the antimicrobial/antifungal activity. To establish the correlation between the antimicrobial activity of the
extracts and their composition using HPLC-DAD-ESI-MS/MS analysis was performed.
doi:10.1371/journal.pone.0169090.g001
Screening for New Antimicrobial Compounds using a HTS Method
PLOS ONE | DOI:10.1371/journal.pone.0169090 December 29, 2016 4 / 18
The growth rates were monitored in the presence of the different extracts and compared
to the growth of the control (the tested microorganism in the absence of antimicrobial
extract). The following antibacterial agents were applied in the positive assay controls:
kanamycin 50 μg/mL, tetracycline 15 μg/mL, (Sigma-Aldrich product # K-4000, T-7660),
ampicillin 50 μg/mL (GIBCO-Life Technologies cat# 11593–027). Delvocid1 (DSM Food
Specialties, The Netherlands) was used as antifungal agent. The AlamarBlue1 dyeing solu-
tion (life technologies™, USA cat# DAL1025) was aliquoted prior every assay and stored at
4˚C. For the measurement of relative fluorescence units (RFU), black 96-well plates (Nunc
Microwell™, Polysorp™ F96 cat# 437112) were prepared by dispensing 200 μl of each treat-
ment mixture containing the extract (at concentrations of either 500 μg/mL, 1 mg/mL or 2
mg/mL, selected on our knowledge on antimicrobial extracts), AlamarBlue1 10% (v/v)
and one of the target microorganisms (E. coli WA321, S. aureus 533R4 or C. albicansBSMY212). The final density of microorganisms was set to an OD600 of 0.002 correspond-
ing to 6.4 x 10⁵ CFU/mL (E. coli WA321), 4.0 x 10⁵ CFU/mL (S. aureus 533R4) or 1.6 x 10⁴
Cells/mL (C. albicans BSMY 212). All extract treatments were measured in 10 replicates and
positive growth controls were measured in 10 replicates. The positive assay controls (micro-
organism plus antibiotics) were measured in triplicates. To normalize the background fluo-
rescence the culture media plus plant extract solution were measured in duplicates. After
each sample was added to the 96 well-plate, the fluorescence measurement was started on a
BioTek Synergy™ HT Multi-Mode Microplate Reader (Beun de Ronde Life Sciences, The
Netherlands) with the following settings: 12 hours of measurement with an interval of 15
minutes, excitation / emission wavelengths of 530 nm and 590 nm respectively. Measure-
ment sensitivity was set to 40 and delay between each sample measurement was set to 50
ms, shaking intensity was set to one and the duration to 300 s before each measurement.
The entire assay was performed at 37˚C for 12 h. For greater clarity in the figures errors
were not represented. Standard deviation values, calculated using Microsoft Excel 2016,
were always below 13.9% for S. aureus, 12.2% for E. coli and 5.5 for C. albicans experiments.
A comparison of the different antimicrobial compounds used as a control is shown in S2
Fig. Only kanamycin was shown in the figure of the antimicrobial capacity of the extracts
for the sake of clarity.
Estimation of the correlation RFU/CFU
To estimate the correlation between Relative Fluorescence Units (RFU) and Colony Forming
Units (CFU) of each target microorganism, MABAs were performed in black 96-well plates
(Nunc Microwell™, Polysorp™ F96 cat# 437112) by inoculating the target microorganisms at
the same concentration as in the antimicrobial screening assays and by using the identical pro-
cedure. MABAs were performed for 6 hours and samples of 100 μL for viable plate counting
were taken every 2 hours (T1 = 2h, T2 = 4h, T3 = 6h). Samples for viable counting were plated
in triplicates either on LB-A or YEPD media plates and incubated at 37˚C overnight. On the
next day the viable colonies were counted and the correlation between relative fluorescence
units (RFU) and colony forming units (CFU) of each microorganism was estimated. The cor-
relation quotient (R2 value) between RFU and CFU was calculated with Microsoft Excel1 and
is shown in S1 Fig for each strain.
Results
Validation of MABA for bacterial growth monitoring
The first step was to validate MABA as an adequate screening method for testing antimicrobial
activity based on bacterial growth monitoring. For this, a correlation between MABA results
Screening for New Antimicrobial Compounds using a HTS Method
PLOS ONE | DOI:10.1371/journal.pone.0169090 December 29, 2016 5 / 18
(expressed in relative fluorescent units, RFU) and the colony forming units (CFU) was per-
formed. A good correlation was obtained for all tested microbial strains with the following R2
values: 0.9823 for C. albicans BSMY 212, 0.9966 for S. aureus 533R4 and 0.9151 for E. coli WA
321 (S1 Fig). Once the method was validated, antimicrobial tests were performed to screen for
extracts with the highest activity among the ten extracts utilized in this study (Table 2). All
extracts were tested at concentration of 2 mg/mL against E. coli, S. aureus and C. albicans. Six
extracts revealing good activity were selected and tested again at lower extract concentration
(1 mg/mL). Finally those extracts that exhibited the strongest antimicrobial activity were
selected and tested at a lower concentration, ~ 500 μg/mL. Table 3 summarizes the plant
extracts selected for each screening steps.
S. aureus microbial growth inhibition. The plant extracts were tested against S. aureus at
a concentration of 2 mg/mL and all extracts exhibited antimicrobial activity at this concentra-
tion compared to the control (Fig 2A). Kinetics and endpoint values differed between most of
the extracts (Fig 2A). The extracts HS, CS, CL, HR, HA and HSP revealed the highest level of
inhibition and were selected for testing at a lower concentration (1 mg/mL). In this second
test, although all extracts were still active, strong kinetic differences between extracts was
observed (Fig 2B). Despite the HS, HA and HR extracts showed consistent and important
growth rate at 5 hours of incubation, i.e. within the bacterial growth log phase, very low end-
point values were observed after 12 hours of incubation, indicating that longer times were
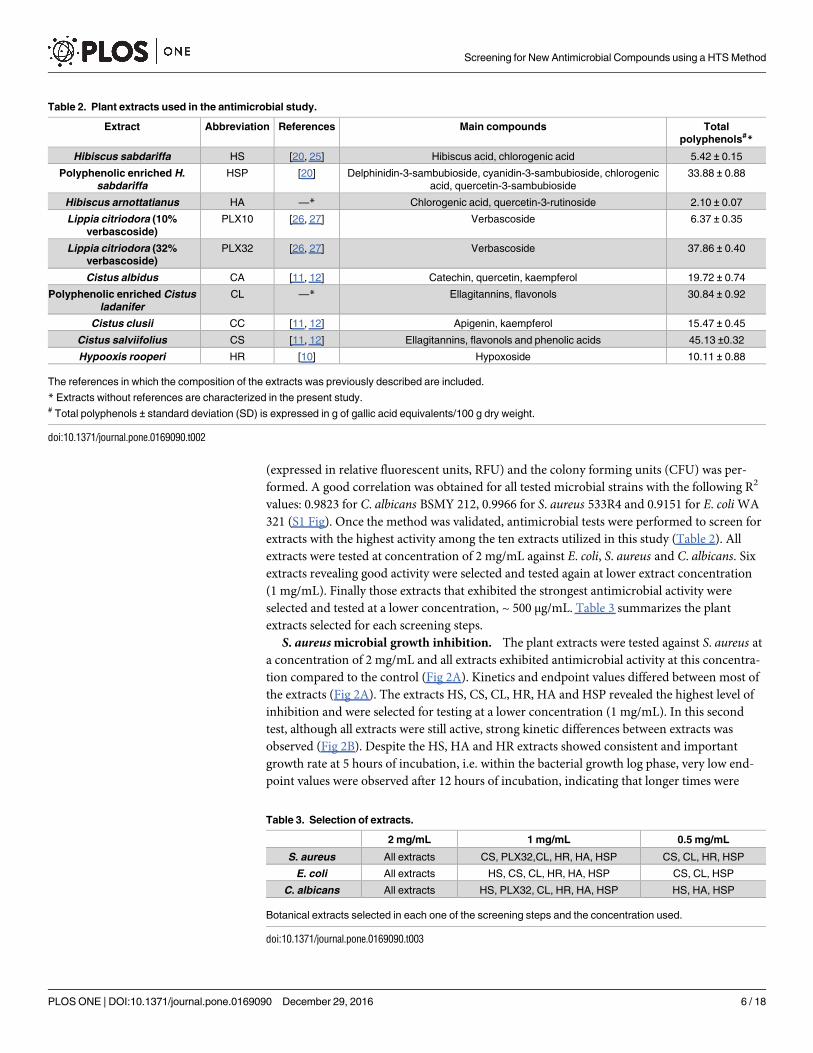
Table 2. Plant extracts used in the antimicrobial study.
Extract Abbreviation References Main compounds Total
polyphenols#*
Hibiscus sabdariffa HS [20, 25] Hibiscus acid, chlorogenic acid 5.42 ± 0.15
Polyphenolic enriched H.
sabdariffa
HSP [20] Delphinidin-3-sambubioside, cyanidin-3-sambubioside, chlorogenic
acid, quercetin-3-sambubioside
33.88 ± 0.88
Hibiscus arnottatianus HA —* Chlorogenic acid, quercetin-3-rutinoside 2.10 ± 0.07
Lippia citriodora (10%
verbascoside)
PLX10 [26, 27] Verbascoside 6.37 ± 0.35
Lippia citriodora (32%
verbascoside)
PLX32 [26, 27] Verbascoside 37.86 ± 0.40
Cistus albidus CA [11, 12] Catechin, quercetin, kaempferol 19.72 ± 0.74
Polyphenolic enriched Cistus
ladanifer
CL —* Ellagitannins, flavonols 30.84 ± 0.92
Cistus clusii CC [11, 12] Apigenin, kaempferol 15.47 ± 0.45
Cistus salviifolius CS [11, 12] Ellagitannins, flavonols and phenolic acids 45.13 ±0.32
Hypooxis rooperi HR [10] Hypoxoside 10.11 ± 0.88
The references in which the composition of the extracts was previously described are included.
* Extracts without references are characterized in the present study.# Total polyphenols ± standard deviation (SD) is expressed in g of gallic acid equivalents/100 g dry weight.
doi:10.1371/journal.pone.0169090.t002
Table 3. Selection of extracts.
2 mg/mL 1 mg/mL 0.5 mg/mL
S. aureus All extracts CS, PLX32,CL, HR, HA, HSP CS, CL, HR, HSP
E. coli All extracts HS, CS, CL, HR, HA, HSP CS, CL, HSP
C. albicans All extracts HS, PLX32, CL, HR, HA, HSP HS, HA, HSP
Botanical extracts selected in each one of the screening steps and the concentration used.
doi:10.1371/journal.pone.0169090.t003
Screening for New Antimicrobial Compounds using a HTS Method
PLOS ONE | DOI:10.1371/journal.pone.0169090 December 29, 2016 6 / 18
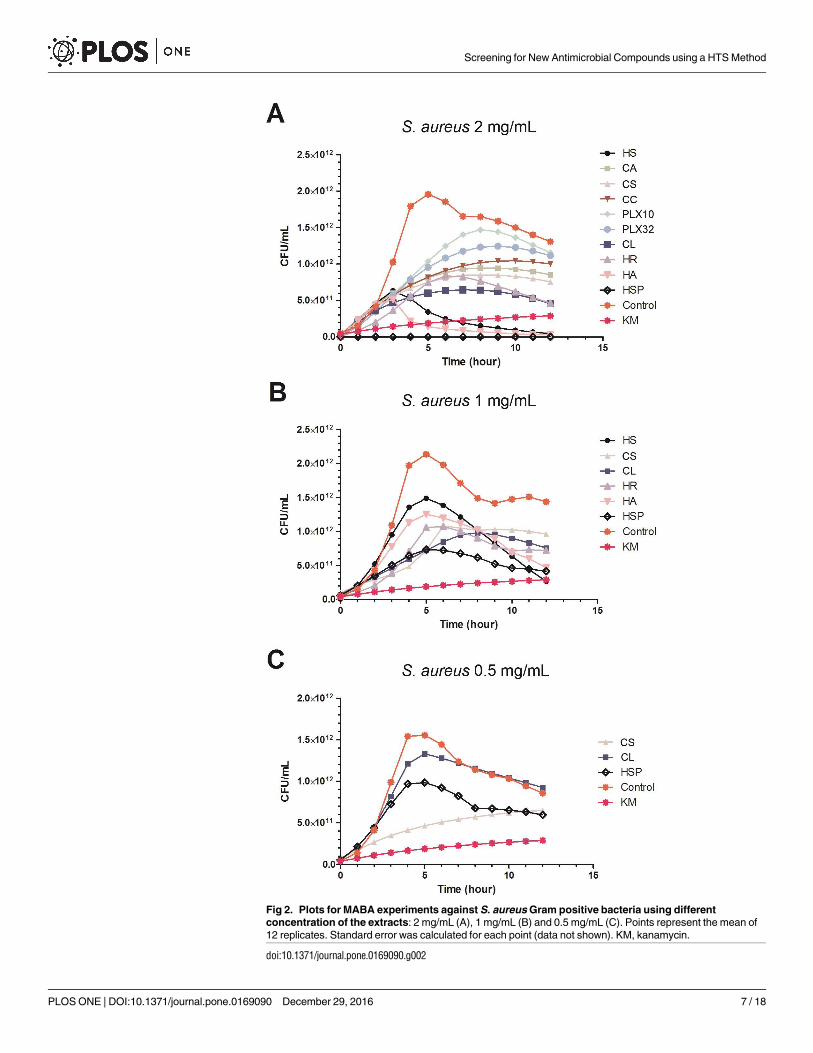
Fig 2. Plots for MABA experiments against S. aureus Gram positive bacteria using different
concentration of the extracts: 2 mg/mL (A), 1 mg/mL (B) and 0.5 mg/mL (C). Points represent the mean of
12 replicates. Standard error was calculated for each point (data not shown). KM, kanamycin.
doi:10.1371/journal.pone.0169090.g002
Screening for New Antimicrobial Compounds using a HTS Method
PLOS ONE | DOI:10.1371/journal.pone.0169090 December 29, 2016 7 / 18
required to observe inhibition of microbial growth. These extracts were not selected since their
growth inhibitory activity was only shown at nutrient depletion phase. Consequently, we only
selected extracts CS, CL and HSP for the last screening step against S. aureus (Fig 2C) due to
their potent effect on the microbial growth at the log phase. CL extract seemed to lose its anti-
microbial activity at this concentration, however, HSP and CS retained activity. Only CS
extract showed a significant growth inhibitory activity within the exponential growth phase of
S. aureus. For the HSP extract more than 6 hours were needed to inhibit bacterial growth.
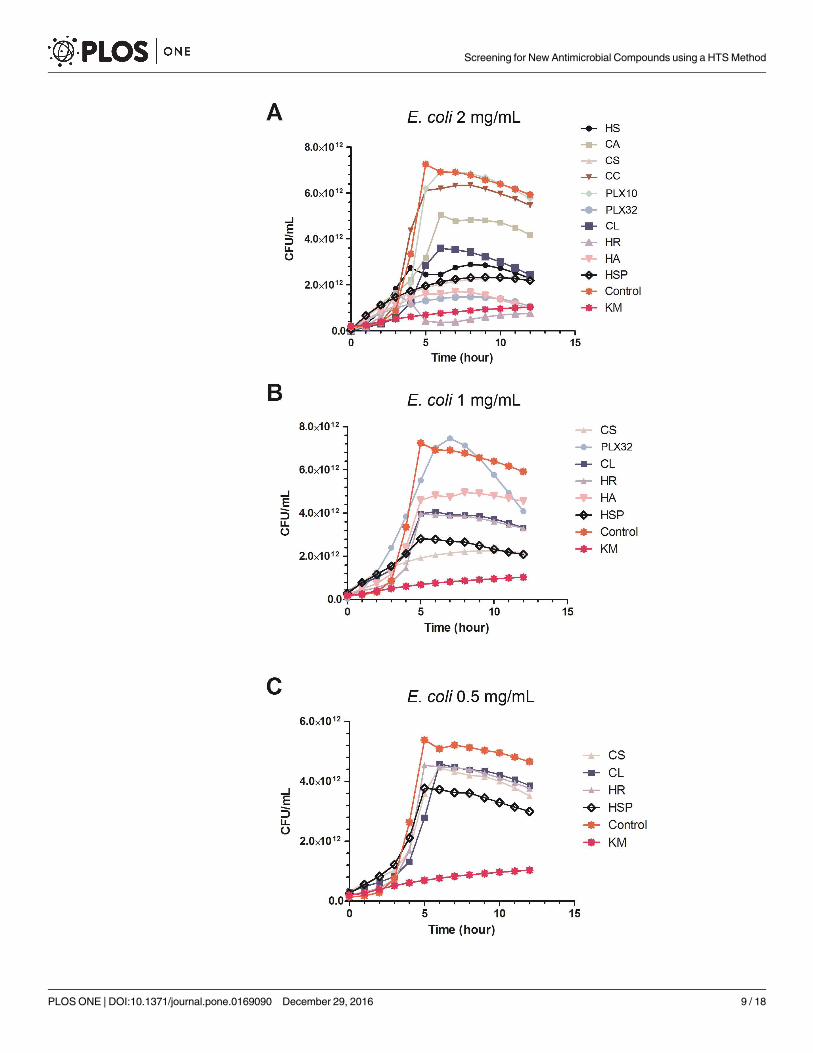
E. coli microbial growth inhibition. Fig 3A shows the growth inhibition of E. coli by all
the extracts tested at concentration of 2 mg/mL. The extracts CA, CC and PLX10 revealed very
low activity and were discarded for further tests. The other six extracts were tested again at a
concentration of 1 mg/mL (Fig 3B). PLX32 extract lose its antimicrobial activity at this concen-
tration whereas HR and CL retained some of its growth inhibitory activity. On the contrary,
CS and HSP showed strong inhibitory activity even within the log phase. Therefore these four
extracts were selected for the next step. At 0.5 mg/mL, the four selected extracts showed similar
kinetic behavior but only HSP exhibited significant inhibitory activity compared to the control
(Fig 3C).
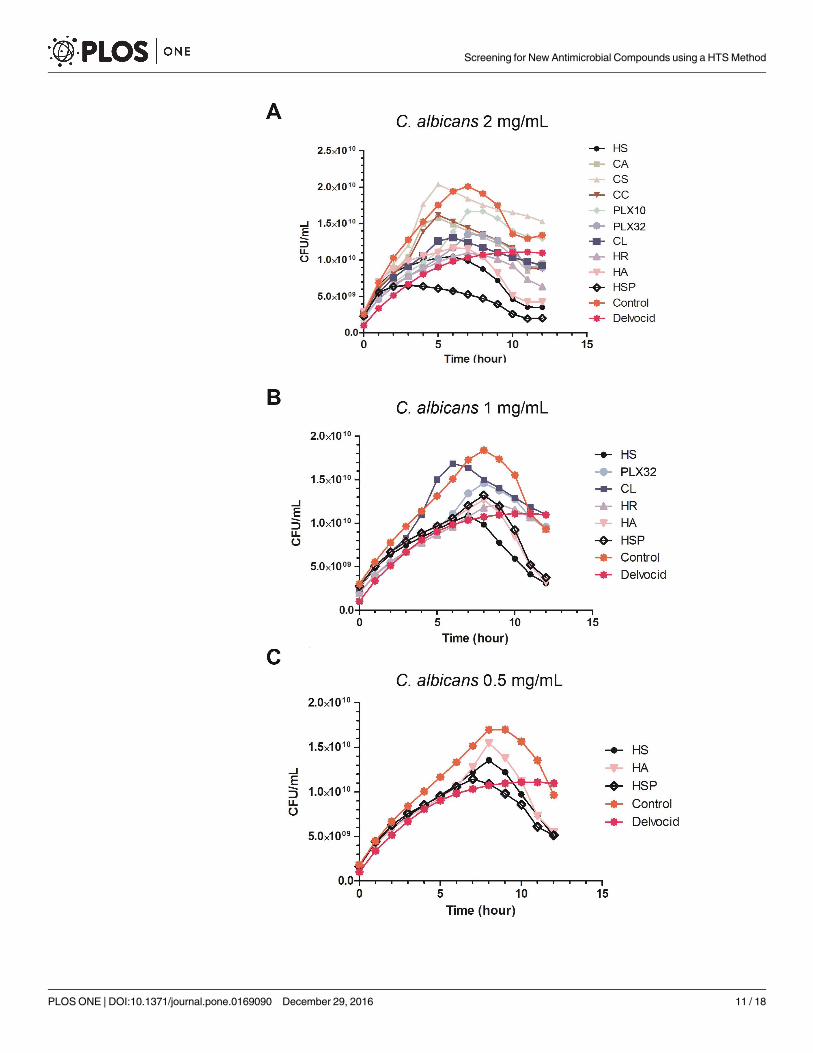
C. albicans microbial growth inhibition. Fig 4 shows the results for the inhibitory capac-
ity of the extracts against C. albicans. The extracts HSP, HS, HR, HA, PLX32 and CL showed a
significant inhibitory activity at 2 mg/ml compared to the control without inhibitory agent
(Fig 4A). Some of the plant extracts, i.e. HS, HA and HSP revealed higher activity than the pos-
itive control with the antifungal DelvoCid1. When tested at a concentration of 1 mg/mL (Fig
4B), the extracts HA, HS and HSP still retained a good inhibitory activity against yeast growth.
However, a significant temporal delay was detected when compared with first test at a concen-
tration of 2 mg/mL. At 2 mg/mL, extracts started to reduce viability after 5 hours approxi-
mately, but this effect was observed after 7 hours when tested at 1 mg/mL (Fig 4B). HA, HS
and HSP extracts were selected for testing at 0.5 mg/mL concentration (Fig 4C). Although all
three extracts still exhibited strong activity on cell viability in the nutrient depletion phase,
only HSP retained a similar activity than that shown by the positive control, i.e DelvoCid1 a
known yeast and molds inhibitor composed of natamycin.
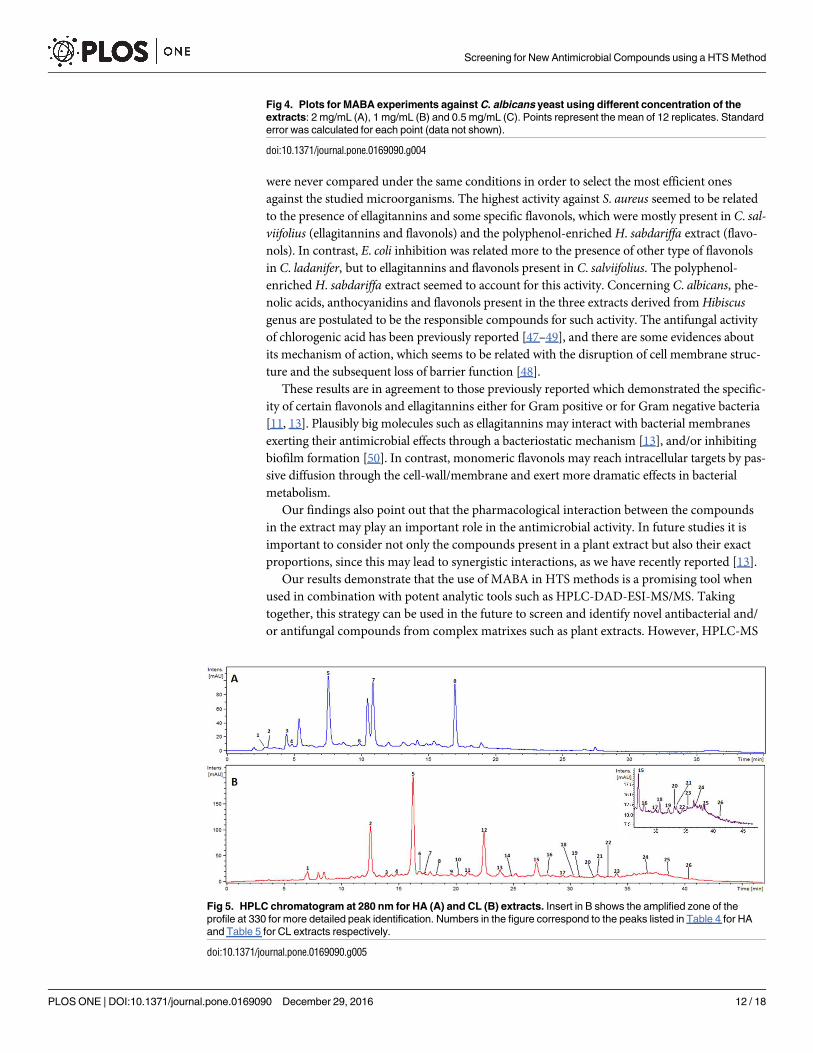
Characterization of the extracts by HPLC-DAD-ESI-IT-MS/MS analysis
The polyphenolic composition of extracts HA and CL, which had not been previously charac-
terized, was analyzed by HPLC-DAD-ESI-IT-MS/MS. HPLC profiles for these two extracts
showing the main identified compounds are presented in Fig 5. A total of six compounds were
tentatively identified by their mass spectra data in HA extract (Table 4), but two significantly
abundant compounds could not be identified. The analysis of CL extract exhibited a total of 23
identified compounds and 3 more remained as unknown (Table 5). We have previously ana-
lyzed and reported the composition of the extracts derived from Cistus species (C. ladaniferand C. salviifolius) and Hibiscus sabdariffa in detail [11, 12, 20, 25]. The composition of Lippiacitriodora and Hypoxis rooperi extracts has also been the subject of comprehensive studies
reported by our group [14, 26, 27]. Information about the extracts is summarized in Table 2.
Correlation between HPLC analysis and antimicrobial activity
After the antimicrobial screening phase and the analysis of main polyphenolic compounds, all
the data were analyzed in order to find a potential correlation between the presence of individ-
ual compounds and the activity against the tested microorganisms. For S. aureus, two (CS and
CL) of the three most active extracts were enriched in ellagitannins and flavonols. Both families
have demonstrated their antibacterial activity previously [9, 39]. The third one was HSP,
Screening for New Antimicrobial Compounds using a HTS Method
PLOS ONE | DOI:10.1371/journal.pone.0169090 December 29, 2016 8 / 18
Screening for New Antimicrobial Compounds using a HTS Method
PLOS ONE | DOI:10.1371/journal.pone.0169090 December 29, 2016 9 / 18
which is a polyphenolic enriched extract of H. sabdariffa with a high polyphenolic content
(28.42 ± 0.33 of gallic acid equivalents/100 g of dry weight) and with an important content in
anthocyanidins as delphinidin and cyanindin sambubiosides and significant amounts of flavo-
nols such as glycosylated quercetin and kaempferol derivatives. Both families, anthocyanidins
[40, 41] and flavonols [8, 11, 42, 43], have demonstrated their activity against Gram positive
bacteria previously. A recent study has proven the synergic antimicrobial effect between flavo-
nols, ellagitannins and between flavonols and ellagitannins against S. aureus [13]. Therefore,
these compounds may account for the stronger effect observed for CS, CL and HSP extracts.
Anyhow, the presence of unknown or unidentified compounds could also contribute for such
effect.
Ellagitannins and flavonols seem to be also related with E. coli antimicrobial activity, since
CS and CL were also selected as the most active extracts against this microorganism. HSP was
also very active, and exhibited the lowest endpoint value at 0.5 mg/mL (Fig 3C) so anthocyani-
dins and glycosylated flavonols also accounted for the antimicrobial activity against E. coli as
occurred in S. aureus.Finally, the antifungal activity against C. albicans seemed to be strongly related with the
presence of either phenolic acids such as chlorogenic acid in the extracts (HA and HS) and the
presence of anthocyanidins and flavonols (HS, HA and HSP).
Discussion
Plants are undoubtedly one of the most promising sources for natural compounds with impor-
tant biological activities. There are many examples of plant-derived molecules and plant
extracts with activity against different microorganisms [6, 8, 43, 44]. Most of them are well
chemically characterized but their mechanism of action remains unknown. However, in order
to search for new antimicrobial drugs bearing wide spectrum antibacterial and antifungal
activity, the development of fast and inexpensive methods that reduce time and costs for novel
drug discovery is still required.
The main finding of the present work is the development of a fast, cheap and reliable
method to screen antimicrobial activity of plant extracts against three different model micro-
organisms, both Gram positive and Gram negative, and yeast. This approach may be consid-
ered as a fast and inexpensive High Throughput Screening (HTS) method that can be applied
in industries and laboratories. HTS methods are very demanded especially for pharmaceutical
industries as they need fast methods to scrutinize hundreds of new molecules from synthetic
or natural origin. The MABA method has been previously utilized for high-throughput screen-
ing of antimicrobial agents [18, 45] or for MIC50 determination in a variety of microorgan-
isms as in [19, 23, 24], but suitability must be determined for each application and cell model
[46]. Therefore, the present study provides additional information on the correlation between
AlamarBlue1 fluorescence results and CFU/mL data and validate this method for growth
inhibitory tests of three different microorganisms such as S. aureus, E. coli and C. albicans,models for Gram positive, Gram negative and yeast respectively.
In the present study, ten plant extracts derived from different Mediterranean plants were
analyzed for antimicrobial activities using MABA. The extracts belonged to very different
plant families with different chemical composition (Table 2), as confirmed by HPLC-MS anal-
ysis. Some of these extracts have exhibited their antimicrobial activity previously, but they
Fig 3. Plots for MABA experiments against E.coli Gram negative bacteria using different concentration
of the extracts: 2 mg/mL (A), 1 mg/mL (B) and 0.5 mg/mL (C). Points represent the mean of 12 replicates.
Standard error was calculated for each point (data not shown). KM, kanamycin.
doi:10.1371/journal.pone.0169090.g003
Screening for New Antimicrobial Compounds using a HTS Method
PLOS ONE | DOI:10.1371/journal.pone.0169090 December 29, 2016 10 / 18
Screening for New Antimicrobial Compounds using a HTS Method
PLOS ONE | DOI:10.1371/journal.pone.0169090 December 29, 2016 11 / 18
were never compared under the same conditions in order to select the most efficient ones
against the studied microorganisms. The highest activity against S. aureus seemed to be related
to the presence of ellagitannins and some specific flavonols, which were mostly present in C. sal-viifolius (ellagitannins and flavonols) and the polyphenol-enriched H. sabdariffa extract (flavo-
nols). In contrast, E. coli inhibition was related more to the presence of other type of flavonols
in C. ladanifer, but to ellagitannins and flavonols present in C. salviifolius. The polyphenol-
enriched H. sabdariffa extract seemed to account for this activity. Concerning C. albicans, phe-
nolic acids, anthocyanidins and flavonols present in the three extracts derived from Hibiscusgenus are postulated to be the responsible compounds for such activity. The antifungal activity
of chlorogenic acid has been previously reported [47–49], and there are some evidences about
its mechanism of action, which seems to be related with the disruption of cell membrane struc-
ture and the subsequent loss of barrier function [48].
These results are in agreement to those previously reported which demonstrated the specific-
ity of certain flavonols and ellagitannins either for Gram positive or for Gram negative bacteria
[11, 13]. Plausibly big molecules such as ellagitannins may interact with bacterial membranes
exerting their antimicrobial effects through a bacteriostatic mechanism [13], and/or inhibiting
biofilm formation [50]. In contrast, monomeric flavonols may reach intracellular targets by pas-
sive diffusion through the cell-wall/membrane and exert more dramatic effects in bacterial
metabolism.
Our findings also point out that the pharmacological interaction between the compounds
in the extract may play an important role in the antimicrobial activity. In future studies it is
important to consider not only the compounds present in a plant extract but also their exact
proportions, since this may lead to synergistic interactions, as we have recently reported [13].
Our results demonstrate that the use of MABA in HTS methods is a promising tool when
used in combination with potent analytic tools such as HPLC-DAD-ESI-MS/MS. Taking
together, this strategy can be used in the future to screen and identify novel antibacterial and/
or antifungal compounds from complex matrixes such as plant extracts. However, HPLC-MS
Fig 4. Plots for MABA experiments against C. albicans yeast using different concentration of the
extracts: 2 mg/mL (A), 1 mg/mL (B) and 0.5 mg/mL (C). Points represent the mean of 12 replicates. Standard
error was calculated for each point (data not shown).
doi:10.1371/journal.pone.0169090.g004
Fig 5. HPLC chromatogram at 280 nm for HA (A) and CL (B) extracts. Insert in B shows the amplified zone of the
profile at 330 for more detailed peak identification. Numbers in the figure correspond to the peaks listed in Table 4 for HA
and Table 5 for CL extracts respectively.
doi:10.1371/journal.pone.0169090.g005
Screening for New Antimicrobial Compounds using a HTS Method
PLOS ONE | DOI:10.1371/journal.pone.0169090 December 29, 2016 12 / 18
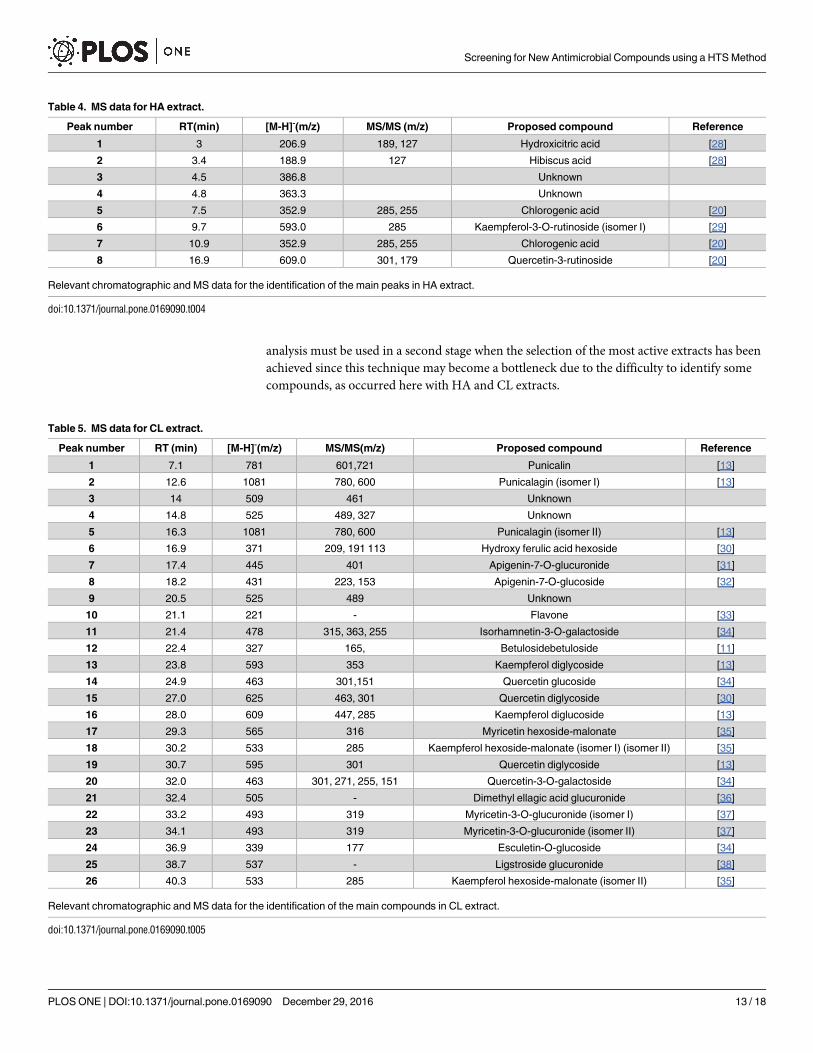
analysis must be used in a second stage when the selection of the most active extracts has been
achieved since this technique may become a bottleneck due to the difficulty to identify some
compounds, as occurred here with HA and CL extracts.
Table 4. MS data for HA extract.
Peak number RT(min) [M-H]-(m/z) MS/MS (m/z) Proposed compound Reference
1 3 206.9 189, 127 Hydroxicitric acid [28]
2 3.4 188.9 127 Hibiscus acid [28]
3 4.5 386.8 Unknown
4 4.8 363.3 Unknown
5 7.5 352.9 285, 255 Chlorogenic acid [20]
6 9.7 593.0 285 Kaempferol-3-O-rutinoside (isomer I) [29]
7 10.9 352.9 285, 255 Chlorogenic acid [20]
8 16.9 609.0 301, 179 Quercetin-3-rutinoside [20]
Relevant chromatographic and MS data for the identification of the main peaks in HA extract.
doi:10.1371/journal.pone.0169090.t004
Table 5. MS data for CL extract.
Peak number RT (min) [M-H]-(m/z) MS/MS(m/z) Proposed compound Reference
1 7.1 781 601,721 Punicalin [13]
2 12.6 1081 780, 600 Punicalagin (isomer I) [13]
3 14 509 461 Unknown
4 14.8 525 489, 327 Unknown
5 16.3 1081 780, 600 Punicalagin (isomer II) [13]
6 16.9 371 209, 191 113 Hydroxy ferulic acid hexoside [30]
7 17.4 445 401 Apigenin-7-O-glucuronide [31]
8 18.2 431 223, 153 Apigenin-7-O-glucoside [32]
9 20.5 525 489 Unknown
10 21.1 221 - Flavone [33]
11 21.4 478 315, 363, 255 Isorhamnetin-3-O-galactoside [34]
12 22.4 327 165, Betulosidebetuloside [11]
13 23.8 593 353 Kaempferol diglycoside [13]
14 24.9 463 301,151 Quercetin glucoside [34]
15 27.0 625 463, 301 Quercetin diglycoside [30]
16 28.0 609 447, 285 Kaempferol diglucoside [13]
17 29.3 565 316 Myricetin hexoside-malonate [35]
18 30.2 533 285 Kaempferol hexoside-malonate (isomer I) (isomer II) [35]
19 30.7 595 301 Quercetin diglycoside [13]
20 32.0 463 301, 271, 255, 151 Quercetin-3-O-galactoside [34]
21 32.4 505 - Dimethyl ellagic acid glucuronide [36]
22 33.2 493 319 Myricetin-3-O-glucuronide (isomer I) [37]
23 34.1 493 319 Myricetin-3-O-glucuronide (isomer II) [37]
24 36.9 339 177 Esculetin-O-glucoside [34]
25 38.7 537 - Ligstroside glucuronide [38]
26 40.3 533 285 Kaempferol hexoside-malonate (isomer II) [35]
Relevant chromatographic and MS data for the identification of the main compounds in CL extract.
doi:10.1371/journal.pone.0169090.t005
Screening for New Antimicrobial Compounds using a HTS Method
PLOS ONE | DOI:10.1371/journal.pone.0169090 December 29, 2016 13 / 18
In conclusion, the MABA described here can be successfully used to screen for antimicro-
bial activity of complex plant extracts. The results point out compound-specificity related to
the antimicrobial activity against bacteria and fungi. Extracts enriched in ellagitannins and fla-
vonols reveled promising antibacterial activity agents both against Gram positive and Gram
negative bacteria. Phenolic acids, anthocyanidins and flavonols are plausibly more related to
the antifungal activity.
Further research should be directed to discover the mechanism of action of the plant
extracts studied here as well as to explore possible synergistic effect of these plant extracts with
the existing antibiotics. In addition to their pharmacological use, plant extracts may have inter-
esting applications in cosmetics and food industry. The increase of green chemistry and ecol-
ogy has promoted the interest of consumers in products with no artificial additives. The use of
natural compounds as an alternative to chemistry-based preservatives and antioxidants is cur-
rently in the portfolio of most cosmetics or food industries.
Conclusions or Highlights
• AlamarBlue1 can be used in HTS methods to screen for antimicrobial activity of botanical
extracts.
• Extracts enriched in ellagitannins and flavonols are promising antibacterial agents both
against Gram positive and Gram negative bacteria.
• Phenolic acids, anthocyanidins and flavonols may be related with the antifungal activity.
• The complementary antimicrobial activity between extracts derived from Hibiscus and Cis-
tus genus deserves further research.
• The combination of MABA and HPLC-DAD-ESI-MS/MS allows to perform structure-activ-
ity correlations for natural antimicrobial compounds.
Supporting Information
S1 Fig. Correlation between the relative fluorescence units (RFU) and colony forming
units (CFU). A: correlation between RFU and CFU for the Gram negative target-organism E.
coli WA321, B: correlation between RFU and CFU for the Gram positive target organism S.
aureus 533R4, C: correlation between RFU and CFU for the yeast-like fungi C. albicans.(TIF)
S2 Fig. Additional controls for MABA in S. aureus (A), E.coli (B) and C. albicans (C). The
following antibacterial agents were applied in the positive assay controls: kanamycin (KM)
50 μg/mL, tetracycline (TC) 15 μg/mL, (Sigma-Aldrich product # K-4000, T-7660), ampicillin
(AMPC) 50 μg/mL(GIBCO-Life Technologies cat# 11593–027). Delvocid1 (DSM Food Spe-
cialties, The Netherlands) was used as antifungal agent and Cycloheximide and Thiobendazole
in this case 200 mg/mL Cycloheximide or Delvocide were used, Thiobendazole was tested at a
concentration of 25 mg/mL.
(TIF)
Acknowledgments
This work was supported by projects AGL2011-29857-C03-03 and AGL2015-67995-C3-1-R
from Spanish Ministry of Science and Innovation; Torres Quevedo grant PTQ-14-07243 from
Screening for New Antimicrobial Compounds using a HTS Method
PLOS ONE | DOI:10.1371/journal.pone.0169090 December 29, 2016 14 / 18
the Spanish Ministry of Economy and Competitiveness (MINECO); PROMETEO/2012/007,
PROMETEO/2016/006, ACOMP/2013/093 and ACIF/2013/064 from Generalitat Valenciana;
CIBER (CB12/03/30038, Fisiopatologia de la Obesidad y la Nutricion, CIBERobn, Instituto de
Salud Carlos III). This is publication 6186 from the NIOO-KNAW.
Author Contributions
Conceptualization: OT LTM PG EBC VM.
Formal analysis: LT OT.
Funding acquisition: VM PG.
Investigation: OT LTM.
Methodology: OT EBC PG VM.
Project administration: EBC.
Resources: VM PG.
Supervision: PG VM.
Validation: OT LTM EBC PG VM.
Writing – original draft: EBC LTM OT.
Writing – review & editing: OT PG EBC VM.
References1. Crisostomo MI, Westh H, Tomasz A, Chung M, Oliveira DC, De Lencastre H. The evolution of methicillin
resistance in Staphylococcus aureus: Similarity of genetic backgrounds in historically early methicillin-
susceptible and -resistant isolates and contemporary epidemic clones. Proc Natl Acad Sci U S A. 2001;
98(17):9865–70. doi: 10.1073/pnas.161272898 PMID: 11481426
2. Economou V, Gousia P, Kansouzidou A, Sakkas H, Karanis P, Papadopoulou C. Prevalence, antimi-
crobial resistance and relation to indicator and pathogenic microorganisms of Salmonella enterica iso-
lated from surface waters within an agricultural landscape. International J Hyg Env Health. 2013; 216
(4):435–44.
3. Tenover FC, Biddle JW, Lancaster MV. Increasing resistance to vancomycin and other glycopeptides in
Staphylococcus aureus. Emerg Infect Dis. 2001; 7(2):327–32. doi: 10.3201/eid0702.700327 PMID:
11294734
4. Taylor PW. Alternative natural sources for a new generation of antibacterial agents. Int J Antimicrob
Agents. 2013; 42(3): 195–201. doi: 10.1016/j.ijantimicag.2013.05.004 PMID: 23796893
5. ECDC/EMEA Joint technical report. The bacterial challenge: time to react. A call to narrow the gap
between multidrug-resistant bacteria in the EU and the development of new antibacterial agents. 2009.
6. Rıos JL, Recio MC. Medicinal plants and antimicrobial activity. J Ethnopharmacol. 2005; 100(1–2):80–
4. doi: 10.1016/j.jep.2005.04.025 PMID: 15964727
7. Iscan G, Kirimer N, Kurkcuoglu M, Baser KH, Demirci F. Antimicrobial screening of Mentha piperita
essential oils. J Agric Food Chem. 2002; 50(14):3943–6. PMID: 12083863
8. Mukhopadhyay K, Whitmire W, Xiong YQ, Molden J, Jones T, Peschel A, et al. In vitro susceptibility of
Staphylococcus aureus to thrombin-induced platelet microbicidal protein-1 (tPMP-1) is influenced by
cell membrane phospholipid composition and asymmetry. Microbiology. 2007; 153(Pt 4):1187–97. doi:
10.1099/mic.0.2006/003111-0 PMID: 17379728
9. Barrajon-Catalan E, Fernandez-Arroyo S, Saura D, Guillen E, Fernandez-Gutierrez A, Segura-Carre-
tero A, et al. Cistaceae aqueous extracts containing ellagitannins show antioxidant and antimicrobial
capacity, and cytotoxic activity against human cancer cells. Food Chem Toxicol. 2010; 48(8–9):2273–
82. doi: 10.1016/j.fct.2010.05.060 PMID: 20510328
10. Bedoya LM, Bermejo P, Abad MJ. Anti-infectious activity in the Cistaceae family in the Iberian Penin-
sula. Mini Rev Med Chem. 2009; 9(5):519–25. PMID: 19456283
Screening for New Antimicrobial Compounds using a HTS Method
PLOS ONE | DOI:10.1371/journal.pone.0169090 December 29, 2016 15 / 18
11. Tomas-Menor L, Morales-Soto A, Barrajon-Catalan E, Roldan-Segura C, Segura-Carretero A, Micol V.
Correlation between the antibacterial activity and the composition of extracts derived from various
Spanish Cistus species. Food Chem Toxicol. 2013; 55:313–22. doi: 10.1016/j.fct.2013.01.006 PMID:
23333717
12. Barrajon-Catalan E, Fernandez-Arroyo S, Roldan C, Guillen E, Saura D, Segura-Carretero A, et al. A
systematic study of the polyphenolic composition of aqueous extracts deriving from several Cistus
genus species: evolutionary relationship. Phytochem Anal. 2011; 22(4):303–12. doi: 10.1002/pca.1281
PMID: 21259376
13. Tomas-Menor L, Barrajon-Catalan E, Segura-Carretero A, Martı N, Saura D, Menendez JA, et al. The
promiscuous and synergic molecular interaction of polyphenols in bactericidal activity: An opportunity to
improve the performance of antibiotics? Phytother Res. 2015; 29(3):466–73. doi: 10.1002/ptr.5296
PMID: 25625775
14. Laporta O, Perez-Fons L., Mallavia R., Caturla N., Micol V. Isolation, characterization and antioxidant
capacity assessment of the bioactive compounds derived from Hypoxis rooperi corm extract (African
potato). Food Chem 2007; 101 (4):1425–37.
15. Mothana RAA, Abdo SAA, Hasson S, Althawab FMN, Alaghbari SAZ, Lindequist U. Antimicrobial, anti-
oxidant and cytotoxic activities and phytochemical screening of some yemeni medicinal plants. Evid-
Based Compl. Alt. 2010; 7(3):323–30.
16. Giner MJ, Vegara S, Funes L, Martı N, Saura D, Micol V, et al. Antimicrobial activity of food-compatible
plant extracts and chitosan against naturally occurring micro-organisms in tomato juice. J Sci Food
Agric. 2012; 92(9):1917–23. doi: 10.1002/jsfa.5561 PMID: 22246685
17. Kumar NK, Kumar KS, Raman BV, Reddy IB, Ramarao M, Rajagopal SV. Antibacterial activity of Lippia
citriodora a folklore plant. J Pure Ap Microbiol. 2008; 2(1):249–52.
18. Franzblau SG, Witzig RS, McLaughlin JC, Torres P, Madico G, Hernandez A, et al. Rapid, Low-Tech-
nology MIC Determination with clinical Mycobacterium tuberculosis Isolates by using the microplate
Alamar Blue assay. J Clin Microbiol. 1998; 36(2):362–6. PMID: 9466742
19. Collins L, Franzblau SG. Microplate alamar blue assay versus BACTEC 460 system for high-throughput
screening of compounds against Mycobacterium tuberculosis and Mycobacterium avium. Antimicrob
Agents Chemother. 1997; 41(5):1004–9. PMID: 9145860
20. Herranz-Lopez M, Fernandez-Arroyo S, Perez-Sanchez A, Barrajon-Catalan E, Beltran-Debon R,
Menendez JA, et al. Synergism of plant-derived polyphenols in adipogenesis: perspectives and implica-
tions. Phytomedicine. 2012; 19(3–4):253–61. doi: 10.1016/j.phymed.2011.12.001 PMID: 22280831
21. Huang D, Boxin OU, Prior RL. The chemistry behind antioxidant capacity assays. J Agric Food Chem.
2005; 53(6):1841–56. doi: 10.1021/jf030723c PMID: 15769103
22. Sambrook JaDWR. Molecular cloning: a laboratory manual Cold spring harbor laboratory press.; 2001.
23. Vanitha JD, Paramasivan CN. Evaluation of microplate Alamar blue assay for drug susceptibility testing
of Mycobacterium avium complex isolates. Diagn Microbiol Infect Dis. 2004; 49(3):179–82. doi: 10.
1016/j.diagmicrobio.2004.04.003 PMID: 15246507
24. Khot PD, Suci PA, Tyler BJ. Candida albicans viability after exposure to amphotericin B: Assessment
using metabolic assays and colony forming units. J Microbiol Methods. 2008; 72(3):268–74. doi: 10.
1016/j.mimet.2007.12.005 PMID: 18234380
25. Fernandez-Arroyo S, Rodriguez-Medina IC, Beltran-Debon R, Pasini F, Joven J, Micol V, et al. Quantifi-
cation of the polyphenolic fraction and in vitro antioxidant and in vivo anti-hyperlipemic activities of Hibis-
cus sabdariffa aqueous extract. Food Res Int. 2011; 44(5):1490–5.
26. Quirantes-Pine R, Funes L, Micol V, Segura-Carretero A, Fernandez-Gutierrez A. High-performance
liquid chromatography with diode array detection coupled to electrospray time-of-flight and ion-trap tan-
dem mass spectrometry to identify phenolic compounds from a lemon verbena extract. J Chromatogr A.
2009; 1216(28):5391–7. doi: 10.1016/j.chroma.2009.05.038 PMID: 19500792
27. Funes L, Laporta O, Cerdan-Calero M, Micol V. Effects of verbascoside, a phenylpropanoid glycoside
from lemon verbena, on phospholipid model membranes. Chem Phys Lipids. 2010; 163(2):190–9. doi:
10.1016/j.chemphyslip.2009.11.004 PMID: 19925782
28. Rodrıguez-Medina IC, Beltran-Debon R, Molina VM, Alonso-Villaverde C, Joven J, Menendez JA, et al.
Direct characterization of aqueous extract of Hibiscus sabdariffa using HPLC with diode array detection
coupled to ESI and ion trap MS. J Sep Sci. 2009; 32(20):3441–8. doi: 10.1002/jssc.200900298 PMID:
19750503
29. Milbury PE, Chen CY, Dolnikowski GG, Blumberg JB. Determination of flavonoids and phenolics and
their distribution in almonds. J AgricFood Chem. 2006; 54(14):5027–33.
Screening for New Antimicrobial Compounds using a HTS Method
PLOS ONE | DOI:10.1371/journal.pone.0169090 December 29, 2016 16 / 18
30. Simirgiotis MJ, Caligari PDS, Schmeda-Hirschmann G. Identification of phenolic compounds from the
fruits of the mountain papaya Vasconcellea pubescens A. DC. grown in Chile by liquid chromatography-
UV detection-mass spectrometry. Food Chem. 2009; 115(2):775–84.
31. Schutz K, Kammerer D, Carle R, Schieber A. Identification and quantification of caffeoylquinic acids
and flavonoids from artichoke (Cynara scolymus L.) heads, juice, and pomace by HPLC-DAD-ESI/
MSn. J. Agric.Food Chem. 2004; 52(13):4090–6. doi: 10.1021/jf049625x PMID: 15212452
32. Lin L-Z, Harnly JM. Identification of the phenolic components of chrysanthemum flower (Chrysanthe-
mum morifolium Ramat). Food Chem. 2010; 120(1):319–26.
33. Fabre N, Rustan I, De Hoffmann E, Quetin-Leclercq J. Determination of flavone, flavonol, and flavanone
aglycones by negative ion liquid chromatography electrospray ion trap mass spectrometry. J Am Soc
Mass Spectrom. 2001; 12(6):707–15. doi: 10.1016/S1044-0305(01)00226-4 PMID: 11401161
34. Parejo I, Jauregui O, Sanchez-Rabaneda F, Viladomat F, Bastida J, Codina C. Separation and charac-
terization of phenolic compounds in Fennel (Foeniculum vulgare) using liquid chromatography
−negative electrospray ionization tandem mass spectrometry. J AgricFood Chem. 2004; 52(12):3679–
87.
35. Maatta KR, Kamal-Eldin A, Riitta Torronen A. High-Performance Liquid Chromatography (HPLC) analy-
sis of phenolic compounds in berries with diode array and electrospray ionization mass spectrometric
(MS) detection: Ribes species. J Agric Food Chem. 2003; 51(23):6736–44. doi: 10.1021/jf0347517
PMID: 14582969
36. Ma JY, Zhou X, Fu J, He CY, Feng R, Huang M, et al. In vivo metabolite profiling of a purified ellagitan-
nin isolated from Polygonum capitatum in rats. Molecules. 2016; 21(9).
37. Figueiredo-Gonzalez M, Martınez-Carballo E, Cancho-Grande B, Santiago JL, Martınez MC, Simal-
Gandara J. Pattern recognition of three Vitis vinifera L. red grapes varieties based on anthocyanin and
flavonol profiles, with correlations between their biosynthesis pathways. Food Chem. 2012; 130(1):9–
19.
38. Quirantes-Pine R, Zurek G, Barrajon-Catalan E, Bassmann C, Micol V, Segura-Carretero A, et al. A
metabolite-profiling approach to assess the uptake and metabolism of phenolic compounds from olive
leaves in SKBR3 cells by HPLC-ESI-QTOF-MS. J Pharm Biomed Anal. 2012; 72:121–6. doi: 10.1016/j.
jpba.2012.09.029 PMID: 23146235
39. Lopez-Garcia F, Micol V, Villalain J, Gomez-Fernandez JC. Interaction of sphingosine and stearylamine
with phosphatidylserine as studied by DSC and NMR. Biochim Biophys Acta. 1993; 1153(1):1–8. PMID:
8241241
40. Jung E, Kim Y, Joo N. Physicochemical properties and antimicrobial activity of Roselle (Hibiscus sab-
dariffa L.). J Sci Food Agric. 2013; 93(15):3769–76. doi: 10.1002/jsfa.6256 PMID: 23749748
41. Leitão DPS, Polizello ACM, Ito IY, Spadaro ACC. Antibacterial screening of anthocyanic and proantho-
cyanic fractions from cranberry juice. J Med Food. 2005; 8(1):36–40. doi: 10.1089/jmf.2005.8.36 PMID:
15857207
42. Stermitz FR, Scriven LN, Tegos G, Lewis K. Two flavonols from Artemisa annua which potentiate the
activity of berberine and norfloxacin against a resistant strain of Staphylococcus aureus. Planta Med.
2002; 68(12):1140–1. doi: 10.1055/s-2002-36347 PMID: 12494348
43. Daglia M. Polyphenols as antimicrobial agents. Curr Opin Biotechnol. 2012; 23(2):174–81. doi: 10.
1016/j.copbio.2011.08.007 PMID: 21925860
44. Cowan MM. Plant products as antimicrobial agents. Clin Microbiol Rev. 1999; 12(4):564–82. PMID:
10515903
45. Ymele-Leki P, Cao S, Sharp J, Lambert KG, McAdam AJ, Husson RN, et al. A high-throughput screen
identifies a new natural product with broad-spectrum antibacterial activity. PLoS ONE. 2012; 7(2):
e31307. doi: 10.1371/journal.pone.0031307 PMID: 22359585
46. Rampersad SN. Multiple applications of alamar blue as an indicator of metabolic function and cellular
health in cell viability bioassays. Sensors (Switzerland). 2012; 12(9):12347–60.
47. Lee JH, Park JH, Kim YS, Han Y. Chlorogenic acid, a polyphenolic compound, treats mice with septic
arthritis caused by Candida albicans. Int Immunopharmacol. 2008; 8(12):1681–5. doi: 10.1016/j.intimp.
2008.08.002 PMID: 18760384
48. Sung WS, Lee DG. Antifungal action of chlorogenic acid against pathogenic fungi, mediated by mem-
brane disruption. Pure Appl Chem. 2010; 82(1):219–26.
49. Boligon AA, Kubica TF, Mario DN, de Brum TF, Piana M, Weiblen R, et al. Antimicrobial and antiviral
activity-guided fractionation from Scutia buxifolia Reissek extracts. Acta Physiol Plant. 2013; 35
(7):2229–39.
Screening for New Antimicrobial Compounds using a HTS Method
PLOS ONE | DOI:10.1371/journal.pone.0169090 December 29, 2016 17 / 18
50. Trentin DS, Silva DB, Amaral MW, Zimmer KR, Silva MV, Lopes NP, et al. Tannins possessing bacterio-
static effect impair Pseudomonas aeruginosa adhesion and biofilm formation. PLoS ONE. 2013; 8(6):
e66257. doi: 10.1371/journal.pone.0066257 PMID: 23776646
Screening for New Antimicrobial Compounds using a HTS Method
PLOS ONE | DOI:10.1371/journal.pone.0169090 December 29, 2016 18 / 18