use of soybean products in diets fed to swine hans h. stein university of illinois
TRANSCRIPT

Use of Soybean Products in Diets fed to Swine
Hans H. Stein
University of Illinoishttp://nutrition.ansci.illinois.edu

2
Outline • Composition of soybeans
• New varieties of soybeans
• Effect of soybean oil on the digestibility of AA
• Fermented and enzymatically treated soybean meal in diets for weanling pigs
• Soybean meal (SBM) in the US and other countries
• Effect of particle size of SBM on AA and energy digestibility
Composition of Soybeans

4
Soybeans and Soybean Meal
Soybeans
Moisture,% 10.0
Minerals,% 5.0
Fat, % 18.0
Protein, % 37.0
Sugar, o-sacch., % 13.5
Fiber, % 16.5
SBM, not
de-hulled
10.0
6.8
3.0
43.2
15.5
21.5
SBM, de-hulled
10.0
7.5
3.0
47.5
16.5
15.5

5
Sugar and Oligosaccharides• Free sugars: 4.5%• Sucrose: 4.5%• Galacto-oligosaccharides: 4.5%
• Raffinose 0.6%• Stachyose 3.7%• Verbascose 0.2%

6
Effect of StachyoseWeanling pigs, 21 d post-weaning
0
0.05
0.1
0.15
0.2
0.25
0.3
0.35
0.4
0.45
ADG, kg ADFI, kg
Control
1% Stach.
2% Stach.a b c
Liying et al., 2003

7
Effect of StachyoseWeanling pigs, 21 d post-weaning
0
0.5
1
1.5
2
2.5
3
3.5
F:G Diarrhea, %
Control
1% Stach.
2% Stach.a b c
Liying et al., 2003

8
Soybeans with no Oligosaccharides
• Select soybeans with low concentration of oligosaccharides
• Remove genes for oligosaccharides• Remove oligosaccharides after crushing
When oligosaccharides are removed, the concentration of sugar and protein is usually increased.

9
New Varieties of SoybeansConv. SB HP SB LO SB SBM
Water,% 10.0 10.0 10.0 10.0
Min.,% 5.0 5.0 5.0 7.5
Fat, % 18.0 15.0 19.0 3.0
Protein, % 37.0 45.0 39.5 47.5
Oligosac., % 4.5 3.5 1.0 5.5
Sucrose, % 4.5 3.5 6.5 5.5
Sugar, % 4.5 3.5 4.5 5.5
Fiber, % 16.5 14.5 16.5 15.5

10
Amino acid and energy digesitibility
in HP and LO soybean meal
Baker and Stein, 2009

11
Soybean Meals• Solvent extracted
– HP SBM
– Conv. SBM
• Extruded-expelled
– EE HP SBM
– EE LO SBM
– EE conv. SBM

12
Soy Ileal AA Digestibility

13
SID for Lys, %
88
89
90
91
92
93
94
Lys %
HP SBMConv. SBMEE HP SBMEE LO SBMEE Conv. SBM
x, y: P < 0.05
x x y y x
Baker and Stein, 2009

14
SID for Met, %
86
87
88
89
90
91
92
93
Met %
HP SBMConv. SBMEE HP SBMEE LO SBMEE Conv. SBM
x, y, z: P < 0.05
x xy z z yz
Baker and Stein, 2009

15
SID for Thr, %
83
84
85
86
87
88
89
Thr %
HP SBMConv. SBMEE HP SBMEE LO SBMEE Conv. SBM
x, y: P < 0.05
x xyyx
Baker and Stein, 2009

16
Conc. of Digestible AA in HP and Conv. SBMTotal Conc. Digestible conc.
Conv. SBM HP SBM Conv. SBM HP SBM
CP 48.4% 55.7% 423 g 492 g
Lys 3.20% 3.51% 28.8 g 31.6 g
Met 0.70% 0.78% 6.25 g 6.91 g
Thr 1.86% 2.09% 15.9 g 17.8 g
Trp 0.69% 0.75% 6.5 g 6.7 gBaker and Stein, 2009

17
Metabolizable
Energy

18
Metabolizable Energy
3,300
3,400
3,500
3,600
3,700
3,800
3,900
4,000
4,100
ME kcal/kg DM
HP SBMConv. SBMEE HP SBMEE LO SBMEE Conv. SBMCorn
x, y: P < 0.05
y xyxxyx
Baker and Stein, 2009
Effect of Soybean Oil on Amino Acid
Digestibility
Cervantes-Pahm and Stein, 2008

20
Diets• HP FFSB• Conv. FFSB• Conv. SBM • Conv. SBM + 7.5% soybean oil• SPC • SPC + 7.5% soybean oil

21
SID of Lys
93.0 92.5
87.7
90.6
93.2
97.9
85
95percent
HP-FFSB Conv. FFSB SBM SBM + oil SPC SPC + oil
Cervantes-Pahm and Stein, 2008
y y
x
xy
y
z
y
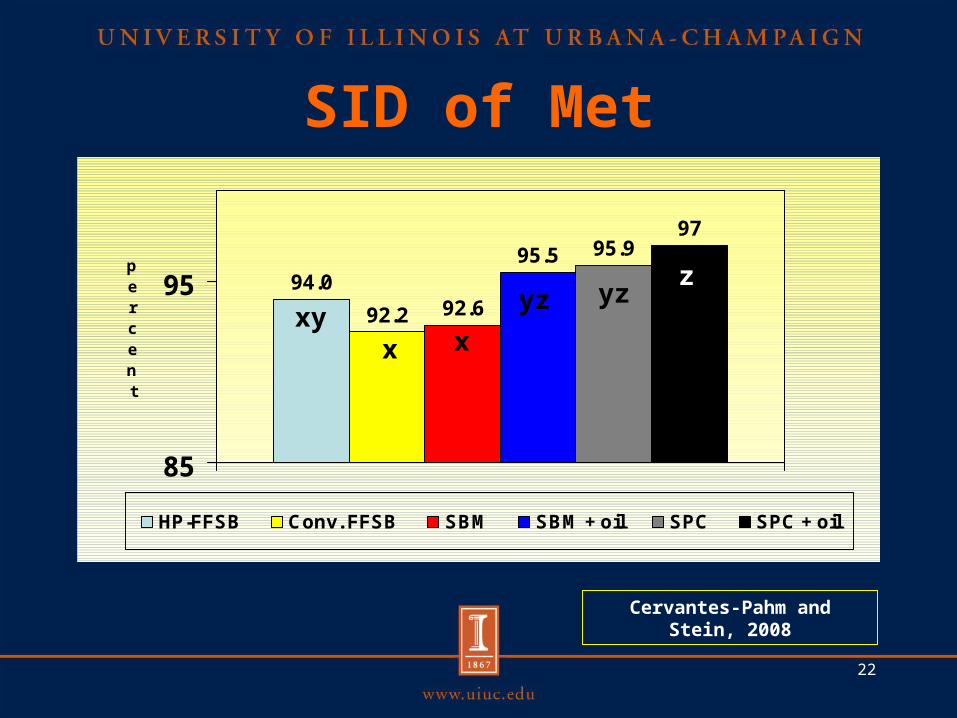
22
SID of Met
94.0
92.2 92.6
95.5 95.997
85
95percent
HP-FFSB Conv. FFSB SBM SBM + oil SPC SPC + oil
xyyz
z
x x
yz
Cervantes-Pahm and Stein, 2008

23
SID of Thr
87.686.4
83.6
86.1
89.491.2
75
85
95
percent
HP-FFSB Conv. FFSB SBM SBM + oil SPC SPC + oil
yxy
z
xyx
yz
Cervantes-Pahm and Stein, 2008
24
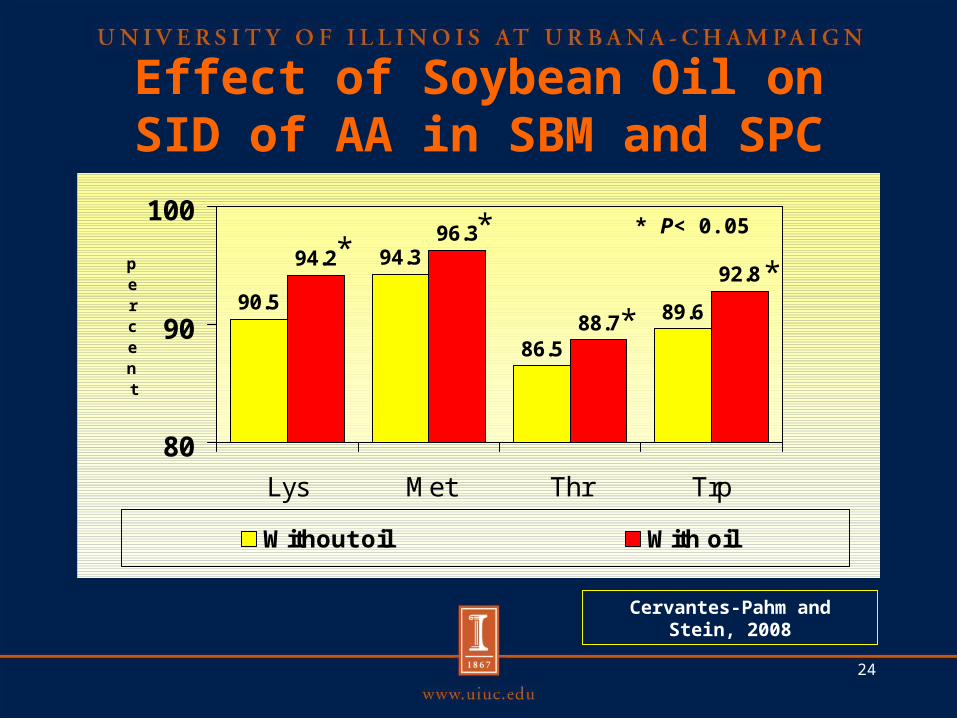
Effect of Soybean Oil on SID of AA in SBM and SPC
90.5
94.3
86.5
89.6
94.296.3
88.7
92.8
80
90
100
Lys Met Thr Trp
percent
Without oil With oil
* P< 0.05*
*
*
*
Cervantes-Pahm and Stein, 2008

Removal of Oligosaccharides via Fermentation or
Enzymatic Hydrolysis
Cervantes–Pahm and Stein, 2010

26
Fermentation of SBM • Addition of bacteria and fermentation (Fx. Aspergillus
Oryzae and Bacillus subtillis)– PepSoyGen– Reduced size of proteins– Reduced concentration of oligosaccharides– Probiotic effect– Reduced concentration of antigenic substances
Treatment of SBM with enzymes (and fermentation)– HP 300 – Reduced concentration af antigenic substances

27
Size of Proteins
0
5
10
15
20
25
30
35
40
45
>60 kDa 20-60 kDa <20 kDa
Conv. SBM
HP 300
PepSoyGen
Cervantes-Pahm and Stein, 2010

28
Sucrose and Oligosaccharides
0
1
2
3
4
5
6
7
8
9
Sucrose Stachyose Raffinose
Conv. SBM
HP 300
PepSoyGen
Cervantes-Pahm and Stein, 2010

29
Protein Concentration (%)
40
42
44
46
48
50
52
54
Protein
Conv. SBM
HP 300
PepSoyGen
Cervantes-Pahm and Stein, 2010

30
AA Digestibility (%)Measured in weanling pigs (10-25 kg).
65
70
75
80
85
90
95
Lys Met Thr Trp
Conv. SBM
HP 300
PepSoyGen
ab b a ba ab
Cervantes-Pahm and Stein, 2010

Growth Performance Studies with PepSoyGen
Experiment 1

33
Diets, Day 0-14SBM Fish meal PepSoyGen
Corn, % 41.2 43.8 40.8
Whey, % 20.0 20.0 20.0
Plasma, % 4.0 4.0 4.0
Soybean meal, % 30.0 23.0 23.0
Fish meal, % 0 7.0 0
PepSoyGen, % 0 0 7.0
Peters and Stein, 2006

34
Diets, Day 15-35Item Sojaskrå Fiskemel PepSoyGen
Corn, % 64.9 67.6 65.0
SBM, % 30.0 23.0 23.0
Fish meal, % 0 7.0 0
PepSoyGen, % 0 0 7.0
Peters and Stein, 2006
35
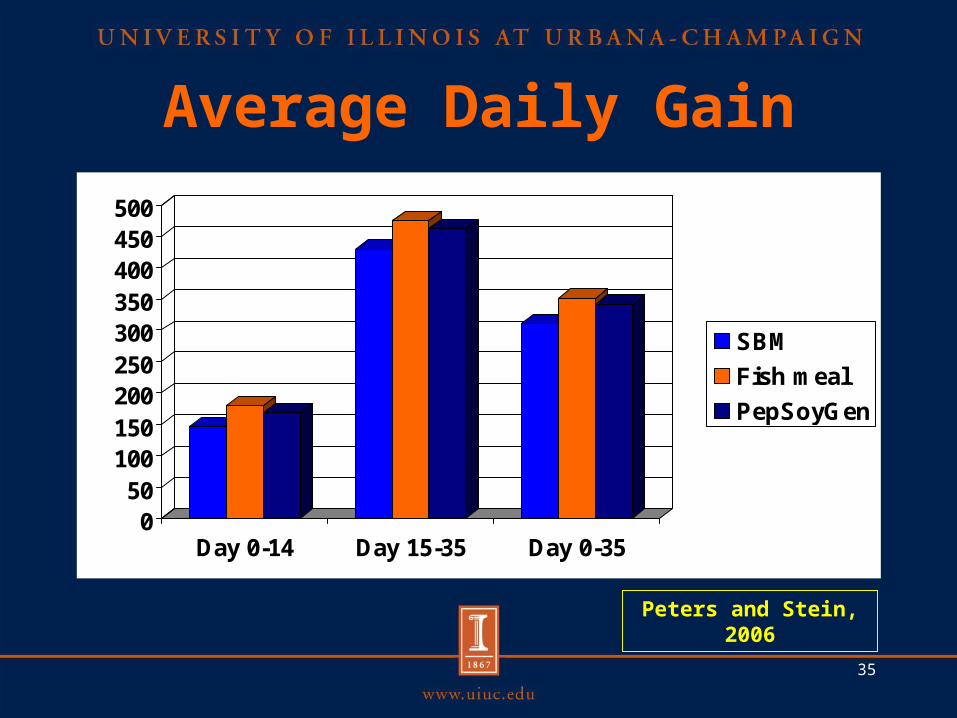
Average Daily Gain
050
100150200250300350400450500
Day 0-14 Day 15-35 Day 0-35
SBM
Fish meal
PepSoyGen
Peters and Stein, 2006

36
Feed:Gain
0
0.2
0.4
0.6
0.8
1
1.2
1.4
1.6
1.8
Day 0-14 Day 15-35 Day 0-35
SBM
Fish meal
PepSoyGen
Peters and Stein, 2006

Experiment 2
38
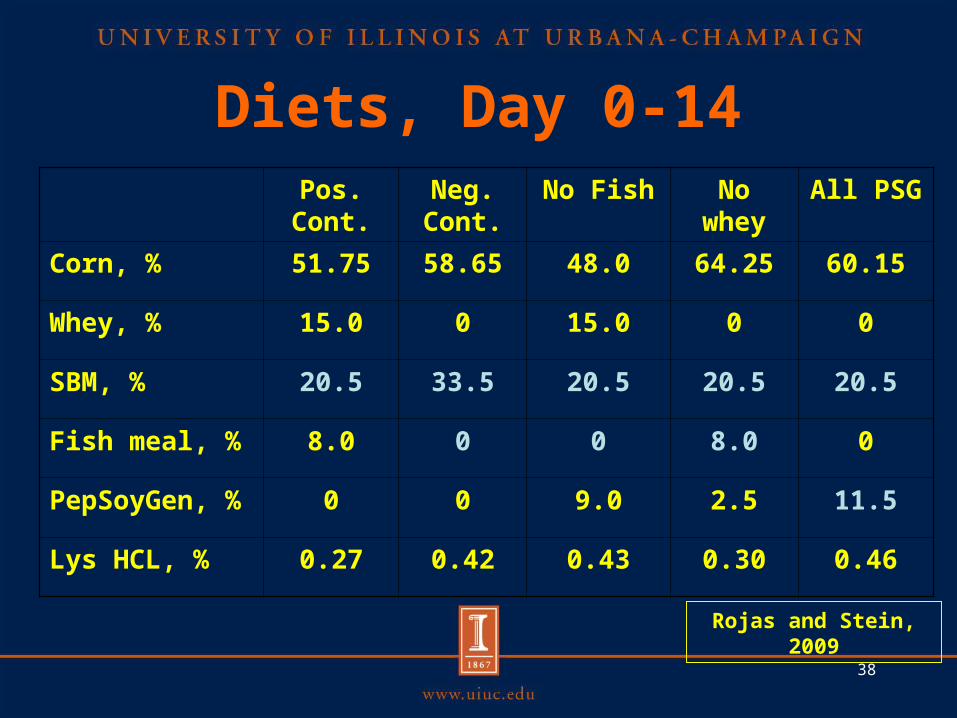
Diets, Day 0-14Pos. Cont.
Neg. Cont.
No Fish No whey
All PSG
Corn, % 51.75 58.65 48.0 64.25 60.15
Whey, % 15.0 0 15.0 0 0
SBM, % 20.5 33.5 20.5 20.5 20.5
Fish meal, % 8.0 0 0 8.0 0
PepSoyGen, % 0 0 9.0 2.5 11.5
Lys HCL, % 0.27 0.42 0.43 0.30 0.46
Rojas and Stein, 2009

39
Common phase 2 diet, d. 15-35
Item %
Corn, % 63.33
SBM, % 29.0
Fish meal, % 0
PepSoyGen, % 0
Whey, % 0
Lys HCL, % 0.36
Rojas and Stein, 2009
40
Average Daily Gain
0
100
200
300
400
500
600
700
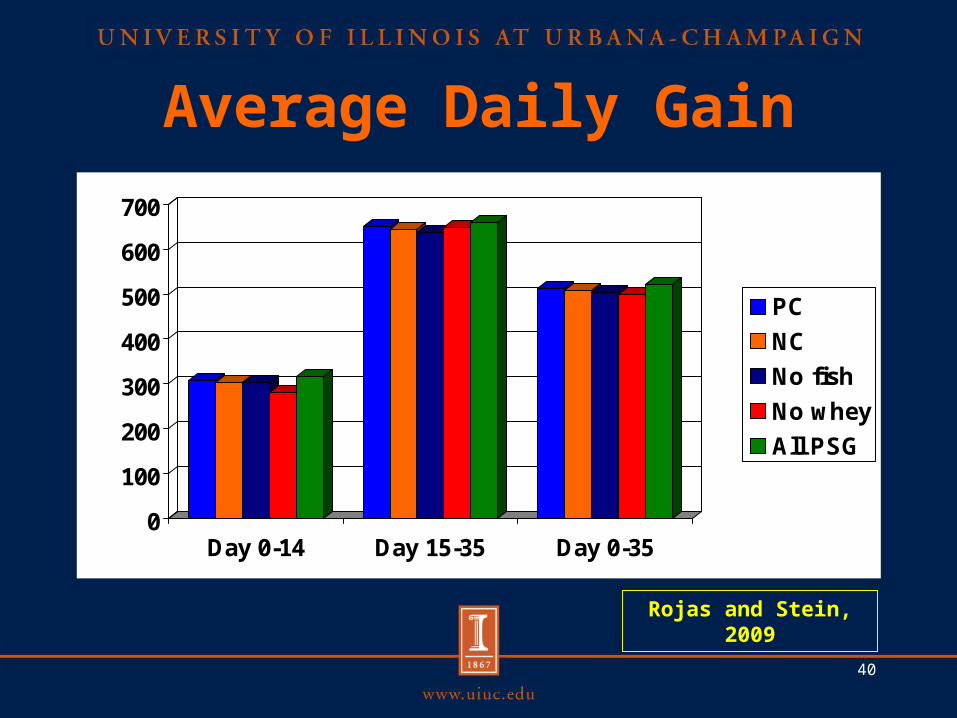
Day 0-14 Day 15-35 Day 0-35
PC
NC
No fish
No whey
All PSG
Rojas and Stein, 2009
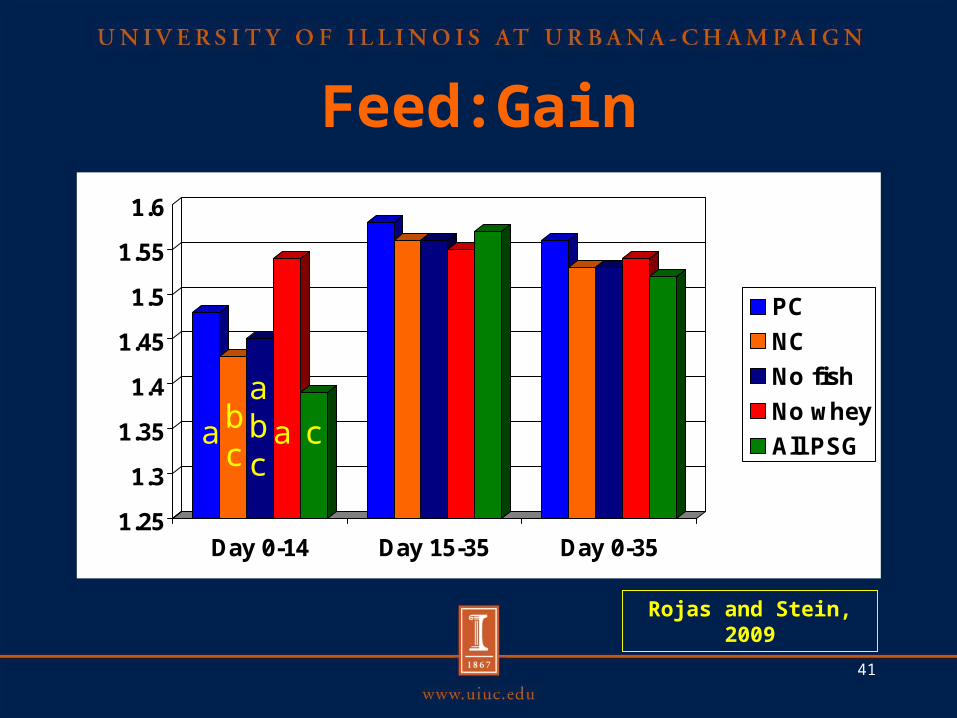
41
Feed:Gain
1.25
1.3
1.35
1.4
1.45
1.5
1.55
1.6
Day 0-14 Day 15-35 Day 0-35
PC
NC
No fish
No whey
All PSG
Rojas and Stein, 2009
a bc
abca c

Digestibility of P and Energy in enzyme treated SBM
Goebel and Stein, 2010
42

43
ATTD of P
0
10
20
30
40
50
60
70
80
90
No phytase 500 FTU
HP 310
HP 340
SBM
Goebel and Stein, 2010
a b a abba

ME, kcal/kg DM
3650
3700
3750
3800
3850
3900
3950
4000
ME
HP 200
HP 310
SBM
Corn
Goebel and Stein, 2010
Soybean Meal in the US and other Countries

46
52.853.6
52.8 52.27 52.8
45
50
55
60
percent
NRC US Argentina Brazil India
Concentration of CP (%DM)
Illini Sand, 2008

47
3.36
2.06
3.34
1.85
3.20
1.95
3.26
1.99
3.39
2.06
1.5
2.5
3.5
Lys Thr
percent
NRC US Argentina Brazil India
Concentration of AA (%DM)
Illini Sand, 2008

48
0.74 0.720.80
0.720.720.790.73
0.80.76 0.81
0
0.5
1
1.5
Met Trp
percent
NRC US Argentina Brazil India
Concentration of AA (%DM)
Illini Sand, 2008

49
90.087.0
90.3
86.486.3 86.2
80.0
75.6
88.2
81.5
70
80
90
100
Lys Thr
percent
NRC US Argentina Brazil India
Standardized Ileal Digestibility
Illini Sand, 2008

50
91.090.0
92.491.591.1
89.5
86.6
84.3
89.287.5
80
90
100
Met Trp
percent
NRC US Argentina Brazil India
Standardized Ileal Digestibility
Illini Sand, 2008

51
3.02
1.79
3.09
1.76
2.77
1.68
2.61
1.5
2.99
1.68
1
1.5
2
2.5
3
3.5
Lys Thr
percent
NRC US Argentina Brazil India
Standardized Ileal Digestible AA (%DM)
Illini Sand, 2008

52
0.67 0.65
0.73 0.74
0.660.70
0.630.680.68
0.71
0.4
0.6
0.8
1
Met Trp
percent
NRC US Argentina Brazil India
Standardized Ileal Digestible AA (%DM)
Illini Sand, 2008

Conclusions

54
Conclusions• Oligosaccharides can reduce gain and increase
diarrhea in weanling pigs• Several possibilities for reducing
oligosaccharides in soybeans and soybean meal • Low OL SBM has same or better digestiblity of
AA and energy as conv. SBM• Soybean meal with high conc. of protein is also
available and provides more digestible AA than conv. SBM

55
Conclusions, cont.• Fermented and enzymatically treated SBM
contain no oligosaccharides• PepSoyGen may replace fish meal in starter diets
without compromising pig performance– Keep CP low and add synthetic AA

56
Websitehttp://nutrition.ansci.illinois.edu

57
58
Thank you for the Attention