use of smartphone apps among library and information
TRANSCRIPT

International Journal of Internet Education http://ijie.journals.ekb.eg/ December, 2016 ISSN: 1687-6482
International Journal of Internet Education
http://ijie.journals.ekb.eg/ Page 30
Use of smartphone apps among library and information science students
at South Valley University, Egypt
Prof. Dr. Essam Mansour
DLIS, SVU
Egypt
Abstract
The purpose of this study is to investigate the use patterns and ownership of smartphone apps among
students at the Department of Library and Information Science (DLIS) at the South Valley University
(SVU), Egypt. This study may help faculty members and students, as well as DLISs in general and SVU‟s
DLIS, in particular, to understand the nature and purpose of such use.
Design/methodology/approach
This study used quantitative research methodology in the form of a survey, which was undertaken from
February to March 2015. The survey instrument was a self-administrated questionnaire, with a response
rate 82.7 per cent (441/533).
Findings
The findings of this study showed that smartphone users (82.7 per cent) at SVU‟s DLIS tended to be
junior females. Smartphone non-users (17.3 per cent) tended to be also young females but primarily
sophomores. The highest percentage of smartphone users had been using smartphones for four to five
years, and the largest number of students was described to be advanced users who heard first about these
mobile devices through friends and the Web. Most users had 21 to 25 apps. Social apps were the most
popular and included Facebook, e-mail and Twitter. For professional purposes, students used
smartphones more for communication purposes than learning purposes. Apps related to educational
purposes included Google Mobile, Facebook, e-mail, Twitter, YouTube and Wikipedia Mobile. Students
perceived most apps to be easy to use and useful to them. There were a number of uses for socializing
including messaging, following the news and playing games. Students had mainly positive attitudes
towards apps with a few negative concerns. Almost all students confirmed that they trust most apps.
Barriers related to the use of apps included training and lack of awareness. Further research may be
needed to specify the relationship between the students‟ use of these apps and their academic
performance. The main tasks done on smartphone devices were mainly for socializing. Students indicated
that popular tasks and activities, such as sending and receiving messages, following the news, making
communications, making chat, making friends, finding specific information, finding general information,
making discussion groups, playing games, completing class assignments, checking materials related to
courses, doing business, seeking jobs, watching movies, listening to music and accessing library services
are important tasks accomplished by them through the use of these devices. The current study indicated
very positive attitudes towards the use of these apps. Student at least agree with the statement that
smartphone apps allow for easy dissemination of information, provide too much information, increase the
speed of finding information, help communication, convenient, secure, build confident and reduce paper
use. However, a large number of students also at least agree with the statement that these apps are time
consuming, intimidating, addictive, violate privacy, require high language and technical skills, harmful
and frustrating. Almost all students confirmed that they are at least trustful in some apps, such as
WhatsApp, e-mail, YouTube, Facebook, Flickr, Twitter and Viber. A large number of smartphone users
surveyed in this study have been described to make excessive usage of social apps, such as
communication apps, messaging/texting apps and social networking sites, which were at the forefront of
use. Additionally, a large number of them adopted these devices, especially for communication purposes.
The most used apps were Facebook, e-mail, Twitter, WhatsApp, YouTube and Viber. For professional

International Journal of Internet Education http://ijie.journals.ekb.eg/ December, 2016 ISSN: 1687-6482
International Journal of Internet Education
http://ijie.journals.ekb.eg/ Page 31
purposes, students used smartphones more for communication purposes than learning purposes. However,
some of the students were using some of apps related to educational purposes, such as Google mobile,
Facebook, e-mail, Twitter, YouTube and Wikipedia mobile but not on a regular basis. Students perceived
the use of e-mail app, Google mobile, Facebook app WhatsApp, Kik, Twitter, YouTube, Google maps,
Viber, Line, Skype, Tango, Instagram, Flickr and Wikipedia mobile as at least fairly easy to them.
Additionally, they perceived the use of e-mail app Google mobile, WhatsApp, Facebook, YouTube,
Twitter, Viber, Instagram, Wikipedia mobile, Google maps, Kik, Skype, Line, Tango and Flickr as at
least fairly useful to them, especially for the purpose socialization more than learning.
Research limitations/implications
This study focuses only on undergraduate library and information science students belonging to SVU‟s
DLIS, Egypt. Any findings and conclusions resulting from this study are limited in scope to only SVU‟s
DLIS‟s undergraduate students. The study does not contain a significantly large sample of a population
from across Egypt to draw meaningful widespread conclusions indicative of such a larger population.
Practical implications
This study provides valuable insight into the use pattern of smartphones among a very important client
group. It may serve as useful input to researchers who are interested in the study of mobile internet
technologies (MITs), particularly in the education society.
Originality/value
Being the first study of its kind about university students in Egypt, it is considered a pioneering and a
unique study among studies conducted in the field of ICTs and MITs, especially with this category of
information users.
Keywords:
Smartphones, Education, Egypt, College students, Library and information science, Mobile internet
technologies, Qena, South valley university
Type:
Research Paper
International Journal of Internet Education http://ijie.journals.ekb.eg/ December, 2016 ISSN: 1687-6482
International Journal of Internet Education
http://ijie.journals.ekb.eg/ Page 32
Introduction
Smart phones are one of the most common technologies and devices accessed and used by a large number
of people all over the world. They have become one of the main tools to get a quick access to
information. “Smartphone is one [of] the most ubiquitous, dynamic and sophisticated trends in
communication” (Alfawareh & Jusoh, 2014, p. 321). According to the Radicati Group (2014), a
technology market research firm, the number of worldwide mobile users, including both business and
consumers, reached 5.674 billion users in 2014 and by the end of 2018; this number is expected to reach
over 6.2 billion. “Roughly 84% of the world population will be using mobile technology by year-end
2018” (p. 2).
The role of smart phones is apparent in all aspects of life, particularly in politics and education. It
appeared clearly in what is called “The Arab Spring”, particularly in Egypt, where such devices were
described to be the most important ways of communication among protestors inside and outside Egypt. In
this regard, Duffy (2014) confirmed that “The smart phone helped cover the Arab Spring in a way that
traditional journalism simply couldn‟t” (p. 53). In education, sharing the opinion with Chen and
Denovelles (2013), the popularity of Mobile Internet Technologies (MITs), such as smart phones, tablets
as well as e-book readers, among college students is noticeably increasing. A significant number of
universities are using now mobile technologies and create mobile-optimized versions of their websites, or
build stand-alone apps that can be downloaded from mobile app stores (Rellinger, 2011). Such devices
and tools are playing a significant role in the academic life of college students. They help connect
students to each other and connect to their instructors as well. Applications (apps), which run on these
devices/tools let students not only consume, but also discover and create content (Dahlstrom, 2012).
Despite the widespread use of smart phones, little is known about the ownership of such devices as well
as their use by the population in general and students in particular (Yavari et al. 2009). Investigating the
use of smart phones among students at the university level is very important because they tend to be
among the first people trying to use new technology (Richard, 2013). The current study tries to
investigate the ownership and use of such mobile devices among students enrolled in one of Egyptian
library and information science schools.
The purpose and significance of the study
The main purpose of this study is to investigate the usage patterns and ownership of smart phone apps
among students at the Library and Information Science (DLIS), the South Valley University (SVU),
Egypt. Previous studies, such as Chiu, Dukic and Lo (2014), revealed that there is limited research about
the use of Mobile Internet Technologies (MITs) by LIS students. The current research, therefore, may
help faculty members and students as well at LISs in general and SVU‟s DLIS in particular understand
the nature and purpose of such use. This study may serve as useful input to researchers who are interested
in the study of MITs, particularly in the education society.
The statement of the problem
In the shade of the tremendous growth of smart phones, a very large number of previous studies showed
that these mobile devices have been mostly used for communication and entertainment (Viticci, 2012).
The Mobile Internet Technologies (MITs), especially smart phones, have been studied on a large scale,
but research about the potential use of these devices among university students, especially at the
undergraduate level, has still not gained such considerable attention by researchers, especially in the Arab
countries, where Egypt is located. More research, therefore, is really needed to be conducted on this topic
among such users to recognize how and why they use such kinds of devises whatever the reasons and
purposes are.
The objectives of the study
The eight key objectives of this study are to:

International Journal of Internet Education http://ijie.journals.ekb.eg/ December, 2016 ISSN: 1687-6482
International Journal of Internet Education
http://ijie.journals.ekb.eg/ Page 33
Describe the demographic characteristics of smart phone users and non-user at SVU‟s DLIS.
Describe the features of the use of smart phone apps by students at SVU‟s DLIS.
Determine the ease and usefulness of using apps by smart phone users at SVU‟s DLIS.
Determine which types of apps used most by smart phone users at SVU‟s DLIS.
Determine which apps smart phone users at SVU‟s DLIS use for education and library-related
activities?
Determine tasks done on apps by smart phone users at SVU‟s DLIS.
Determine the positive and negative aspects of using apps by smart phone users at SVU‟s DLIS?
Identify constraints encountered by smart phone users and non-users at SVU‟s DLIS.
Definitions of terms
Smart phones
“Smartphone is a mobile phone running a complete operating system in a manner similar to a traditional
computer, which offer advanced computing abilities and connectivity options. These features enable new
kinds of mobile services that in turn shape the usage habits of smart phone users” (Alfawareh & Jusoh,
2014, p. 321). They are used interchangeably with mobile phones, cell phones and feature phones. All are
to some extent similar, but still different in terms of their capabilities. The smart phone has very advanced
capabilities than the two others.
Smart-phone Applications (apps) According to encyclopedia2.thefreedictionary.com, smart phone apps are defined
as software applications that run on a mobile phone. These may include games, diaries, planners, maps
and loads more. They range from Games, e-Book Readers, Navigation Software, Services providing
news and weather feeds, to Apps allowing users to access Internet services, such as e-mail, Youtube,
Facebook and other Social Networking Apps (UYS, et al., 2012).
The Department of Library and Information Science (DLIS)
According to its official site on the Web, DLIS founded in 2003 to build cadres specialized in library and
information science to meet the needs of the various sectors, particularly in the Upper Egypt. In total,
DLIS has 600 undergraduate students, of whom 523 as females and 77 as males. It has one associate
professor, three assistant professors, three teaching assistants and seven tutors (DLIS, 2014).
The South Valley University (SVU)
According to its official site on the Web, SVU was established on January 2, 1995 by presendial degree
No. 142. It covers a large area in the Upper Egypt distributing in three Governorates (Qena, Luxor, & the
Red Sea), and includes a total of 16 faculties and one Institute. The main campus of the SVU is located in
Qena, which is 609 km south the capital “Cairo”. As compared to its weight, SVU is committed to a big
social service role in the region of the Upper Egypt. SVU is a vibrant, nationally recognized student-
centered research institution with an enrolment of 28173 in the Academic Year 2013/2014 and about
1377 faculty members (SVU, 2014).
The Arab Republic of Egypt (ARE) Egypt is one of the oldest civilizations, with recorded history dating back to about 4000 B. C. With a total
area of about 386.662 sq mi and estimated population of 80,471.869 in 2010, Egypt is situated at the
northeast of Africa on the Mediterranean Sea; Egypt is bordered to the West by Libya, to the South by
Sudan, and to the East by the Red Sea and Israel (Infoplease, 2012).
The limitation of the study
This study focuses only on library and information science students, at the undergraduate level,
particularly those are belonging to SVU‟s DLIS, Egypt. It does not cover any other disciplines or any
International Journal of Internet Education http://ijie.journals.ekb.eg/ December, 2016 ISSN: 1687-6482
International Journal of Internet Education
http://ijie.journals.ekb.eg/ Page 34
other levels (graduates). Any findings and conclusions resulted from this study; are limited in scope to
only SVU‟s DLIS‟s undergraduate students. Additionally, the study does not contain a significantly large
sample of a population from across Egypt to draw meaningful widespread conclusions indicative of such
a large population.
The literature review
Despite the extensive use of smart phone devices, little is known about their ownership and use by the
general population and students (Yavari et al., 2009). The use of such kinds of mobile devices has largely
helped students improve their access to current and reliable information sources. “Today, mobile phones
have features that go far beyond text messaging and voice calls. They include Internet browsing, music
(MP3) playback, memo-recording, personal organizer functions, e-mail, bulletin, cameras, infrared and
Bluetooth connectivity. However, the ability of the mobile phones to offer a range of applications
depends on the capability of individual mobile phones and the services available” (Anyanwu, Ossai-Onah
and Nse, 2012, pp. 52-53).
In a chronological order, the researcher tried to review literature related to the use of these mobile devices
by university students. For example, Alfawareh and Jusoh (2014) tried, through a survey approach, to
explore the trends in the use of smart phones among university students (n= 324) at Najran University,
Saudi Arabia. Findings revealed that a very large number of students owned smart phones and the
majority of them were using smart phones as a regular mobile phone, as a computer connected to the
Internet as well as a digital camera. Although a very large number (91.69%) of students has used these
devices to login to their academic portal, 66.89% of them never used them to record class lectures and
46.51% never used them for downloading materials related to class. Regarding the potential use of smart
phone devices for educational purposes, Chen and Denovelles (2013) tried, through an online survey, to
explore the access and use of these devices as well as barriers to the insertion of mobile technologies into
the academic sphere. They surveyed 809 undergraduate and 133 graduate students at the University of
Central Florida (UCF). They found that students‟ ownership of mobile devices were mainly a small
mobile device, such as iPhone and Android, followed by a mobile tablet, such as as iPad, Android tablet
and kindle Fire) and e-book reader, such as Kindle. The findings also revealed that students need more
access to academic-friendly devices, such as tablets, and additional support to integrate mobile
technologies for learning-related activates. Bomhold (2013) surveyed 75 students who enrolled in an
introductory class in information literacy at a university in the Southern USA. He reached conclusion that
students do use smart phone apps for more than communication and entertainment, where a significant
number of them disclose using apps to find academic information on academic web sites using related
search engines. White and Mills (2012) surveyed 403 Japanese university students regarding their
adoption and use of smart phones, especially for language learning purposes. They found that students are
increasingly adopting these mobile devices for a personal use, but they are still reluctant to use them for
educational purposes. The study revealed that students‟ attitude towards the use of these devices for
learning purposes have become more positive. Through an online survey, Song and Lee (2012) tried to
investigate the ownership of mobile devices (smart phones, tablet PCs and e-readers) among 101
international students enrolled at the college of Business at the University of Illinois, USA, especially in
the shade of the availability of mobile services introduced by academic libraries. It also revealed that
although students were interested more in communication, they were also using mobile devices to access
Social Networking Sites (SNSs), search for information and to have fun as well. Dresselhaus and Shrode
(2012) conducted two surveys on the use of smart phones at Utah State University (USU), USA. The first
survey was concerned about the use of USU‟s students (approximately 25,000 undergraduates and
graduates) to determine why they use such devices as well as their interests in mobile access to the library
collections and services. The second survey was directed to librarians to learn about libraries‟ current and
future plans to launch mobile services. While results from the first survey helped to gain insight into
where students stand regarding their use of mobile devices for academic activities in general and their

International Journal of Internet Education http://ijie.journals.ekb.eg/ December, 2016 ISSN: 1687-6482
International Journal of Internet Education
http://ijie.journals.ekb.eg/ Page 35
desire for access to library services and resources in particular, resulted from the second survey gave an
idea of the extent to which responding libraries offer mobile access, their future plans for mobile
implementation and their opinions about how mobile technologies may be useful to library patrons.
Anyanwu, Ossai-Onah and Nse (2012) conducted a survey on the potential use of smart phones for
research purposes among undergraduate students in two polytechnic libraries in Nigeria. Findings showed
that students using the polytechnic libraries were using their smart phones for research occasionally. The
findings also revealed that students were pushed to use these mobile devices for some reasons, such as the
lack of relevant information sources in libraries, saving of time and cost of moving to other libraries for
research, low level of satisfaction derived from available resources as well as the lack of Internet facilities
in libraries. However, barriers, such as the high cost of downloading some of online resources,
incompatibility of software/formats of online resources as well as insecurity of sites, which causes
damages to the phones, were identified as constraints encountered by students when using smart phones.
Uys et al. (2012) tried to assess the usage of smart phone apps, specifically social networking apps,
among students at a South African university who are using these apps. They tried to assess the frequency
and intensity of the usage of apps. Findings showed that students spend an average of five hours per day
on their smart phones communicating and interacting with others via SNSs, and remain online for about
16 hours per day. Students were found to use SNSs predominantly for Facebook, Facebook chat and
Blackberry Messenger in order to update their profiles, chat with friends, and look at their friends‟
profiles and statuses. Through a cross-sectional survey, Jamal et al. (2012) tried to explore the pattern use
of smart phones among 120 female medical students at Taibah University, Saudi Arabia. Findings
revealed that 53.2% of students used smart phones daily. Only 13.3% of the students using smart phones
found that they had a harmful effect on their academic performance. The study concluded that a
substantial number of female medical students using smart phones reported possible health hazards,
which might affect academic performance. Using a self administrated questionnaire, Yavari et al., (2009)
conducted their study on the mobile phones used by 309 medical science students at the Yazd Medical
Sciences University, Pakistan. Findings showed that students mostly used smart phones at home,
followed by the street, classroom, during driving and in the library respectively. They reported that
location wise, the use of cell phones at home was 87.2%, followed by street (79.6%), classroom (37.6%),
during driving (18.6%) and in the library (17.8%) respectively. Abdul Karim, Darus and Hussin (2006)
tried to explore the use of mobile phone services in the educational environment as well as the perception
of university students on the use of mobile phone in library and information services. Data collected from
206 undergraduate students from two academic faculties in a Malaysian public university to investigate
the perception of students about the use of wireless phones. Findings showed that students‟ perceptions
on the application of wireless hand services in the context of library and information services were found
to be very positive
Regarding the use pattern of smart phones by library and information science students, there was a serious
attempt made by Adomi (2006) who tried, through a systematic random sampling technique, to
investigate the usage patterns of these mobile devices among 110 students at the Department of Library
and Information Science, Delta State University, Nigeria. Findings revealed that a majority of the students
were using mainly apps for making communication with their parents/relatives/friends as well as sending
and receiving messages. Family matters, followed by finance and academic matters constitute the most
conversation topics on the smart phones. Frequent network/call failure, followed by the high cost of
recharge cards/airtime, limited area of coverage as well as interconnectivity problems were the most
significant challenges faced by DLIS‟s students at Delta State University when using smart phone apps.
Academic use of smart phones
According to Rhema and Sztendur (2013), “Mobile phones are seen as a key means for improving access
to education” (p. 215). Such mobile devices in general and smart phones in particular establish a potential

International Journal of Internet Education http://ijie.journals.ekb.eg/ December, 2016 ISSN: 1687-6482
International Journal of Internet Education
http://ijie.journals.ekb.eg/ Page 36
for ubiquitous learner engagement that is often referred to as „learn anything at anytime and anywhere
(Sakamura & Koshizuka, 2005). There are really a lot of ways to learn using mobile technologies, which
are described as a gateway to tools and resources. Such technologies make learning more personalized
and connect the instructor with his/her students and reduce any gaps that may arise between them.
Advantages of smart phones in education
According to Bae and Kim (2014), the biggest advantage of the use of smart phones in education is that
learning can be accomplished anywhere and at any time without any limit. It can create an effective
learning environment for instructors as well as students. Compared to other mobile devices, such as
tablets and laptop computers, smart phones have the following advantages:
- They are small and lightweight as they can easily be carried by anyone, anytime and anywhere.
- They are not too much expensive due to fewer materials that are associated with their use.
- They run on smaller amounts of power than other devices like laptop and desktop computers.
- They have more supportive ways, such as Bluetooth and/or Internet connectivity.
- They‟re very engaging, so learning can last for a long time (Ecycle Best, 2015).
Students’ use of smart phone apps
"College students are more likely to be innovators or early adopters of new information technologies than
the general population" (Nelson, 2006, p. 6). Smart phone apps enable students to access a variety of
electronic media and information in a convenient way. According to Seilhamer, Chen and Sugar (2013),
there are significant factors that make mobile learning more attractive to college students, such as
convenience, flexibility, engagement and interactivity. Results from the ECAR research study on students
suggest that many undergraduate students bring their own digital devices to college, favouring small and
portable ones, such as smart phones and tablets. Mobile technologies are playing an increasingly
important role in college students' academic lives. They connect users to the world instantly, heightening
access to information and enabling interactivity with others. According to Chiu, Dukic, and Lo (2014),
the following are the most unique benefits of using mobile technologies for teaching and learning:
- They are relatively inexpensive, easily carried and mobiled.
- They allow students to learn at their convenient time at “anywhere and at anytime”, without any
restrictions by the physical classroom.
- They let students interact virtually, and this could encourage them to develop their social and
skills.
- They are a great challenge for libraries, as they provide libraries with various opportunities to
extend their collections and services by enabling access to their end-users in their most convenient
way.
With the help of the mobile phone-enabled technologies, smart phones are considered the most
appropriate and suitable ways and means to host all web applications in a pocket-sized computing device
to be easily carried and accessed by the user. According to Baghianimoghadam et al. (2013), mobile
phones have severe adverse effects on students‟ academic achievement. They may be used in the
classroom to engage students, access real-time feedback and answer questions anonymously.
Research questions
Based on its objectives, this study was designed to answer the eight following research questions:
RQ1. What are the demographic characteristics of smart phone users and non-users at SVU‟s DLIS?
RQ2. What are the features of the use of smart phones by students at SVU‟s DLIS (period of use,
experience, first hearing about apps, location, the number of smart phones owned, smart phone brand and
the number of apps accessed)?
RQ3. Which types of apps do students at SVU‟s DLIS use most?
RQ4. Which apps do students at SVU‟s DLIS use for education and library related activities?

International Journal of Internet Education http://ijie.journals.ekb.eg/ December, 2016 ISSN: 1687-6482
International Journal of Internet Education
http://ijie.journals.ekb.eg/ Page 37
RQ5. What are the characteristics (ease and usefulness of use) of the apps‟ use by students at SVU‟s
DLIS?
RQ6. Which tasks do students at SVU‟s DLIS on smart phone apps?
RQ7. What are the positive and negative aspects of the students‟ use of apps at SVU‟s DLIS?
RQ8. What are the most significant barriers that affect both use and non-use of apps by students at
SVU‟s DLIS?
Research methodology
This study was designed to describe the usage pattern and ownership of smart phone apps among students
at SVU‟s DLIS, Egypt. In nature, the descriptive research involves collecting data in order to answer
questions or to test hypothesis concerning the current status of the subject of the study. It can provide
very valuable data (Gay, 1992). This descriptive method is useful for investigating a variety of
educational problems. Typical descriptive studies are concerned with the assessment of attitudes,
opinions, demographic information, conditions, and procedures. Descriptive data are usually collected
through a questionnaire survey, interviews, or observation. This study employed quantitative research
methodology in the form of a survey, which was undertaken from February to March 2015. According to
Kerlinger (1986), the survey research is a useful tool for educational fact-finding and a means by which a
great deal of information can be obtained from the population of the study. The survey instrument of this
study was a self-administrated questionnaire, which was designed to collect data from participants. The
survey form was deeply reviewed and approved by a panel of experts consisting of one professor and two
associate professors who are interested in Mobile Internet technologies (MITs), social media as well as
those who are teaching courses in the field of library and information sciences. The validity and reliability
of the survey were checked through a pilot test implemented in the same department (SVU‟s DLIS)
before the actual distribution. The questionnaire consisted of twenty-five questions, which were divided
into nine sections. All the questions were closed-ended questions, but the last question (#25) was an open-
ended one. The researcher opted to rely largely on closed-ended questions because they were more suited
to the nature of the study‟s population that is not familiar much with surveys, and may be less willing to
state their feelings or opinions through hand written open-ended questions. The first section consisted of
three questions, which are related to the most basic demographic characteristics (gender, age & the class
standing) of DLIS‟ students. The second section (two questions) was about the students‟ use/non-use of
smart phones as well as barriers to not use such kinds of mobile technologies. The third section (just one
question) was about if students use or do not use smart phone apps. The fourth section (ten questions)
tried to explore the characteristic use of smart phone apps by DLIS‟s students, such as the frequency of
the use of apps, the use level, time spent, knowledge about apps, the number of smart phone devices
owned as well as the number and type of apps accessed. The fifth section (just one question) was about
the use of apps for education and library-related activities. The sixth section (just one question) was about
tasks done with apps. The seventh section (five questions) was about the students‟ perceptions about the
use of apps, such as how much they are easy, useful, trustful as well as their negative and positive aspects.
The eighth section (just one question) was concerned with problems encountered by students during their
use of these apps. The ninth section and the last one (just one question), which was an open-ended
question, allowed students to add any comments and suggestions that they would like to mention in their
questionnaire as well as opportunities to discuss issues that did not appear on the questionnaire. The
questionnaire was completely anonymous. To introduce it, a cover letter accompanied the questionnaire.
According to Linsky (1975), the questionnaire cover letter may help motivate respondents to reply to the
questionnaire. All returned valid questionnaires were coded employing SPSS (version 17.0) spreadsheet.
The population of the study
The population of this study is undergraduate students enrolled in the year 2014/2015 at SVU‟s DLIS.
Undergraduate students were defined in this study as those who were in one of the bachelor‟s grades:
freshman, sophomore, junior and senior. In total, DLIS has 600 undergraduate students, of whom 523 as
International Journal of Internet Education http://ijie.journals.ekb.eg/ December, 2016 ISSN: 1687-6482
International Journal of Internet Education
http://ijie.journals.ekb.eg/ Page 38
females and 77 as males. DLIS‟ faculty members are just one associate professor, three assistant
professors, three teaching assistants and seven tutors. As much as possible, questionnaires were
distributed to almost all students. Of the total number (600), 533 returned their valid questionnaires
representing 88.83% of the total number of students.
Findings and analyses of the study
According to the order of the items listed in its questionnaire, the findings of this study are
organized. They are also handled in terms of the answer of the eight research questions of the
study. As appropriate, some items are cross-tabulated with each other. The sample of the study
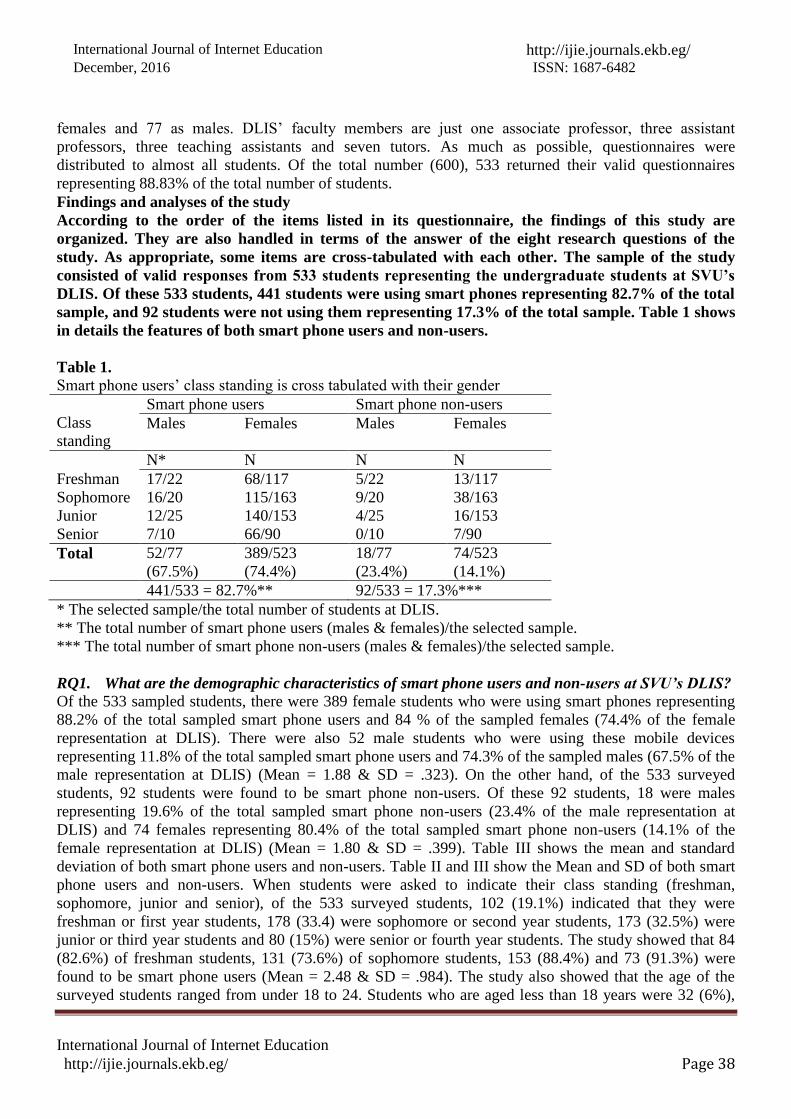
consisted of valid responses from 533 students representing the undergraduate students at SVU’s
DLIS. Of these 533 students, 441 students were using smart phones representing 82.7% of the total
sample, and 92 students were not using them representing 17.3% of the total sample. Table 1 shows
in details the features of both smart phone users and non-users.
Table 1.
Smart phone users‟ class standing is cross tabulated with their gender
Class
standing
Smart phone users Smart phone non-users
Males Females Males Females
N* N N N
Freshman 17/22 68/117 5/22 13/117
Sophomore 16/20 115/163 9/20 38/163
Junior 12/25 140/153 4/25 16/153
Senior 7/10 66/90 0/10 7/90
Total 52/77
(67.5%)
389/523
(74.4%)
18/77
(23.4%)
74/523
(14.1%)
441/533 = 82.7%** 92/533 = 17.3%***
* The selected sample/the total number of students at DLIS.
** The total number of smart phone users (males & females)/the selected sample.
*** The total number of smart phone non-users (males & females)/the selected sample.
RQ1. What are the demographic characteristics of smart phone users and non-users at SVU’s DLIS?
Of the 533 sampled students, there were 389 female students who were using smart phones representing
88.2% of the total sampled smart phone users and 84 % of the sampled females (74.4% of the female
representation at DLIS). There were also 52 male students who were using these mobile devices
representing 11.8% of the total sampled smart phone users and 74.3% of the sampled males (67.5% of the
male representation at DLIS) (Mean = 1.88 & SD = .323). On the other hand, of the 533 surveyed
students, 92 students were found to be smart phone non-users. Of these 92 students, 18 were males
representing 19.6% of the total sampled smart phone non-users (23.4% of the male representation at
DLIS) and 74 females representing 80.4% of the total sampled smart phone non-users (14.1% of the
female representation at DLIS) (Mean = 1.80 & SD = .399). Table III shows the mean and standard
deviation of both smart phone users and non-users. Table II and III show the Mean and SD of both smart
phone users and non-users. When students were asked to indicate their class standing (freshman,
sophomore, junior and senior), of the 533 surveyed students, 102 (19.1%) indicated that they were
freshman or first year students, 178 (33.4) were sophomore or second year students, 173 (32.5%) were
junior or third year students and 80 (15%) were senior or fourth year students. The study showed that 84
(82.6%) of freshman students, 131 (73.6%) of sophomore students, 153 (88.4%) and 73 (91.3%) were
found to be smart phone users (Mean = 2.48 & SD = .984). The study also showed that the age of the
surveyed students ranged from under 18 to 24. Students who are aged less than 18 years were 32 (6%),
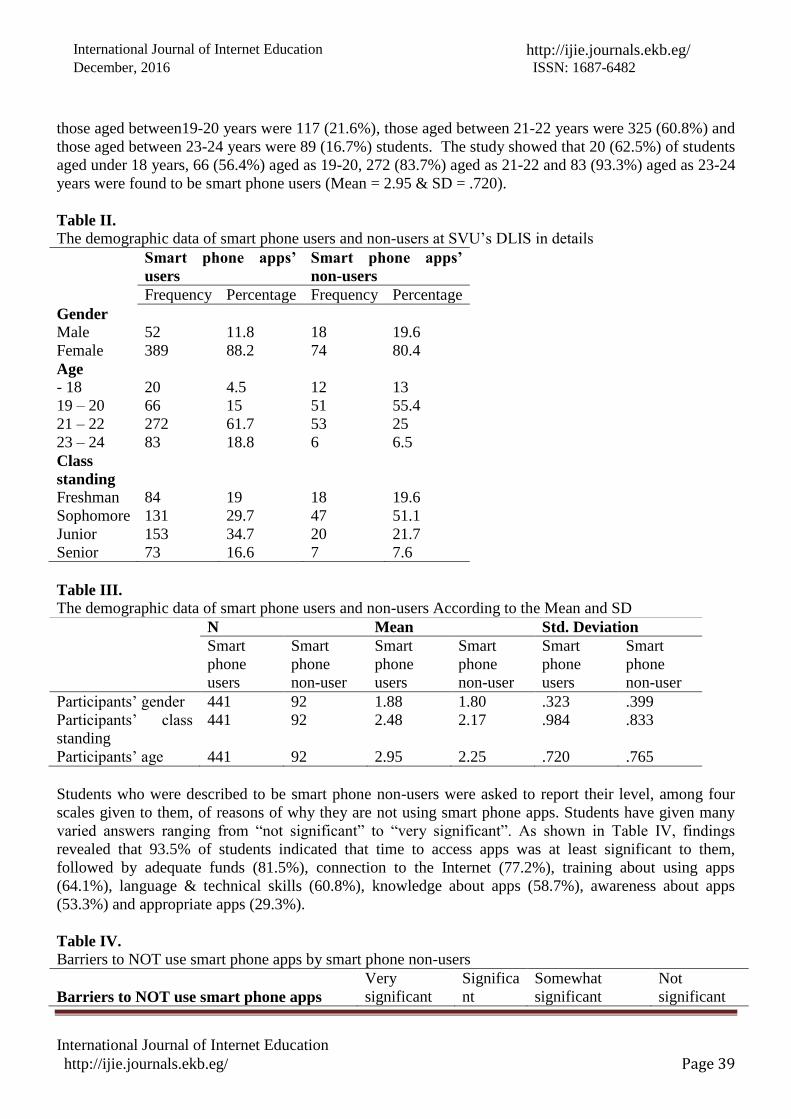
International Journal of Internet Education http://ijie.journals.ekb.eg/ December, 2016 ISSN: 1687-6482
International Journal of Internet Education
http://ijie.journals.ekb.eg/ Page 39
those aged between19-20 years were 117 (21.6%), those aged between 21-22 years were 325 (60.8%) and
those aged between 23-24 years were 89 (16.7%) students. The study showed that 20 (62.5%) of students
aged under 18 years, 66 (56.4%) aged as 19-20, 272 (83.7%) aged as 21-22 and 83 (93.3%) aged as 23-24
years were found to be smart phone users (Mean = 2.95 & SD = .720).
Table II.
The demographic data of smart phone users and non-users at SVU‟s DLIS in details
Smart phone apps’
users
Smart phone apps’
non-users
Frequency Percentage Frequency Percentage
Gender
Male 52 11.8 18 19.6
Female 389 88.2 74 80.4
Age
- 18 20 4.5 12 13
19 – 20 66 15 51 55.4
21 – 22 272 61.7 53 25
23 – 24 83 18.8 6 6.5
Class
standing
Freshman 84 19 18 19.6
Sophomore 131 29.7 47 51.1
Junior 153 34.7 20 21.7
Senior 73 16.6 7 7.6
Table III.
The demographic data of smart phone users and non-users According to the Mean and SD
N Mean Std. Deviation
Smart
phone
users
Smart
phone
non-user
Smart
phone
users
Smart
phone
non-user
Smart
phone
users
Smart
phone
non-user
Participants‟ gender 441 92 1.88 1.80 .323 .399
Participants‟ class
standing
441 92 2.48 2.17 .984 .833
Participants‟ age 441 92 2.95 2.25 .720 .765
Students who were described to be smart phone non-users were asked to report their level, among four
scales given to them, of reasons of why they are not using smart phone apps. Students have given many
varied answers ranging from “not significant” to “very significant”. As shown in Table IV, findings
revealed that 93.5% of students indicated that time to access apps was at least significant to them,
followed by adequate funds (81.5%), connection to the Internet (77.2%), training about using apps
(64.1%), language & technical skills (60.8%), knowledge about apps (58.7%), awareness about apps
(53.3%) and appropriate apps (29.3%).
Table IV.
Barriers to NOT use smart phone apps by smart phone non-users
Barriers to NOT use smart phone apps
Very
significant
Significa
nt
Somewhat
significant
Not
significant
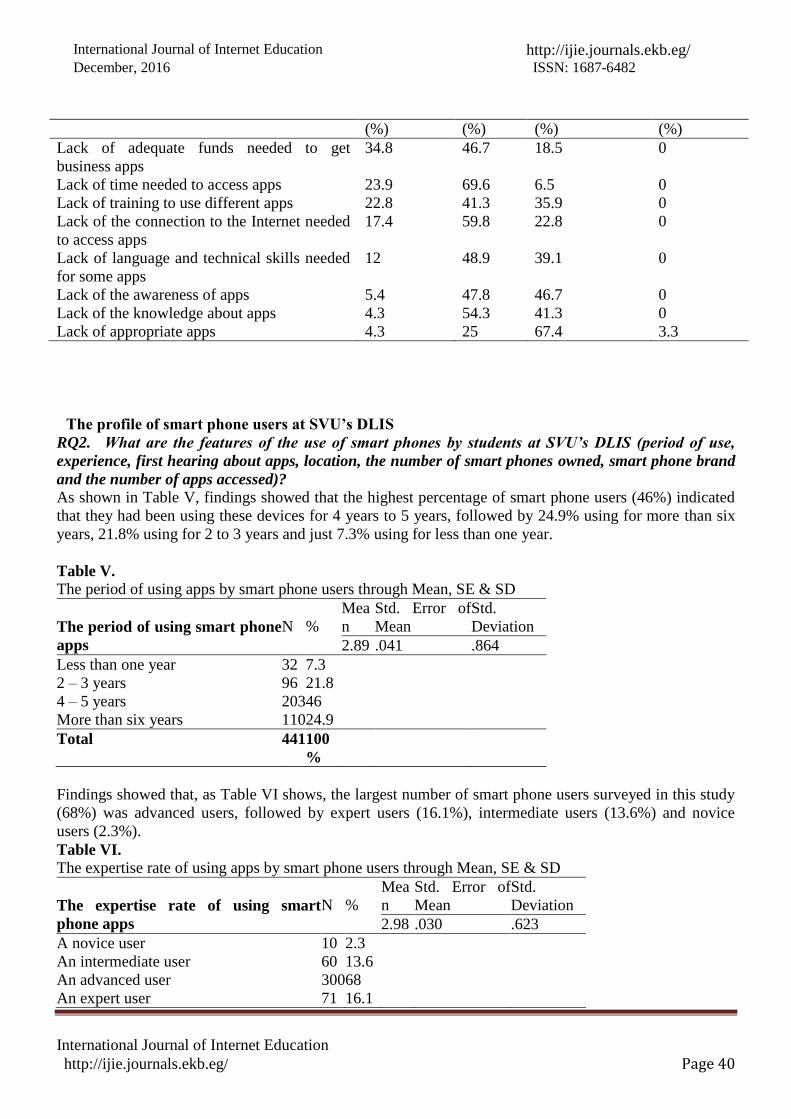
International Journal of Internet Education http://ijie.journals.ekb.eg/ December, 2016 ISSN: 1687-6482
International Journal of Internet Education
http://ijie.journals.ekb.eg/ Page 40
(%) (%) (%) (%)
Lack of adequate funds needed to get
business apps
34.8 46.7 18.5 0
Lack of time needed to access apps 23.9 69.6 6.5 0
Lack of training to use different apps 22.8 41.3 35.9 0
Lack of the connection to the Internet needed
to access apps
17.4 59.8 22.8 0
Lack of language and technical skills needed
for some apps
12 48.9 39.1 0
Lack of the awareness of apps 5.4 47.8 46.7 0
Lack of the knowledge about apps 4.3 54.3 41.3 0
Lack of appropriate apps 4.3 25 67.4 3.3
The profile of smart phone users at SVU’s DLIS
RQ2. What are the features of the use of smart phones by students at SVU’s DLIS (period of use,
experience, first hearing about apps, location, the number of smart phones owned, smart phone brand
and the number of apps accessed)?
As shown in Table V, findings showed that the highest percentage of smart phone users (46%) indicated
that they had been using these devices for 4 years to 5 years, followed by 24.9% using for more than six
years, 21.8% using for 2 to 3 years and just 7.3% using for less than one year.
Table V.
The period of using apps by smart phone users through Mean, SE & SD
The period of using smart phone
apps
N
%
Mea
n
Std. Error of
Mean
Std.
Deviation
2.89 .041 .864
Less than one year 32 7.3
2 – 3 years 96 21.8
4 – 5 years 203 46
More than six years 110 24.9
Total 441 100
%
Findings showed that, as Table VI shows, the largest number of smart phone users surveyed in this study
(68%) was advanced users, followed by expert users (16.1%), intermediate users (13.6%) and novice
users (2.3%).
Table VI.
The expertise rate of using apps by smart phone users through Mean, SE & SD
The expertise rate of using smart
phone apps
N
%
Mea
n
Std. Error of
Mean
Std.
Deviation
2.98 .030 .623
A novice user 10 2.3
An intermediate user 60 13.6
An advanced user 300 68
An expert user 71 16.1

International Journal of Internet Education http://ijie.journals.ekb.eg/ December, 2016 ISSN: 1687-6482
International Journal of Internet Education
http://ijie.journals.ekb.eg/ Page 41
Total 441 100
%
As shown in Table VII, this study found that the largest number of smart phone users (57.1%) heard first
about these devices through friends, followed by the Web (19.7%), TV/Radio (10.2%), magazines &
newspapers (4.8%), professional journals (3.9%), books (3.2%) and Class (1.1%).
Table VII.
The first hearing about apps by smart phone users through Mean, SE & SD
First hearing about smart
phone apps
N
%
Mea
n
Std. Error of
Mean
Std.
Deviation
5.54 .088 1.842
Friends 252 57.1
The Web 87 19.7
TV/Radio 45 10.2
Magazines & Newspapers
21 4.8
Professional journals 17 3.9
Books 14 3.2
Class 5 1.1
Total 441 100
%
Students were asked to locate where they accessed smart phone apps. As Table VIII shows, findings
showed that the most frequent location of students‟ access to these apps was from their home and
university campus. In detail, 100% of smart phone users indicated that their access and use of these apps
through their home/dormitory was at least high, followed by University campus (92.7%), University
library (73.2%), and community centers (club, cyber, etc.) (53.3%), class (51.7%), public library (42.8%)
and work (19.9%).
Table VIII.
Accessing apps by smart phone users
Accessing smart phone apps
through:
Very
high
(%)
Hig
h
(%)
Modera
te
(%)
Lo
w
(%)
Very
low
(%)
Home/Dormitory 95.9 4.1 0 0 0
University campus 81 11.8 5.7 1.6 0
University library 37.4 35.8 30.6 5.7 .5
Community center (club,
cybers, etc.)
27 26.3 34.2 12.
5
0
Class 23.1 28.6 39.2 40 0
Public library 19.7 32.2 34.5 13.
6
0
Work 7.3 12.7 30.8 34.
5
14.7

International Journal of Internet Education http://ijie.journals.ekb.eg/ December, 2016 ISSN: 1687-6482
International Journal of Internet Education
http://ijie.journals.ekb.eg/ Page 42
Through One-Way ANOVA, the study revealed that there is no a statistically significant difference at the
p >.05 level between the demographic characteristics (age, gender and class standing) of smart phone
users and their location of using apps (Table IX).
Table IX.
Anova (shortened) by the location of accessing apps by students through Mean, SE & SD
Statistics Level of Significance
Accessing smart phone
apps from:
N
(441)
Mea
n
Std.
Error SD Age
Gend
er
Class
standing
Home/Dormitory 4.96 .009 .198 .49
2
.403 .524
University campus 4.72 .031 .641 .36
5
.909 .391
University library 4.04 .044 .921 .10
8
.888 .124
Community center (club,
cyber, etc.)
3.68 .048 1.00
5
.77
7
.359 .880
Class 3.66 .044 .933 .54
2
.899 .662
Public library 3.58 .045 .955 .23
4
.293 .876
Work 2.63 .053 1.10
4
.92
2
.496 .591
As shown in Table X, this study showed that a large number (82.1%) of the students was having just one
device, followed by two (16.8%) and three and more (1.1%).
Table X.
The number of smart phone devices owned by smart phone users through Mean, SE & SD
The number of smart phone devices owned
by students
N
%
Mean Std. Error of
Mean
Std.
Deviation
1.19 .020 .421
One 362 82.1
Two 74 16.8
Three and more 5 1.1
Total 441 100
%
This study also showed that the most predominant and popular brand smart phone users own was
Android, followed by iPhone, Blackberry and Windows. In details, most of the smart phone users
(72.3%) own Android (Samsung & Nokia), followed by Blackberry (12.9%), iPhone (9.8%) and
Windows (5%) (Table XI).
Table XI.
Smart phone brand owned by smart phone users through Mean, SE & SD
A smart phone brand
owned by users
N
%
Mean Std. Error of
Mean
Std.
Deviation
2.13 .030 .640
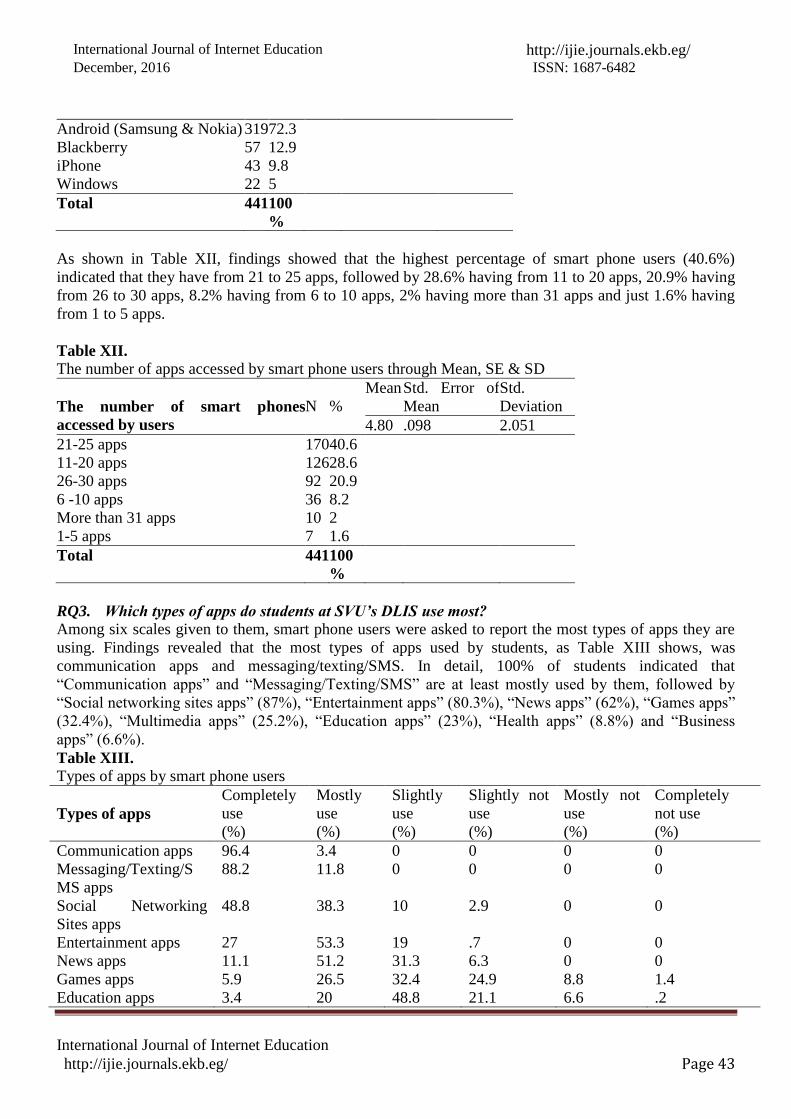
International Journal of Internet Education http://ijie.journals.ekb.eg/ December, 2016 ISSN: 1687-6482
International Journal of Internet Education
http://ijie.journals.ekb.eg/ Page 43
Android (Samsung & Nokia) 319 72.3
Blackberry 57 12.9
iPhone 43 9.8
Windows 22 5
Total 441 100
%
As shown in Table XII, findings showed that the highest percentage of smart phone users (40.6%)
indicated that they have from 21 to 25 apps, followed by 28.6% having from 11 to 20 apps, 20.9% having
from 26 to 30 apps, 8.2% having from 6 to 10 apps, 2% having more than 31 apps and just 1.6% having
from 1 to 5 apps.
Table XII.
The number of apps accessed by smart phone users through Mean, SE & SD
The number of smart phones
accessed by users
N
%
Mean Std. Error of
Mean
Std.
Deviation
4.80 .098 2.051
21-25 apps 170 40.6
11-20 apps 126 28.6
26-30 apps 92 20.9
6 -10 apps 36 8.2
More than 31 apps 10 2
1-5 apps 7 1.6
Total 441 100
%
RQ3. Which types of apps do students at SVU’s DLIS use most?
Among six scales given to them, smart phone users were asked to report the most types of apps they are
using. Findings revealed that the most types of apps used by students, as Table XIII shows, was
communication apps and messaging/texting/SMS. In detail, 100% of students indicated that
“Communication apps” and “Messaging/Texting/SMS” are at least mostly used by them, followed by
“Social networking sites apps” (87%), “Entertainment apps” (80.3%), “News apps” (62%), “Games apps”
(32.4%), “Multimedia apps” (25.2%), “Education apps” (23%), “Health apps” (8.8%) and “Business
apps” (6.6%).
Table XIII.
Types of apps by smart phone users
Types of apps
Completely
use
(%)
Mostly
use
(%)
Slightly
use
(%)
Slightly not
use
(%)
Mostly not
use
(%)
Completely
not use
(%)
Communication apps 96.4 3.4 0 0 0 0
Messaging/Texting/S
MS apps
88.2 11.8 0 0 0 0
Social Networking
Sites apps
48.8 38.3 10 2.9 0 0
Entertainment apps 27 53.3 19 .7 0 0
News apps 11.1 51.2 31.3 6.3 0 0
Games apps 5.9 26.5 32.4 24.9 8.8 1.4
Education apps 3.4 20 48.8 21.1 6.6 .2

International Journal of Internet Education http://ijie.journals.ekb.eg/ December, 2016 ISSN: 1687-6482
International Journal of Internet Education
http://ijie.journals.ekb.eg/ Page 44
Health apps 2.5 6.3 37.6 41 10.9 1.6
Multimedia apps 1.8 23.4 46.5 22.9 5.4 0
Business apps .5 13.4 46.9 32.7 6.1 .5
Through One-Way ANOVA, the study revealed that there is a statistically significant difference at the p
>.05 level between the age of students and their use types of apps, such as social networking sites apps (p
= .002), entertainment apps (p = .029), multimedia apps (p = .000), education apps (p = .000), games apps
(p = .000), health apps (p = .030) and business apps (p = .029). The study also revealed that there is a
statistically significant difference between the students‟ gender and their use types of apps, such as
multimedia apps (p = .049) and education apps (p = .005) and as well as their class standing and their
use types of apps, such as communication apps (p = .005), social networking sites (p = .000), news apps
(p = .007%), multimedia apps (p = .000), education apps (p = .000), games apps (p = .000) and business
apps (p = .000) (Table XIV).
Table XIV.
ANOVA (shortened) by types of smart phone apps used by students and their demography through Mean,
SE & SD
Statistics Level of Significance
Types of smart phone apps
mostly used
N Mea
n
Std.
Error SD Age
Gend
er
Class
standing
Communication apps 441 5.97 .009 .181 .18
4
.851 .005
Messaging/Texting/SMS apps 441 5.88 .015 .323 .95
6
.393 .471
Social Networking Sites apps 441 5.33 .037 .774 .00
2
.985 .000
Entertainment apps 441 5.07 .033 .696 .02
9
.069 .050
News apps 441 4.67 .036 .756 .50
5
.053 .007
Multimedia apps 441 3.93 .041 .866 .00
0
.049 .000
Education apps 441 3.92 .043 .908 .00
0
.005 .000
Games apps 441 3.92 .053 1.10
6
.00
0
.932 .000
Health apps 441 3.44 .044 .915 .03
0
.158 .183
Business apps 441 3.32 .039 .815 .02
9
.230 .000
Students using smart phones were asked how many hours a day they spent using these apps. They were
given four options: 1 = one hour or less, 2 = 2-3 hours, 3 = 4-5 hours, 4 = 6 hours or more from which to
choose only one. Findings showed that a large number of the students (85%) spend six hours and more on
using these apps, followed by 13.4% spending between 4 to 5 hours a day and just 1.6% who spend
between 2 to 3 hours a day.
Among six scales given to them, smart phone users were also asked to report the most apps they were
using. Findings revealed that the most apps mostly used and accessed by students, as Table XV shows,
were Facebook, E-mail, Twitter, What‟s app and Youtube. In detail, 100% of students indicated that
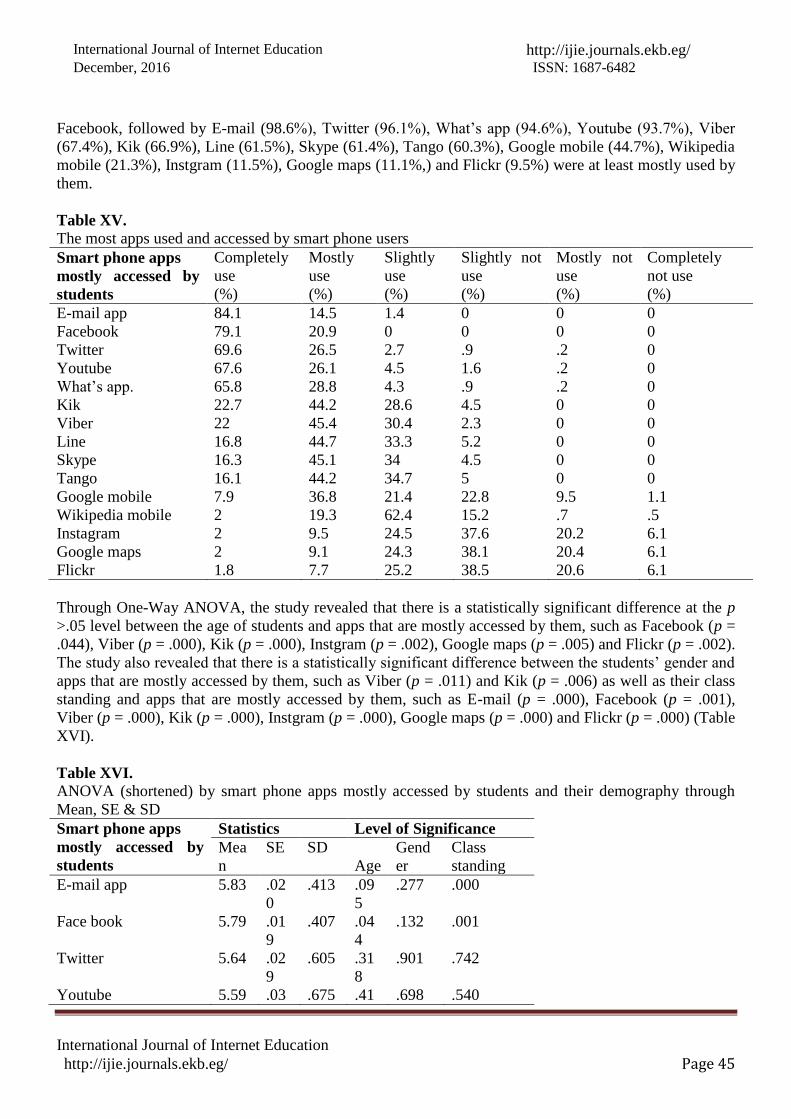
International Journal of Internet Education http://ijie.journals.ekb.eg/ December, 2016 ISSN: 1687-6482
International Journal of Internet Education
http://ijie.journals.ekb.eg/ Page 45
Facebook, followed by E-mail (98.6%), Twitter (96.1%), What‟s app (94.6%), Youtube (93.7%), Viber
(67.4%), Kik (66.9%), Line (61.5%), Skype (61.4%), Tango (60.3%), Google mobile (44.7%), Wikipedia
mobile (21.3%), Instgram (11.5%), Google maps (11.1%,) and Flickr (9.5%) were at least mostly used by
them.
Table XV.
The most apps used and accessed by smart phone users
Smart phone apps
mostly accessed by
students
Completely
use
(%)
Mostly
use
(%)
Slightly
use
(%)
Slightly not
use
(%)
Mostly not
use
(%)
Completely
not use
(%)
E-mail app 84.1 14.5 1.4 0 0 0
Facebook 79.1 20.9 0 0 0 0
Twitter 69.6 26.5 2.7 .9 .2 0
Youtube 67.6 26.1 4.5 1.6 .2 0
What‟s app. 65.8 28.8 4.3 .9 .2 0
Kik 22.7 44.2 28.6 4.5 0 0
Viber 22 45.4 30.4 2.3 0 0
Line 16.8 44.7 33.3 5.2 0 0
Skype 16.3 45.1 34 4.5 0 0
Tango 16.1 44.2 34.7 5 0 0
Google mobile 7.9 36.8 21.4 22.8 9.5 1.1
Wikipedia mobile 2 19.3 62.4 15.2 .7 .5
Instagram 2 9.5 24.5 37.6 20.2 6.1
Google maps 2 9.1 24.3 38.1 20.4 6.1
Flickr 1.8 7.7 25.2 38.5 20.6 6.1
Through One-Way ANOVA, the study revealed that there is a statistically significant difference at the p
>.05 level between the age of students and apps that are mostly accessed by them, such as Facebook (p =
.044), Viber (p = .000), Kik (p = .000), Instgram (p = .002), Google maps (p = .005) and Flickr (p = .002).
The study also revealed that there is a statistically significant difference between the students‟ gender and
apps that are mostly accessed by them, such as Viber (p = .011) and Kik (p = .006) as well as their class
standing and apps that are mostly accessed by them, such as E-mail (p = .000), Facebook (p = .001),
Viber (p = .000), Kik (p = .000), Instgram (p = .000), Google maps (p = .000) and Flickr (p = .000) (Table
XVI).
Table XVI.
ANOVA (shortened) by smart phone apps mostly accessed by students and their demography through
Mean, SE & SD
Smart phone apps
mostly accessed by
students
Statistics Level of Significance
Mea
n
SE SD
Age
Gend
er
Class
standing
E-mail app 5.83 .02
0
.413 .09
5
.277 .000
Face book 5.79 .01
9
.407 .04
4
.132 .001
Twitter 5.64 .02
9
.605 .31
8
.901 .742
Youtube 5.59 .03 .675 .41 .698 .540
International Journal of Internet Education http://ijie.journals.ekb.eg/ December, 2016 ISSN: 1687-6482
International Journal of Internet Education
http://ijie.journals.ekb.eg/ Page 46
2 7
What‟s app. 5.59 .03
1
.641 .48
6
.703 .917
Viber 4.87 .03
7
.774 .00
0
.011 .000
Kik 4.85 .03
9
.820 .00
0
.006 .000
Line 4.73 .03
8
.799 .51
5
.141 .857
Skype 4.73 .03
7
.784 .38
6
.442 .158
Tango 4.71 .03
8
.792 .50
1
.275 .259
Google mobile 4.07 056 1.18
2
.64
8
.102 .092
Wikipedia mobile 4.05 .03
3
.702 .79
4
.086 .079
Instagram 3.17 .05
3
1.10
9
.00
2
.185 .000
Google maps 3.16 .05
3
1.10
3
.00
5
.332 .000
Flickr 3.13 .05
1
1.07
7
.00
2
.349 .000
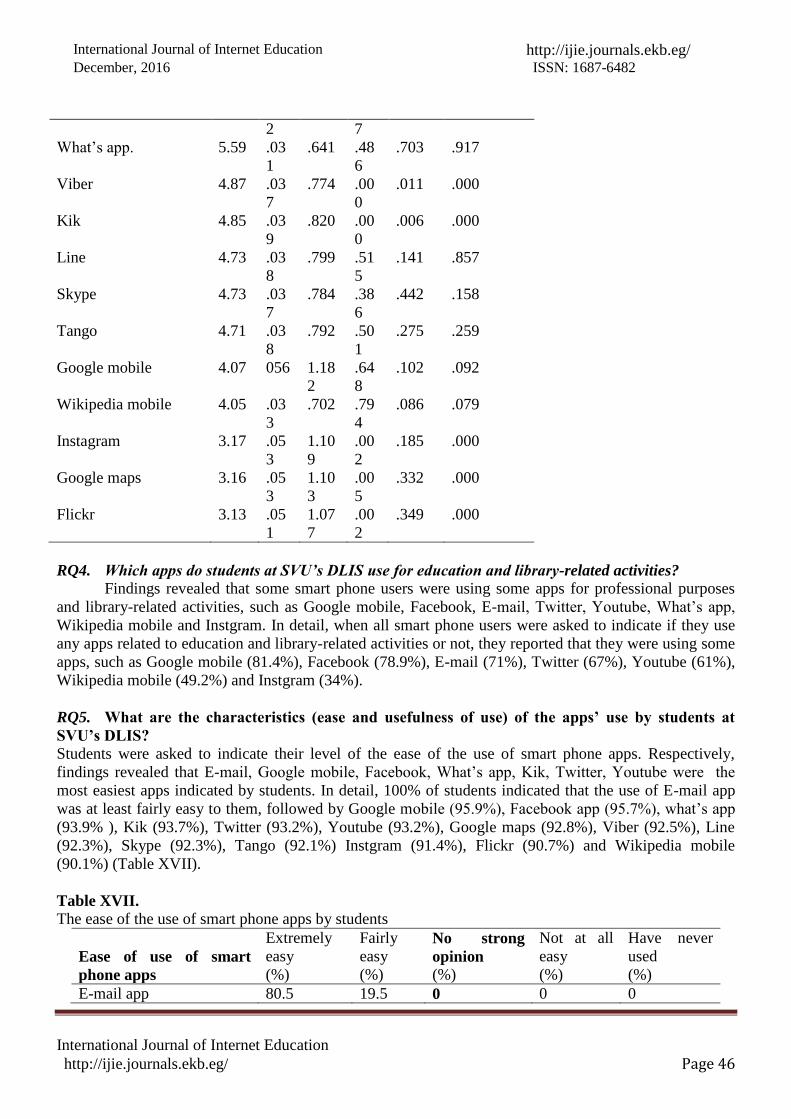
RQ4. Which apps do students at SVU’s DLIS use for education and library-related activities?
Findings revealed that some smart phone users were using some apps for professional purposes
and library-related activities, such as Google mobile, Facebook, E-mail, Twitter, Youtube, What‟s app,
Wikipedia mobile and Instgram. In detail, when all smart phone users were asked to indicate if they use
any apps related to education and library-related activities or not, they reported that they were using some
apps, such as Google mobile (81.4%), Facebook (78.9%), E-mail (71%), Twitter (67%), Youtube (61%),
Wikipedia mobile (49.2%) and Instgram (34%).
RQ5. What are the characteristics (ease and usefulness of use) of the apps’ use by students at
SVU’s DLIS?
Students were asked to indicate their level of the ease of the use of smart phone apps. Respectively,
findings revealed that E-mail, Google mobile, Facebook, What‟s app, Kik, Twitter, Youtube were the
most easiest apps indicated by students. In detail, 100% of students indicated that the use of E-mail app
was at least fairly easy to them, followed by Google mobile (95.9%), Facebook app (95.7%), what‟s app
(93.9% ), Kik (93.7%), Twitter (93.2%), Youtube (93.2%), Google maps (92.8%), Viber (92.5%), Line
(92.3%), Skype (92.3%), Tango (92.1%) Instgram (91.4%), Flickr (90.7%) and Wikipedia mobile
(90.1%) (Table XVII).
Table XVII.
The ease of the use of smart phone apps by students
Ease of use of smart
phone apps
Extremely
easy
(%)
Fairly
easy
(%)
No strong
opinion
(%)
Not at all
easy
(%)
Have never
used
(%)
E-mail app 80.5 19.5 0 0 0

International Journal of Internet Education http://ijie.journals.ekb.eg/ December, 2016 ISSN: 1687-6482
International Journal of Internet Education
http://ijie.journals.ekb.eg/ Page 47
Facebook 65.3 30.2 4.5 0 0
Twitter 63.5 30.2 4.8 .7 .9
Skype 44 48.3 7.7 0 0
Line 43.8 48.5 7.7 0 0
What‟s app. 42.2 51.7 6.1 0 0
Tango 42.2 49.9 7.9 0 0
Youtube 40.1 53.1 6.8 0 0
Viber 39.9 52.6 7 0 .5
Flickr 34 56.7 7.9 .9 .5
Google maps 28.8 64.2 6.1 .2 .5
Google mobile 21.1 75.1 3.9 0 0
Wikipedia mobile 19.5 70.5 8.8 .7 .5
Instagram 17 74.6 2.5 2 3.9
Kik 15.6 42 27.7 10.2 4.5
Students using apps were also asked to indicate their level of the usefulness of apps they are using.
Findings revealed, as Table XVIII shows, that E-mail, Google mobile, What‟s app, Facebook, Youtube,
Twitter and Viber respectively are the most useful apps indicated by students. In deltas, 100% of students
indicated that the use of this E-mail app was “at least” fairly useful to them, followed by Google mobile
(99.3%), what‟s app (99.1%), Facebook (98.9%), Youtube (98.9%), Twitter (98.7%), Viber (97.1%),
Instgram (95.1%), Wikipedia mobile (94.3%), Google maps (94.1%), Kik (93.4%), Skype (93.2%), Line
(91.9%), Tango (89.8%) and Flickr (85.9%).
Table XVIII.
The usefulness of the use of apps by smart phone users
The usefulness of smart
phone apps
Extremely
useful
(%)
Fairly
useful
(%)
No strong
opinion
(%)
Not at all
useful
(%)
Have never
used
(%)
Youtube 81.2 17.7 1.1 0 0
Twitter 78.2 20.6 1.1 0 0
What‟s app 77.1 21.8 1.1 0 0
Facebook 68.9 29.9 1.1 0 0
Google mobile 68.5 30.8 .7 0 0
Viber 67.3 29.9 2.7 0 0
E-mail 66 34 0 0 0
Instagram 63.3 31.7 3.9 .2 .9
Kik 63 30.4 5.4 .2 .9
Google maps 62.6 31.5 5.7 .2 0
Skype 43.3 49.9 6.8 0 0
Line 42.6 49.4 7.9 0 0
Tango 42.2 47.6 10.2 0 0
Wikipedia mobile 28.1 66.4 5.4 0 0
Flickr 21.8 64.2 12 2 0
Through One-Way ANOVA, the study revealed that there is a statistically significant difference at the p
>.05 level between the age of students and the ease of apps‟ use, such as Youtube (p = .008), Flickr (p =
.000), Google mobile (p = .009), Google maps (p = .000), Instgram (p = .030) and Kik (p = .012). There
is also a statistically significant difference between the students‟ gender and the ease of their use of apps,
such as Facebook (p = .031) as well as their class standing and Facebook (p = .015), What‟s app (p =

International Journal of Internet Education http://ijie.journals.ekb.eg/ December, 2016 ISSN: 1687-6482
International Journal of Internet Education
http://ijie.journals.ekb.eg/ Page 48
.000), Youtube (p = .000), Viber (p = .000), Flickr (p = .000), Google mobile (p = .000), Google maps (p
= .000), Instgram (p = .001) and Kik (p = .000). The study also revealed that there is a statistically
significant difference at the p >.05 level between the students‟ gender and the usefulness of the apps‟ use,
such as Facebook (p = .043) and Viber (p = .040) as well as their class standing and E-mail (p = .008),
Facebook (p = .024), Twiter (p = .005), What‟s app (p = .007), Viber (p = .004) and Google mobile (p =
.042) (Table XIX).
Table XIX.
ANOVA (shortened) by Ease & usefulness of using apps and students‟ demography through Mean, SE &
SD
Ease of using apps The usefulness of using apps
Statistics Level of Significance Statistics Level of Significance
Ease &
usefulness
of using apps
Mea
n
SE
SD
Age
Gend
er
Class
standin
g
Mea
n SE SD Age
Gend
er
Class
standin
g
E-mail app 4.80 .01
9
.397 .83
4
.672 .101 4.66 .02
3
.47
4
.10
9
.077 .008
Facebook 4.61 .02
7
.574 .18
2
.031 .015 4.68 .02
3
.49
1
.41
5
.043 .024
Twitter 4.55 .03
3
.703 .32
9
.452 .460 4.77 .02
1
.47
7
.91
1
.105 .005
What‟s app. 4.36 .02
8
.595 .06
5
.496 .000 4.76 .02
2
.45
4
.75
5
.143 .007
Line 4.36 .03
0
.621 .94
3
.514 .797 4.35 .03
0
.62
1
.84
1
.059 .250
Skype 4.36 .03
0
.621 .16
7
.788 .125 4.37 .02
9
.60
7
.45
3
.329 .886
Tango 4.34 .03
0
.620 .10
7
.366 .095 4.32 .03
1
.65
0
.51
6
.712 .906
Youtube 4.33 .02
9
.599 .00
8
.412 .000 .480 .02
0
.42
8
.91
1
.131 .828
Viber 4.32 .03
1
.642 .29
0
.436 .000 4.65 .02
5
.53
3
.17
3
.040 .004
Flickr 4.23 .03
2
.667 .00
0
.495 .000 4.06 .03
1
.64
6
.86
0
.249 .999
Google maps 4.21 .02
8
.598 .00
0
.830 .000 4.56 .02
9
.61
1
.36
5
.263 .408
Google mobile 4.17 .02
2
.469 .00
9
.763 .000 4.06
8
.02
3
.48
2
.52
4
.252 .042
Wikipedia
mobile
4.08 .02
8
.588 .63
7
.331 .101 4.23 .02
5
.53
4
.50
1
.954 .530
Instagram 3.99 .03
8
.790 .03
0
.939 .001 4.56 .03
2
.66
8
.36
5
.543 .525
Kik 3.54 .04
9
1.02
0
.01
2
.081 .000 4.54 .03
3
.69
3
.38
8
.431 .670
RQ6. Which tasks do students at SVU’s DLIS on smart phone apps?
International Journal of Internet Education http://ijie.journals.ekb.eg/ December, 2016 ISSN: 1687-6482
International Journal of Internet Education
http://ijie.journals.ekb.eg/ Page 49
Students were asked to report their level of the importance of the tasks done on apps. As shown in Table
XX., findings revealed that the highest level of importance was “sending and receiving messages” and
“following the news”. In detail, 100 of students indicate that “Sending and receiving messages” and
“Following the news” are at least important to them, followed by “Making communications (99.5%),
“Making chat” (99.4%), “Making friends” (99.3%), “Finding specific information” (97.7%), “Finding
general information” (97.7%), “Making discussion groups” (97.5%), “Wasting time” (78.4%), “Playing
games” (73.4%), “Completing class assignments” (62.3%), “Checking materials related to courses”
(58.7%), “Doing business” (56%), “Seeking jobs” (54.4%), “Watching movies” (39.2%), “Listening to
music” (15.9%), “Accessing library services” (6.6%) and “Dating someone” (1.6%).
Table XX.
Tasks done on apps by smart phone users
Tasks done on smart phone apps
Very
important
(%)
Importa
nt
(%)
Somewhat
important
(%)
Not
important
(%)
Sending and receiving messages 94.6 5.4 0 0
Following the news 82.3 17.7 0 0
Finding general information 74.1 23.6 2.3 0
Finding specific information related
to courses
70.7 27 2.3 0
Making friends 63 36.3 .7 0
Making a chat 63 36.3 .7 0
Making communications 61.9 37.6 .5 0
Making discussion groups 58.5 39 2.5 0
Wasting time 44.7 33.6 15.6 5.9
Playing games 34.7 38.5 21.1 5.4
Watching movies/videos 16.3 22.9 36.3 24.5
Checking materials related to courses,
grades, etc.
5.4 53.3 40.1 1.1
Listening to music 5.2 10.7 48.3 35.8
Completing class assignments 5 57.4 37.6 0
Doing business 5 51 43.1 .9
Seeking jobs 4.1 50.3 44 1.6
Accessing library services .9 5.7 46.3 47.2
Dating someone .2 1.4 32.2 66.2
Through One-Way ANOVA, the study revealed that there is a statistically significant difference at the
p>.05 level between the age of students and tasks done on apps, such as finding general information (p =
.005), finding specific information (p = .011), watching movies (p = .004), listening to music (p = .039)
and accessing library services (p = .006). There is also a statistically significant difference between the
students‟ gender and tasks done on apps, such as completing class assignments (p = .019), checking
materials related to courses (p = .045), seeking jobs (p = .020) and dating someone (p = .001). The study
also found that there is a statistically significant difference between the students‟ class standing and their
tasks done on apps, such as finding general information (p = .000), finding specific information (p =
.000), making discussion groups (p = .035), wasting time (p = .000) and playing games (p = .000),
seeking jobs (p = .021), dating someone (p = .008), wasting time (p = .000), playing games (p = .000),
watching movies (p = .000), listening to music (p = .000) and accessing library services (p = .001) (Table
XXI).
International Journal of Internet Education http://ijie.journals.ekb.eg/ December, 2016 ISSN: 1687-6482
International Journal of Internet Education
http://ijie.journals.ekb.eg/ Page 50
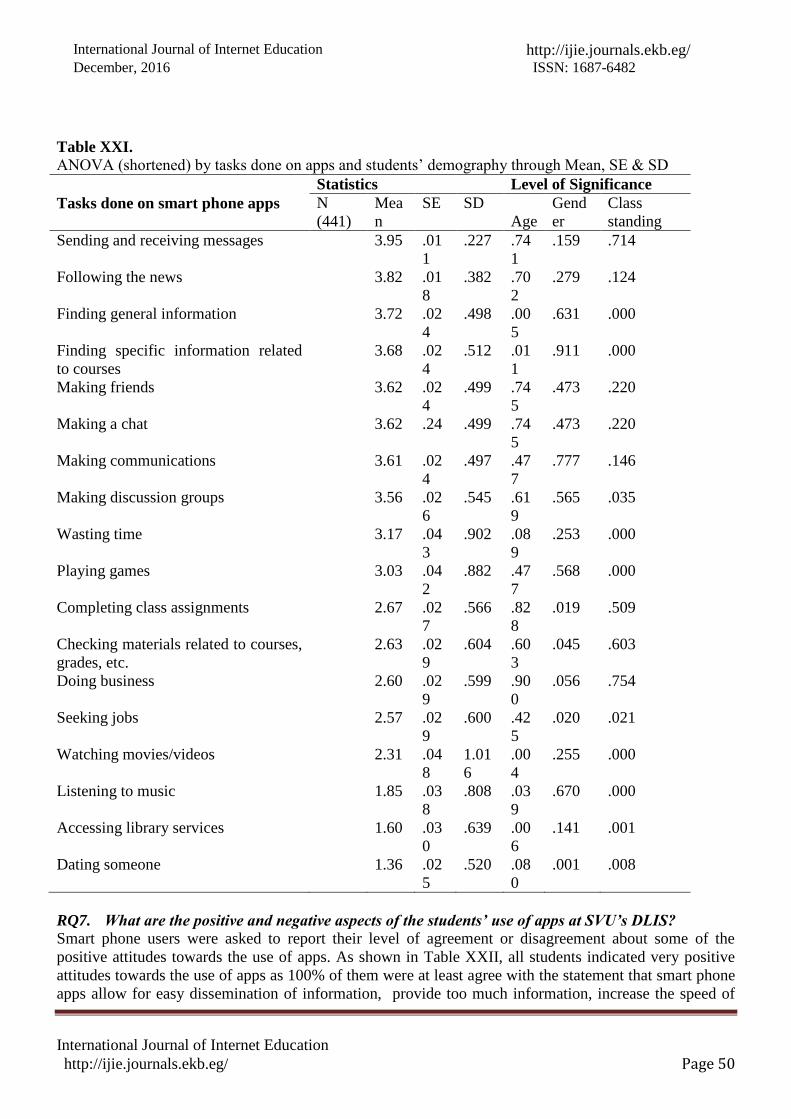
Table XXI.
ANOVA (shortened) by tasks done on apps and students‟ demography through Mean, SE & SD
Statistics Level of Significance
Tasks done on smart phone apps N
(441)
Mea
n
SE SD
Age
Gend
er
Class
standing
Sending and receiving messages 3.95 .01
1
.227 .74
1
.159 .714
Following the news 3.82 .01
8
.382 .70
2
.279 .124
Finding general information 3.72 .02
4
.498 .00
5
.631 .000
Finding specific information related
to courses
3.68 .02
4
.512 .01
1
.911 .000
Making friends 3.62 .02
4
.499 .74
5
.473 .220
Making a chat 3.62 .24 .499 .74
5
.473 .220
Making communications 3.61 .02
4
.497 .47
7
.777 .146
Making discussion groups 3.56 .02
6
.545 .61
9
.565 .035
Wasting time 3.17 .04
3
.902 .08
9
.253 .000
Playing games 3.03 .04
2
.882 .47
7
.568 .000
Completing class assignments 2.67 .02
7
.566 .82
8
.019 .509
Checking materials related to courses,
grades, etc.
2.63 .02
9
.604 .60
3
.045 .603
Doing business 2.60 .02
9
.599 .90
0
.056 .754
Seeking jobs 2.57 .02
9
.600 .42
5
.020 .021
Watching movies/videos 2.31 .04
8
1.01
6
.00
4
.255 .000
Listening to music 1.85 .03
8
.808 .03
9
.670 .000
Accessing library services 1.60 .03
0
.639 .00
6
.141 .001
Dating someone 1.36 .02
5
.520 .08
0
.001 .008
RQ7. What are the positive and negative aspects of the students’ use of apps at SVU’s DLIS?
Smart phone users were asked to report their level of agreement or disagreement about some of the
positive attitudes towards the use of apps. As shown in Table XXII, all students indicated very positive
attitudes towards the use of apps as 100% of them were at least agree with the statement that smart phone
apps allow for easy dissemination of information, provide too much information, increase the speed of

International Journal of Internet Education http://ijie.journals.ekb.eg/ December, 2016 ISSN: 1687-6482
International Journal of Internet Education
http://ijie.journals.ekb.eg/ Page 51
finding information, help communication, convenient, secure, build confidence and reduce paper use. Of
the 441 students, 39% indicated that they have at least agreed that these apps are credible, followed by
38% as agree, 28% as no strong opinion, 21.1% as disagree and 11.8% as strongly disagree.
Table XXII.
Positive statements about the use of smart phone apps by students
Positive statement about smart
phone apps
Strongly
agree
(%)
Agre
e
(%)
No strong
opinion
(%)
Disagr
ee
(%)
Strongly
disagree
(%)
provide too much information 45.4 54.6 0 0 0
reduce paper use 44.7 55.3 0 0 0
are secure 43.5 56.5 0 0 0
allow for easy dissemination of
information
42.6 57.4 0 0 0
build confident 41.7 58.3 0 0 0
are convenient 41.5 58.5 0 0 0
help communication 41 59 0 0 0
increase the speed of finding
information
39.5 60.5 0 0 0
are credible .7 38.3 28.1 21.1 11.8
Through One-Way ANOVA, the study revealed that there is no a statistically significant difference at the
p>.05 level between the demographic characteristics of students (age, gender & class standing) and their
positive attitudes towards the use of smart phone apps (Table XXIII).
Table XXIII.
ANOVA (shortened) by positive statements about smart phone apps & students‟ demography through
Mean, SE & SD
Positive statements
about the use of smart phone
apps
Statistics Level of Significance
N
(441)
Mea
n
SE SD
Age
Gend
er
Class
standing
provide too much information 4.45 .24 .49
8
.27
6
.675 .861
reduce paper use 4.45 .02
4
.49
8
.58
9
.339 .795
are secure 4.44 .02
4
4.9
6
.43
9
.915 .944
allow for easy dissemination of
information
4.43 .02
4
.49
5
.44
0
.960 .926
build confident 4.42 .02
4
.49
4
.72
7
.491 .829
help communication 4.41 .02
3
.49
2
.27
5
.620 .325
are convenient 4.41 .02
3
.49
3
.31
6
.863 .841
increase the speed of finding
information
4.39 .02
3
.48
9
.53
0
.884 .877
are credible 2.95 .05 1.0 .23 .446 .722
International Journal of Internet Education http://ijie.journals.ekb.eg/ December, 2016 ISSN: 1687-6482
International Journal of Internet Education
http://ijie.journals.ekb.eg/ Page 52
0 4 9
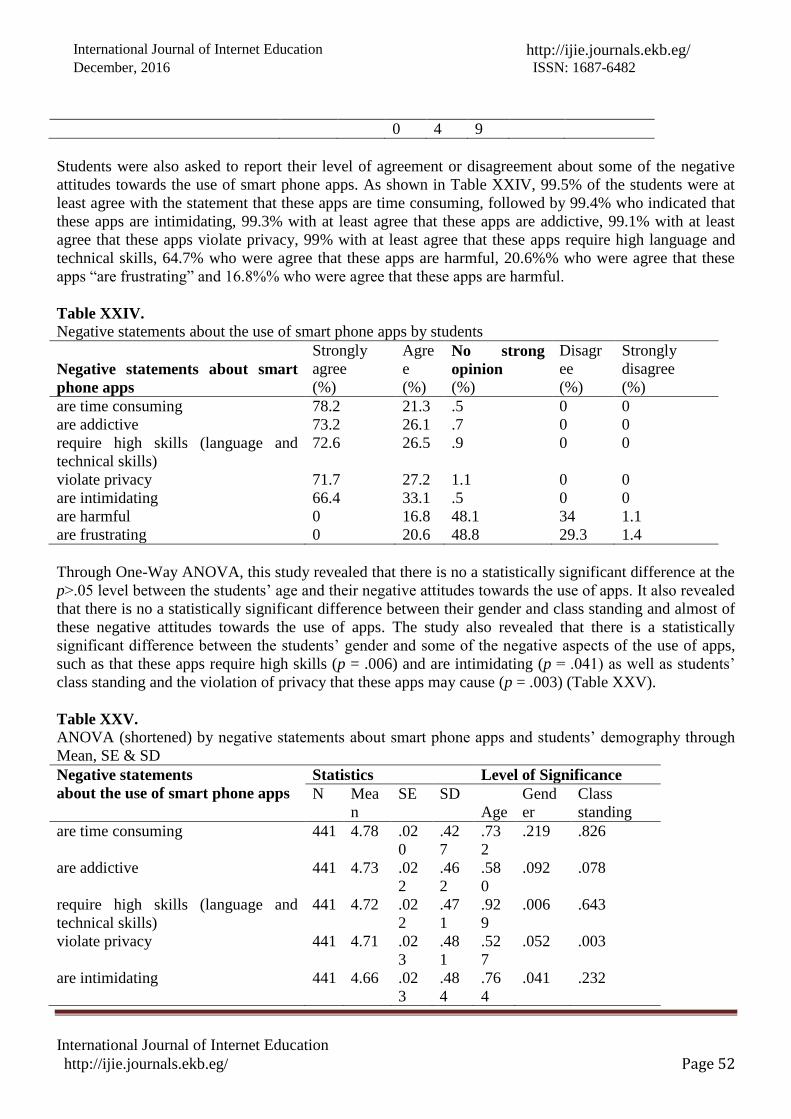
Students were also asked to report their level of agreement or disagreement about some of the negative
attitudes towards the use of smart phone apps. As shown in Table XXIV, 99.5% of the students were at
least agree with the statement that these apps are time consuming, followed by 99.4% who indicated that
these apps are intimidating, 99.3% with at least agree that these apps are addictive, 99.1% with at least
agree that these apps violate privacy, 99% with at least agree that these apps require high language and
technical skills, 64.7% who were agree that these apps are harmful, 20.6%% who were agree that these
apps “are frustrating” and 16.8%% who were agree that these apps are harmful.
Table XXIV.
Negative statements about the use of smart phone apps by students
Negative statements about smart
phone apps
Strongly
agree
(%)
Agre
e
(%)
No strong
opinion
(%)
Disagr
ee
(%)
Strongly
disagree
(%)
are time consuming 78.2 21.3 .5 0 0
are addictive 73.2 26.1 .7 0 0
require high skills (language and
technical skills)
72.6 26.5 .9 0 0
violate privacy 71.7 27.2 1.1 0 0
are intimidating 66.4 33.1 .5 0 0
are harmful 0 16.8 48.1 34 1.1
are frustrating 0 20.6 48.8 29.3 1.4
Through One-Way ANOVA, this study revealed that there is no a statistically significant difference at the
p>.05 level between the students‟ age and their negative attitudes towards the use of apps. It also revealed
that there is no a statistically significant difference between their gender and class standing and almost of
these negative attitudes towards the use of apps. The study also revealed that there is a statistically
significant difference between the students‟ gender and some of the negative aspects of the use of apps,
such as that these apps require high skills (p = .006) and are intimidating (p = .041) as well as students‟
class standing and the violation of privacy that these apps may cause (p = .003) (Table XXV).
Table XXV.
ANOVA (shortened) by negative statements about smart phone apps and students‟ demography through
Mean, SE & SD
Negative statements
about the use of smart phone apps
Statistics Level of Significance
N Mea
n
SE SD
Age
Gend
er
Class
standing
are time consuming 441 4.78 .02
0
.42
7
.73
2
.219 .826
are addictive 441 4.73 .02
2
.46
2
.58
0
.092 .078
require high skills (language and
technical skills)
441 4.72 .02
2
.47
1
.92
9
.006 .643
violate privacy 441 4.71 .02
3
.48
1
.52
7
.052 .003
are intimidating 441 4.66 .02
3
.48
4
.76
4
.041 .232
International Journal of Internet Education http://ijie.journals.ekb.eg/ December, 2016 ISSN: 1687-6482
International Journal of Internet Education
http://ijie.journals.ekb.eg/ Page 53
are frustrating 441 2.89 .03
5
.73
6
.29
5
.534 .598
are harmful 441 2.80 .03
4
.71
9
.23
5
.703 .952
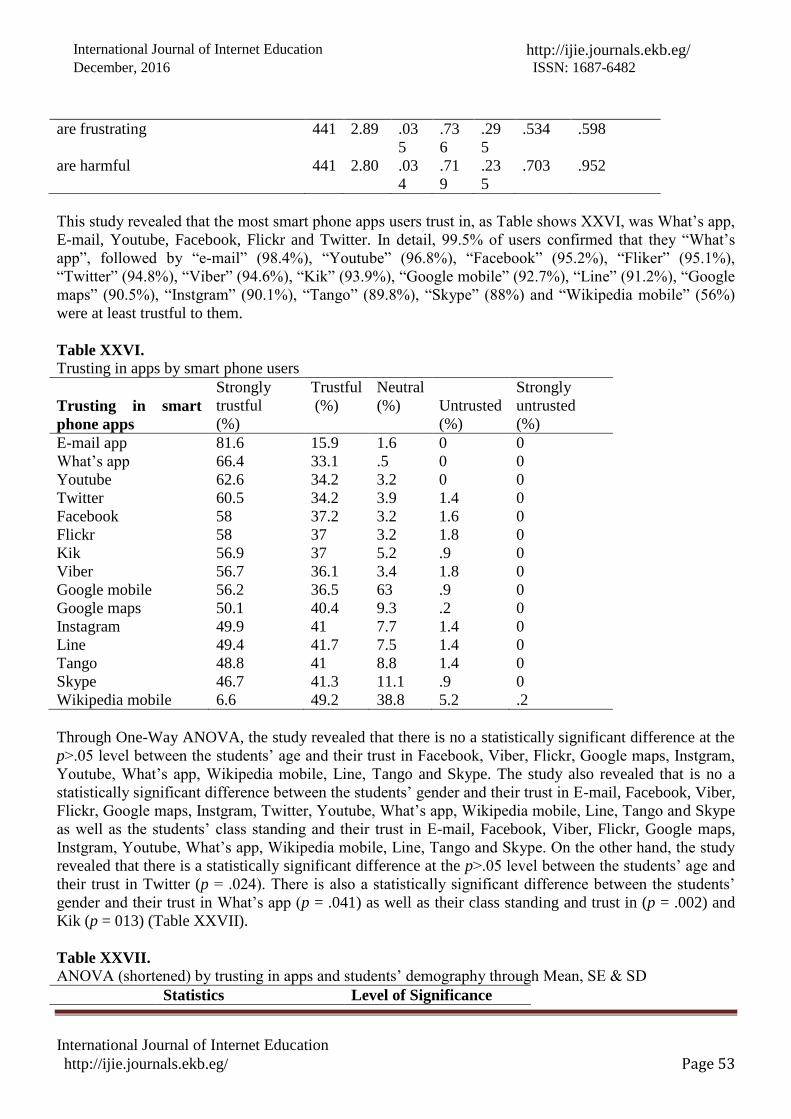
This study revealed that the most smart phone apps users trust in, as Table shows XXVI, was What‟s app,
E-mail, Youtube, Facebook, Flickr and Twitter. In detail, 99.5% of users confirmed that they “What‟s
app”, followed by “e-mail” (98.4%), “Youtube” (96.8%), “Facebook” (95.2%), “Fliker” (95.1%),
“Twitter” (94.8%), “Viber” (94.6%), “Kik” (93.9%), “Google mobile” (92.7%), “Line” (91.2%), “Google
maps” (90.5%), “Instgram” (90.1%), “Tango” (89.8%), “Skype” (88%) and “Wikipedia mobile” (56%)
were at least trustful to them.
Table XXVI.
Trusting in apps by smart phone users
Trusting in smart
phone apps
Strongly
trustful
(%)
Trustful
(%)
Neutral
(%)
Untrusted
(%)
Strongly
untrusted
(%)
E-mail app 81.6 15.9 1.6 0 0
What‟s app 66.4 33.1 .5 0 0
Youtube 62.6 34.2 3.2 0 0
Twitter 60.5 34.2 3.9 1.4 0
Facebook 58 37.2 3.2 1.6 0
Flickr 58 37 3.2 1.8 0
Kik 56.9 37 5.2 .9 0
Viber 56.7 36.1 3.4 1.8 0
Google mobile 56.2 36.5 63 .9 0
Google maps 50.1 40.4 9.3 .2 0
Instagram 49.9 41 7.7 1.4 0
Line 49.4 41.7 7.5 1.4 0
Tango 48.8 41 8.8 1.4 0
Skype 46.7 41.3 11.1 .9 0
Wikipedia mobile 6.6 49.2 38.8 5.2 .2
Through One-Way ANOVA, the study revealed that there is no a statistically significant difference at the
p>.05 level between the students‟ age and their trust in Facebook, Viber, Flickr, Google maps, Instgram,
Youtube, What‟s app, Wikipedia mobile, Line, Tango and Skype. The study also revealed that is no a
statistically significant difference between the students‟ gender and their trust in E-mail, Facebook, Viber,
Flickr, Google maps, Instgram, Twitter, Youtube, What‟s app, Wikipedia mobile, Line, Tango and Skype
as well as the students‟ class standing and their trust in E-mail, Facebook, Viber, Flickr, Google maps,
Instgram, Youtube, What‟s app, Wikipedia mobile, Line, Tango and Skype. On the other hand, the study
revealed that there is a statistically significant difference at the p>.05 level between the students‟ age and
their trust in Twitter (p = .024). There is also a statistically significant difference between the students‟
gender and their trust in What‟s app (p = .041) as well as their class standing and trust in (p = .002) and
Kik (p = 013) (Table XXVII).
Table XXVII.
ANOVA (shortened) by trusting in apps and students‟ demography through Mean, SE & SD
Statistics Level of Significance

International Journal of Internet Education http://ijie.journals.ekb.eg/ December, 2016 ISSN: 1687-6482
International Journal of Internet Education
http://ijie.journals.ekb.eg/ Page 54
Trusting in
apps
N
(441)
Mea
n
SE SD
Age
Gend
er
Class
standing
E-mail app 5.26 .22
8
4.7
83
.89
1
.400 .292
What‟s app 4.66 .02
3
.48
4
.76
4
.041 .232
Youtube 4.59 .02
9
.55
3
.16
2
.440 .344
Twitter 4.54 .03
0
.63
9
.02
4
.363 .002
Facebook 4.52 .03
0
.64
0
.40
7
.979 .554
Viber 4.52 .03
1
.65
4
.78
1
.842 .465
Flickr 4.51 .03
1
.65
0
.32
6
.225 .499
Kik 4.50 .03
0
.64
0
.40
0
.481 .013
mobile
4.48 .03
1
.65
7
.06
6
1.000 .114
Google maps 4.40 .03
2
.66
4
.30
3
.507 .846
Instagram 4.39 .03
3
.69
0
.69
2
.334 .090
Line 4.39 .03
3
.68
6
.40
6
.764 .686
Tango 4.39 .03
3
.70
2
.67
9
262 .074
Skype 4.34 .03
4
.70
8
.32
9
.246 .255
Wikipedia
mobile
3.57 .03
4
.68
9
.28
2
.476 .116
RRQ8. What are the most significant barriers that affect both use and non-use of apps students at
SVU’s DLIS?
Students were asked to report their level, among four scales given to them, of barriers that may affect
their use of apps. They have given many varied answers ranging from “not significant” to “very
significant”. As shown in Table XXVIII, findings revealed that 51.9% of users indicated that the lack of
“training to use different apps” and “ appropriate smart phone apps” were not significant to them,
followed by “Lack of the awareness of apps” (50.3%), “Lack of time needed to access apps” (49.7%),
“Lack of language and technical skills needed for some apps” (48.8%), “Lack of the connection to the
Internet needed to access apps” (48.3%,), “Lack of the knowledge about apps” (47.6%) and “Lack of
adequate funds needed to get business apps” (46.9%).
Table XXVIII.
Barriers to use smart phone apps by smart phone users
Barriers to use smart phone apps
Very
significant
Significa
nt
Somewhat
significant
Not
significant

International Journal of Internet Education http://ijie.journals.ekb.eg/ December, 2016 ISSN: 1687-6482
International Journal of Internet Education
http://ijie.journals.ekb.eg/ Page 55
(%) (%) (%) (%)
Lack of training to use different apps 0 9.8 38.3 51.9
Lack of appropriate apps 0 9.3 38.8 51.9
Lack of the awareness of apps 0 10.9 38.8 50.3
Lack of time needed to access apps 0 11.1 39.2 49.7
Lack of language and technical skills needed
for some apps
0 10.9 40.4 48.8
Lack of the connection to the Internet needed
to access apps
0 11. 40.6 48.3
Lack of the knowledge about apps 0 11.3 41 47.6
Lack of adequate funds needed to get
business apps
0 11.8 41.3 46.9
Through One-Way ANOVA, the study revealed that there is no a statistically significant difference at the
p>.05 level between the demographic characteristics (age and gender) of users and barriers to use apps.
There is only a statistical relation between their class standing and training about the use of apps (p =
.007). On the other hand, there is a statistically significant difference at the p>.05 level between the age of
smart phone apps non-users and adequate funds to get non-free apps (p = .003), time to access apps (p =
.016), training about using apps (p = .000) and appropriate apps (p = .021). There is also a statistically
significant difference at the p>.05 level between the class standing of smart phone non-users and barriers
to use apps, such as adequate funds (p = .007), knowledge about apps (p = .023), connection to the
Internet (p = .018) and training about using apps (p = .000). (Table XXIX).
Table XXIX.
ANOVA (shortened) by Barriers to use apps and students‟ demography through Mean, SE & SD
Barriers are due
to lack of
Smart phone apps users Smart phone apps non-users
Statistics Sig. Statistics Sig.
N
(4
41
) Mean
S
D Age
Ge
nde
r
Class
standing
N
(92
)
Mea
n
S
D Age
Gen
der
Class
standin
g
Adequate funds to
get non-free apps
1.65 .6
8
2
.580 .95
2
.840 3.17 .7
35
.00
3
.981 .007
The knowledge
about apps
1.64 .6
7
7
.103 .97
7
.506 2.63 .5
69
.09
3
.765 .023
The connection to
the Internet
1.63 .6
7
6
.195 .94
1
.505 2.95 .6
35
.11
1
.100 .018
language &
technical skills
1.62 .6
7
4
.353 .34
6
.350 2.73 .6
65
.05
5
.255 .138
The awareness
about apps
1.61 .6
7
6
.321 .58
8
.667 2.59 .5
96
.52
0
.260 .240
Time to access
apps
1.61 .6
7
.613 .82
0
.960 2.17 .5
26
.01
6
.667 .292

International Journal of Internet Education http://ijie.journals.ekb.eg/ December, 2016 ISSN: 1687-6482
International Journal of Internet Education
http://ijie.journals.ekb.eg/ Page 56
8
Training about
using apps
1.58 .6
6
3
.103 .64
6
.007 2.87 .7
59
.00
0
.570 .000
Appropriate apps 1.57 .6
5
7
.271 .97
0
.703 2.30 .6
07
.02
1
.133 .054
Discussions and conclusions
This study, which is the first of its kind about university students in Egypt, tried to investigate the usage
patterns and ownership of smart phone apps among students at the Library and Information Science
(DLIS), the South Valley University (SVU). Based on the results of this study, smart phone users (82.7%)
at SVU‟s DLIS tended to be females aged between twenty one and twenty two years, and mostly junior
students. On the other hand, smart phone non-users (17.3%) tended to be also females aged between
nineteen and twenty years, and mostly sophomore students. These findings are highly consistent with
other surveys, such as Pearson Student Mobile Device Survey (2014), which showed that female students
dominate smart phones use. Before moving to the profile of smart phone users, the researcher would like
to draw attention to the reasons that led to the non-use of smart phone apps by some of the sampled
students at SVU‟s DLIS. Time to access these apps, followed by inadequate funds needed to get business
apps, the connection to the Internet, training about using apps, language & technical skills, knowledge
and awareness about apps as well as appropriate apps respectively, were at least significant to not use
these apps among 92 (17.3%) students of the total sample.
This study revealed a widespread use of smart phone apps by 441 (82.7%) of students who were using
smart phone apps. It is worthy mentioning that Egypt is ranked 19th globally in terms of possession of
individuals with mobile phones. According to the Ministry of Communications and Information
Technology (2012), the number of mobile subscriptions in Egypt reached 92.640.000 mobile users till
July 2012. This means that the number of subscribers is greater than the number of people who up to
80.471.8690! However, smart phones make up 8.4% of all mobile phone handsets in Egypt (Vallabhan,
2012). Such a high percentage in the use of smart phones among students at SVU‟s DLIS is very highly
consistent with other relevant surveys, such as UCAS Media survey, conducted in 2014, and Pearson
Student Mobile Device Survey, conducted by Harris Poll in 2014, which revealed that 82% and 83%,
respectively, of college students own smart phones. The highest percentage of smart phone users
indicated that they had been using smart phones for four to five years. This may indicate that they have
caught up with the beginnings of these devices in Egypt, which is witnessing a big demand in the sale of
these devices and prepared by some specialists as a promising market in this regard. The largest number
of students was described to be advanced users who heard first about these mobile devices through
friends and the Web being one of the most ways to access Mobile Internet Technologies (MITs).
Consistent with Yavari et al. (2009), the most frequent location of students‟ access to these apps was from
home/dormitory and University campus, where the availability of information networks, particularly Wi-
Fi networks. Consistent with Alfawareh and Jusoh (2014), Song and Lee (2012) and Pearson Student
Mobile Device Survey (2014), this study showed that a majority of smart phone users were using a single
smart phone device and a few of them were just using two devices, and the most predominant and popular
brand they own was Android, followed by iPhone, Blackberry and Windows. Although the price of these
devices is relatively expensive in Egypt, but they are available in abundance, particularly Android devices
like Samsung. The highest percentage of smart phone users indicated that they have from 21 to 25 apps
followed by 11 to 20 apps and 26 to 30 apps. A very few number of them indicated that they have more
31 apps. Such a number is highly consistent with the world's average number (26) of downloaded apps
by smart phone users (Michael, 2013). Regarding the usage patterns of smart phones among library and

International Journal of Internet Education http://ijie.journals.ekb.eg/ December, 2016 ISSN: 1687-6482
International Journal of Internet Education
http://ijie.journals.ekb.eg/ Page 57
information science students, the findings of this study are highly consistent with the findings of Adomi‟s
study (2006) as the two studies revealed that a majority of the students were using apps mainly for
making communication with their family and friends as well as sending and receiving messages.
A large number of smart phone users at SVU‟s DLIS have been described to make excessive use of social
apps, such as communication apps, messaging/texting apps and social networking sites, which were at the
forefront of use. Other apps, such as entertainment apps, news apps, games apps, multimedia apps,
education apps, health apps and Business apps respectively were also found to be mostly used by
students. Chen and Denoyelles (2013) revealed that most popular apps favorited by university students
were social networking, music, games, navigation, entertainment, photography, news, university apps,
books, reference and productivity. „The popularity of mobile devices among students and the availability
of touch screen devices make mobile devices an ideal avenue for delivering content that can be accessed
anywhere and everywhere, on the go” (TsoI and Dekhane, 2011, P. 543). For some students, smart
phones have become a necessity and an addictive tool. In this regard, Baghianimoghadam et al. (2013)
showed that nearly a quarter of students had tried to decrease their use of these devices, but were
unsuccessful! Smart phone users in this study spend an average of five hours per day on using these apps,
especially social networking apps. Such use per hours is close to the international trend, as some previous
studies, such as Uys et al. (2012), showed that the average hours spent by students on their smart phones
communicating and interacting with others was five hours per day.
A large number of smart phone users at SVU‟s DLIS widely adopted these devices, especially for
communication purposes as most of the apps were described to be communication apps. The most used
apps were Facebook, E-mail, Twitter, What‟s app, Youtube and Viber. Such use is very much moderate
compared to other similar studies, such as the study of Dresselhaus and Shrode (2012), which helped to
gain insight into where students stand regarding their use of mobile devices for academic activities in
general and their desire for access to library resources and services in particular. However, such use is
consistent with UCAS Media survey (2014), which indicated that nearly 60% of university students use
their smart phones more to access social media. Smart phone users at SVU‟s DLIS used smart phones
more for communication purposes than learning purposes. While these findings are not consistent with
the study of Bomhold (2013), which indicated that students do use smart phone apps for more than
communication and entertainment, where a significant number of them disclose using apps to find
academic information on academic web sites using related search engines, they are consistent with the
findings of Bicen and Kocakoyun (2013) and White and Mills‟s study (2012), which showed that students
are increasingly adopting these mobile devices for communication purposes, but they are still reluctant to
use them for educational purposes. However, this study revealed that some of SVU‟s DLIS students were
using some of apps related to educational purposes, such as Google mobile, Facebook, E-mail, Twitter,
Youtube, Wikipedia mobile and Instgram, but not on a regular basis. Sometime the academic institutions
and libraries, as the case of SVU‟s libraries, fail to meet the needs of their patrons regarindg some
specific information. Due to these failure and constraints, Anyanwu, Ossai-Onah and Nse (2012) showed
that students using the libraries were using their smart phones for research occasionally. Findings also
revealed that students were pushed to use smart phone devices for some reasons, such as the lack of
relevant information sources in libraries, saving of time and cost of travelling to other libraries for
research, low level of satisfaction derived from available resources as well as the lack of Internet facilities
in libraries. While Abdul Karim, Darus and Hussin (2006) revealed that students‟ perceptions on the
application of wireless hand services in the context of library and information services were found to be
very positive, this study revealed, consistent with the study of Shonola and Joy (2014), that SVU‟s
libraries, especially the DLIS‟s library, lack to services related to the use of mobile devices in terms of the
lack of information infrastructure and communication network, such as Wi-Fi networks as well as
inadequate fundings and regulatory issues.

International Journal of Internet Education http://ijie.journals.ekb.eg/ December, 2016 ISSN: 1687-6482
International Journal of Internet Education
http://ijie.journals.ekb.eg/ Page 58
Smart phone users‟ perceive of ease and usefulness of the use of smart phone devices was noticeably.
They indicated that the use of E-mail app, Google mobile, Facebook app What‟s apps, Kik, Twitter,
Youtube, Google maps, Viber, Line, Skype, Tango, Instgram, Flickr and Wikipedia mobile, respectively,
were found to be at least fairly easy to them. According to Davis (1989), perceived ease of use has been
found to influence the usage of electronic devices, such as the computer. The easier a system is to use, the
less effort will be needed to do tasks. In the context of smart phone devices, we can propose that if they
are easy to use, they require less effort on the part of users, thereby increasing the likelihood of their
adoption and usage. Bicen and Kocakoyun (2013) revealed that is the ease of using smart phones apps is
the most important reason why users use these mobile devices. Additionally, smart phone users in this
study indicated that the use of E-mail app Google mobile, What‟s app, Facebook, Youtube, Twitter,
Viber, Instgram, Wikipedia mobile, Google maps, Kik, Skype, Line, Tango and Flickr, respectively, at
least fairly useful to them, especially for the purpose of socialization more than learning. To some extent,
this finding is confirmed by the study of Rhema and Sztendur (2013), which revealed that students
perceive smart phones as a useful tool, but more for their supporting learning.
The main tasks done on smart phone devices by students at SVU‟s DLIS were for socializing. Students
indicated that popular tasks and activities, such as sending and receiving messages, following the news,
making communications, making chat, making friends, finding specific information, finding general
information, making discussion groups, playing games, completing class assignments, checking materials
related to courses, doing business, seeking jobs, watching movies, listening to music, accessing library
services are important tasks accomplished by them through the use of these devices. Sharing Heo et al.
(2010), most apps used by students at SVU‟s DLIS range from navigation software, services providing
news and weather feeds, entertainment and games to apps allowing users to access internet services such
as email, Wikipedia, YouTube, Facebook and other social networking apps. Such apps, which are known
as mobile social networking apps, allow students to connect with each other as well as with others like
family, relatives and friends. Sharing White and Mills‟s study (2012), which revealed that students‟
attitudes towards the use of smart phone apps, especially for learning purposes have become more
positive, the current study indicated very positive attitudes towards the use of these apps. Students have at
least agreed with the statement that smart phone apps allow for easy dissemination of information,
provide too much information, increase the speed of finding information, help communication,
convenient, secure, build confident and reduce paper use. However, a large number of students agreed
also at least with the statement that these apps are time consuming, intimidating, addictive, violate
privacy, require high language and technical skills, harmful and frustrating. Almost all students confirmed
that they are at least trustful in some apps, such as What‟s app, E-mail, Youtube, Facebook, Flickr,
Twitter, and Viber.
Barriers related to training to use apps, appropriate apps, lack of the awareness of apps, lack of time
needed to access apps, lack of language and technical skills needed for some apps, lack of the connection
to the Internet needed to access apps, lack of the knowledge about apps and lack of adequate funds
needed to get business apps were at least significant to smart phone users when accessing and using these
apps. Despite such barriers do not seem to prevent smart phone users using these apps for socializing,
they might prevent them from employing these apps for other purposes like educational and academic
purposes. “While there are many positives to the use of smart phones for educational purposes, there are
still several obstacles to the implementation of mobile technology in the classroom”. (White & Mills,
2012). Anyanwu, Ossai-Onah and Nse (2012) found that students were pushed to use mobile devices,
particularly smart phones, for some reasons, such as the lack of relevant information sources in libraries,
saving of time and cost of travelling to other libraries for research, low level of satisfaction derived from
available resources as well as the lack of Internet facilities in libraries. On the other hand, there were also
barriers related to the use of smart phones, such as the high cost of downloading online resources,

International Journal of Internet Education http://ijie.journals.ekb.eg/ December, 2016 ISSN: 1687-6482
International Journal of Internet Education
http://ijie.journals.ekb.eg/ Page 59
incompatibility of software/format of online resources as well as insecurity of sites, which causes
damages to the phones.
Recommendations for further research
The findings of this study revealed several areas that need to be addressed by further studies. Such
findings may be used as a foundation for other researchers who wish to study how MITs are used among
university students, especially LISs‟ students. As much as possible, the researcher of this study tried to
investigate all characteristics and aspects of using such kind of mobile technologies among students at
SVU‟s DLIS that may affect their use. However, sharing Alfawareh and Jusoh (2014)‟s
recommendations, further studies are still needed to examine more additional characteristics of using
these mobile devices, particularly for academic practice. Really, there is a need to better understand how
these mobile devices can be used to contribute to student learning. This study tried to investigate
students‟ perceptions towards the use of smart phone apps in general. However, further research may be
needed to specify the relationship between the students‟ use of these apps and their academic
performance.
Since some of the students surveyed in this study, especially those who were described as smart phone
non-users, lacked awareness and knowledge about the capabilities and benefits of these devices, they
should be provided with a convenient environment to encourage and motivate towards their use. Further
research needed to examine the digital divide between smart phone non-users and users and to study why
such disparity exists and possible solutions that could reduce this gap. In this regard SVU‟s DLIS should
create a non-threatening environment to reduce students‟ anxiety about the use of such mobile devices,
offer Mobile Internet Technologies (MITs) literacy courses and design training workshop to use these
tools effectively. Similarly, SVU‟s libraries should design and provide students with facilities to use
mobile devices. This is in turn may encourage mobile learning, which helps students personalize their
smart phones to fit their interactions with others. In this regard, further research is needed to discover the
possibility of the integration of mobile technologies in education and library-related activities.
Dresselhaus and Shrode (2012) tried to explore the extent to which libraries offer mobile access, their
future plans for mobile implementation and their opinions about whether and how mobile technologies
may be useful to library patrons. Students should also be provided with the necessary assistance to
improve and promote their language and computer skills towards such usage. This study also
recommends using smart phone apps, especially education apps, as a teaching tool to host learning-related
materials and activities. Additionally, future studies may compare experiences of instructors and students
regarding the use of SNSs in educational practices. Furthermore, new studies may look at how
communicational uses of social networks have influenced educational uses.
Since this study is the first one of its type conducted about the usage of smart phones by students at a
library school by one of Egyptian library schools (n=17), and in the light of its descriptive nature, the
research methodology used in this study may be the most suitable research method to reach the
population of the study. However, for further research examining and investigating more specific
information about such or related topics, other research methods, such as qualitative and experimental
research, could be designed and conducted to measure the effectiveness of mobile learning in various
disciplines. Lastly, this survey research has its limitations; the sample included undergraduate students at
only one university in Egypt. Future research could focus on varied contexts or samples, such as
graduates or postgraduates, regions or countries.
International Journal of Internet Education http://ijie.journals.ekb.eg/ December, 2016 ISSN: 1687-6482
International Journal of Internet Education
http://ijie.journals.ekb.eg/ Page 60
References
Abdul Karim, N. Darus, S. and Hussin, R. (2006), “Mobile phone applications in academic library
services: a students‟ feedback survey”, Campus-Wide Information Systems, Vol. 23 No. 1, pp. 35-51.
Adomi, E. (2006), “Mobile phone usage patterns of library and information science students at Delta
State University, Abraka, Nigeria”, Electronic Journal of Academic and Special Librarianship, Vol. 7 no.
1, available at http://southernlibrarianship.icaap.org/content/v07n01/adomi_e01.htm (accessed 23
December 2014).
Alfawareh, H. and Jusoh, S. (2014), “Smartphones usage among university students: Najran university
case”, International Journal of Academic Research Part B, Vol. 6, pp. 321-326.
Anyanwu, E., Ossai-Onah, O. and Nse, J. (2012), “Use of mobile phones for research among
undergraduates in two polytechnic libraries in Imo State, Nigeria”, The Information Manager Vol. 12 No.
1&2, pp. 52-55.
Bae, J. and Kim, S. (2014), “Research on educational use of smart-phone applications with smart clicker
technique”, Lecture Notes in Electrical Engineering Vol. 279, pp. 597-602.
Baghianimoghadam, M., Shahbazi, H., Boroojeni, D. and Baghianimoghadam, B. (2013), “Attitude and
usage of mobile phone among students in Yazd University of medical science”, Iranian Red Crescent
Medical Journal, Vol. 15 No, pp. 752-754.
Bicen, H. and Kocakoyun, S. (2013), “The evaluation of the most used mobile devices applications by
students”, Procedia - Social and Behavioral Sciences, No. 89, pp. 756 – 760.
Bomhold, C. (2013), “Educational use of smart phone Technology. A survey of mobile phone application
use by
Chen, B. and Denovelles, A. (2013), “Exploring students' mobile learning practices in higher education”,
available at http://www.educause.edu/ero/article/exploring-students-mobile-learning-practices-higher-
education (accessed 1 February 2015).
Chen, J., Park, Y., & Putzer, G. J. (2010), “An examination of the components that increase acceptance of
smartphones among healthcare professionals”, Electronic Journal of Health Informatics, Vol. 5 No. 2, pp.
e16, pp. 1-12.
Chiu, D., Dukic, D. and Lo, P. (14), “Educational Use of Mobile Technologies Amongst Library &
Information Science (LIS) Students – a Comparative Study Between the University of Hong Kong and
the University of Tsukuba”, available at http://www.infotech.ac.cn/CN/.../downloadArticleFile.do?...
(accessed 11 March 2015).
Davis, F. (1989), “Perceived usefulness, perceived ease of use, and users acceptance of information
technology”, MIS Quarterly, 13, pp. 319-339.
Department of Library and Information Science (DLIS). (2014), “Faculty of Arts, available at
http://www.svu.edu.eg/faculties/arts/dep_Libraries.htm (accessed 11 March 2015).
Dresselhaus, A. and Shrode, F. (2012), “Mobile technologies & academics: Do students use mobile
technologies in their academic lives and are librarians ready to meet this challenge?”, Information
Technologies and Libraries, June, pp. 82-101.

International Journal of Internet Education http://ijie.journals.ekb.eg/ December, 2016 ISSN: 1687-6482
International Journal of Internet Education
http://ijie.journals.ekb.eg/ Page 61
Duffy MJ. (2011), ”Smartphones in the Arab spring. In: Steffens M, Smith R and McCombs A (eds) IPI
Report: Media and money. Vienna: International Press Institute, pp. 53-56.
Dahlstrom, E. (2012), ECAR Study of Undergraduate Students and Information Technology,
EDUCAUSE Center for Applied Research, 2012, available at
https://net.educause.edu/ir/library/pdf/ERS1208/ERS1208.pdf (accessed 9 March 2015).
Ecycle Best (2015), “Smartphones as Tools for Education: Getting Smart with Smartphones” available at
http://www.ecyclebest.com/resources/smartphones-as-tools-for-education (accessed 27 December 2014).
Encyclopedia2.thefreedictionary. (2015), “Smartphone app, available at
http://encyclopedia2.thefreedictionary.com/smartphone+app (accessed 3 March 2015).
Gay, L. R. (1992), “Educational Research, competencies for analysis and application”, (4th ed.). New
York: Macmillan.
Harris Poll. (2014), “Pearson student mobile device survey 2014”, available at
http://www.pearsoned.com/wp-content/uploads/Pearson-K12-Student-Mobile-Device-Survey-050914-
PUBLIC-Report.pdf (accessed 11 January 2015).
Heo, J. Terada, K.m Toyama, M. Kurumatani, S. Chen, E. (2010), “User demand prediction from
application usage pattern in virtual smart phone”, IEEE Second International Conference on Cloud
Computing Technology and Science, pp. 449-455.
Hwang, G., Chen, B., Chu, H., & Cheng, Z. S. (2012), “Development of a Web 2.0-based ubiquitous
learning platform for schoolyard plant identification. Paper presented at the 2012 Seventh IEEE
International Conference on Wireless, Mobile and Ubiquitous Technology in Education, available at
http://ieeexplore.ieee.org.lcproxy.shu.ac.uk/stamp/stamp.jsp?arnumber=06185043 (accessed 22 February
2015).
Infoplease. (2015), “Egypt”, available at http://www.infoplease.com/country/profiles/egypt.html
(accessed 23 January 2015).
Jamal, J. Sedie, R. Abdul Haleem, K. and Hafiz, N. (2012), “Patterns of use of „smart phones‟ among
female Medical students and self-reported effects”, Medical students and self-reported effects, Journal of
Taibah University Medical Sciences, Vol. 7, pp. 45-49.
Kerlinger, F. (1986), “Foundations of behavioral research”, New York: Holt, Rinehart and Winston.
Linsky, A. (1975), “Stimulating responses to mailed questionnaires: A review”, Journal of Marketing
Research, Vol. 12, pp. 440-453.
Mahmoodabad, S., Barkhordari, A., Nadrian, H., Moshiri, O. and Yavari, M. (2009), “Survey of
ownership and use of mobile phones among medical science students in Yazd. Pakistan”, Journal of
Biological Sciences, Vol. 12, pp. 1430-1433.
Michael, H. (2013), “The average global smartphone user has downloaded 26 apps”, available at
http://www.phonearena.com/news/The-average-global-smartphone-user-has-downloaded-26-
apps_id47160
Ministry of Communications and Information Technology. (2012), ICT Indicators in Brief: August 2012 |
Monthly Issue
Available at http://www.mcit.gov.eg/Upcont/Documents/Publications_1992012000_Eng%20Flyer-
August2012-last.pdf (accessed 11 March 2015).
Number of mobile app downloads worldwide from 2009 to 2017 (in millions), available at
http://www.statista.com/statistics/266488/forecast-of-mobile-app-downloads (accessed 30 January 2015).
Rhema, A. and Sztendur, E. (2013), “Using a mobile phone to support learning: Experiences of
engineering students in Libya”, Proceedings of Informing Science & IT Education Conference (InSITE)
pp. 215-238.
Richard, E. (2013), “The American college students cell phone survey”, College Student Journal, Vol. 47
No. 1, pp. 75-81.

International Journal of Internet Education http://ijie.journals.ekb.eg/ December, 2016 ISSN: 1687-6482
International Journal of Internet Education
http://ijie.journals.ekb.eg/ Page 62
Sakamura, K., and Koshizuka, N. (2005), “Ubiquitous computing technologies for ubiquitous learning”,
Proceeding of the International Workshop on Wireless & Mobile Technologies in Education, 11–18.
Seilhamer, R., Chen, B. and Sugar, A. (2013), "A framework for implementing mobile technology," in
Handbook of Mobile Learning, Z. Zane Berge and Lin Muilenburg, eds. (Routledge), pp. 382–394.
Shin, D., Shin, Y, Choo, H., & Beom, K. (2011), “Smartphones as smart pedagogical tools: Implications
for smartphones as u-learning devices”, Computers in Human Behavior, Vol. 27, No. 6, pp. 2207–2214.
Shonola, S. and Joy, M. (2014), “Barriers to m-learning in higher education institutions in Nigeria”,
Proceedings of ICERI2014 Conference17th-19th November 2014, Seville, Spain, pp. 3324-3332
Song, Y. and Lee, J. (2012), “Mobile device ownership among international business students: a road to
the ubiquitous library”, Reference Services Review, Vol. 40 No. 4, pp. 574-588.
South Valley University (SVU). (2014), available at http://www.svu.edu.eg/about/index.html (accessed
11 March 2015).
Srivastava, A. (2014), “2 billion smartphone users by 2015: 83% of Internet usage from mobiles [Study],
available at http://dazeinfo.com/2014/01/23/smartphone-users-growth-mobile-internet-2014-2017
(accessed 11 March 2015).
Tsoi, M. and Dekhane, S. (2011), “TsoiChem: A mobile application to facilitate student learning in
organic chemistry”, paper presented at the 11th IEEE International Conference on Advanced Learning
Technologies, Athens, GA.
UCAS. (2014), “Eight out of ten fresher‟s have smart phones: Does student marketing now mean mobile
marketing?” available at http://www.ucasmedia.com/2014/eight-out-ten-freshers-have-smartphones
(accessed 21 February 2015).
undergraduate university students”, Program: electronic library and information systems, Vol. 47 No. 4,
pp. 424-436.
UYS, W. et al. (2012), “Smartphone application usage amongst students at a South African University”,
IST-Africa 2012 conference proceedings. Paul cunningham and Miriam Cunningham (Eds). IIMC
International Information Management Corporation.
Vallabhan, C. (2012), “Smartphones make up 8.4% of Egypt's mobile phones”, available at
http://www.commsmea.com/12812-smartphones-make-up-84-of-egypts-mobile-phones (accessed 3
December 2012).
Viticci, F. (2012), “Apple reveals new „All-time top apps‟ following 25 billion downloads”, Macstories,
available at: www.macstories.net/news/apple-reveals-new-all-time-top-appsfollowing-25-billion-
downloads (accessed 3 December 2012).
White, J. and Mills, D. (2012), “Examining attitudes towards and usage of Smartphone technology among
Japanese university students studying EFL”, CALL-EJ, Vol. 15, pp.1-15.