u.s. industrial marketbeat 1q 2018 - texas a&m university · marketbeat u.s. industrial overall...
TRANSCRIPT
cushmanwakefield.com | 1
U.S. IndustrialQ1 2018
MARKETBEAT
U.S. INDUSTRIAL
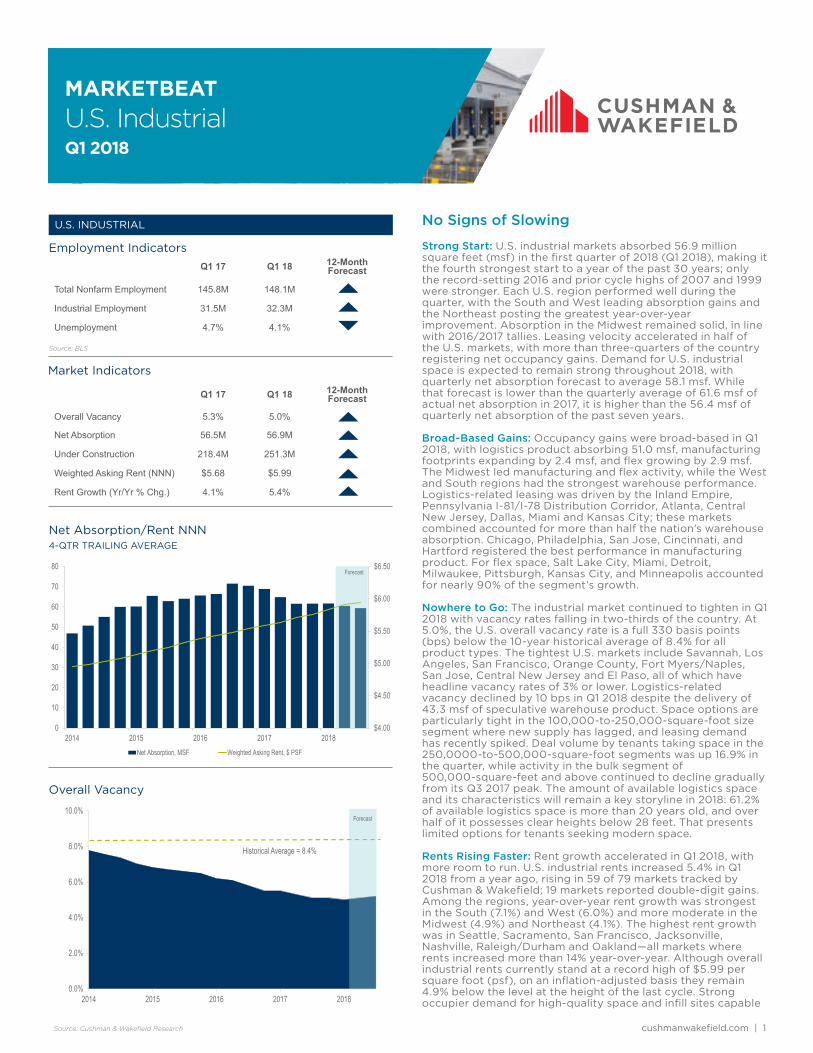
Overall Vacancy
Net Absorption/Rent NNN 4-QTR TRAILING AVERAGE
Market Indicators
Q1 17 Q1 18 12-Month Forecast
Overall Vacancy 5.3% 5.0%
Net Absorption 56.5M 56.9M
Under Construction 218.4M 251.3M
Weighted Asking Rent (NNN) $5.68 $5.99
Rent Growth (Yr/Yr % Chg.) 4.1% 5.4%
Employment IndicatorsQ1 17 Q1 18 12-Month
Forecast
Total Nonfarm Employment 145.8M 148.1M
Industrial Employment 31.5M 32.3M
Unemployment 4.7% 4.1%
$4.00
$4.50
$5.00
$5.50
$6.00
$6.50
0
10
20
30
40
50
60
70
80
2014 2015 2016 2017 2018Net Absorption, MSF Weighted Asking Rent, $ PSF
Forecast
0.0%
2.0%
4.0%
6.0%
8.0%
10.0%
2014 2015 2016 2017 2018
Historical Average = 8.4%
Forecast
No Signs of Slowing
Strong Start: U.S. industrial markets absorbed 56.9 million square feet (msf) in the first quarter of 2018 (Q1 2018), making it the fourth strongest start to a year of the past 30 years; only the record-setting 2016 and prior cycle highs of 2007 and 1999 were stronger. Each U.S. region performed well during the quarter, with the South and West leading absorption gains and the Northeast posting the greatest year-over-year improvement. Absorption in the Midwest remained solid, in line with 2016/2017 tallies. Leasing velocity accelerated in half of the U.S. markets, with more than three-quarters of the country registering net occupancy gains. Demand for U.S. industrial space is expected to remain strong throughout 2018, with quarterly net absorption forecast to average 58.1 msf. While that forecast is lower than the quarterly average of 61.6 msf of actual net absorption in 2017, it is higher than the 56.4 msf of quarterly net absorption of the past seven years.
Broad-Based Gains: Occupancy gains were broad-based in Q1 2018, with logistics product absorbing 51.0 msf, manufacturing footprints expanding by 2.4 msf, and flex growing by 2.9 msf. The Midwest led manufacturing and flex activity, while the West and South regions had the strongest warehouse performance. Logistics-related leasing was driven by the Inland Empire, Pennsylvania I-81/I-78 Distribution Corridor, Atlanta, Central New Jersey, Dallas, Miami and Kansas City; these markets combined accounted for more than half the nation’s warehouse absorption. Chicago, Philadelphia, San Jose, Cincinnati, and Hartford registered the best performance in manufacturing product. For flex space, Salt Lake City, Miami, Detroit, Milwaukee, Pittsburgh, Kansas City, and Minneapolis accounted for nearly 90% of the segment’s growth.
Nowhere to Go: The industrial market continued to tighten in Q1 2018 with vacancy rates falling in two-thirds of the country. At 5.0%, the U.S. overall vacancy rate is a full 330 basis points (bps) below the 10-year historical average of 8.4% for all product types. The tightest U.S. markets include Savannah, Los Angeles, San Francisco, Orange County, Fort Myers/Naples, San Jose, Central New Jersey and El Paso, all of which have headline vacancy rates of 3% or lower. Logistics-related vacancy declined by 10 bps in Q1 2018 despite the delivery of 43.3 msf of speculative warehouse product. Space options are particularly tight in the 100,000-to-250,000-square-foot size segment where new supply has lagged, and leasing demand has recently spiked. Deal volume by tenants taking space in the 250,0000-to-500,000-square-foot segments was up 16.9% in the quarter, while activity in the bulk segment of 500,000-square-feet and above continued to decline gradually from its Q3 2017 peak. The amount of available logistics space and its characteristics will remain a key storyline in 2018: 61.2% of available logistics space is more than 20 years old, and over half of it possesses clear heights below 28 feet. That presents limited options for tenants seeking modern space.
Rents Rising Faster: Rent growth accelerated in Q1 2018, with more room to run. U.S. industrial rents increased 5.4% in Q1 2018 from a year ago, rising in 59 of 79 markets tracked by Cushman & Wakefield; 19 markets reported double-digit gains. Among the regions, year-over-year rent growth was strongest in the South (7.1%) and West (6.0%) and more moderate in the Midwest (4.9%) and Northeast (4.1%). The highest rent growth was in Seattle, Sacramento, San Francisco, Jacksonville, Nashville, Raleigh/Durham and Oakland—all markets where rents increased more than 14% year-over-year. Although overall industrial rents currently stand at a record high of $5.99 per square foot (psf), on an inflation-adjusted basis they remain 4.9% below the level at the height of the last cycle. Strong occupier demand for high-quality space and infill sites capable
Source: Cushman & Wakefield Research
Source: BLS
cushmanwakefield.com | 2
U.S. IndustrialQ1 2018
MARKETBEAT
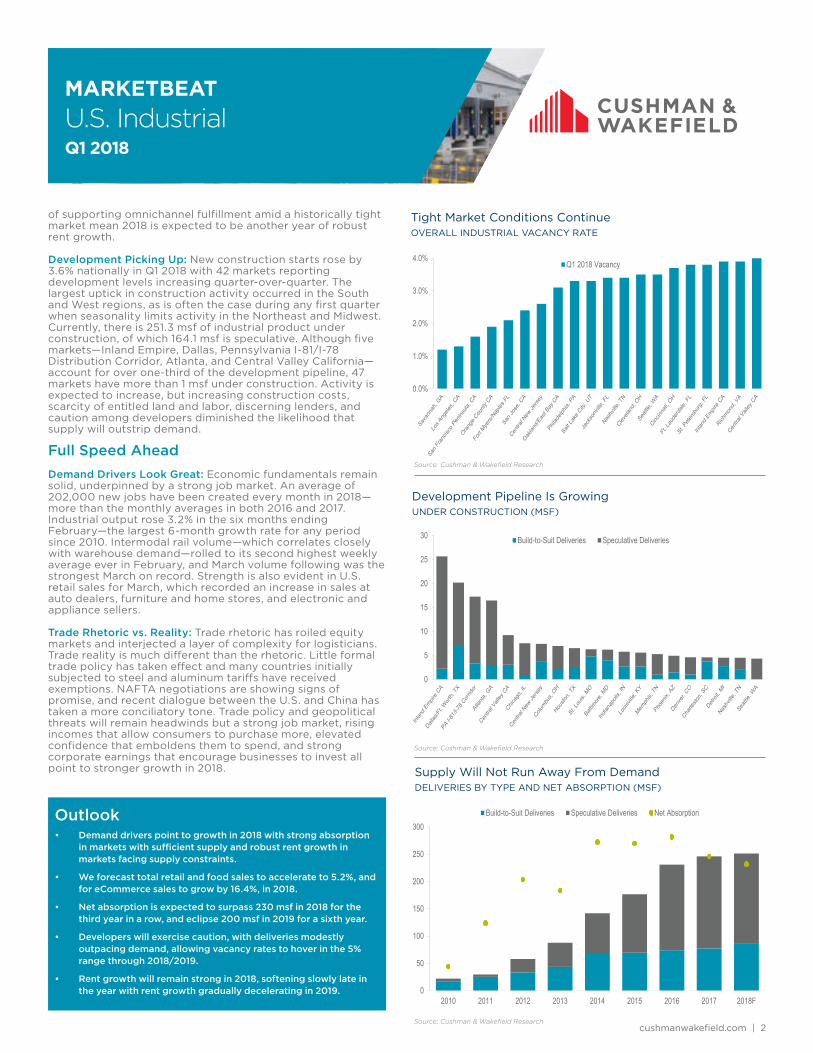
Development Pipeline Is Growing UNDER CONSTRUCTION (MSF)
Supply Will Not Run Away From Demand DELIVERIES BY TYPE AND NET ABSORPTION (MSF)
Tight Market Conditions Continue OVERALL INDUSTRIAL VACANCY RATE
Outlook• Demand drivers point to growth in 2018 with strong absorption
in markets with sufficient supply and robust rent growth in markets facing supply constraints.
• We forecast total retail and food sales to accelerate to 5.2%, and for eCommerce sales to grow by 16.4%, in 2018.
• Net absorption is expected to surpass 230 msf in 2018 for the third year in a row, and eclipse 200 msf in 2019 for a sixth year.
• Developers will exercise caution, with deliveries modestly outpacing demand, allowing vacancy rates to hover in the 5% range through 2018/2019.
• Rent growth will remain strong in 2018, softening slowly late in the year with rent growth gradually decelerating in 2019.
Source: Cushman & Wakefield Research
Source: Cushman & Wakefield Research
Source: Cushman & Wakefield Research
of supporting omnichannel fulfillment amid a historically tight market mean 2018 is expected to be another year of robust rent growth.
Development Picking Up: New construction starts rose by 3.6% nationally in Q1 2018 with 42 markets reporting development levels increasing quarter-over-quarter. The largest uptick in construction activity occurred in the South and West regions, as is often the case during any first quarter when seasonality limits activity in the Northeast and Midwest. Currently, there is 251.3 msf of industrial product under construction, of which 164.1 msf is speculative. Although five markets—Inland Empire, Dallas, Pennsylvania I-81/I-78 Distribution Corridor, Atlanta, and Central Valley California—account for over one-third of the development pipeline, 47 markets have more than 1 msf under construction. Activity is expected to increase, but increasing construction costs, scarcity of entitled land and labor, discerning lenders, and caution among developers diminished the likelihood that supply will outstrip demand.
Full Speed AheadDemand Drivers Look Great: Economic fundamentals remain solid, underpinned by a strong job market. An average of 202,000 new jobs have been created every month in 2018—more than the monthly averages in both 2016 and 2017. Industrial output rose 3.2% in the six months ending February—the largest 6-month growth rate for any period since 2010. Intermodal rail volume—which correlates closely with warehouse demand—rolled to its second highest weekly average ever in February, and March volume following was the strongest March on record. Strength is also evident in U.S. retail sales for March, which recorded an increase in sales at auto dealers, furniture and home stores, and electronic and appliance sellers.
Trade Rhetoric vs. Reality: Trade rhetoric has roiled equity markets and interjected a layer of complexity for logisticians. Trade reality is much different than the rhetoric. Little formal trade policy has taken effect and many countries initially subjected to steel and aluminum tariffs have received exemptions. NAFTA negotiations are showing signs of promise, and recent dialogue between the U.S. and China has taken a more conciliatory tone. Trade policy and geopolitical threats will remain headwinds but a strong job market, rising incomes that allow consumers to purchase more, elevated confidence that emboldens them to spend, and strong corporate earnings that encourage businesses to invest all point to stronger growth in 2018.
0
5
10
15
20
25
30 Build-to-Suit Deliveries Speculative Deliveries
0.0%
1.0%
2.0%
3.0%
4.0%Q1 2018 Vacancy
0
50
100
150
200
250
300
2010 2011 2012 2013 2014 2015 2016 2017 2018F
Build-to-Suit Deliveries Speculative Deliveries Net Absorption

MarketBeat U.S. Q1 2018 cushmanwakefield.com | 3
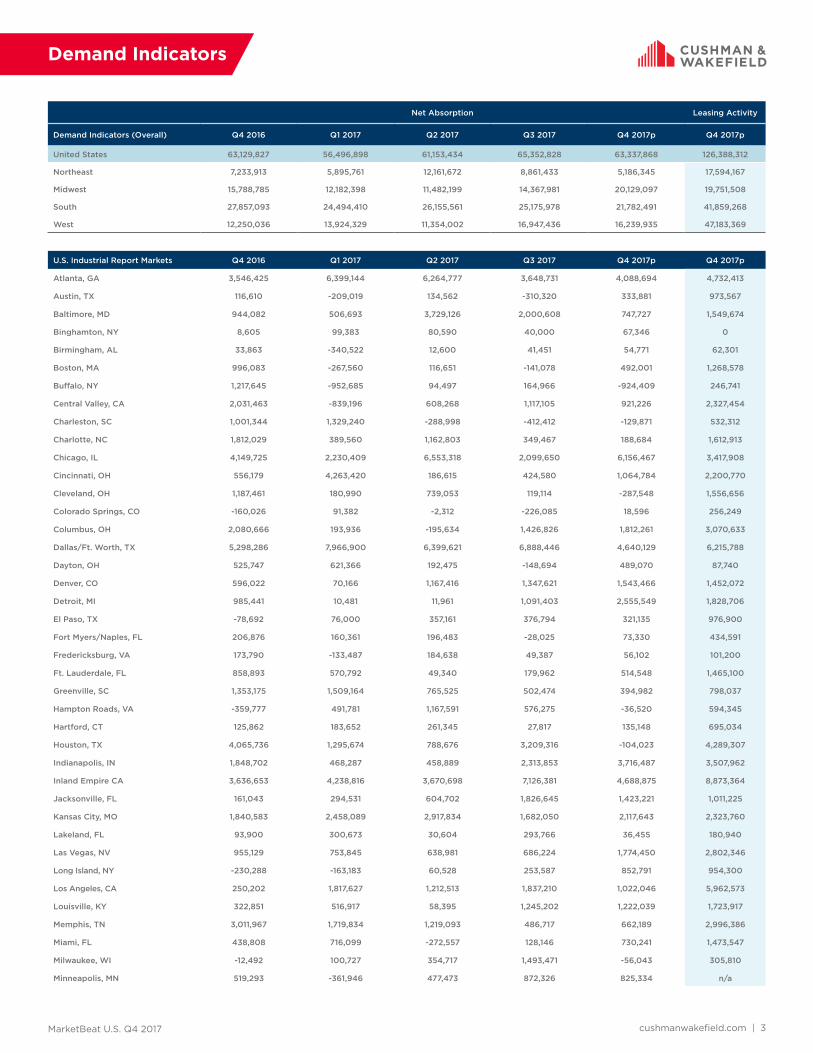
Net Absorption Leasing Activity
Demand Indicators (Overall) Q1 2017 Q2 2017 Q3 2017 Q4 2017 Q1 2018p Q1 2018p
United States 56,496,898 61,153,434 65,352,828 63,337,868 56,855,055 108,216,084
Northeast 5,895,761 12,161,672 8,861,433 5,186,345 10,728,051 14,846,171
Midwest 12,182,398 11,482,199 14,367,981 20,129,097 11,033,792 24,609,432
South 24,494,410 26,155,561 25,175,978 21,782,491 18,395,360 30,039,151
West 13,924,329 11,354,002 16,947,436 16,239,935 16,697,852 38,721,330
U.S. Industrial Report Markets Q1 2017 Q2 2017 Q3 2017 Q4 2017 Q1 2018p Q1 2018p
Atlanta, GA 6,399,144 6,264,777 3,648,731 4,088,694 4,742,224 5,172,040
Austin, TX -209,019 134,562 -310,320 333,881 88,415 585,256
Baltimore, MD 506,693 3,729,126 2,000,608 747,727 461,676 602,386
Binghamton, NY 99,383 80,590 40,000 67,346 0 0
Birmingham, AL -340,522 12,600 41,451 54,771 73,651 139,940
Boston, MA -267,560 116,651 -141,078 492,001 278,374 1,523,439
Buffalo, NY -952,685 94,497 164,966 -924,409 -419,352 419,764
Central Valley, CA -839,196 608,268 1,117,105 921,226 1,294,976 2,326,487
Charleston, SC 1,329,240 -288,998 -412,412 -129,871 123,934 766,396
Charlotte, NC 389,560 1,162,803 349,467 188,684 398,436 777,456
Chicago, IL 2,230,409 6,553,318 2,099,650 6,156,467 3,974,101 7,156,627
Cincinnati, OH 4,263,420 186,615 424,580 1,064,784 915,287 1,620,185
Cleveland, OH 180,990 739,053 119,114 -287,548 1,362,622 1,163,404
Colorado Springs, CO 91,382 -2,312 -226,085 18,596 201,930 257,834
Columbus, OH 193,936 -195,634 1,426,826 1,812,261 320,010 1,552,032
Dallas/Ft. Worth, TX 7,966,900 6,399,621 6,888,446 4,640,129 3,232,198 4,877,241
Dayton, OH 621,366 192,475 -148,694 489,070 -74,859 53,260
Denver, CO 70,166 1,167,416 1,347,621 1,543,466 202,718 1,185,633
Detroit, MI 10,481 11,961 1,091,403 2,555,549 -226,368 2,028,359
El Paso, TX 76,000 357,161 376,794 321,135 372,123 773,195
Fort Myers/Naples, FL 160,361 196,483 -28,025 73,330 -43,593 363,581
Fredericksburg, VA -133,487 184,638 49,387 56,102 868,508 101,843
Ft. Lauderdale, FL 570,792 49,340 179,962 514,548 -82,052 983,300
Greenville, SC 1,509,164 765,525 502,474 394,982 1,800,991 1,795,119
Hampton Roads, VA 491,781 1,167,591 576,275 -36,520 302,709 349,160
Hartford, CT 183,652 261,345 27,817 135,148 337,698 372,597
Houston, TX 1,295,674 788,676 3,209,316 -104,023 57,739 2,276,680
Indianapolis, IN 468,287 458,889 2,313,853 3,716,487 647,116 3,074,876
Inland Empire CA 4,238,816 3,670,698 7,126,381 4,688,875 6,291,318 9,154,302
Jacksonville, FL 294,531 604,702 1,826,645 1,423,221 368,066 859,657
Kansas City, MO 2,458,089 2,917,834 1,682,050 2,117,643 2,037,146 2,796,834
Lakeland, FL 300,673 30,604 293,766 36,455 354,284 127,780
Las Vegas, NV 753,845 638,981 686,224 1,774,450 1,600,411 1,143,282
Long Island, NY -163,183 60,528 253,587 852,791 -325,352 667,050
Los Angeles, CA 1,817,627 1,212,513 1,837,210 1,022,046 1,493,698 9,994,018
Louisville, KY 516,917 58,395 1,245,202 1,222,039 1,637,427 1,203,388
Memphis, TN 1,719,834 1,219,093 486,717 662,189 n/a n/a
Miami, FL 716,099 -272,557 128,146 730,241 2,060,051 2,036,406
Milwaukee, WI 100,727 354,717 1,493,471 -56,043 813,894 480,259
Minneapolis, MN -361,946 477,473 872,326 825,334 592,886 n/a
Demand Indicators

MarketBeat U.S. Q1 2018 cushmanwakefield.com | 4
Net Absorption Leasing Activity
Demand Indicators (Overall) Q1 2017 Q2 2017 Q3 2017 Q4 2017 Q1 2018p Q1 2018p
Nashville, TN 625,416 -200,280 1,675,012 120,526 363,767 908,645
New Haven, CT 107,072 18,838 5,477 175,696 112,991 197,598
New Jersey - Central 1,765,243 2,548,178 2,809,359 2,184,634 3,890,321 4,173,654
New Jersey - Northern 689,129 1,364,765 497,798 1,664,946 -117,749 2,208,903
Northern VA 133,525 158,067 -20,211 35,291 16,212 558,873
Oakland/East Bay, CA 371,786 210,153 -1,569,379 660,234 -178,872 1,623,432
Oklahoma City, OK -56,356 -229,173 -542,074 N/A -3,545 282,099
Omaha, NE 130,509 146,433 349,921 455,995 -136,317 159,588
Orange County, CA 181,240 166,598 -143,511 -261,531 -130,959 1,740,922
Orlando, FL 169,416 989,386 462,458 789,720 587,900 681,534
Palm Beach County, FL 132,122 174,307 362,784 101,677 73,537 454,298
PA I-81/I-78 Distribution Corridor 2,309,040 4,642,512 3,541,623 844,371 4,777,838 3,109,193
Philadelphia, PA 1,418,070 1,422,735 1,437,888 611,009 1,139,650 1,531,487
Phoenix, AZ 2,105,250 1,199,401 2,571,976 2,600,022 1,394,165 1,836,246
Pittsburgh, PA 283,316 765,481 -650,575 -356,733 912,161 285,801
Portland, OR 645,643 829,963 870,133 -72,333 -633,444 1,452,233
Providence, RI 101,650 87,648 63,199 313,632 71,456 71,456
Puget Sound - Eastside 99,512 74,918 -182,255 220,980 524,863 763,351
Raleigh/Durham, NC -247,778 76,732 317,502 -294,394 143,571 572,717
Richmond, VA 480,166 595,183 705,151 1,022,908 -135,089 555,002
Roanoke, VA -442,290 170,468 95,604 6,011 480,115 241,088
Rochester, NY -4,470 407,166 407,166 -594,469 101,023 34,609
Sacramento, CA 770,177 483,538 1,379,668 1,426,115 1,260,063 1,282,663
Salt Lake City, UT 1,372,941 1,042,903 798,628 723,096 1,039,351 616,141
San Antonio, TX 57,024 439,830 135,180 -203,074 76,360 488,528
San Diego, CA 330,736 17,518 844,640 103,378 -85,162 1,667,853
San Francisco North Bay, CA 105,774 46,381 71,827 39,783 -107,480 106,181
San Francisco Peninsula, CA -15,400 233,572 762 15,292 26,778 162,000
San Jose (Silicon Valley), CA 276,251 -463,286 -177,705 346,282 683,222 1,261,451
Savannah, GA 0 1,183,500 0 3,855,811 0 0
Seattle, WA 1,505,694 96,309 561,459 251,674 1,762,853 2,015,848
Southern New Hampshire 378,928 60,340 184,217 -302,661 -118,498 189,254
St. Louis, MO 1,886,130 -360,935 2,643,481 1,279,098 808,274 4,524,008
St. Petersburg/Clearwater, FL 97,885 174,396 123,416 225,964 -179,626 77,306
Suburban MD -2,323 -56,959 37,371 316,522 61,323 423,623
Syracuse, NY -51,824 230,398 219,989 23,043 87,490 61,366
Tampa, FL 187,495 90,095 677,735 587,815 35,773 455,312
Tucson, AZ 42,085 120,470 32,737 218,284 57,423 131,453
Tulsa, OK -200,227 25,867 93,420 N/A 58,275 549,302
Demand Indicators
p = preliminary

MarketBeat U.S. Q1 2018 cushmanwakefield.com | 5
Vacancy Rates
Overall Vacancy Rate Q1 2017 Q2 2017 Q3 2017 Q4 2017 Q1 2018p
United States 5.3% 5.3% 5.1% 5.1% 5.0%
Northeast 5.7% 5.5% 5.3% 5.3% 4.9%
Midwest 5.5% 5.4% 5.4% 5.3% 5.3%
South 6.5% 6.5% 6.2% 6.1% 6.0%
West 3.7% 3.6% 3.7% 3.7% 3.5%
U.S. Industrial Report Markets Q1 2017 Q2 2017 Q3 2017 Q4 2017 Q1 2018p
Atlanta, GA 8.7% 8.4% 7.8% 7.7% 8.1%
Austin, TX 9.5% 8.6% 9.5% 8.8% 9.2%
Baltimore, MD 7.9% 7.3% 6.9% 6.4% 6.4%
Binghamton, NY 11.3% 10.3% 9.8% 9.9% 8.8%
Birmingham, AL 11.4% 11.3% 10.8% 10.6% 10.2%
Boston, MA 6.6% 6.5% 6.4% 6.2% 5.9%
Buffalo, NY 9.2% 9.0% 8.9% 9.1% 9.2%
Central Valley, CA 3.4% 3.3% 2.8% 3.3% 4.0%
Charleston, SC 4.7% 6.0% 8.0% 8.1% 9.4%
Charlotte, NC 3.4% 3.6% 3.5% 3.4% 5.1%
Chicago, IL 6.4% 6.3% 6.7% 6.8% 6.8%
Cincinnati, OH 3.0% 3.3% 3.4% 3.2% 3.7%
Cleveland, OH 4.6% 4.2% 3.8% 3.9% 3.5%
Colorado Springs, CO 10.1% 10.0% 10.6% 10.7% 9.7%
Columbus, OH 5.6% 5.9% 5.1% 4.7% 4.8%
Dallas/Ft. Worth, TX 7.2% 6.9% 6.8% 7.0% 6.3%
Dayton, OH 7.7% 7.6% 8.2% 8.3% 7.8%
Denver, CO 4.9% 4.8% 4.8% 4.9% 5.0%
Detroit, MI 3.5% 3.5% 3.1% 2.9% 2.9%
El Paso, TX 6.8% 5.7% 5.0% 3.2% 2.7%
Fort Myers/Naples, FL 2.2% 2.0% 1.8% 1.9% 2.1%
Fredericksburg, VA 6.6% 5.3% 4.7% 5.3% 5.5%
Ft. Lauderdale, FL 4.5% 4.4% 4.0% 2.9% 3.8%
Greenville, SC 6.5% 6.2% 5.8% 5.8% 5.5%
Hampton Roads, VA 4.9% 4.7% 4.1% 4.4% 4.2%
Hartford, CT 8.1% 8.3% 8.1% 7.9% 7.1%
Houston, TX 7.0% 6.8% 6.2% 6.3% 6.0%
Indianapolis, IN 5.1% 5.1% 5.5% 5.3% 5.5%
Inland Empire CA 4.0% 4.1% 4.0% 4.1% 3.9%
Jacksonville, FL 5.6% 5.4% 4.8% 4.0% 3.4%
Kansas City, MO 8.3% 7.5% 7.1% 7.2% 7.4%
Lakeland, FL 5.1% 5.1% 3.9% 3.9% 4.9%
Las Vegas, NV 5.2% 5.4% 6.0% 6.2% 6.2%
Long Island, NY 6.8% 6.9% 6.5% 5.6% 5.1%
Los Angeles, CA 1.3% 1.2% 1.2% 1.3% 1.3%
Louisville, KY 7.2% 7.7% 8.1% 7.7% 7.2%
Memphis, TN 8.1% 8.4% 8.2% 7.8% 7.8%
Miami, FL 4.2% 5.0% 4.7% 4.7% 4.3%
Milwaukee, WI 4.5% 4.5% 3.8% 4.1% 4.1%
Minneapolis, MN 8.7% 8.7% 8.0% 8.5% 8.7%

MarketBeat U.S. Q1 2018 cushmanwakefield.com | 6
Vacancy Rates
Overall Vacancy Rate Q1 2017 Q2 2017 Q3 2017 Q4 2017 Q1 2018p
Nashville, TN 3.2% 2.9% 3.3% 3.5% 3.4%
New Haven, CT 9.2% 9.8% 9.8% 9.5% 7.8%
New Jersey - Central 4.1% 4.3% 3.6% 3.3% 2.6%
New Jersey - Northern 5.5% 4.8% 4.6% 4.4% 4.7%
Northern VA 8.8% 8.5% 8.7% 8.4% 10.1%
Oakland/East Bay, CA 2.1% 2.3% 3.3% 3.0% 3.1%
Oklahoma City, OK 6.8% 7.5% 9.0% 9.0% 4.9%
Omaha, NE 3.1% 3.3% 3.6% 3.4% 2.4%
Orange County, CA 2.0% 1.9% 1.9% 1.9% 1.9%
Orlando, FL 5.1% 5.6% 5.5% 5.4% 5.1%
Palm Beach County, FL 3.5% 3.6% 3.3% 2.7% 3.0%
PA I-81/I-78 Distribution Corridor 5.1% 5.3% 5.3% 5.1% 4.8%
Philadelphia, PA 3.9% 3.7% 3.4% 4.0% 3.3%
Phoenix, AZ 8.9% 8.6% 8.3% 7.9% 7.8%
Pittsburgh, PA 5.7% 4.8% 4.8% 5.4% 5.4%
Portland, OR 3.9% 3.2% 3.5% 3.9% 4.2%
Providence, RI 0.2% 0.2% 0.1% 0.1% 0.0%
Puget Sound - Eastside 4.3% 4.3% 4.9% 4.7% 4.3%
Raleigh/Durham, NC 6.5% 6.2% 5.5% 6.0% 5.5%
Richmond, VA 5.0% 4.9% 3.7% 3.7% 3.9%
Roanoke, VA 8.0% 7.3% 7.1% 7.2% 7.0%
Rochester, NY 9.6% 9.0% 9.0% 9.8% 9.7%
Sacramento, CA 7.6% 7.3% 6.3% 5.9% 4.8%
Salt Lake City, UT 6.1% 5.4% 5.8% 5.6% 3.3%
San Antonio, TX 9.1% 8.2% 8.0% 8.8% 8.4%
San Diego, CA 5.1% 5.1% 4.8% 4.8% 4.8%
San Francisco North Bay, CA 5.1% 5.2% 4.8% 4.6% 5.2%
San Francisco Peninsula, CA 2.6% 2.1% 2.1% 2.0% 1.6%
San Jose (Silicon Valley), CA 3.0% 3.4% 3.6% 3.2% 2.4%
Savannah, GA 3.0% 3.2% 3.2% 1.2% 1.2%
Seattle, WA 3.4% 3.7% 4.2% 4.1% 3.5%
Southern New Hampshire 6.3% 6.8% 7.5% 8.2% 6.3%
St. Louis, MO 6.7% 6.8% 6.7% 6.0% 6.1%
St. Petersburg/Clearwater, FL 4.1% 4.0% 3.5% 3.6% 3.8%
Suburban MD 9.9% 10.5% 10.4% 9.7% 9.7%
Syracuse, NY 10.7% 9.9% 8.8% 8.8% 8.6%
Tampa, FL 5.0% 5.4% 5.2% 5.3% 5.8%
Tucson, AZ 7.4% 7.1% 8.2% 6.6% 6.3%
Tulsa, OK 8.8% 9.1% 8.9% 8.9% 3.2%
p = preliminary

MarketBeat U.S. Q1 2018 cushmanwakefield.com | 7
Asking Rents
Overall (All Property Types) W/D MFG
Weighted Average Asking Rent Q1 2017 Q2 2017 Q3 2017 Q4 2017 Q1 2018p Q1 2018p
United States $5.68 $5.70 $5.80 $5.84 $5.99 $5.39 $5.77
Northeast $6.17 $6.03 $6.03 $6.17 $6.42 $6.23 $5.15
Midwest $4.48 $4.57 $4.61 $4.61 $4.70 $4.38 $4.65
South $5.23 $5.27 $5.45 $5.41 $5.60 $5.03 $4.69
West $7.83 $7.91 $7.98 $8.12 $8.30 $7.23 $8.68
U.S. Industrial Report Markets Q1 2017 Q2 2017 Q3 2017 Q4 2017 Q1 2018p Q1 2018p
Atlanta, GA $4.31 $4.35 $4.54 $4.47 $4.83 $4.08 $3.78
Austin, TX $9.27 $9.21 $9.34 $9.24 $10.08 $8.21 $10.78
Baltimore, MD $5.08 $4.78 $5.10 $5.70 $5.75 $5.21 n/a
Binghamton, NY $4.70 $4.64 $4.58 $4.57 $4.57 $4.09 $4.29
Birmingham, AL $4.18 $4.23 $4.09 $4.02 $3.98 $3.71 n/a
Boston, MA $6.61 $6.85 $6.97 $8.17 $7.45 $6.64 $8.78
Buffalo, NY $4.13 $4.13 $4.13 $4.13 $4.13 $4.25 $3.95
Central Valley, CA $4.32 $4.25 $4.24 $4.75 $4.20 $4.44 $3.36
Charleston, SC $5.36 $5.35 $5.48 $5.52 $5.54 $5.56 $4.70
Charlotte, NC $5.11 $5.27 $5.42 $5.21 $5.27 $4.79 $4.10
Chicago, IL $4.87 $4.98 $5.03 $5.08 $5.19 $4.95 $4.84
Cincinnati, OH $4.33 $4.27 $4.33 $4.25 $4.34 $4.11 $3.50
Cleveland, OH $3.99 $4.10 $4.12 $4.15 $4.30 $3.99 n/a
Colorado Springs, CO $6.78 $7.43 $7.37 $7.85 $8.06 $7.46 $7.19
Columbus, OH $3.46 $3.46 $3.46 $3.50 $3.55 $3.55 n/a
Dallas/Ft. Worth, TX $4.86 $4.93 $5.59 $5.06 $5.40 $4.27 $4.22
Dayton, OH $3.32 $3.32 $3.33 $3.26 $3.29 $3.63 $2.95
Denver, CO $8.03 $8.10 $8.03 $7.96 $7.78 $6.38 $7.24
Detroit, MI $5.36 $5.53 $5.56 $5.57 $5.79 $5.40 $5.10
El Paso, TX $3.95 $3.95 $4.00 $4.10 $4.10 $4.10 $4.00
Fort Myers/Naples, FL $7.44 $7.45 $7.50 $7.61 $7.72 $7.30 $8.65
Fredericksburg, VA $5.71 $5.69 $5.73 $5.73 $5.79 $5.45 $4.62
Ft. Lauderdale, FL $8.92 $9.12 $9.21 $9.27 $9.45 $8.91 $10.18
Greenville, SC $3.58 $3.58 $3.63 $3.60 $3.43 $3.32 $3.21
Hampton Roads, VA $5.08 $5.05 $5.00 $5.28 $5.44 $5.18 $5.97
Hartford, CT $4.53 $4.21 $4.24 $4.28 $4.47 $4.60 $3.89
Houston, TX $6.23 $6.28 $6.40 $6.44 $6.22 $6.12 $5.81
Indianapolis, IN $3.70 $3.74 $3.76 $3.80 $3.88 $3.58 $3.31
Inland Empire CA $7.28 $7.42 $7.52 $7.61 $7.69 $6.92 $8.31
Jacksonville, FL $4.63 $4.74 $4.98 $5.37 $5.52 $4.76 $9.49
Kansas City, MO $4.38 $4.45 $4.43 $4.27 $4.20 $3.57 $4.04
Lakeland, FL $5.17 $5.18 $5.76 $5.54 $5.45 $5.01 $5.95
Las Vegas, NV $7.14 $6.80 $6.81 $6.82 $6.75 $6.60 $6.36
Long Island, NY $9.97 $9.25 $9.21 $9.44 $10.68 $9.98 $10.74
Los Angeles, CA $9.25 $9.05 $9.00 $9.36 $9.85 $9.46 $8.86
Louisville, KY $3.76 $3.76 $3.70 $3.73 $3.81 $3.73 $3.14
Memphis, TN $2.73 $2.81 $2.75 $2.75 $2.75 n/a n/a
Miami, FL $7.98 $8.13 $8.25 $8.45 $8.79 $8.84 $7.32
Milwaukee, WI $4.45 $4.55 $4.59 $4.64 $4.57 $4.00 $4.84
Minneapolis, MN $4.79 $4.80 $4.90 $4.88 $4.90 $4.65 n/a

MarketBeat U.S. Q1 2018 cushmanwakefield.com | 8
Asking Rents
p = preliminary
Overall (All Property Types) W/D MFG
Weighted Average Asking Rent Q1 2017 Q2 2017 Q3 2017 Q4 2017 Q1 2018p Q1 2018p
Nashville, TN $4.18 $5.14 $5.03 $5.09 $4.95 $4.95 $3.65
New Haven, CT $5.33 $4.62 $5.15 $5.35 $5.57 $4.64 $5.64
New Jersey - Central $7.31 $7.40 $7.39 $7.58 $7.69 $6.97 $5.49
New Jersey - Northern $7.60 $7.78 $7.82 $8.56 $8.57 $8.49 $8.23
Northern VA $11.15 $11.16 $11.12 $11.36 $11.18 $9.15 n/a
Oakland/East Bay, CA $9.12 $10.17 $10.10 $10.43 $10.40 $9.26 $11.34
Oklahoma City, OK $4.86 $4.98 $4.95 $4.95 $5.28 $4.92 $4.68
Omaha, NE $5.63 $5.57 $5.57 $5.55 $5.55 $5.34 $3.89
Orange County, CA $11.10 $11.40 $10.74 $11.24 $11.61 $10.22 $10.88
Orlando, FL $6.32 $6.29 $6.38 $6.48 $6.45 $5.61 $6.44
Palm Beach County, FL $11.12 $10.62 $10.56 $10.69 $10.74 $9.83 $9.77
PA I-81/I-78 Distribution Corridor $4.72 $4.74 $4.75 $4.77 $4.80 $4.81 $4.50
Philadelphia, PA $4.81 $4.95 $4.58 $4.51 $4.76 $4.53 $4.57
Phoenix, AZ $7.03 $6.80 $6.80 $6.70 $6.91 $5.28 $7.71
Pittsburgh, PA $7.54 $7.09 $7.68 $7.58 $8.59 $5.59 $4.28
Portland, OR $7.73 $8.34 $8.38 $8.50 $8.53 $7.24 $9.74
Providence, RI $4.85 $4.85 $4.85 $4.85 $4.85 $4.70 n/a
Puget Sound - Eastside $12.27 $12.12 $12.24 $11.76 $11.75 $10.24 $7.31
Raleigh/Durham, NC $7.28 $7.50 $7.71 $8.70 $8.51 $5.87 $8.18
Richmond, VA $4.70 $4.80 $5.03 $4.92 $4.83 $4.65 $4.81
Roanoke, VA $4.43 $4.76 $4.99 $4.98 $5.21 $4.55 $7.11
Rochester, NY $4.84 $4.84 $4.84 $4.84 $5.40 $3.75 $4.75
Sacramento, CA $4.66 $4.93 $5.08 $5.06 $5.64 $5.64 $5.28
Salt Lake City, UT $5.37 $5.49 $5.64 $5.82 $5.65 $5.83 $4.15
San Antonio, TX $5.79 $5.79 $5.75 $5.79 $6.08 $5.29 n/a
San Diego, CA $12.00 $11.76 $11.88 $12.36 $12.48 $9.12 $11.04
San Francisco North Bay, CA $9.97 $11.54 $11.97 $11.69 $11.97 $11.86 $16.27
San Francisco Peninsula, CA $14.72 $16.18 $16.42 $17.72 $17.62 $17.11 $20.24
San Jose (Silicon Valley), CA $12.00 $12.48 $12.12 $13.20 $13.08 $12.00 $14.28
Savannah, GA $4.75 $4.69 $4.69 $4.62 $4.62 $4.33 n/a
Seattle, WA $7.15 $7.38 $7.45 $7.61 $8.73 $8.29 $7.15
Southern New Hampshire $5.90 $5.72 $5.62 $5.79 $5.92 $5.06 $5.51
St. Louis, MO $4.45 $4.58 $4.62 $4.47 $4.57 $4.20 $9.93
St. Petersburg/Clearwater, FL $7.93 $8.05 $7.99 $8.12 $7.86 $6.18 $6.09
Suburban MD $10.11 $9.36 $9.21 $9.37 $10.02 $8.31 n/a
Syracuse, NY $3.85 $4.07 $4.08 $4.02 $3.94 $4.19 $3.24
Tampa, FL $6.15 $5.77 $5.85 $5.72 $5.74 $5.08 $4.20
Tucson, AZ $6.44 $6.29 $6.37 $6.23 $6.09 $5.94 $5.01
Tulsa, OK $4.52 $4.53 $4.54 $4.54 $4.69 $4.78 $4.34

MarketBeat U.S. Q1 2018 cushmanwakefield.com | 9
Inventory
Inventory Inventory Deliveries YTD 2018 Under Construction as of Q1 2018p
United States 14,410,824,692 58,799,986 251,252,728
Northeast 1,993,641,042 8,791,831 35,742,136
Midwest 3,980,416,040 13,555,670 46,547,019
South 4,455,891,503 21,504,739 95,617,226
West 3,980,876,107 14,947,746 73,346,347
U.S. Industrial Report Markets Inventory Deliveries YTD 2018 Under Construction as of Q1 2018p
Atlanta, GA 595,218,856 5,295,533 16,455,440
Austin, TX 41,563,750 350,171 1,425,067
Baltimore, MD 206,480,254 839,200 6,206,238
Binghamton, NY 17,266,122 0 0
Birmingham, AL 14,636,022 127,000 872,500
Boston, MA 145,612,419 45,000 3,064,775
Buffalo, NY 110,137,656 108,000 637,157
Central Valley, CA 124,812,694 1,309,285 9,227,339
Charleston, SC 67,701,399 2,004,601 4,586,278
Charlotte, NC 190,510,328 1,679,322 3,042,678
Chicago, IL 1,199,111,877 3,363,887 7,544,990
Cincinnati, OH 286,357,688 2,516,071 3,315,073
Cleveland, OH 493,267,300 755,000 3,668,270
Colorado Springs, CO 27,985,210 0 150,000
Columbus, OH 250,114,480 765,226 6,969,125
Dallas/Ft. Worth, TX 717,443,390 3,077,808 20,172,705
Dayton, OH 118,524,616 83,600 1,013,750
Denver, CO 242,223,330 213,800 4,631,834
Detroit, MI 535,827,638 696,874 4,520,054
El Paso, TX 52,409,401 373,760 697,662
Fort Myers/Naples, FL 41,657,618 42,715 524,521
Fredericksburg, VA 13,547,393 0 0
Ft. Lauderdale, FL 88,377,590 553,693 1,526,763
Greenville, SC 190,880,359 0 2,506,460
Hampton Roads, VA 98,264,807 50,000 195,000
Hartford, CT 93,012,333 133,200 1,255,000
Houston, TX 423,531,502 2,006,427 6,535,264
Indianapolis, IN 257,512,784 669,044 5,760,586
Inland Empire CA 523,896,800 5,909,554 25,649,881
Jacksonville, FL 106,009,294 0 1,175,100
Kansas City, MO 217,905,877 2,618,804 3,695,142
Lakeland, FL 31,571,987 636,120 650,808
Las Vegas, NV 121,262,863 1,275,681 2,460,469
Long Island, NY 132,569,626 42,000 137,582
Los Angeles, CA 1,067,244,749 2,502,195 4,153,169
Louisville, KY 158,118,608 1,411,889 5,590,250
Memphis, TN 192,588,615 N/A 5,261,192
Miami, FL 159,149,333 1,358,260 3,562,595
Milwaukee, WI 200,343,420 627,045 837,874
Minneapolis, MN 109,941,772 732,579 1,232,534

MarketBeat U.S. Q1 2018 cushmanwakefield.com | 10
Inventory
Inventory Inventory Deliveries YTD 2018 Under Construction as of Q1 2018p
Nashville, TN 207,732,278 0 4,505,896
New Haven, CT 47,972,701 80,500 855,000
New Jersey - Central 341,840,626 1,873,715 7,398,822
New Jersey - Northern 285,915,667 591,665 1,235,519
Northern VA 61,757,118 266,719 370,850
Oakland/East Bay, CA 205,166,608 391,834 2,915,424
Oklahoma City, OK 71,654,890 20,046 0
Omaha, NE 68,150,732 33,600 1,698,262
Orange County, CA 283,638,824 0 1,520,658
Orlando, FL 118,645,912 705,005 1,639,228
Palm Beach County, FL 41,501,932 166,392 146,253
PA I-81/I-78 Distribution Corridor 268,806,266 4,527,469 17,261,326
Philadelphia, PA 139,818,225 0 3,573,850
Phoenix, AZ 312,048,160 1,487,709 4,943,167
Pittsburgh, PA 168,467,168 150,282 143,500
Portland, OR 198,398,446 839,323 3,487,528
Providence, RI 77,727,305 0 0
Puget Sound - Eastside 60,756,319 0 726,294
Raleigh/Durham, NC 53,576,565 136,500 159,600
Richmond, VA 95,136,133 95,000 820,447
Roanoke, VA 50,835,950 0 0
Rochester, NY 73,551,473 0 0
Sacramento, CA 140,877,069 0 934,770
Salt Lake City, UT 124,177,486 477,759 3,634,305
San Antonio, TX 39,429,211 0 1,573,429
San Diego, CA 162,528,199 0 3,290,206
San Francisco North Bay, CA 25,432,841 0 422,128
San Francisco Peninsula, CA 41,886,372 0 0
San Jose (Silicon Valley), CA 85,419,650 0 634,118
Savannah, GA 55,642,703 0 3,388,742
Seattle, WA 190,166,201 540,606 4,322,323
Southern New Hampshire 48,200,877 1,240,000 0
St. Louis, MO 243,357,856 693,940 6,291,359
St. Petersburg/Clearwater, FL 47,780,757 0 126,000
Suburban MD 50,136,334 0 458,910
Syracuse, NY 42,742,578 0 179,605
Tampa, FL 80,141,279 137,500 1,094,270
Tucson, AZ 42,954,286 0 242,734
Tulsa, OK 92,259,935 171,078 347,080
p = preliminary
Methodology
Cushman & Wakefield’s quarterly estimates are derived from a variety of data sources, including its own proprietary database, and historical data from third party data sources. The market statistics are calculated from a base building inventory made up of industrial properties deemed to be competitive in the local industrial markets. Generally, owner-occupied and federally-owned buildings are not included. Older buildings unfit for occupancy or ones that require substantial renovation before tenancy are generally not included in the competitive inventory. The inventory is subject to revisions due to resampling. Vacant space is defined as space that is available immediately or imminently after the end of the quarter. Sublet space still occupied by the tenant is not counted as available space. The figures provided for the current quarter are preliminary, and all information contained in the report is subject to correction of errors and revisions based on additional data received.
Regional Map
WestMidwestSouthNortheast
Jason Tolliver Head of Logistics & Industrial Research Americas Tel: +1 317.639.0549 cushmanwakefield.com
Explanation of Terms
Total Inventory: The total amount of industrial space (in buildings of a
predetermined size by market) that can be rented by a third party.
Overall Vacancy Rate: The amount of unoccupied space (new, relet, and
sublet) expressed as a percentage of total inventory.
Absorption: The net change in occupied space between two points in time.
(Total occupied space in the present quarter minus total occupied space from
the previous quarter, quoted on a net, not gross, basis.)
Leasing Activity: The sum of all leases over a period of time. This includes
pre-leasing activity as well as expansions. It does not include renewals.
Overall Weighted Asking Rents: NNN average asking rents weighted by the
amount of available direct and sublease space in industrial properties.
W/D: Warehouse and or distribution properties.
MFG: Manufacturing properties.
About Cushman & Wakefield
Cushman & Wakefield is a leading global real estate services firm with 45,000 employees in more than 70 countries helping occupiers and investors optimize the value of their real estate. Cushman & Wakefield is among the largest commercial real estate services firms with revenue of $6 billion across core services of agency leasing, asset services, capital markets, facility services (C&W Services), global occupier services, investment & asset management (DTZ Investors), project & development services, tenant representation, and valuation & advisory. To learn more, visit www.cushmanwakefield.com or follow @CushWake on Twitter.
Cushman & Wakefield Copyright 2018. No warranty or representation, express or implied, is made to the accuracy or completeness of the information contained herein, and same is submitted subject to errors, omissions, change of price, rental or other conditions, withdrawal without notice, and to any special listing conditions imposed by the property owner(s). As applicable, we make no representation as to the condition of the property (or properties) in question.
Carolyn Salzer Analyst, Logistics & Industrial Research Americas Tel: +1 847.518.3212 cushmanwakefield.com

cushmanwakefield.com | 1
U.S. IndustrialQ4 2017
MARKETBEAT
U.S. INDUSTRIAL
Overall Vacancy
Net Absorption/Rent NNN 4-QTR TRAILING AVERAGE
Market Indicators
Q4 16 Q4 17 12-Month Forecast
Overall Vacancy 5.5% 5.1%
Net Absorption 63.1M 63.3M
Under Construction 215.6M 242.5M
Weighted Asking Rent (NNN) $5.63 $5.84
Rent Growth (Yr/Yr % Chg.) 4.1% 3.7%
Employment IndicatorsQ4 16 Q4 17 12-Month
Forecast
Total Nonfarm Employment 145.2M 147.2M
Industrial Employment 25.4M 25.9M
Unemployment 4.7% 4.1%
$4.00
$4.50
$5.00
$5.50
$6.00
0
10
20
30
40
50
60
70
80
2013 2014 2015 2016 2017 2018Net Absorption, MSF Weighted Asking Rent, $ PSF
Forecast
0.0%
2.0%
4.0%
6.0%
8.0%
10.0%
2013 2014 2015 2016 2017 2018
Historical Average = 8.4%
Forecast
Industrial Market Shows No Signs of Slowing
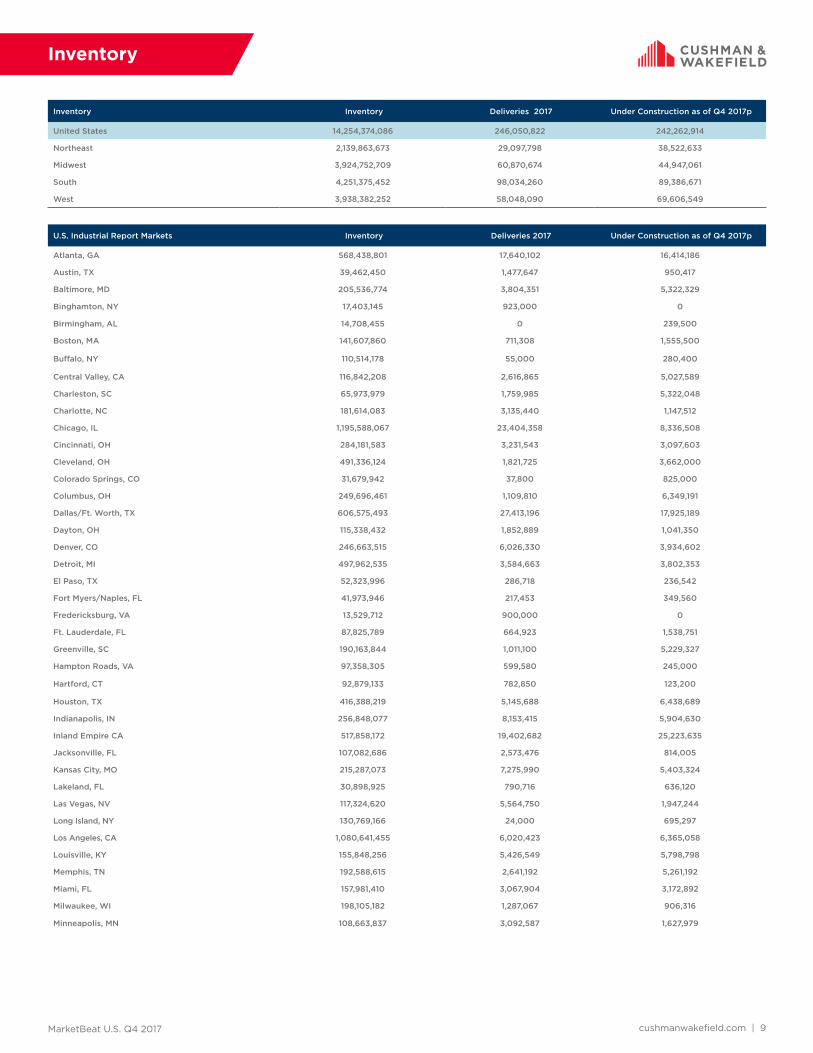
Another Banner Year: U.S. industrial markets absorbed 63.3 million square feet (msf) in the fourth quarter of 2017, boosting net occupancy gains for the year to over 246.3 msf. The U.S. industrial market has now recorded over 240 msf of absorption for four consecutive years—the strongest run on record. The national industrial vacancy rate held at 5.1% for all product types—the lowest rate on record—with market conditions tightening slightly in the Midwest and South. The greatest growth markets in 2017 were Dallas/Ft Worth, Atlanta, the Inland Empire, Chicago and the Pennsylvania I-81/I-78 Distribution Corridor, and together they accounted for 38% of overall U.S. net absorption.
Firing on All Cylinders: Every industrial segment remained in growth mode. Through Q4 2017, warehouse product posted 224.9 msf of net absorption, manufacturing registered 10.2 msf of growth, flex occupancy grew by 7.2 msf and high technology occupancy increased by 2.4 msf. The current industrial expansion is one for the record book. As of January 2018, the industrial sector has registered 31 consecutive quarters of net occupancy gains—the longest expansion ever. It is also among the strongest with net absorption since 2010 surpassing 1.4 trillion square feet.
Tight Conditions: At 5.1%, the U.S. industrial vacancy rate is a full 330 basis points (bps) below the 10-year historical average of 8.4% for all product types. The warehouse market remains tight with vacancy tracking at 5.2% in Q4 2017. Over the past year, logistics-related vacancy has declined 50 bps (from 5.7% to 5.2%) despite the delivery of 168.6 msf of new speculative warehouse product. Strikingly, warehouse vacancy rates remain below prior cycle lows in many industrial markets, with conditions tightening further in Q4 2017 as rates track below 5% in nearly half of all U.S. markets. At year-end 2017, the tightest U.S. markets included Savannah, Los Angeles, Orange County, the San Francisco Peninsula, and Oakland/East Bay, all of which have vacancy rates at 3% or below.
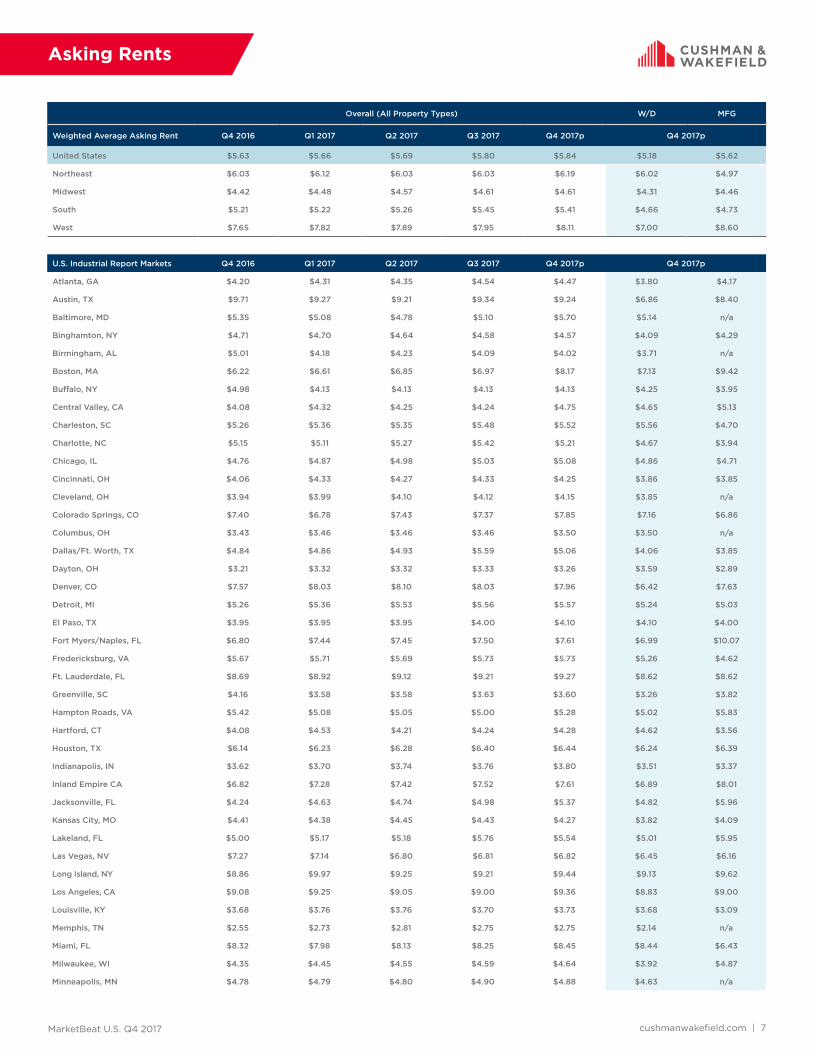
Rents Continue to Run: Healthy demand from logistics and distribution users is fueling rent growth. U.S. industrial rents increased 3.7% in Q4 2017 from a year ago to a record high of $5.84 per square foot (psf). Industrial rents rose in 62 of 79 markets tracked by Cushman & Wakefield during the same period, with many port-proximate industrial markets reporting double-digit gains. Among the regions, year-over-year rent growth in Q4 2017 was strongest in the West (6.1%), followed by the Midwest (4.4%), South (4.1%) and Northeast (2.6%). Rent growth was strongest in Jacksonville, San Francisco, Nashville, Raleigh/Durham, Oakland/East Bay and Seattle—all markets where rents grew more than 12% in 2017.
Conservative Development: New construction starts rose slightly—by 3.5%—in Q4 2017. Currently, there is 242.5 msf of industrial product under construction, of which 161.6 msf is speculative. Although development remains concentrated in major industrial markets, 42 of the 79 markets tracked have over 1 msf under construction. Given the tight market conditions and strong underlying fundamentals, developers are expected be conservative in breaking ground on additional speculative projects, which will slowly bring supply and demand fundamentals closer into balance. Nevertheless, concern over the length of the current economic cycle, the increased institutional nature of developers and financial partners, and lack of land and rising construction costs are likely to prevent dramatic increases in speculative development in most markets.
Source: Cushman & Wakefield Research
Source: BLS

cushmanwakefield.com | 2
U.S. IndustrialQ4 2017
MARKETBEAT
Demand in Line with Supply in Many Markets 2017 NET ABSORPTION & NEW DELIVERIES (ALL TYPES, % OF INVENTORY)
Rebalancing of Vacancy Will Occur Slowly CURRENT CONSTRUCTION COMPARED TO 5-YR ABSORPTION AVERAGE
Few Signs of Overbuilding 2017 DELIVERIES BY TYPE & YEAR-OVER-YEAR CHANGE IN VACANCY
Outlook• Logistics-related leasing will continue to benefit from solid
economic fundamentals that spur increased consumer spending.
• Net absorption will once again surpass 200 msf for a fifth year in a row.
• Increased speculative supply will place upward pressure on vacancy as supply/demand begin to slowly rebalance. We forecast average annual vacancy to rise 20 bps in 2018 to 5.3% for all industrial product types.
• Rental rate appreciation will continue, although rent growth will slowly begin to decelerate in 2018. We anticipate average annual rent gains of 2.9% in 2018 for all industrial product types.
Source: Cushman & Wakefield Research
Source: Cushman & Wakefield Research
Source: Cushman & Wakefield Research
Don’t Bet Against the U.S. Economy, More Upside than Downside
Solid Footing: The U.S. economy and industrial market are positioned to perform well in 2018. For the fourth quarter, job gains averaged 204,000 a month, the most since the third quarter of 2016. For all of 2017, U.S. firms created nearly 2.1 million net new jobs, down from 2.2 million in 2016 but almost equal to the 2012-2016 average. Renewed confidence in the economy and higher levels of real discretionary income are anticipated to boost retail sales while a stronger U.S. housing market will buttress leasing demand among firms associated with home building and furnishings. Stronger global growth is also expected to support economic growth and leasing fundamentals. In short, the U.S. economy and industrial market enter 2018 on the strongest footing of any year in the current expansion with few signs of slowing.
Paying-Up: Since 2016, the Employment Cost Index—a quarterly economic series detailing the changes in the costs of labor for businesses in the economy—has risen at a faster pace for warehouse workers than for all civilian workers. This trend is mirrored in forecasts for income: the largest growth in real per capita income is projected to be in industrial markets, particularly those in Florida and distribution-centric markets in Pennsylvania and the Midwest. Since labor typically accounts for at least half of traditional warehouse operating costs, the relationship between labor costs and warehouse operations will remain a key theme in 2018, with occupiers increasingly required to pay-up to ramp-up or keep-up warehousing and fulfillment operations.
Churning it Out: The U.S. manufacturing sector ended 2017 on a strong note with the ISM manufacturing index rising to 59.7 in December—the second fastest pace of expansion in six years. Buoyed by both domestic and international demand, new orders are surging at their fastest pace in more than 13 years. The ISM index expanded at a torrid pace in the third and fourth quarters of 2017. Since August 2017, the index has consistently tracked above 58.2, a rare occurrence. The only other period in the past 40 years that the ISM registered 58 or higher for that many consecutive months was a streak that lasted from November 2003 to August 2004. The rapid pace of expansion and rising backlog of orders indicates continued production and demand for manufacturing and logistics-related real estate in 2018
0.0%0.5%1.0%1.5%2.0%2.5%3.0%3.5%4.0%4.5%5.0%
Net Absorption New Deliveries
0
4
8
12
16
20
24
28
32
Speculative Deliveries (MSF) Build-to-Suit Deliveries (MSF)
+10 – YoY change in vacancy, basis points
+50
-30-130
+40
+230 -90 -110 +60 -10 -120-20-110-20-100+110 -180 +110 -80 +60
0
4
8
12
16
20
24
28Q4 2017 Under Construction (MSF) 5-Year Absorption Average (MSF)
MarketBeat U.S. Q4 2017 cushmanwakefield.com | 3
Net Absorption Leasing Activity
Demand Indicators (Overall) Q4 2016 Q1 2017 Q2 2017 Q3 2017 Q4 2017p Q4 2017p
United States 63,129,827 56,496,898 61,153,434 65,352,828 63,337,868 126,388,312
Northeast 7,233,913 5,895,761 12,161,672 8,861,433 5,186,345 17,594,167
Midwest 15,788,785 12,182,398 11,482,199 14,367,981 20,129,097 19,751,508
South 27,857,093 24,494,410 26,155,561 25,175,978 21,782,491 41,859,268
West 12,250,036 13,924,329 11,354,002 16,947,436 16,239,935 47,183,369
U.S. Industrial Report Markets Q4 2016 Q1 2017 Q2 2017 Q3 2017 Q4 2017p Q4 2017p
Atlanta, GA 3,546,425 6,399,144 6,264,777 3,648,731 4,088,694 4,732,413
Austin, TX 116,610 -209,019 134,562 -310,320 333,881 973,567
Baltimore, MD 944,082 506,693 3,729,126 2,000,608 747,727 1,549,674
Binghamton, NY 8,605 99,383 80,590 40,000 67,346 0
Birmingham, AL 33,863 -340,522 12,600 41,451 54,771 62,301
Boston, MA 996,083 -267,560 116,651 -141,078 492,001 1,268,578
Buffalo, NY 1,217,645 -952,685 94,497 164,966 -924,409 246,741
Central Valley, CA 2,031,463 -839,196 608,268 1,117,105 921,226 2,327,454
Charleston, SC 1,001,344 1,329,240 -288,998 -412,412 -129,871 532,312
Charlotte, NC 1,812,029 389,560 1,162,803 349,467 188,684 1,612,913
Chicago, IL 4,149,725 2,230,409 6,553,318 2,099,650 6,156,467 3,417,908
Cincinnati, OH 556,179 4,263,420 186,615 424,580 1,064,784 2,200,770
Cleveland, OH 1,187,461 180,990 739,053 119,114 -287,548 1,556,656
Colorado Springs, CO -160,026 91,382 -2,312 -226,085 18,596 256,249
Columbus, OH 2,080,666 193,936 -195,634 1,426,826 1,812,261 3,070,633
Dallas/Ft. Worth, TX 5,298,286 7,966,900 6,399,621 6,888,446 4,640,129 6,215,788
Dayton, OH 525,747 621,366 192,475 -148,694 489,070 87,740
Denver, CO 596,022 70,166 1,167,416 1,347,621 1,543,466 1,452,072
Detroit, MI 985,441 10,481 11,961 1,091,403 2,555,549 1,828,706
El Paso, TX -78,692 76,000 357,161 376,794 321,135 976,900
Fort Myers/Naples, FL 206,876 160,361 196,483 -28,025 73,330 434,591
Fredericksburg, VA 173,790 -133,487 184,638 49,387 56,102 101,200
Ft. Lauderdale, FL 858,893 570,792 49,340 179,962 514,548 1,465,100
Greenville, SC 1,353,175 1,509,164 765,525 502,474 394,982 798,037
Hampton Roads, VA -359,777 491,781 1,167,591 576,275 -36,520 594,345
Hartford, CT 125,862 183,652 261,345 27,817 135,148 695,034
Houston, TX 4,065,736 1,295,674 788,676 3,209,316 -104,023 4,289,307
Indianapolis, IN 1,848,702 468,287 458,889 2,313,853 3,716,487 3,507,962
Inland Empire CA 3,636,653 4,238,816 3,670,698 7,126,381 4,688,875 8,873,364
Jacksonville, FL 161,043 294,531 604,702 1,826,645 1,423,221 1,011,225
Kansas City, MO 1,840,583 2,458,089 2,917,834 1,682,050 2,117,643 2,323,760
Lakeland, FL 93,900 300,673 30,604 293,766 36,455 180,940
Las Vegas, NV 955,129 753,845 638,981 686,224 1,774,450 2,802,346
Long Island, NY -230,288 -163,183 60,528 253,587 852,791 954,300
Los Angeles, CA 250,202 1,817,627 1,212,513 1,837,210 1,022,046 5,962,573
Louisville, KY 322,851 516,917 58,395 1,245,202 1,222,039 1,723,917
Memphis, TN 3,011,967 1,719,834 1,219,093 486,717 662,189 2,996,386
Miami, FL 438,808 716,099 -272,557 128,146 730,241 1,473,547
Milwaukee, WI -12,492 100,727 354,717 1,493,471 -56,043 305,810
Minneapolis, MN 519,293 -361,946 477,473 872,326 825,334 n/a
Demand Indicators

MarketBeat U.S. Q4 2017 cushmanwakefield.com | 4
Net Absorption Leasing Activity
Demand Indicators (Overall) Q4 2016 Q1 2017 Q2 2017 Q3 2017 Q4 2017p Q4 2017p
Nashville, TN 2,529,427 625,416 -200,280 1,675,012 120,526 2,101,672
New Haven, CT 293,732 107,072 18,838 5,477 175,696 380,594
New Jersey - Central 702,054 1,765,243 2,548,178 2,809,359 2,184,634 4,445,701
New Jersey - Northern -449,521 689,129 1,364,765 497,798 1,664,946 1,841,238
Northern VA -54,788 133,525 158,067 -20,211 35,291 200,986
Oakland/East Bay, CA 274,100 371,786 210,153 -1,569,379 660,234 3,449,032
Oklahoma City, OK -66,220 -56,356 -229,173 -542,074 n/a n/a
Omaha, NE 204,651 130,509 146,433 349,921 455,995 283,489
Orange County, CA 417,332 181,240 166,598 -143,511 -261,531 1,950,984
Orlando, FL 1,013,276 169,416 989,386 462,458 789,720 439,455
Palm Beach County, FL 181,815 132,122 174,307 362,784 101,677 505,016
PA I-81/I-78 Distribution Corridor 2,326,714 2,309,040 4,642,512 3,541,623 844,371 5,149,488
Philadelphia, PA 1,520,977 1,418,070 1,422,735 1,437,888 611,009 1,567,135
Phoenix, AZ 1,572,074 2,105,250 1,199,401 2,571,976 2,600,022 6,718,125
Pittsburgh, PA 100,230 283,316 765,481 -650,575 -356,733 507,088
Portland, OR 529,659 645,643 829,963 870,133 -72,333 2,200,213
Providence, RI 102,292 101,650 87,648 63,199 313,632 63,334
Puget Sound - Eastside 303,774 99,512 74,918 -182,255 220,980 526,743
Raleigh/Durham, NC 344,104 -247,778 76,732 317,502 -294,394 641,582
Richmond, VA 263,746 480,166 595,183 705,151 1,022,908 378,429
Roanoke, VA 69,980 -442,290 170,468 95,604 6,011 195,829
Rochester, NY 213,189 -4,470 407,166 407,166 -594,469 45,147
Sacramento, CA 183,313 770,177 483,538 1,379,668 1,426,115 3,020,499
Salt Lake City, UT 442,247 1,372,941 1,042,903 798,628 723,096 1,704,225
San Antonio, TX 142,169 57,024 439,830 135,180 -203,074 0
San Diego, CA 431,283 330,736 17,518 844,640 103,378 1,681,271
San Francisco North Bay, CA 104,199 105,774 46,381 71,827 39,783 317,543
San Francisco Peninsula, CA 72,077 -15,400 233,572 762 15,292 478,477
San Jose (Silicon Valley), CA -36,597 276,251 -463,286 -177,705 346,282 1,382,977
Savannah, GA -358,098 0 1,183,500 0 3,855,811 3,855,811
Seattle, WA 527,043 1,505,694 96,309 561,459 251,674 1,608,822
Southern New Hampshire 18,726 378,928 60,340 184,217 -302,661 301,900
St. Louis, MO 1,902,829 1,886,130 -360,935 2,643,481 1,279,098 1,168,074
St. Petersburg/Clearwater, FL 590,146 97,885 174,396 123,416 225,964 150,896
Suburban MD 250,065 -2,323 -56,959 37,371 316,522 728,167
Syracuse, NY 287,613 -51,824 230,398 219,989 23,043 127,889
Tampa, FL 146,530 187,495 90,095 677,735 587,815 936,962
Tucson, AZ 120,089 42,085 120,470 32,737 218,284 470,400
Tulsa, OK -196,268 -200,227 25,867 93,420 n/a n/a
Demand Indicators
p = preliminary

MarketBeat U.S. Q4 2017 cushmanwakefield.com | 5
Vacancy Rates
Overall Vacancy Rate Q4 2016 Q1 2017 Q2 2017 Q3 2017 Q4 2017p
United States 5.5% 5.3% 5.3% 5.1% 5.1%
Northeast 6.2% 5.7% 5.5% 5.3% 5.3%
Midwest 5.5% 5.5% 5.4% 5.4% 5.3%
South 6.6% 6.5% 6.5% 6.2% 6.1%
West 4.0% 3.7% 3.7% 3.7% 3.7%
U.S. Industrial Report Markets Q4 2016 Q1 2017 Q2 2017 Q3 2017 Q4 2017p
Atlanta, GA 9.0% 8.7% 8.4% 7.8% 7.7%
Austin, TX 6.4% 9.5% 8.6% 9.5% 8.8%
Baltimore, MD 6.6% 7.9% 7.3% 6.9% 6.4%
Binghamton, NY 10.8% 11.3% 10.3% 9.8% 9.9%
Birmingham, AL 8.8% 11.4% 11.3% 10.8% 10.6%
Boston, MA 6.4% 6.6% 6.5% 6.4% 6.2%
Buffalo, NY 8.9% 9.2% 9.0% 8.9% 9.1%
Central Valley, CA 3.4% 3.4% 3.3% 2.8% 3.3%
Charleston, SC 6.8% 4.7% 6.0% 8.0% 8.1%
Charlotte, NC 3.6% 3.4% 3.6% 3.5% 3.4%
Chicago, IL 6.3% 6.4% 6.3% 6.7% 6.8%
Cincinnati, OH 4.2% 3.0% 3.3% 3.4% 3.2%
Cleveland, OH 4.6% 4.6% 4.2% 3.8% 3.9%
Colorado Springs, CO 10.1% 10.1% 10.0% 10.6% 10.7%
Columbus, OH 5.5% 5.6% 5.9% 5.1% 4.7%
Dallas/Ft. Worth, TX 6.9% 7.2% 6.9% 6.8% 7.0%
Dayton, OH 8.0% 7.7% 7.6% 8.2% 8.3%
Denver, CO 4.3% 4.9% 4.8% 4.8% 4.9%
Detroit, MI 4.0% 3.5% 3.5% 3.1% 2.9%
El Paso, TX 6.8% 6.8% 5.7% 5.0% 3.2%
Fort Myers/Naples, FL 2.8% 2.2% 2.0% 1.8% 1.9%
Fredericksburg, VA 7.6% 6.6% 5.3% 4.7% 5.3%
Ft. Lauderdale, FL 4.4% 4.5% 4.4% 4.0% 2.9%
Greenville, SC 6.6% 6.5% 6.2% 5.8% 5.8%
Hampton Roads, VA 6.6% 4.9% 4.7% 4.1% 4.4%
Hartford, CT 11.7% 8.1% 8.3% 8.1% 7.9%
Houston, TX 7.1% 7.0% 6.8% 6.2% 6.3%
Indianapolis, IN 3.0% 5.1% 5.1% 5.5% 5.3%
Inland Empire CA 4.4% 4.0% 4.1% 4.0% 4.1%
Jacksonville, FL 6.2% 5.6% 5.4% 4.8% 4.0%
Kansas City, MO 8.3% 8.3% 7.5% 7.1% 7.2%
Lakeland, FL 3.7% 5.1% 5.1% 3.9% 3.9%
Las Vegas, NV 5.1% 5.2% 5.4% 6.0% 6.2%
Long Island, NY 6.6% 6.8% 6.9% 6.5% 5.6%
Los Angeles, CA 1.4% 1.3% 1.2% 1.2% 1.3%
Louisville, KY 6.6% 7.2% 7.7% 8.1% 7.7%
Memphis, TN 8.7% 8.1% 8.4% 8.2% 7.8%
Miami, FL 4.3% 4.2% 5.0% 4.7% 4.7%
Milwaukee, WI 4.4% 4.5% 4.5% 3.8% 4.1%
Minneapolis, MN 8.2% 8.7% 8.7% 8.0% 8.5%

MarketBeat U.S. Q4 2017 cushmanwakefield.com | 6
Vacancy Rates
Overall Vacancy Rate Q4 2016 Q1 2017 Q2 2017 Q3 2017 Q4 2017p
Nashville, TN 2.9% 3.2% 2.9% 3.3% 3.5%
New Haven, CT 12.6% 9.2% 9.8% 9.8% 9.5%
New Jersey - Central 4.2% 4.1% 4.3% 3.6% 3.3%
New Jersey - Northern 5.9% 5.5% 4.8% 4.6% 4.4%
Northern VA 9.2% 8.8% 8.5% 8.7% 8.4%
Oakland/East Bay, CA 2.6% 2.1% 2.3% 3.3% 3.0%
Oklahoma City, OK 7.3% 6.8% 7.5% 9.0% 9.0%
Omaha, NE 3.2% 3.1% 3.3% 3.6% 3.4%
Orange County, CA 2.0% 2.0% 1.9% 1.9% 1.9%
Orlando, FL 4.6% 5.1% 5.6% 5.5% 5.4%
Palm Beach County, FL 4.2% 3.5% 3.6% 3.3% 2.7%
PA I-81/I-78 Distribution Corridor 4.7% 5.1% 5.3% 5.3% 5.1%
Philadelphia, PA 4.2% 3.9% 3.7% 3.4% 4.0%
Phoenix, AZ 9.1% 8.9% 8.6% 8.3% 7.9%
Pittsburgh, PA 5.7% 5.7% 4.8% 4.8% 5.4%
Portland, OR 4.0% 3.9% 3.2% 3.5% 3.9%
Providence, RI 0.3% 0.2% 0.2% 0.1% 0.1%
Puget Sound - Eastside 4.7% 4.3% 4.3% 4.9% 4.7%
Raleigh/Durham, NC 5.9% 6.5% 6.2% 5.5% 6.0%
Richmond, VA 6.6% 5.0% 4.9% 3.7% 3.7%
Roanoke, VA 7.2% 8.0% 7.3% 7.1% 7.2%
Rochester, NY 9.6% 9.6% 9.0% 9.0% 9.8%
Sacramento, CA 10.8% 7.6% 7.3% 6.3% 5.9%
Salt Lake City, UT 7.2% 6.1% 5.4% 5.8% 5.6%
San Antonio, TX 9.6% 9.1% 8.2% 8.0% 8.8%
San Diego, CA 5.3% 5.1% 5.1% 4.8% 4.8%
San Francisco North Bay, CA 5.5% 5.1% 5.2% 4.8% 4.6%
San Francisco Peninsula, CA 2.6% 2.6% 2.1% 2.1% 2.0%
San Jose (Silicon Valley), CA 3.3% 3.0% 3.4% 3.6% 3.2%
Savannah, GA 3.0% 3.0% 3.2% 3.2% 1.2%
Seattle, WA 3.8% 3.4% 3.7% 4.2% 4.1%
Southern New Hampshire 15.7% 6.3% 6.8% 7.5% 8.2%
St. Louis, MO 7.0% 6.7% 6.8% 6.7% 6.0%
St. Petersburg/Clearwater, FL 4.7% 4.1% 4.0% 3.5% 3.6%
Suburban MD 10.7% 9.9% 10.5% 10.4% 9.7%
Syracuse, NY 10.6% 10.7% 9.9% 8.8% 8.8%
Tampa, FL 5.5% 5.0% 5.4% 5.2% 5.3%
Tucson, AZ 7.8% 7.4% 7.1% 8.2% 6.6%
Tulsa, OK 7.6% 8.8% 9.1% 8.9% 8.9%
p = preliminary
MarketBeat U.S. Q4 2017 cushmanwakefield.com | 7
Asking Rents
Overall (All Property Types) W/D MFG
Weighted Average Asking Rent Q4 2016 Q1 2017 Q2 2017 Q3 2017 Q4 2017p Q4 2017p
United States $5.63 $5.66 $5.69 $5.80 $5.84 $5.18 $5.62
Northeast $6.03 $6.12 $6.03 $6.03 $6.19 $6.02 $4.97
Midwest $4.42 $4.48 $4.57 $4.61 $4.61 $4.31 $4.46
South $5.21 $5.22 $5.26 $5.45 $5.41 $4.66 $4.73
West $7.65 $7.82 $7.89 $7.95 $8.11 $7.00 $8.60
U.S. Industrial Report Markets Q4 2016 Q1 2017 Q2 2017 Q3 2017 Q4 2017p Q4 2017p
Atlanta, GA $4.20 $4.31 $4.35 $4.54 $4.47 $3.80 $4.17
Austin, TX $9.71 $9.27 $9.21 $9.34 $9.24 $6.86 $8.40
Baltimore, MD $5.35 $5.08 $4.78 $5.10 $5.70 $5.14 n/a
Binghamton, NY $4.71 $4.70 $4.64 $4.58 $4.57 $4.09 $4.29
Birmingham, AL $5.01 $4.18 $4.23 $4.09 $4.02 $3.71 n/a
Boston, MA $6.22 $6.61 $6.85 $6.97 $8.17 $7.13 $9.42
Buffalo, NY $4.98 $4.13 $4.13 $4.13 $4.13 $4.25 $3.95
Central Valley, CA $4.08 $4.32 $4.25 $4.24 $4.75 $4.65 $5.13
Charleston, SC $5.26 $5.36 $5.35 $5.48 $5.52 $5.56 $4.70
Charlotte, NC $5.15 $5.11 $5.27 $5.42 $5.21 $4.67 $3.94
Chicago, IL $4.76 $4.87 $4.98 $5.03 $5.08 $4.86 $4.71
Cincinnati, OH $4.06 $4.33 $4.27 $4.33 $4.25 $3.86 $3.85
Cleveland, OH $3.94 $3.99 $4.10 $4.12 $4.15 $3.85 n/a
Colorado Springs, CO $7.40 $6.78 $7.43 $7.37 $7.85 $7.16 $6.86
Columbus, OH $3.43 $3.46 $3.46 $3.46 $3.50 $3.50 n/a
Dallas/Ft. Worth, TX $4.84 $4.86 $4.93 $5.59 $5.06 $4.06 $3.85
Dayton, OH $3.21 $3.32 $3.32 $3.33 $3.26 $3.59 $2.89
Denver, CO $7.57 $8.03 $8.10 $8.03 $7.96 $6.42 $7.63
Detroit, MI $5.26 $5.36 $5.53 $5.56 $5.57 $5.24 $5.03
El Paso, TX $3.95 $3.95 $3.95 $4.00 $4.10 $4.10 $4.00
Fort Myers/Naples, FL $6.80 $7.44 $7.45 $7.50 $7.61 $6.99 $10.07
Fredericksburg, VA $5.67 $5.71 $5.69 $5.73 $5.73 $5.26 $4.62
Ft. Lauderdale, FL $8.69 $8.92 $9.12 $9.21 $9.27 $8.62 $8.62
Greenville, SC $4.16 $3.58 $3.58 $3.63 $3.60 $3.26 $3.82
Hampton Roads, VA $5.42 $5.08 $5.05 $5.00 $5.28 $5.02 $5.83
Hartford, CT $4.08 $4.53 $4.21 $4.24 $4.28 $4.62 $3.56
Houston, TX $6.14 $6.23 $6.28 $6.40 $6.44 $6.24 $6.39
Indianapolis, IN $3.62 $3.70 $3.74 $3.76 $3.80 $3.51 $3.37
Inland Empire CA $6.82 $7.28 $7.42 $7.52 $7.61 $6.89 $8.01
Jacksonville, FL $4.24 $4.63 $4.74 $4.98 $5.37 $4.82 $5.96
Kansas City, MO $4.41 $4.38 $4.45 $4.43 $4.27 $3.82 $4.09
Lakeland, FL $5.00 $5.17 $5.18 $5.76 $5.54 $5.01 $5.95
Las Vegas, NV $7.27 $7.14 $6.80 $6.81 $6.82 $6.45 $6.16
Long Island, NY $8.86 $9.97 $9.25 $9.21 $9.44 $9.13 $9.62
Los Angeles, CA $9.08 $9.25 $9.05 $9.00 $9.36 $8.83 $9.00
Louisville, KY $3.68 $3.76 $3.76 $3.70 $3.73 $3.68 $3.09
Memphis, TN $2.55 $2.73 $2.81 $2.75 $2.75 $2.14 n/a
Miami, FL $8.32 $7.98 $8.13 $8.25 $8.45 $8.44 $6.43
Milwaukee, WI $4.35 $4.45 $4.55 $4.59 $4.64 $3.92 $4.87
Minneapolis, MN $4.78 $4.79 $4.80 $4.90 $4.88 $4.63 n/a

MarketBeat U.S. Q4 2017 cushmanwakefield.com | 8
Asking Rents
p = preliminary
Overall (All Property Types) W/D MFG
Weighted Average Asking Rent Q4 2016 Q1 2017 Q2 2017 Q3 2017 Q4 2017p Q4 2017p
Nashville, TN $4.07 $4.18 $5.14 $5.03 $5.09 $5.01 $4.09
New Haven, CT $5.24 $5.33 $4.62 $5.15 $5.35 $4.80 $5.33
New Jersey - Central $7.28 $7.31 $7.40 $7.39 $7.58 $6.84 $5.70
New Jersey - Northern $7.90 $7.60 $7.78 $7.82 $8.56 $8.41 $8.21
Northern VA $11.12 $11.15 $11.16 $11.12 $11.36 $9.16 n/a
Oakland/East Bay, CA $9.01 $9.12 $10.17 $10.10 $10.43 $9.74 $11.21
Oklahoma City, OK $4.61 $4.86 $4.98 $4.95 $4.95 n/a n/a
Omaha, NE $5.41 $5.63 $5.57 $5.57 $5.55 $4.91 n/a
Orange County, CA $11.21 $11.10 $11.40 $10.74 $11.24 $10.06 $10.35
Orlando, FL $6.48 $6.32 $6.29 $6.38 $6.48 $5.64 $5.59
Palm Beach County, FL $10.71 $11.12 $10.62 $10.56 $10.69 $9.65 $9.64
PA I-81/I-78 Distribution Corridor $4.64 $4.72 $4.74 $4.75 $4.77 $4.78 $4.25
Philadelphia, PA $4.63 $4.81 $4.95 $4.58 $4.51 $4.10 $3.43
Phoenix, AZ $7.05 $7.03 $6.80 $6.80 $6.70 $5.02 $7.57
Pittsburgh, PA $7.84 $7.54 $7.09 $7.68 $7.58 $5.55 $4.69
Portland, OR $8.02 $7.73 $8.34 $8.38 $8.50 $7.15 $7.74
Providence, RI $4.85 $4.85 $4.85 $4.85 $4.85 $4.70 N/A
Puget Sound - Eastside $11.62 $12.27 $12.12 $12.24 $11.76 $10.29 $8.27
Raleigh/Durham, NC $6.99 $7.28 $7.50 $7.71 $8.70 $5.78 $8.64
Richmond, VA $4.72 $4.70 $4.80 $5.03 $4.92 $4.33 $4.16
Roanoke, VA $4.32 $4.43 $4.76 $4.99 $4.98 $4.50 $6.83
Rochester, NY $4.84 $4.84 $4.84 $4.84 $4.84 $3.25 $4.75
Sacramento, CA $4.55 $4.66 $4.93 $5.08 $5.06 $4.97 $5.63
Salt Lake City, UT $5.45 $5.37 $5.49 $5.64 $5.82 $5.34 $5.79
San Antonio, TX $5.98 $5.79 $5.79 $5.75 $5.79 $4.98 n/a
San Diego, CA $12.12 $12.00 $11.76 $11.88 $12.36 $9.00 $11.16
San Francisco North Bay, CA $10.23 $9.97 $11.54 $11.97 $11.69 $11.70 $14.26
San Francisco Peninsula, CA $14.12 $14.72 $16.18 $16.42 $17.72 $16.85 $21.28
San Jose (Silicon Valley), CA $12.60 $12.00 $12.48 $12.12 $13.20 $12.24 $13.80
Savannah, GA $4.75 $4.75 $4.69 $4.69 $4.62 $4.33 n/a
Seattle, WA $6.73 $7.15 $7.38 $7.45 $7.61 $7.07 $5.90
Southern New Hampshire $5.53 $5.90 $5.72 $5.62 $5.79 $5.00 $5.36
St. Louis, MO $4.39 $4.45 $4.58 $4.62 $4.47 $4.19 $7.17
St. Petersburg/Clearwater, FL $7.72 $7.93 $8.05 $7.99 $8.12 $5.84 $6.69
Suburban MD $9.57 $10.11 $9.36 $9.21 $9.37 $7.69 n/a
Syracuse, NY $3.83 $3.85 $4.07 $4.08 $4.02 $4.28 $3.25
Tampa, FL $6.10 $6.15 $5.77 $5.85 $5.72 $5.00 $4.20
Tucson, AZ $6.67 $6.44 $6.29 $6.37 $6.23 $6.17 $5.08
Tulsa, OK $4.52 $4.52 $4.53 $4.54 $4.54 n/a n/a
MarketBeat U.S. Q4 2017 cushmanwakefield.com | 9
Inventory
Inventory Inventory Deliveries 2017 Under Construction as of Q4 2017p
United States 14,254,374,086 246,050,822 242,262,914
Northeast 2,139,863,673 29,097,798 38,522,633
Midwest 3,924,752,709 60,870,674 44,947,061
South 4,251,375,452 98,034,260 89,386,671
West 3,938,382,252 58,048,090 69,606,549
U.S. Industrial Report Markets Inventory Deliveries 2017 Under Construction as of Q4 2017p
Atlanta, GA 568,438,801 17,640,102 16,414,186
Austin, TX 39,462,450 1,477,647 950,417
Baltimore, MD 205,536,774 3,804,351 5,322,329
Binghamton, NY 17,403,145 923,000 0
Birmingham, AL 14,708,455 0 239,500
Boston, MA 141,607,860 711,308 1,555,500
Buffalo, NY 110,514,178 55,000 280,400
Central Valley, CA 116,842,208 2,616,865 5,027,589
Charleston, SC 65,973,979 1,759,985 5,322,048
Charlotte, NC 181,614,083 3,135,440 1,147,512
Chicago, IL 1,195,588,067 23,404,358 8,336,508
Cincinnati, OH 284,181,583 3,231,543 3,097,603
Cleveland, OH 491,336,124 1,821,725 3,662,000
Colorado Springs, CO 31,679,942 37,800 825,000
Columbus, OH 249,696,461 1,109,810 6,349,191
Dallas/Ft. Worth, TX 606,575,493 27,413,196 17,925,189
Dayton, OH 115,338,432 1,852,889 1,041,350
Denver, CO 246,663,515 6,026,330 3,934,602
Detroit, MI 497,962,535 3,584,663 3,802,353
El Paso, TX 52,323,996 286,718 236,542
Fort Myers/Naples, FL 41,973,946 217,453 349,560
Fredericksburg, VA 13,529,712 900,000 0
Ft. Lauderdale, FL 87,825,789 664,923 1,538,751
Greenville, SC 190,163,844 1,011,100 5,229,327
Hampton Roads, VA 97,358,305 599,580 245,000
Hartford, CT 92,879,133 782,850 123,200
Houston, TX 416,388,219 5,145,688 6,438,689
Indianapolis, IN 256,848,077 8,153,415 5,904,630
Inland Empire CA 517,858,172 19,402,682 25,223,635
Jacksonville, FL 107,082,686 2,573,476 814,005
Kansas City, MO 215,287,073 7,275,990 5,403,324
Lakeland, FL 30,898,925 790,716 636,120
Las Vegas, NV 117,324,620 5,564,750 1,947,244
Long Island, NY 130,769,166 24,000 695,297
Los Angeles, CA 1,080,641,455 6,020,423 6,365,058
Louisville, KY 155,848,256 5,426,549 5,798,798
Memphis, TN 192,588,615 2,641,192 5,261,192
Miami, FL 157,981,410 3,067,904 3,172,892
Milwaukee, WI 198,105,182 1,287,067 906,316
Minneapolis, MN 108,663,837 3,092,587 1,627,979
MarketBeat U.S. Q4 2017 cushmanwakefield.com | 10
Inventory
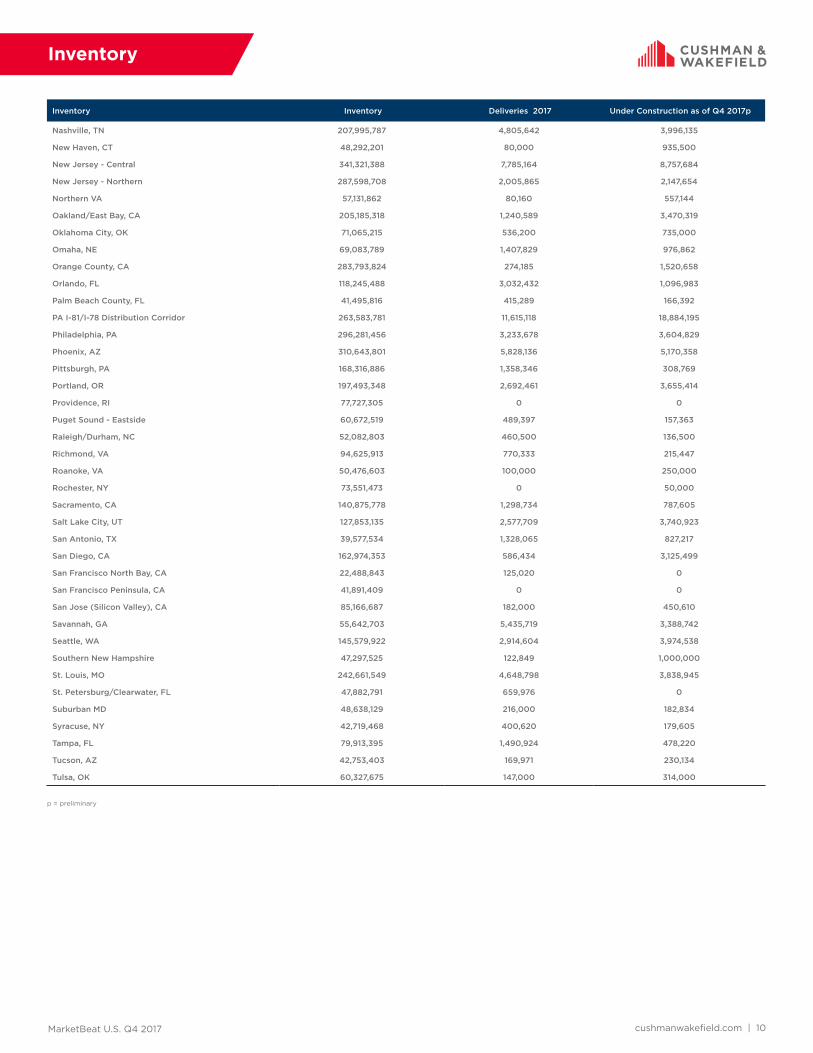
Inventory Inventory Deliveries 2017 Under Construction as of Q4 2017p
Nashville, TN 207,995,787 4,805,642 3,996,135
New Haven, CT 48,292,201 80,000 935,500
New Jersey - Central 341,321,388 7,785,164 8,757,684
New Jersey - Northern 287,598,708 2,005,865 2,147,654
Northern VA 57,131,862 80,160 557,144
Oakland/East Bay, CA 205,185,318 1,240,589 3,470,319
Oklahoma City, OK 71,065,215 536,200 735,000
Omaha, NE 69,083,789 1,407,829 976,862
Orange County, CA 283,793,824 274,185 1,520,658
Orlando, FL 118,245,488 3,032,432 1,096,983
Palm Beach County, FL 41,495,816 415,289 166,392
PA I-81/I-78 Distribution Corridor 263,583,781 11,615,118 18,884,195
Philadelphia, PA 296,281,456 3,233,678 3,604,829
Phoenix, AZ 310,643,801 5,828,136 5,170,358
Pittsburgh, PA 168,316,886 1,358,346 308,769
Portland, OR 197,493,348 2,692,461 3,655,414
Providence, RI 77,727,305 0 0
Puget Sound - Eastside 60,672,519 489,397 157,363
Raleigh/Durham, NC 52,082,803 460,500 136,500
Richmond, VA 94,625,913 770,333 215,447
Roanoke, VA 50,476,603 100,000 250,000
Rochester, NY 73,551,473 0 50,000
Sacramento, CA 140,875,778 1,298,734 787,605
Salt Lake City, UT 127,853,135 2,577,709 3,740,923
San Antonio, TX 39,577,534 1,328,065 827,217
San Diego, CA 162,974,353 586,434 3,125,499
San Francisco North Bay, CA 22,488,843 125,020 0
San Francisco Peninsula, CA 41,891,409 0 0
San Jose (Silicon Valley), CA 85,166,687 182,000 450,610
Savannah, GA 55,642,703 5,435,719 3,388,742
Seattle, WA 145,579,922 2,914,604 3,974,538
Southern New Hampshire 47,297,525 122,849 1,000,000
St. Louis, MO 242,661,549 4,648,798 3,838,945
St. Petersburg/Clearwater, FL 47,882,791 659,976 0
Suburban MD 48,638,129 216,000 182,834
Syracuse, NY 42,719,468 400,620 179,605
Tampa, FL 79,913,395 1,490,924 478,220
Tucson, AZ 42,753,403 169,971 230,134
Tulsa, OK 60,327,675 147,000 314,000
p = preliminary

Methodology
Cushman & Wakefield’s quarterly estimates are derived from a variety of data sources, including its own proprietary database, and historical data from third party data sources. The market statistics are calculated from a base building inventory made up of industrial properties deemed to be competitive in the local industrial markets. Generally, owner-occupied and federally-owned buildings are not included. Older buildings unfit for occupancy or ones that require substantial renovation before tenancy are generally not included in the competitive inventory. The inventory is subject to revisions due to resampling. Vacant space is defined as space that is available immediately or imminently after the end of the quarter. Sublet space still occupied by the tenant is not counted as available space. The figures provided for the current quarter are preliminary, and all information contained in the report is subject to correction of errors and revisions based on additional data received.
Regional Map
WestMidwestSouthNortheast
Jason Tolliver Head of Logistics &Industrial Research Americas Tel: +1 317.639.0549 cushmanwakefield.com
Explanation of Terms
Total Inventory: The total amount of industrial space (in buildings of a
predetermined size by market) that can be rented by a third party.
Overall Vacancy Rate: The amount of unoccupied space (new, relet, and
sublet) expressed as a percentage of total inventory.
Absorption: The net change in occupied space between two points in time.
(Total occupied space in the present quarter minus total occupied space from
the previous quarter, quoted on a net, not gross, basis.)
Leasing Activity: The sum of all leases over a period of time. This includes
pre-leasing activity as well as expansions. It does not include renewals.
Overall Weighted Asking Rents: NNN average asking rents weighted by the
amount of available direct and sublease space in industrial properties.
W/D: Warehouse and or distribution properties.
MFG: Manufacturing properties.
About Cushman & Wakefield
Cushman & Wakefield is a leading global real estate services firm with 45,000 employees in more than 70 countries helping occupiers and investors optimize the value of their real estate. Cushman & Wakefield is among the largest commercial real estate services firms with revenue of $6 billion across core services of agency leasing, asset services, capital markets, facility services (C&W Services), global occupier services, investment & asset management (DTZ Investors), project & development services, tenant representation, and valuation & advisory. To learn more, visit www.cushmanwakefield.com or follow @CushWake on Twitter.
Cushman & Wakefield Copyright 2018. No warranty or representation, express or implied, is made to the accuracy or completeness of the information contained herein, and same is submitted subject to errors, omissions, change of price, rental or other conditions, withdrawal without notice, and to any special listing conditions imposed by the property owner(s). As applicable, we make no representation as to the condition of the property (or properties) in question.
Carolyn Salzer Analyst, Logistics & Industrial Research Americas Tel: +1 847.518.3212 cushmanwakefield.com
cushmanwakefield.com | 1
U.S. IndustrialQ3 2017
MARKETBEAT
U.S. INDUSTRIAL
Overall Vacancy
Net Absorption/Rent NNN 4-QTR TRAILING AVERAGE
Market Indicators
Q3 16 Q3 17 12-Month Forecast
Overall Vacancy 5.5% 5.1%
Net Absorption 78.5M 66.5M
Under Construction 214.6M 233.1M
Weighted Asking Rent (NNN) $5.57 $5.80
Rent Growth (Yr/Yr % Chg.) 5.1% 4.1%
Employment IndicatorsQ3 16 Q3 17 12-Month
Forecast
Total Nonfarm Employment 144.7M 146.6M
Industrial Employment 25.2M 25.6M
Unemployment 4.9% 4.3%
$4.00
$4.50
$5.00
$5.50
$6.00
0
10
20
30
40
50
60
70
80
2013 2014 2015 2016 2017 2018Net Absorption, MSF Weighted Asking Rent, $ PSF
Forecast
0.0%
2.0%
4.0%
6.0%
8.0%
10.0%
2013 2014 2015 2016 2017 2018
Historical Average = 8.2%
Forecast
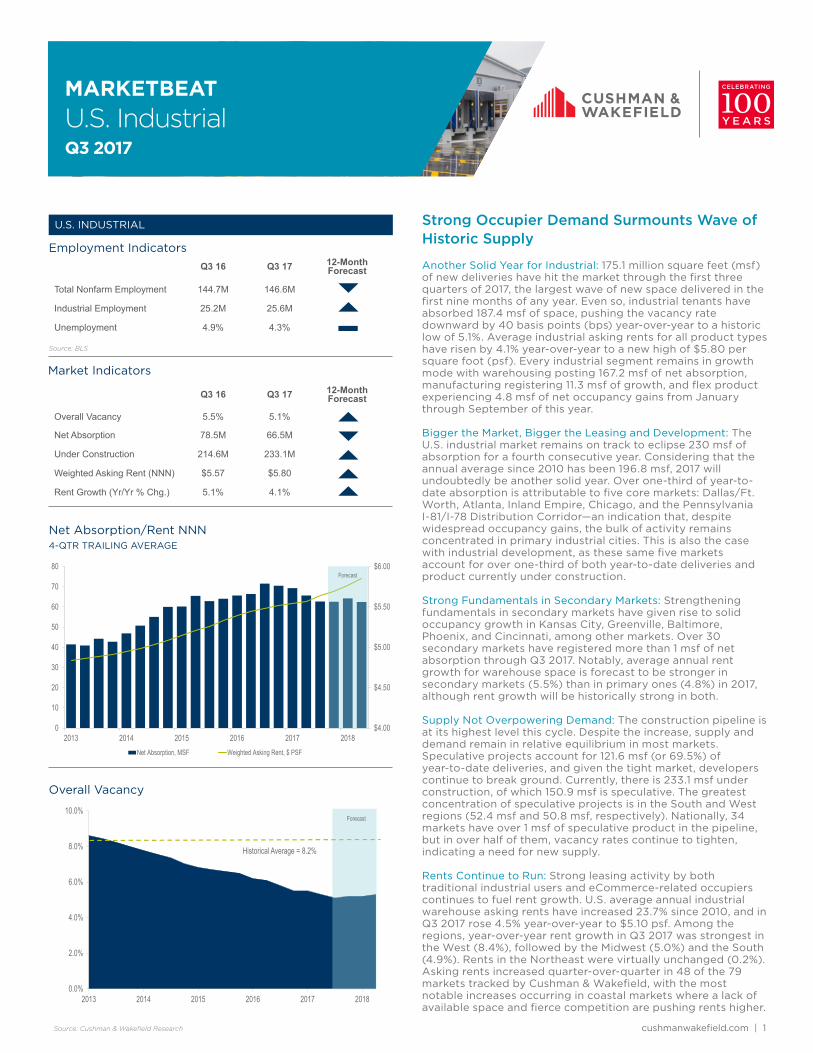
Strong Occupier Demand Surmounts Wave of Historic Supply
Another Solid Year for Industrial: 175.1 million square feet (msf) of new deliveries have hit the market through the first three quarters of 2017, the largest wave of new space delivered in the first nine months of any year. Even so, industrial tenants have absorbed 187.4 msf of space, pushing the vacancy rate downward by 40 basis points (bps) year-over-year to a historic low of 5.1%. Average industrial asking rents for all product types have risen by 4.1% year-over-year to a new high of $5.80 per square foot (psf). Every industrial segment remains in growth mode with warehousing posting 167.2 msf of net absorption, manufacturing registering 11.3 msf of growth, and flex product experiencing 4.8 msf of net occupancy gains from January through September of this year.
Bigger the Market, Bigger the Leasing and Development: The U.S. industrial market remains on track to eclipse 230 msf of absorption for a fourth consecutive year. Considering that the annual average since 2010 has been 196.8 msf, 2017 will undoubtedly be another solid year. Over one-third of year-to-date absorption is attributable to five core markets: Dallas/Ft. Worth, Atlanta, Inland Empire, Chicago, and the Pennsylvania I-81/I-78 Distribution Corridor—an indication that, despite widespread occupancy gains, the bulk of activity remains concentrated in primary industrial cities. This is also the case with industrial development, as these same five markets account for over one-third of both year-to-date deliveries and product currently under construction.
Strong Fundamentals in Secondary Markets: Strengthening fundamentals in secondary markets have given rise to solid occupancy growth in Kansas City, Greenville, Baltimore, Phoenix, and Cincinnati, among other markets. Over 30 secondary markets have registered more than 1 msf of net absorption through Q3 2017. Notably, average annual rent growth for warehouse space is forecast to be stronger in secondary markets (5.5%) than in primary ones (4.8%) in 2017, although rent growth will be historically strong in both.
Supply Not Overpowering Demand: The construction pipeline is at its highest level this cycle. Despite the increase, supply and demand remain in relative equilibrium in most markets. Speculative projects account for 121.6 msf (or 69.5%) of year-to-date deliveries, and given the tight market, developers continue to break ground. Currently, there is 233.1 msf under construction, of which 150.9 msf is speculative. The greatest concentration of speculative projects is in the South and West regions (52.4 msf and 50.8 msf, respectively). Nationally, 34 markets have over 1 msf of speculative product in the pipeline, but in over half of them, vacancy rates continue to tighten, indicating a need for new supply.
Rents Continue to Run: Strong leasing activity by both traditional industrial users and eCommerce-related occupiers continues to fuel rent growth. U.S. average annual industrial warehouse asking rents have increased 23.7% since 2010, and in Q3 2017 rose 4.5% year-over-year to $5.10 psf. Among the regions, year-over-year rent growth in Q3 2017 was strongest in the West (8.4%), followed by the Midwest (5.0%) and the South (4.9%). Rents in the Northeast were virtually unchanged (0.2%). Asking rents increased quarter-over-quarter in 48 of the 79 markets tracked by Cushman & Wakefield, with the most notable increases occurring in coastal markets where a lack of available space and fierce competition are pushing rents higher.
Source: Cushman & Wakefield Research
Source: BLS
cushmanwakefield.com | 2
U.S. IndustrialQ3 2017
MARKETBEAT
Solid Demand in Primary and Secondary Markets YEAR-TO-DATE NET ABSORPTION (MSF)
Few Signs of Overbuilding YEAR-TO-DATE DELIVERIES BY TYPE: (MSF), VACANCY (YOY CHG, BPS)
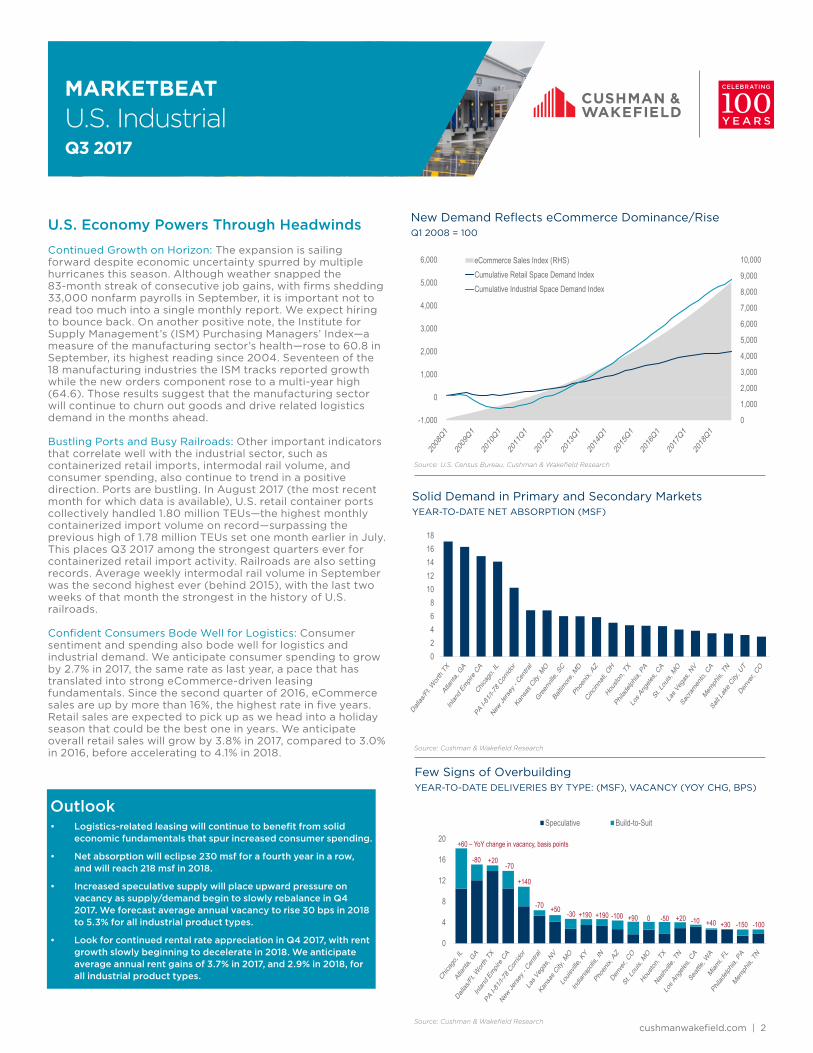
New Demand Reflects eCommerce Dominance/Rise Q1 2008 = 100
Outlook• Logistics-related leasing will continue to benefit from solid
economic fundamentals that spur increased consumer spending.
• Net absorption will eclipse 230 msf for a fourth year in a row, and will reach 218 msf in 2018.
• Increased speculative supply will place upward pressure on vacancy as supply/demand begin to slowly rebalance in Q4 2017. We forecast average annual vacancy to rise 30 bps in 2018 to 5.3% for all industrial product types.
• Look for continued rental rate appreciation in Q4 2017, with rent growth slowly beginning to decelerate in 2018. We anticipate average annual rent gains of 3.7% in 2017, and 2.9% in 2018, for all industrial product types.
Source: U.S. Census Bureau, Cushman & Wakefield Research
Source: Cushman & Wakefield Research
Source: Cushman & Wakefield Research
U.S. Economy Powers Through Headwinds
Continued Growth on Horizon: The expansion is sailing forward despite economic uncertainty spurred by multiple hurricanes this season. Although weather snapped the 83-month streak of consecutive job gains, with firms shedding 33,000 nonfarm payrolls in September, it is important not to read too much into a single monthly report. We expect hiring to bounce back. On another positive note, the Institute for Supply Management’s (ISM) Purchasing Managers’ Index—a measure of the manufacturing sector’s health—rose to 60.8 in September, its highest reading since 2004. Seventeen of the 18 manufacturing industries the ISM tracks reported growth while the new orders component rose to a multi-year high (64.6). Those results suggest that the manufacturing sector will continue to churn out goods and drive related logistics demand in the months ahead.
Bustling Ports and Busy Railroads: Other important indicators that correlate well with the industrial sector, such as containerized retail imports, intermodal rail volume, and consumer spending, also continue to trend in a positive direction. Ports are bustling. In August 2017 (the most recent month for which data is available), U.S. retail container ports collectively handled 1.80 million TEUs—the highest monthly containerized import volume on record—surpassing the previous high of 1.78 million TEUs set one month earlier in July. This places Q3 2017 among the strongest quarters ever for containerized retail import activity. Railroads are also setting records. Average weekly intermodal rail volume in September was the second highest ever (behind 2015), with the last two weeks of that month the strongest in the history of U.S. railroads.
Confident Consumers Bode Well for Logistics: Consumer sentiment and spending also bode well for logistics and industrial demand. We anticipate consumer spending to grow by 2.7% in 2017, the same rate as last year, a pace that has translated into strong eCommerce-driven leasing fundamentals. Since the second quarter of 2016, eCommerce sales are up by more than 16%, the highest rate in five years. Retail sales are expected to pick up as we head into a holiday season that could be the best one in years. We anticipate overall retail sales will grow by 3.8% in 2017, compared to 3.0% in 2016, before accelerating to 4.1% in 2018.
02468
1012141618
0
1,000
2,000
3,000
4,000
5,000
6,000
7,000
8,000
9,000
10,000
-1,000
0
1,000
2,000
3,000
4,000
5,000
6,000 eCommerce Sales Index (RHS)Cumulative Retail Space Demand IndexCumulative Industrial Space Demand Index
0
4
8
12
16
20
Speculative Build-to-Suit
+60 – YoY change in vacancy, basis points
-80 +20-70
+140
-70 +50 -30 +190 +190 -100 +90 0 -50 +20 -10 +40 +30 -150 -100

MarketBeat U.S. Q3 2017 cushmanwakefield.com | 3
Net Absorption Leasing Activity
Demand Indicators (Overall) Q3 2016 Q4 2016 Q1 2017 Q2 2017 Q3 2017p Q3 2017p
United States 78,483,313 63,129,827 58,229,698 62,638,053 66,513,919 118,981,266
Northeast 17,790,157 7,233,913 5,748,978 12,011,270 8,472,310 17,159,732
Midwest 23,968,635 15,788,785 13,095,694 12,254,016 15,432,229 18,697,924
South 21,353,134 27,857,093 24,562,079 26,155,357 24,810,369 39,194,870
West 15,371,387 12,250,036 14,822,947 12,217,410 17,799,011 43,928,740
U.S. Industrial Report Markets Q3 2016 Q4 2016 Q1 2017 Q2 2017 Q3 2017p Q3 2017p
Atlanta, GA 2,245,312 3,546,425 6,399,144 6,264,777 3,648,731 6,414,640
Austin, TX 80,659 116,610 -209,019 134,562 -310,320 516,135
Baltimore, MD 1,029,640 944,082 506,693 2,913,206 2,573,184 1,778,967
Binghamton, NY 80,204 8,605 99,383 80,590 40,000 40,000
Birmingham, AL 826,217 33,863 -340,522 12,600 70,051 174,362
Boston, MA 2,190,787 996,083 -267,560 116,651 -141,078 351,738
Buffalo, NY 500,257 1,217,645 -952,685 94,497 164,966 288,683
Central Valley, CA 971,895 2,031,463 -421,586 90,068 647,686 994,709
Charleston, SC -42,512 1,001,344 1,211,292 -273,598 -182,081 418,901
Charlotte, NC 1,158,781 1,812,029 756,188 1,145,159 332,705 n/a
Chicago, IL 10,474,949 4,149,725 3,051,662 7,466,514 3,612,071 3,330,265
Cincinnati, OH 1,833,726 556,179 4,407,420 199,615 426,950 1,217,160
Cleveland, OH 331,032 1,187,461 180,990 739,053 119,114 749,456
Colorado Springs, CO -97,504 -160,026 -54,690 29,210 651,506 234,241
Columbus, OH 1,349,355 2,080,666 193,936 -195,634 1,426,826 2,672,048
Dallas/Ft. Worth, TX 7,200,702 5,298,286 6,771,134 5,587,211 4,758,387 5,541,158
Dayton, OH 306,394 525,747 971,866 204,599 -499,194 135,682
Denver, CO 746,413 596,022 161,477 1,272,015 1,537,380 1,690,291
Detroit, MI 1,070,776 985,441 -59,666 89,640 1,311,972 1,477,521
El Paso, TX -293,711 -78,692 76,000 357,161 376,794 1,178,035
Fort Myers/Naples, FL 272,489 206,876 218,558 191,401 -31,237 92,915
Fredericksburg, VA 189,844 173,790 -130,887 176,438 73,387 53,081
Ft. Lauderdale, FL 702,011 858,893 570,792 49,340 179,962 870,828
Greenville, SC 1,560,194 1,353,175 1,784,144 1,856,762 2,373,548 637,388
Hampton Roads, VA -3,892 -359,777 473,881 1,001,321 724,245 291,335
Hartford, CT 866,772 125,862 183,652 261,345 27,817 412,282
Houston, TX 810,247 4,065,736 1,288,474 603,380 2,771,280 6,031,173
Indianapolis, IN 3,108,214 1,848,702 381,033 424,423 2,130,644 3,509,689
Inland Empire CA 3,784,917 3,636,653 4,238,816 3,666,936 7,042,746 11,816,138
Jacksonville, FL 239,728 161,043 288,006 442,976 1,484,796 255,831
Kansas City, MO 1,134,989 1,840,583 2,449,729 2,756,998 1,667,542 2,897,265
Lakeland, FL 231,791 93,900 300,673 -6,466 336,566 832,390
Las Vegas, NV 698,467 955,129 540,804 1,813,670 1,481,844 n/a
Long Island, NY 365,094 -230,288 -74,069 -47,352 233,960 701,149
Los Angeles, CA 1,783,386 250,202 1,770,796 1,031,454 1,727,125 8,759,081
Louisville, KY 491,942 322,851 502,185 56,395 1,219,602 2,138,200
Memphis, TN 695,753 3,011,967 1,719,834 1,219,093 486,717 3,463,589
Miami, FL 624,408 438,808 716,099 -272,557 128,146 1,133,563
Milwaukee, WI 585,596 -12,492 327 201,877 1,484,545 502,233
Minneapolis, MN 459,794 519,293 -361,946 477,473 872,326 n/a
Demand Indicators
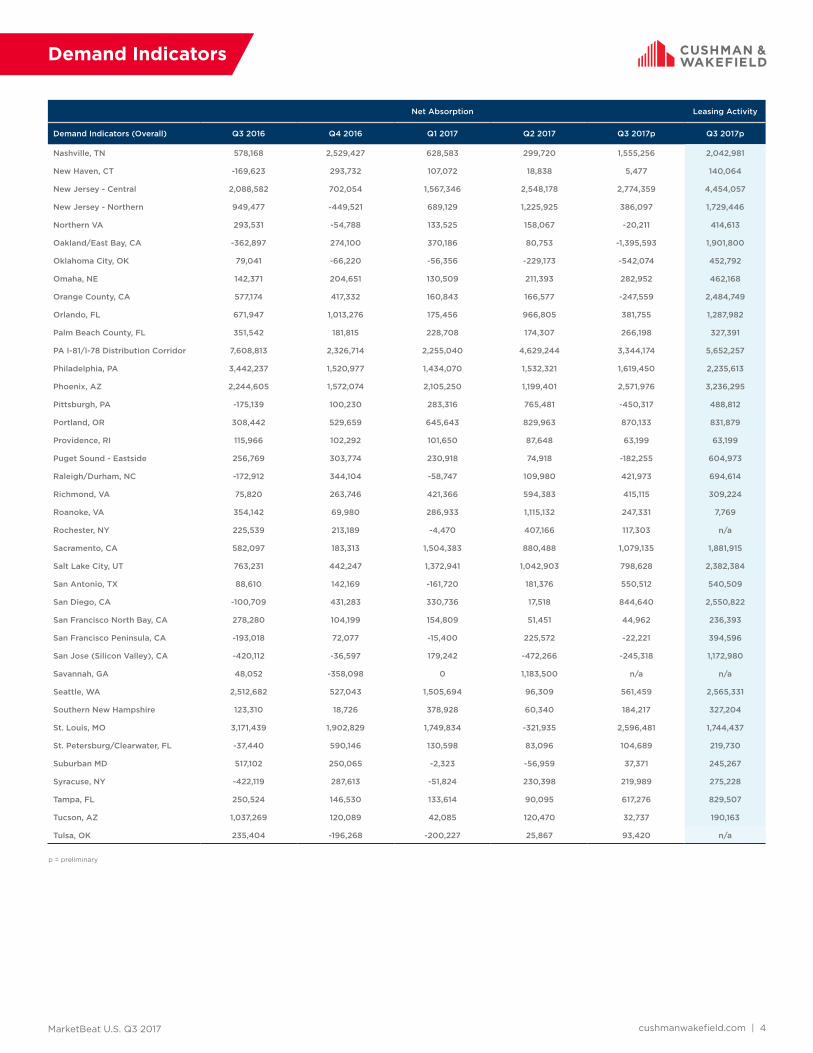
MarketBeat U.S. Q3 2017 cushmanwakefield.com | 4
Net Absorption Leasing Activity
Demand Indicators (Overall) Q3 2016 Q4 2016 Q1 2017 Q2 2017 Q3 2017p Q3 2017p
Nashville, TN 578,168 2,529,427 628,583 299,720 1,555,256 2,042,981
New Haven, CT -169,623 293,732 107,072 18,838 5,477 140,064
New Jersey - Central 2,088,582 702,054 1,567,346 2,548,178 2,774,359 4,454,057
New Jersey - Northern 949,477 -449,521 689,129 1,225,925 386,097 1,729,446
Northern VA 293,531 -54,788 133,525 158,067 -20,211 414,613
Oakland/East Bay, CA -362,897 274,100 370,186 80,753 -1,395,593 1,901,800
Oklahoma City, OK 79,041 -66,220 -56,356 -229,173 -542,074 452,792
Omaha, NE 142,371 204,651 130,509 211,393 282,952 462,168
Orange County, CA 577,174 417,332 160,843 166,577 -247,559 2,484,749
Orlando, FL 671,947 1,013,276 175,456 966,805 381,755 1,287,982
Palm Beach County, FL 351,542 181,815 228,708 174,307 266,198 327,391
PA I-81/I-78 Distribution Corridor 7,608,813 2,326,714 2,255,040 4,629,244 3,344,174 5,652,257
Philadelphia, PA 3,442,237 1,520,977 1,434,070 1,532,321 1,619,450 2,235,613
Phoenix, AZ 2,244,605 1,572,074 2,105,250 1,199,401 2,571,976 3,236,295
Pittsburgh, PA -175,139 100,230 283,316 765,481 -450,317 488,812
Portland, OR 308,442 529,659 645,643 829,963 870,133 831,879
Providence, RI 115,966 102,292 101,650 87,648 63,199 63,199
Puget Sound - Eastside 256,769 303,774 230,918 74,918 -182,255 604,973
Raleigh/Durham, NC -172,912 344,104 -58,747 109,980 421,973 694,614
Richmond, VA 75,820 263,746 421,366 594,383 415,115 309,224
Roanoke, VA 354,142 69,980 286,933 1,115,132 247,331 7,769
Rochester, NY 225,539 213,189 -4,470 407,166 117,303 n/a
Sacramento, CA 582,097 183,313 1,504,383 880,488 1,079,135 1,881,915
Salt Lake City, UT 763,231 442,247 1,372,941 1,042,903 798,628 2,382,384
San Antonio, TX 88,610 142,169 -161,720 181,376 550,512 540,509
San Diego, CA -100,709 431,283 330,736 17,518 844,640 2,550,822
San Francisco North Bay, CA 278,280 104,199 154,809 51,451 44,962 236,393
San Francisco Peninsula, CA -193,018 72,077 -15,400 225,572 -22,221 394,596
San Jose (Silicon Valley), CA -420,112 -36,597 179,242 -472,266 -245,318 1,172,980
Savannah, GA 48,052 -358,098 0 1,183,500 n/a n/a
Seattle, WA 2,512,682 527,043 1,505,694 96,309 561,459 2,565,331
Southern New Hampshire 123,310 18,726 378,928 60,340 184,217 327,204
St. Louis, MO 3,171,439 1,902,829 1,749,834 -321,935 2,596,481 1,744,437
St. Petersburg/Clearwater, FL -37,440 590,146 130,598 83,096 104,689 219,730
Suburban MD 517,102 250,065 -2,323 -56,959 37,371 245,267
Syracuse, NY -422,119 287,613 -51,824 230,398 219,989 275,228
Tampa, FL 250,524 146,530 133,614 90,095 617,276 829,507
Tucson, AZ 1,037,269 120,089 42,085 120,470 32,737 190,163
Tulsa, OK 235,404 -196,268 -200,227 25,867 93,420 n/a
Demand Indicators
p = preliminary

MarketBeat U.S. Q3 2017 cushmanwakefield.com | 5
Vacancy Rates
Overall Vacancy Rate Q3 2016 Q4 2016 Q1 2017 Q2 2017 Q3 2017p
United States 5.5% 5.5% 5.3% 5.3% 5.1%
Northeast 6.3% 6.2% 5.7% 5.5% 5.3%
Midwest 5.4% 5.5% 5.5% 5.4% 5.4%
South 6.6% 6.6% 6.6% 6.5% 6.3%
West 4.1% 4.0% 3.7% 3.6% 3.7%
U.S. Industrial Report Markets Q3 2016 Q4 2016 Q1 2017 Q2 2017 Q3 2017p
Atlanta, GA 8.6% 9.0% 8.7% 8.4% 7.8%
Austin, TX 7.5% 6.4% 9.5% 8.6% 9.5%
Baltimore, MD 7.0% 6.6% 7.9% 7.3% 6.9%
Binghamton, NY 11.7% 10.8% 11.3% 10.3% 9.8%
Birmingham, AL 9.0% 8.8% 11.4% 11.3% 10.8%
Boston, MA 6.7% 6.4% 6.6% 6.5% 6.4%
Buffalo, NY 8.9% 8.9% 9.2% 9.0% 8.9%
Central Valley, CA 5.2% 3.4% 3.4% 3.8% 3.3%
Charleston, SC 6.8% 6.8% 4.7% 6.0% 8.0%
Charlotte, NC 3.8% 3.6% 3.4% 3.6% 3.6%
Chicago, IL 6.1% 6.3% 6.4% 6.3% 6.7%
Cincinnati, OH 4.2% 4.2% 3.0% 3.3% 3.4%
Cleveland, OH 4.9% 4.6% 4.6% 4.2% 3.8%
Colorado Springs, CO 9.8% 10.1% 9.9% 9.6% 10.0%
Columbus, OH 5.9% 5.5% 5.6% 5.9% 5.1%
Dallas/Ft. Worth, TX 6.6% 6.9% 7.2% 6.9% 6.8%
Dayton, OH 8.1% 8.0% 7.7% 7.6% 8.2%
Denver, CO 3.9% 4.3% 4.9% 4.8% 4.8%
Detroit, MI 4.0% 4.0% 3.5% 3.5% 3.1%
El Paso, TX 7.1% 6.8% 6.8% 5.7% 5.0%
Fort Myers/Naples, FL 3.3% 2.8% 2.2% 2.0% 1.8%
Fredericksburg, VA 8.1% 7.6% 6.6% 5.3% 4.7%
Ft. Lauderdale, FL 5.5% 4.4% 4.5% 4.4% 4.0%
Greenville, SC 6.9% 6.6% 6.5% 6.2% 5.8%
Hampton Roads, VA 6.3% 6.6% 5.1% 5.0% 4.5%
Hartford, CT 11.9% 11.7% 8.1% 8.3% 8.1%
Houston, TX 6.7% 7.1% 7.0% 6.8% 6.2%
Indianapolis, IN 3.6% 3.0% 5.1% 5.1% 5.5%
Inland Empire CA 4.7% 4.4% 4.0% 4.1% 4.0%
Jacksonville, FL 6.5% 6.2% 5.6% 5.4% 4.8%
Kansas City, MO 7.5% 8.3% 8.3% 7.8% 7.2%
Lakeland, FL 4.2% 3.7% 5.1% 5.1% 3.9%
Las Vegas, NV 5.6% 5.1% 5.7% 6.0% 6.1%
Long Island, NY 6.5% 6.6% 6.8% 6.9% 6.5%
Los Angeles, CA 1.3% 1.4% 1.3% 1.2% 1.2%
Louisville, KY 6.2% 6.6% 7.2% 7.7% 8.1%
Memphis, TN 9.2% 8.7% 8.1% 8.4% 8.2%
Miami, FL 4.4% 4.3% 4.2% 5.0% 4.7%
Milwaukee, WI 4.0% 4.4% 4.5% 4.5% 3.8%
Minneapolis, MN 8.4% 8.2% 8.7% 8.7% 8.0%

MarketBeat U.S. Q3 2017 cushmanwakefield.com | 6
Vacancy Rates
Overall Vacancy Rate Q3 2016 Q4 2016 Q1 2017 Q2 2017 Q3 2017p
Nashville, TN 3.1% 2.9% 3.2% 2.9% 3.3%
New Haven, CT 13.2% 12.6% 9.2% 9.8% 9.8%
New Jersey - Central 4.3% 4.2% 4.1% 4.3% 3.6%
New Jersey - Northern 5.9% 5.9% 5.5% 4.8% 4.6%
Northern VA 9.2% 9.2% 8.8% 8.5% 8.7%
Oakland/East Bay, CA 3.1% 2.6% 2.2% 2.4% 3.1%
Oklahoma City, OK 6.7% 7.3% 6.8% 7.5% 9.0%
Omaha, NE 3.2% 3.2% 3.1% 3.3% 3.6%
Orange County, CA 2.2% 2.0% 2.0% 1.9% 1.9%
Orlando, FL 5.1% 4.6% 5.1% 5.6% 5.5%
Palm Beach County, FL 3.8% 4.2% 3.5% 3.6% 3.3%
PA I-81/I-78 Distribution Corridor 3.9% 4.7% 5.1% 5.3% 5.3%
Philadelphia, PA 4.9% 4.2% 3.9% 3.7% 3.4%
Phoenix, AZ 9.3% 9.1% 8.9% 8.6% 8.3%
Pittsburgh, PA 6.0% 5.7% 5.7% 4.8% 4.8%
Portland, OR 4.3% 4.0% 3.9% 3.2% 3.5%
Providence, RI 0.2% 0.3% 0.2% 0.2% 0.1%
Puget Sound - Eastside 4.9% 4.7% 4.3% 4.3% 4.9%
Raleigh/Durham, NC 6.2% 5.9% 6.5% 6.2% 5.5%
Richmond, VA 6.9% 6.6% 5.4% 5.1% 4.8%
Roanoke, VA 8.3% 7.2% 8.0% 7.3% 7.1%
Rochester, NY 9.9% 9.6% 9.6% 9.0% 9.0%
Sacramento, CA 8.9% 10.8% 6.2% 5.6% 4.8%
Salt Lake City, UT 7.5% 7.2% 6.1% 5.4% 5.8%
San Antonio, TX 9.6% 9.6% 9.2% 8.6% 7.4%
San Diego, CA 5.1% 5.3% 5.1% 5.1% 4.8%
San Francisco North Bay, CA 5.2% 5.5% 5.2% 5.1% 5.0%
San Francisco Peninsula, CA 2.9% 2.6% 2.6% 2.1% 2.1%
San Jose (Silicon Valley), CA 2.6% 3.3% 3.2% 3.6% 3.8%
Savannah, GA 2.3% 3.0% 3.0% 3.2% 3.2%
Seattle, WA 3.8% 3.8% 3.4% 3.7% 4.2%
Southern New Hampshire 15.8% 15.7% 6.3% 6.8% 7.5%
St. Louis, MO 6.7% 7.0% 6.7% 6.8% 6.7%
St. Petersburg/Clearwater, FL 5.8% 4.7% 4.1% 4.0% 3.5%
Suburban MD 11.6% 10.7% 9.9% 10.5% 10.4%
Syracuse, NY 11.3% 10.6% 10.7% 9.9% 8.8%
Tampa, FL 5.6% 5.5% 5.0% 5.4% 5.2%
Tucson, AZ 8.1% 7.8% 7.4% 7.1% 8.2%
Tulsa, OK 7.4% 7.6% 8.8% 9.1% 8.9%
p = preliminary

MarketBeat U.S. Q3 2017 cushmanwakefield.com | 7
Asking Rents
Overall (All Property Types) W/D MFG
Weighted Average Asking Rent Q3 2016 Q4 2016 Q1 2017 Q2 2017 Q3 2017p Q3 2017p
United States $5.57 $5.63 $5.68 $5.70 $5.80 $5.10 $5.56
Northeast $6.02 $6.03 $6.12 $6.03 $6.03 $5.85 $4.86
Midwest $4.39 $4.42 $4.48 $4.57 $4.61 $4.28 $4.46
South $5.18 $5.21 $5.22 $5.26 $5.44 $4.63 $4.59
West $7.41 $7.65 $7.92 $7.98 $8.03 $6.87 $8.62
U.S. Industrial Report Markets Q3 2016 Q4 2016 Q1 2017 Q2 2017 Q3 2017p Q3 2017p
Atlanta, GA $4.17 $4.20 $4.31 $4.35 $4.54 $3.82 $4.17
Austin, TX $9.75 $9.71 $9.27 $9.21 $9.34 $6.72 n/a
Baltimore, MD $5.49 $5.35 $5.08 $4.78 $5.10 $4.54 n/a
Binghamton, NY $4.81 $4.71 $4.70 $4.64 $4.58 $3.96 $4.29
Birmingham, AL $4.70 $5.01 $4.18 $4.23 $4.09 $3.71 n/a
Boston, MA $6.17 $6.22 $6.61 $6.85 $6.97 $6.37 $8.07
Buffalo, NY $4.98 $4.98 $4.13 $4.13 $4.13 $4.25 $3.95
Central Valley, CA $4.06 $4.08 $4.30 $4.25 $4.39 $4.20 $4.48
Charleston, SC $5.31 $5.26 $5.36 $5.35 $5.48 $5.65 $4.71
Charlotte, NC $5.17 $5.15 $5.11 $5.27 $5.29 $4.65 $3.96
Chicago, IL $4.79 $4.76 $4.87 $4.98 $5.03 $4.82 $4.66
Cincinnati, OH $3.91 $4.06 $4.33 $4.27 $4.33 $3.95 $3.85
Cleveland, OH $3.88 $3.94 $3.99 $4.10 $4.12 $3.82 n/a
Colorado Springs, CO $7.27 $7.40 $8.02 $7.42 $8.48 $7.01 $6.65
Columbus, OH $3.35 $3.43 $3.46 $3.46 $3.46 $3.46 n/a
Dallas/Ft. Worth, TX $4.89 $4.84 $4.86 $4.93 $5.59 $4.16 $3.26
Dayton, OH $3.19 $3.21 $3.32 $3.32 $3.33 $3.54 $2.96
Denver, CO $7.23 $7.57 $8.03 $8.10 $8.03 $6.42 $8.18
Detroit, MI $5.26 $5.26 $5.36 $5.53 $5.56 $5.22 $4.88
El Paso, TX $3.95 $3.95 $3.95 $3.95 $4.00 $4.00 $3.95
Fort Myers/Naples, FL $6.72 $6.80 $7.44 $7.45 $7.50 $7.08 $9.70
Fredericksburg, VA $5.65 $5.67 $5.71 $5.69 $5.73 $5.29 $4.62
Ft. Lauderdale, FL $9.52 $8.69 $8.92 $9.12 $9.21 $8.33 $8.51
Greenville, SC $3.55 $4.16 $3.58 $3.58 $3.63 $3.28 $3.89
Hampton Roads, VA $5.21 $5.42 $5.08 $5.05 $5.00 $4.74 $5.85
Hartford, CT $4.32 $4.08 $4.53 $4.21 $4.24 $4.58 $3.49
Houston, TX $6.12 $6.14 $6.23 $6.28 $6.40 $6.17 $6.28
Indianapolis, IN $3.55 $3.62 $3.70 $3.74 $3.76 $3.43 $3.35
Inland Empire CA $6.58 $6.82 $7.28 $7.42 $7.52 $6.98 $8.45
Jacksonville, FL $4.34 $4.24 $4.63 $4.74 $4.98 $4.50 $4.26
Kansas City, MO $4.51 $4.41 $4.38 $4.45 $4.43 $3.81 $4.58
Lakeland, FL $4.85 $5.00 $5.17 $5.18 $5.76 $5.25 $5.95
Las Vegas, NV $7.86 $7.27 $7.88 $7.76 $7.30 $6.06 n/a
Long Island, NY $8.53 $8.86 $9.97 $9.25 $9.21 $8.97 $9.75
Los Angeles, CA $8.79 $9.08 $9.25 $9.05 $9.00 $8.55 $8.88
Louisville, KY $3.67 $3.68 $3.76 $3.76 $3.70 $3.59 $3.43
Memphis, TN $2.49 $2.55 $2.73 $2.81 $2.75 $2.23 n/a
Miami, FL $7.32 $8.32 $7.98 $8.13 $8.25 $8.11 $6.70
Milwaukee, WI $4.39 $4.35 $4.45 $4.55 $4.59 $4.06 $4.73
Minneapolis, MN $4.78 $4.78 $4.79 $4.80 $4.90 $4.63 n/a
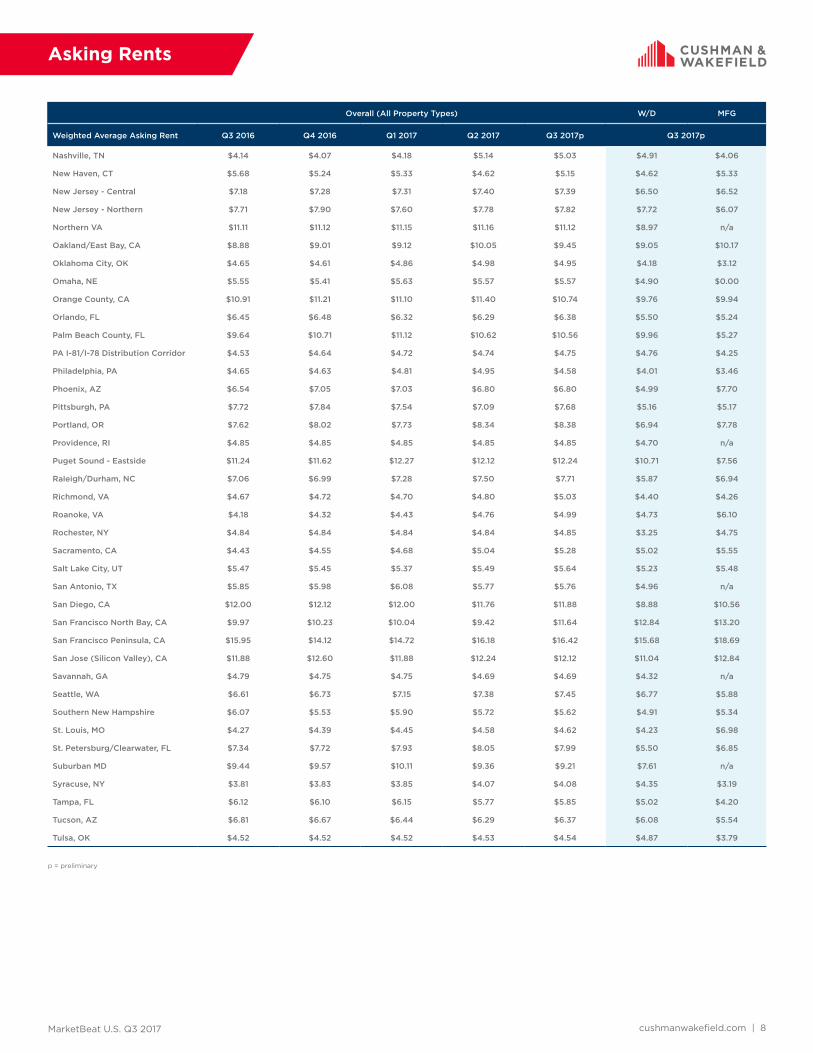
MarketBeat U.S. Q3 2017 cushmanwakefield.com | 8
Asking Rents
p = preliminary
Overall (All Property Types) W/D MFG
Weighted Average Asking Rent Q3 2016 Q4 2016 Q1 2017 Q2 2017 Q3 2017p Q3 2017p
Nashville, TN $4.14 $4.07 $4.18 $5.14 $5.03 $4.91 $4.06
New Haven, CT $5.68 $5.24 $5.33 $4.62 $5.15 $4.62 $5.33
New Jersey - Central $7.18 $7.28 $7.31 $7.40 $7.39 $6.50 $6.52
New Jersey - Northern $7.71 $7.90 $7.60 $7.78 $7.82 $7.72 $6.07
Northern VA $11.11 $11.12 $11.15 $11.16 $11.12 $8.97 n/a
Oakland/East Bay, CA $8.88 $9.01 $9.12 $10.05 $9.45 $9.05 $10.17
Oklahoma City, OK $4.65 $4.61 $4.86 $4.98 $4.95 $4.18 $3.12
Omaha, NE $5.55 $5.41 $5.63 $5.57 $5.57 $4.90 $0.00
Orange County, CA $10.91 $11.21 $11.10 $11.40 $10.74 $9.76 $9.94
Orlando, FL $6.45 $6.48 $6.32 $6.29 $6.38 $5.50 $5.24
Palm Beach County, FL $9.64 $10.71 $11.12 $10.62 $10.56 $9.96 $5.27
PA I-81/I-78 Distribution Corridor $4.53 $4.64 $4.72 $4.74 $4.75 $4.76 $4.25
Philadelphia, PA $4.65 $4.63 $4.81 $4.95 $4.58 $4.01 $3.46
Phoenix, AZ $6.54 $7.05 $7.03 $6.80 $6.80 $4.99 $7.70
Pittsburgh, PA $7.72 $7.84 $7.54 $7.09 $7.68 $5.16 $5.17
Portland, OR $7.62 $8.02 $7.73 $8.34 $8.38 $6.94 $7.78
Providence, RI $4.85 $4.85 $4.85 $4.85 $4.85 $4.70 n/a
Puget Sound - Eastside $11.24 $11.62 $12.27 $12.12 $12.24 $10.71 $7.56
Raleigh/Durham, NC $7.06 $6.99 $7.28 $7.50 $7.71 $5.87 $6.94
Richmond, VA $4.67 $4.72 $4.70 $4.80 $5.03 $4.40 $4.26
Roanoke, VA $4.18 $4.32 $4.43 $4.76 $4.99 $4.73 $6.10
Rochester, NY $4.84 $4.84 $4.84 $4.84 $4.85 $3.25 $4.75
Sacramento, CA $4.43 $4.55 $4.68 $5.04 $5.28 $5.02 $5.55
Salt Lake City, UT $5.47 $5.45 $5.37 $5.49 $5.64 $5.23 $5.48
San Antonio, TX $5.85 $5.98 $6.08 $5.77 $5.76 $4.96 n/a
San Diego, CA $12.00 $12.12 $12.00 $11.76 $11.88 $8.88 $10.56
San Francisco North Bay, CA $9.97 $10.23 $10.04 $9.42 $11.64 $12.84 $13.20
San Francisco Peninsula, CA $15.95 $14.12 $14.72 $16.18 $16.42 $15.68 $18.69
San Jose (Silicon Valley), CA $11.88 $12.60 $11.88 $12.24 $12.12 $11.04 $12.84
Savannah, GA $4.79 $4.75 $4.75 $4.69 $4.69 $4.32 n/a
Seattle, WA $6.61 $6.73 $7.15 $7.38 $7.45 $6.77 $5.88
Southern New Hampshire $6.07 $5.53 $5.90 $5.72 $5.62 $4.91 $5.34
St. Louis, MO $4.27 $4.39 $4.45 $4.58 $4.62 $4.23 $6.98
St. Petersburg/Clearwater, FL $7.34 $7.72 $7.93 $8.05 $7.99 $5.50 $6.85
Suburban MD $9.44 $9.57 $10.11 $9.36 $9.21 $7.61 n/a
Syracuse, NY $3.81 $3.83 $3.85 $4.07 $4.08 $4.35 $3.19
Tampa, FL $6.12 $6.10 $6.15 $5.77 $5.85 $5.02 $4.20
Tucson, AZ $6.81 $6.67 $6.44 $6.29 $6.37 $6.08 $5.54
Tulsa, OK $4.52 $4.52 $4.52 $4.53 $4.54 $4.87 $3.79

MarketBeat U.S. Q3 2017 cushmanwakefield.com | 9
Inventory
Inventory Inventory Deliveries YTD 2017 Under Construction as of Q3 2017p
United States 14,184,082,899 175,121,330 233,139,664
Northeast 2,126,249,356 22,990,154 31,046,483
Midwest 3,906,040,453 41,569,945 51,101,913
South 4,222,836,471 66,811,720 83,178,210
West 3,928,956,619 43,749,511 67,813,058
U.S. Industrial Report Markets Inventory Deliveries YTD 2017 Under Construction as of Q3 2017p
Atlanta, GA 566,250,405 15,081,069 14,764,889
Austin, TX 38,842,099 857,296 735,551
Baltimore, MD 204,005,922 2,275,186 7,734,614
Binghamton, NY 17,613,764 0 700,000
Birmingham, AL 14,708,455 0 239,500
Boston, MA 131,629,792 375,455 910,153
Buffalo, NY 111,277,196 55,000 280,400
Central Valley, CA 115,918,565 1,434,726 4,405,420
Charleston, SC 66,147,732 1,825,987 5,673,518
Charlotte, NC 179,957,857 1,509,406 1,345,483
Chicago, IL 1,190,601,524 18,174,074 12,345,925
Cincinnati, OH 283,465,530 2,555,490 2,985,696
Cleveland, OH 491,173,199 1,301,725 2,956,000
Colorado Springs, CO 31,784,430 27,400 956,040
Columbus, OH 249,081,544 556,031 6,321,045
Dallas/Ft. Worth, TX 596,166,524 14,941,372 13,506,691
Dayton, OH 114,340,765 1,145,689 1,337,360
Denver, CO 244,759,750 4,125,630 4,096,565
Detroit, MI 495,580,651 1,775,201 3,365,603
El Paso, TX 52,037,278 0 436,218
Fort Myers/Naples, FL 41,844,642 105,953 393,360
Fredericksburg, VA 13,219,632 900,000 0
Ft. Lauderdale, FL 87,673,380 664,923 1,009,382
Greenville, SC 188,236,790 766,600 0
Hampton Roads, VA 99,984,162 399,580 620,000
Hartford, CT 92,730,283 634,000 398,850
Houston, TX 414,877,322 4,087,158 4,370,915
Indianapolis, IN 253,640,978 4,460,415 7,026,399
Inland Empire CA 512,107,885 13,871,766 28,694,557
Jacksonville, FL 105,540,696 1,033,000 2,185,476
Kansas City, MO 212,730,704 4,688,819 7,185,944
Lakeland, FL 30,906,725 798,516 605,920
Las Vegas, NV 121,600,121 5,400,269 2,816,463
Long Island, NY 130,673,678 24,000 695,297
Los Angeles, CA 1,078,875,024 3,571,366 7,947,993
Louisville, KY 155,050,668 4,628,961 6,323,715
Memphis, TN 192,588,615 2,641,192 4,645,752
Miami, FL 157,928,023 2,747,294 2,762,058
Milwaukee, WI 197,826,440 886,330 1,362,845
Minneapolis, MN 106,052,379 825,015 2,443,423

MarketBeat U.S. Q3 2017 cushmanwakefield.com | 10
Inventory
Inventory Inventory Deliveries YTD 2017 Under Construction as of Q3 2017p
Nashville, TN 205,752,356 4,032,602 4,220,675
New Haven, CT 48,292,201 80,000 0
New Jersey - Central 340,589,581 6,319,357 7,379,818
New Jersey - Northern 286,312,012 657,361 2,256,037
Northern VA 57,131,862 80,160 557,144
Oakland/East Bay, CA 205,014,843 974,185 1,502,582
Oklahoma City, OK 71,065,215 536,200 735,000
Omaha, NE 68,888,299 1,100,736 1,020,955
Orange County, CA 283,736,914 274,185 1,520,658
Orlando, FL 117,336,971 2,131,843 1,836,336
Palm Beach County, FL 41,453,954 415,289 166,392
PA I-81/I-78 Distribution Corridor 262,530,994 10,835,118 14,311,346
Philadelphia, PA 295,816,523 2,661,198 2,469,432
Phoenix, AZ 309,392,931 4,364,574 1,992,949
Pittsburgh, PA 168,147,736 1,189,196 281,150
Portland, OR 196,092,237 2,067,328 2,418,650
Providence, RI 77,727,305 0 n/a
Puget Sound - Eastside 61,482,797 425,447 229,677
Raleigh/Durham, NC 52,208,150 460,500 768,000
Richmond, VA 94,257,888 397,600 726,046
Roanoke, VA 50,333,435 100,000 250,000
Rochester, NY 73,551,473 0 50,000
Sacramento, CA 140,600,555 1,348,678 748,179
Salt Lake City, UT 127,293,336 2,017,910 4,164,423
San Antonio, TX 40,211,544 920,814 1,178,398
San Diego, CA 162,910,024 497,434 2,352,167
San Francisco North Bay, CA 22,086,925 125,020 0
San Francisco Peninsula, CA 41,931,381 0 0
San Jose (Silicon Valley), CA 85,112,391 182,000 450,610
Savannah, GA 51,503,655 1,043,671 5,092,142
Seattle, WA 145,536,940 2,871,622 3,285,991
Southern New Hampshire 46,790,937 122,849 1,000,000
St. Louis, MO 242,658,440 4,100,420 2,750,718
St. Petersburg/Clearwater, FL 47,561,160 341,976 286,000
Suburban MD 48,594,729 216,000 136,666
Syracuse, NY 42,565,881 36,620 364,000
Tampa, FL 79,130,950 724,572 903,852
Tucson, AZ 42,719,570 169,971 230,134
Tulsa, OK 60,327,675 147,000 314,000
p = preliminary
Methodology
Cushman & Wakefield’s quarterly estimates are derived from a variety of data sources, including its own proprietary database, and historical data from third party data sources. The market statistics are calculated from a base building inventory made up of industrial properties deemed to be competitive in the local industrial markets. Generally, owner-occupied and federally-owned buildings are not included. Older buildings unfit for occupancy or ones that require substantial renovation before tenancy are generally not included in the competitive inventory. The inventory is subject to revisions due to resampling. Vacant space is defined as space that is available immediately or imminently after the end of the quarter. Sublet space still occupied by the tenant is not counted as available space. The figures provided for the current quarter are preliminary, and all information contained in the report is subject to correction of errors and revisions based on additional data received.
Regional Map
WestMidwestSouthNortheast
Jason Tolliver Head of Industrial Research, Americas Tel: +1 317.639.0549 cushmanwakefield.com
Explanation of Terms
Total Inventory: The total amount of industrial space (in buildings of a
predetermined size by market) that can be rented by a third party.
Overall Vacancy Rate: The amount of unoccupied space (new, relet, and
sublet) expressed as a percentage of total inventory.
Absorption: The net change in occupied space between two points in time.
(Total occupied space in the present quarter minus total occupied space from
the previous quarter, quoted on a net, not gross, basis.)
Leasing Activity: The sum of all leases over a period of time. This includes
pre-leasing activity as well as expansions. It does not include renewals.
Overall Weighted Asking Rents: NNN average asking rents weighted by the
amount of available direct and sublease space in industrial properties.
W/D: Warehouse and or distribution properties.
MFG: Manufacturing properties.
About Cushman & Wakefield
Cushman & Wakefield is a leading global real estate services firm that helps clients transform the way people work, shop, and live. Our 45,000 employees in more than 70 countries help occupiers and investors optimize the value of their real estate by combining our global perspective and deep local knowledge with an impressive platform of real estate solutions. Cushman & Wakefield is among the largest commercial real estate services firms with revenue of $6 billion across core services of agency leasing, asset services, capital markets, facility services (C&W Services), global occupier services, investment & asset management (DTZ Investors), project & development services, tenant representation, and valuation & advisory. 2017 marks the 100-year anniversary of the Cushman & Wakefield brand. 100 years of taking our clients’ ideas and putting them into action. To learn more, visit www.cushwakecentennial.com, www.cushmanwakefield.com or follow @CushWake on Twitter.
Cushman & Wakefield Copyright 2017. No warranty or representation, express or implied, is made to the accuracy or completeness of the information contained herein, and same is submitted subject to errors, omissions, change of price, rental or other conditions, withdrawal without notice, and to any special listing conditions imposed by the property owner(s). As applicable, we make no representation as to the condition of the property (or properties) in question.
Carolyn Salzer Industrial Research Analyst, Americas Tel: +1 847.518.3212 cushmanwakefield.com
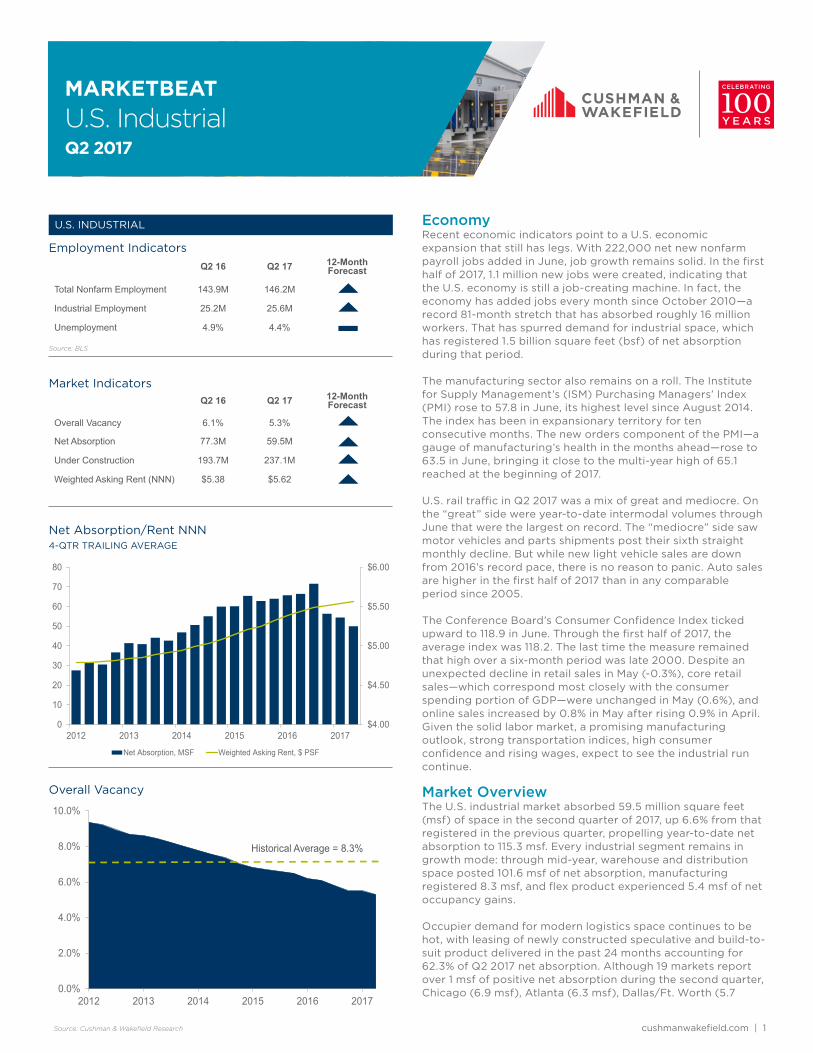
cushmanwakefield.com | 1
U.S. IndustrialQ2 2017
MARKETBEAT
U.S. INDUSTRIAL
Overall Vacancy
Net Absorption/Rent NNN 4-QTR TRAILING AVERAGE
Market IndicatorsQ2 16 Q2 17 12-Month
Forecast
Overall Vacancy 6.1% 5.3%
Net Absorption 77.3M 59.5M
Under Construction 193.7M 237.1M
Weighted Asking Rent (NNN) $5.38 $5.62
Employment IndicatorsQ2 16 Q2 17 12-Month
Forecast
Total Nonfarm Employment 143.9M 146.2M
Industrial Employment 25.2M 25.6M
Unemployment 4.9% 4.4%
$4.00
$4.50
$5.00
$5.50
$6.00
0
10
20
30
40
50
60
70
80
2012 2013 2014 2015 2016 2017
Net Absorption, MSF Weighted Asking Rent, $ PSF
0.0%
2.0%
4.0%
6.0%
8.0%
10.0%
2012 2013 2014 2015 2016 2017
Historical Average = 8.3%
EconomyRecent economic indicators point to a U.S. economic expansion that still has legs. With 222,000 net new nonfarm payroll jobs added in June, job growth remains solid. In the first half of 2017, 1.1 million new jobs were created, indicating that the U.S. economy is still a job-creating machine. In fact, the economy has added jobs every month since October 2010—a record 81-month stretch that has absorbed roughly 16 million workers. That has spurred demand for industrial space, which has registered 1.5 billion square feet (bsf) of net absorption during that period.
The manufacturing sector also remains on a roll. The Institute for Supply Management’s (ISM) Purchasing Managers’ Index (PMI) rose to 57.8 in June, its highest level since August 2014. The index has been in expansionary territory for ten consecutive months. The new orders component of the PMI—a gauge of manufacturing’s health in the months ahead—rose to 63.5 in June, bringing it close to the multi-year high of 65.1 reached at the beginning of 2017.
U.S. rail traffic in Q2 2017 was a mix of great and mediocre. On the “great” side were year-to-date intermodal volumes through June that were the largest on record. The “mediocre” side saw motor vehicles and parts shipments post their sixth straight monthly decline. But while new light vehicle sales are down from 2016’s record pace, there is no reason to panic. Auto sales are higher in the first half of 2017 than in any comparable period since 2005.
The Conference Board’s Consumer Confidence Index ticked upward to 118.9 in June. Through the first half of 2017, the average index was 118.2. The last time the measure remained that high over a six-month period was late 2000. Despite an unexpected decline in retail sales in May (-0.3%), core retail sales—which correspond most closely with the consumer spending portion of GDP—were unchanged in May (0.6%), and online sales increased by 0.8% in May after rising 0.9% in April. Given the solid labor market, a promising manufacturing outlook, strong transportation indices, high consumer confidence and rising wages, expect to see the industrial run continue.
Market OverviewThe U.S. industrial market absorbed 59.5 million square feet (msf) of space in the second quarter of 2017, up 6.6% from that registered in the previous quarter, propelling year-to-date net absorption to 115.3 msf. Every industrial segment remains in growth mode: through mid-year, warehouse and distribution space posted 101.6 msf of net absorption, manufacturing registered 8.3 msf, and flex product experienced 5.4 msf of net occupancy gains.
Occupier demand for modern logistics space continues to be hot, with leasing of newly constructed speculative and build-to-suit product delivered in the past 24 months accounting for 62.3% of Q2 2017 net absorption. Although 19 markets report over 1 msf of positive net absorption during the second quarter, Chicago (6.9 msf), Atlanta (6.3 msf), Dallas/Ft. Worth (5.7
Source: Cushman & Wakefield Research
Source: BLS
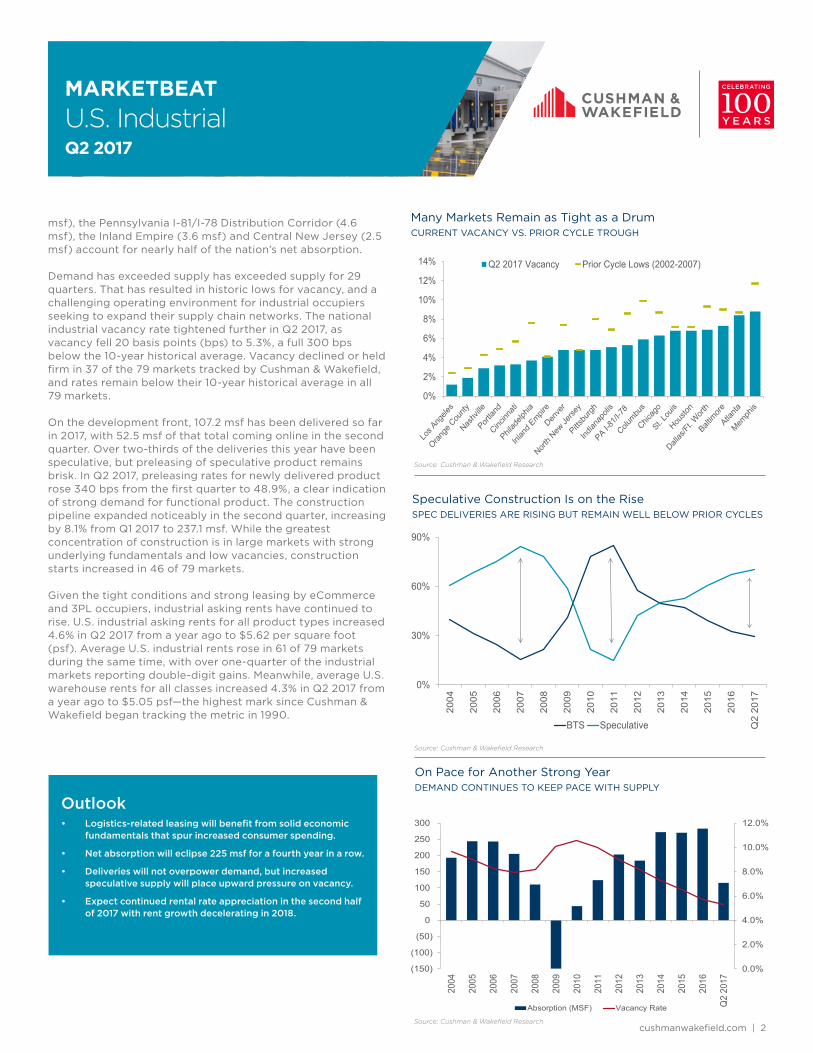
cushmanwakefield.com | 2
U.S. IndustrialQ2 2017
MARKETBEAT
Speculative Construction Is on the Rise SPEC DELIVERIES ARE RISING BUT REMAIN WELL BELOW PRIOR CYCLES
On Pace for Another Strong Year DEMAND CONTINUES TO KEEP PACE WITH SUPPLY
Many Markets Remain as Tight as a Drum CURRENT VACANCY VS. PRIOR CYCLE TROUGH
Outlook• Logistics-related leasing will benefit from solid economic
fundamentals that spur increased consumer spending.
• Net absorption will eclipse 225 msf for a fourth year in a row.
• Deliveries will not overpower demand, but increased speculative supply will place upward pressure on vacancy.
• Expect continued rental rate appreciation in the second half of 2017 with rent growth decelerating in 2018.
Source: Cushman & Wakefield Research
Source: Cushman & Wakefield Research
Source: Cushman & Wakefield Research
msf), the Pennsylvania I-81/I-78 Distribution Corridor (4.6 msf), the Inland Empire (3.6 msf) and Central New Jersey (2.5 msf) account for nearly half of the nation’s net absorption.
Demand has exceeded supply has exceeded supply for 29 quarters. That has resulted in historic lows for vacancy, and a challenging operating environment for industrial occupiers seeking to expand their supply chain networks. The national industrial vacancy rate tightened further in Q2 2017, as vacancy fell 20 basis points (bps) to 5.3%, a full 300 bps below the 10-year historical average. Vacancy declined or held firm in 37 of the 79 markets tracked by Cushman & Wakefield, and rates remain below their 10-year historical average in all 79 markets.
On the development front, 107.2 msf has been delivered so far in 2017, with 52.5 msf of that total coming online in the second quarter. Over two-thirds of the deliveries this year have been speculative, but preleasing of speculative product remains brisk. In Q2 2017, preleasing rates for newly delivered product rose 340 bps from the first quarter to 48.9%, a clear indication of strong demand for functional product. The construction pipeline expanded noticeably in the second quarter, increasing by 8.1% from Q1 2017 to 237.1 msf. While the greatest concentration of construction is in large markets with strong underlying fundamentals and low vacancies, construction starts increased in 46 of 79 markets.
Given the tight conditions and strong leasing by eCommerce and 3PL occupiers, industrial asking rents have continued to rise. U.S. industrial asking rents for all product types increased 4.6% in Q2 2017 from a year ago to $5.62 per square foot (psf). Average U.S. industrial rents rose in 61 of 79 markets during the same time, with over one-quarter of the industrial markets reporting double-digit gains. Meanwhile, average U.S. warehouse rents for all classes increased 4.3% in Q2 2017 from a year ago to $5.05 psf—the highest mark since Cushman & Wakefield began tracking the metric in 1990.
0%
30%
60%
90%
2004
2005
2006
2007
2008
2009
2010
2011
2012
2013
2014
2015
2016
Q2
2017
BTS Speculative
0%
2%
4%
6%
8%
10%
12%
14% Q2 2017 Vacancy Prior Cycle Lows (2002-2007)
0.0%
2.0%
4.0%
6.0%
8.0%
10.0%
12.0%
(150)
(100)
(50)
0
50
100
150
200
250
300
2004
2005
2006
2007
2008
2009
2010
2011
2012
2013
2014
2015
2016
Q2
2017
Absorption (MSF) Vacancy Rate
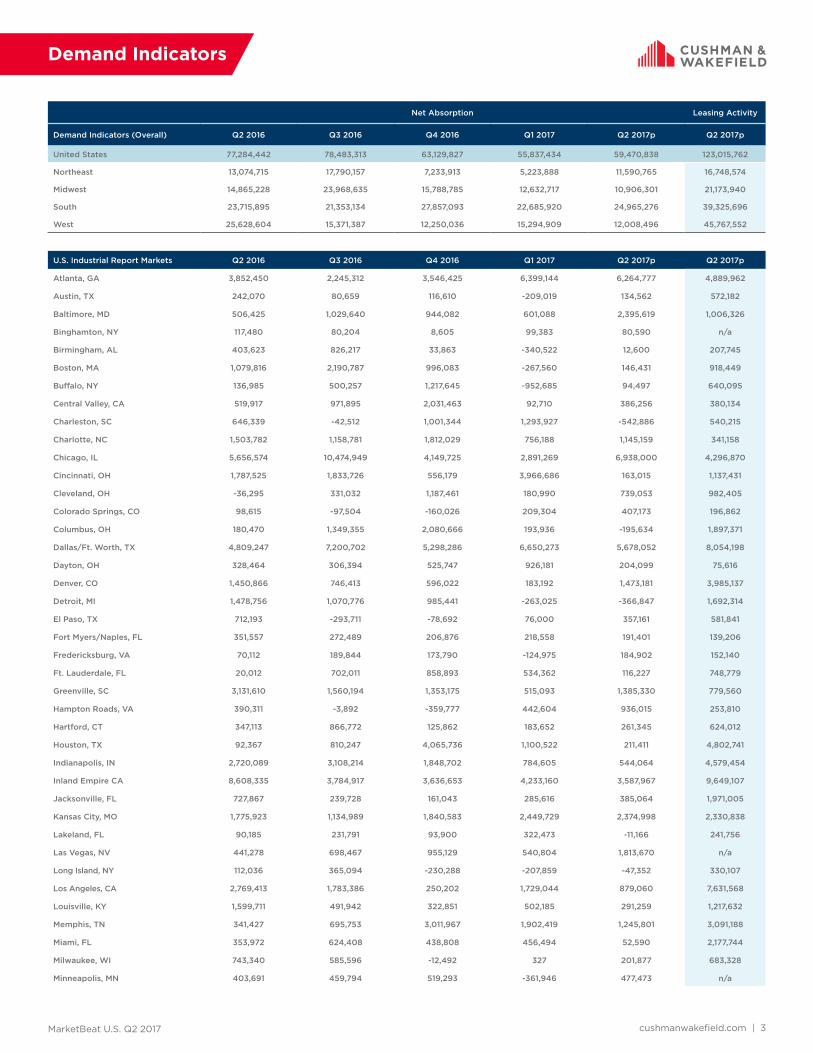
MarketBeat U.S. Q2 2017 cushmanwakefield.com | 3
Net Absorption Leasing Activity
Demand Indicators (Overall) Q2 2016 Q3 2016 Q4 2016 Q1 2017 Q2 2017p Q2 2017p
United States 77,284,442 78,483,313 63,129,827 55,837,434 59,470,838 123,015,762
Northeast 13,074,715 17,790,157 7,233,913 5,223,888 11,590,765 16,748,574
Midwest 14,865,228 23,968,635 15,788,785 12,632,717 10,906,301 21,173,940
South 23,715,895 21,353,134 27,857,093 22,685,920 24,965,276 39,325,696
West 25,628,604 15,371,387 12,250,036 15,294,909 12,008,496 45,767,552
U.S. Industrial Report Markets Q2 2016 Q3 2016 Q4 2016 Q1 2017 Q2 2017p Q2 2017p
Atlanta, GA 3,852,450 2,245,312 3,546,425 6,399,144 6,264,777 4,889,962
Austin, TX 242,070 80,659 116,610 -209,019 134,562 572,182
Baltimore, MD 506,425 1,029,640 944,082 601,088 2,395,619 1,006,326
Binghamton, NY 117,480 80,204 8,605 99,383 80,590 n/a
Birmingham, AL 403,623 826,217 33,863 -340,522 12,600 207,745
Boston, MA 1,079,816 2,190,787 996,083 -267,560 146,431 918,449
Buffalo, NY 136,985 500,257 1,217,645 -952,685 94,497 640,095
Central Valley, CA 519,917 971,895 2,031,463 92,710 386,256 380,134
Charleston, SC 646,339 -42,512 1,001,344 1,293,927 -542,886 540,215
Charlotte, NC 1,503,782 1,158,781 1,812,029 756,188 1,145,159 341,158
Chicago, IL 5,656,574 10,474,949 4,149,725 2,891,269 6,938,000 4,296,870
Cincinnati, OH 1,787,525 1,833,726 556,179 3,966,686 163,015 1,137,431
Cleveland, OH -36,295 331,032 1,187,461 180,990 739,053 982,405
Colorado Springs, CO 98,615 -97,504 -160,026 209,304 407,173 196,862
Columbus, OH 180,470 1,349,355 2,080,666 193,936 -195,634 1,897,371
Dallas/Ft. Worth, TX 4,809,247 7,200,702 5,298,286 6,650,273 5,678,052 8,054,198
Dayton, OH 328,464 306,394 525,747 926,181 204,099 75,616
Denver, CO 1,450,866 746,413 596,022 183,192 1,473,181 3,985,137
Detroit, MI 1,478,756 1,070,776 985,441 -263,025 -366,847 1,692,314
El Paso, TX 712,193 -293,711 -78,692 76,000 357,161 581,841
Fort Myers/Naples, FL 351,557 272,489 206,876 218,558 191,401 139,206
Fredericksburg, VA 70,112 189,844 173,790 -124,975 184,902 152,140
Ft. Lauderdale, FL 20,012 702,011 858,893 534,362 116,227 748,779
Greenville, SC 3,131,610 1,560,194 1,353,175 515,093 1,385,330 779,560
Hampton Roads, VA 390,311 -3,892 -359,777 442,604 936,015 253,810
Hartford, CT 347,113 866,772 125,862 183,652 261,345 624,012
Houston, TX 92,367 810,247 4,065,736 1,100,522 211,411 4,802,741
Indianapolis, IN 2,720,089 3,108,214 1,848,702 784,605 544,064 4,579,454
Inland Empire CA 8,608,335 3,784,917 3,636,653 4,233,160 3,587,967 9,649,107
Jacksonville, FL 727,867 239,728 161,043 285,616 385,064 1,971,005
Kansas City, MO 1,775,923 1,134,989 1,840,583 2,449,729 2,374,998 2,330,838
Lakeland, FL 90,185 231,791 93,900 322,473 -11,166 241,756
Las Vegas, NV 441,278 698,467 955,129 540,804 1,813,670 n/a
Long Island, NY 112,036 365,094 -230,288 -207,859 -47,352 330,107
Los Angeles, CA 2,769,413 1,783,386 250,202 1,729,044 879,060 7,631,568
Louisville, KY 1,599,711 491,942 322,851 502,185 291,259 1,217,632
Memphis, TN 341,427 695,753 3,011,967 1,902,419 1,245,801 3,091,188
Miami, FL 353,972 624,408 438,808 456,494 52,590 2,177,744
Milwaukee, WI 743,340 585,596 -12,492 327 201,877 683,328
Minneapolis, MN 403,691 459,794 519,293 -361,946 477,473 n/a
Demand Indicators
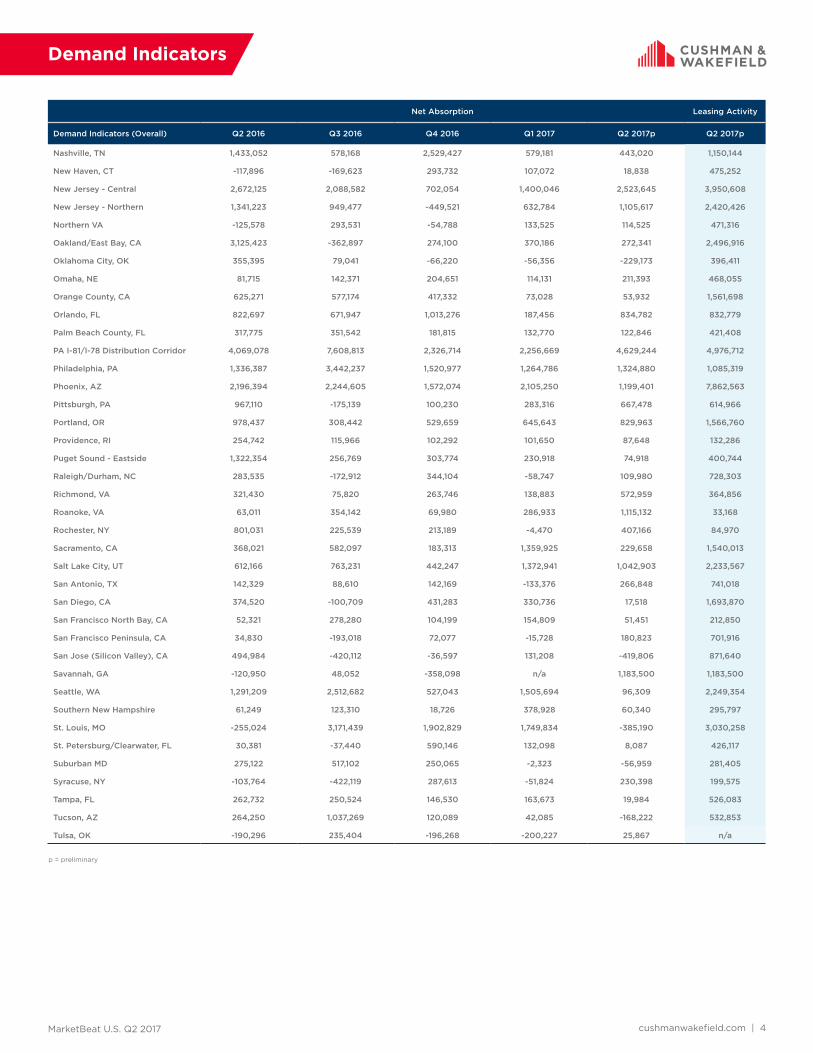
MarketBeat U.S. Q2 2017 cushmanwakefield.com | 4
Net Absorption Leasing Activity
Demand Indicators (Overall) Q2 2016 Q3 2016 Q4 2016 Q1 2017 Q2 2017p Q2 2017p
Nashville, TN 1,433,052 578,168 2,529,427 579,181 443,020 1,150,144
New Haven, CT -117,896 -169,623 293,732 107,072 18,838 475,252
New Jersey - Central 2,672,125 2,088,582 702,054 1,400,046 2,523,645 3,950,608
New Jersey - Northern 1,341,223 949,477 -449,521 632,784 1,105,617 2,420,426
Northern VA -125,578 293,531 -54,788 133,525 114,525 471,316
Oakland/East Bay, CA 3,125,423 -362,897 274,100 370,186 272,341 2,496,916
Oklahoma City, OK 355,395 79,041 -66,220 -56,356 -229,173 396,411
Omaha, NE 81,715 142,371 204,651 114,131 211,393 468,055
Orange County, CA 625,271 577,174 417,332 73,028 53,932 1,561,698
Orlando, FL 822,697 671,947 1,013,276 187,456 834,782 832,779
Palm Beach County, FL 317,775 351,542 181,815 132,770 122,846 421,408
PA I-81/I-78 Distribution Corridor 4,069,078 7,608,813 2,326,714 2,256,669 4,629,244 4,976,712
Philadelphia, PA 1,336,387 3,442,237 1,520,977 1,264,786 1,324,880 1,085,319
Phoenix, AZ 2,196,394 2,244,605 1,572,074 2,105,250 1,199,401 7,862,563
Pittsburgh, PA 967,110 -175,139 100,230 283,316 667,478 614,966
Portland, OR 978,437 308,442 529,659 645,643 829,963 1,566,760
Providence, RI 254,742 115,966 102,292 101,650 87,648 132,286
Puget Sound - Eastside 1,322,354 256,769 303,774 230,918 74,918 400,744
Raleigh/Durham, NC 283,535 -172,912 344,104 -58,747 109,980 728,303
Richmond, VA 321,430 75,820 263,746 138,883 572,959 364,856
Roanoke, VA 63,011 354,142 69,980 286,933 1,115,132 33,168
Rochester, NY 801,031 225,539 213,189 -4,470 407,166 84,970
Sacramento, CA 368,021 582,097 183,313 1,359,925 229,658 1,540,013
Salt Lake City, UT 612,166 763,231 442,247 1,372,941 1,042,903 2,233,567
San Antonio, TX 142,329 88,610 142,169 -133,376 266,848 741,018
San Diego, CA 374,520 -100,709 431,283 330,736 17,518 1,693,870
San Francisco North Bay, CA 52,321 278,280 104,199 154,809 51,451 212,850
San Francisco Peninsula, CA 34,830 -193,018 72,077 -15,728 180,823 701,916
San Jose (Silicon Valley), CA 494,984 -420,112 -36,597 131,208 -419,806 871,640
Savannah, GA -120,950 48,052 -358,098 n/a 1,183,500 1,183,500
Seattle, WA 1,291,209 2,512,682 527,043 1,505,694 96,309 2,249,354
Southern New Hampshire 61,249 123,310 18,726 378,928 60,340 295,797
St. Louis, MO -255,024 3,171,439 1,902,829 1,749,834 -385,190 3,030,258
St. Petersburg/Clearwater, FL 30,381 -37,440 590,146 132,098 8,087 426,117
Suburban MD 275,122 517,102 250,065 -2,323 -56,959 281,405
Syracuse, NY -103,764 -422,119 287,613 -51,824 230,398 199,575
Tampa, FL 262,732 250,524 146,530 163,673 19,984 526,083
Tucson, AZ 264,250 1,037,269 120,089 42,085 -168,222 532,853
Tulsa, OK -190,296 235,404 -196,268 -200,227 25,867 n/a
Demand Indicators
p = preliminary
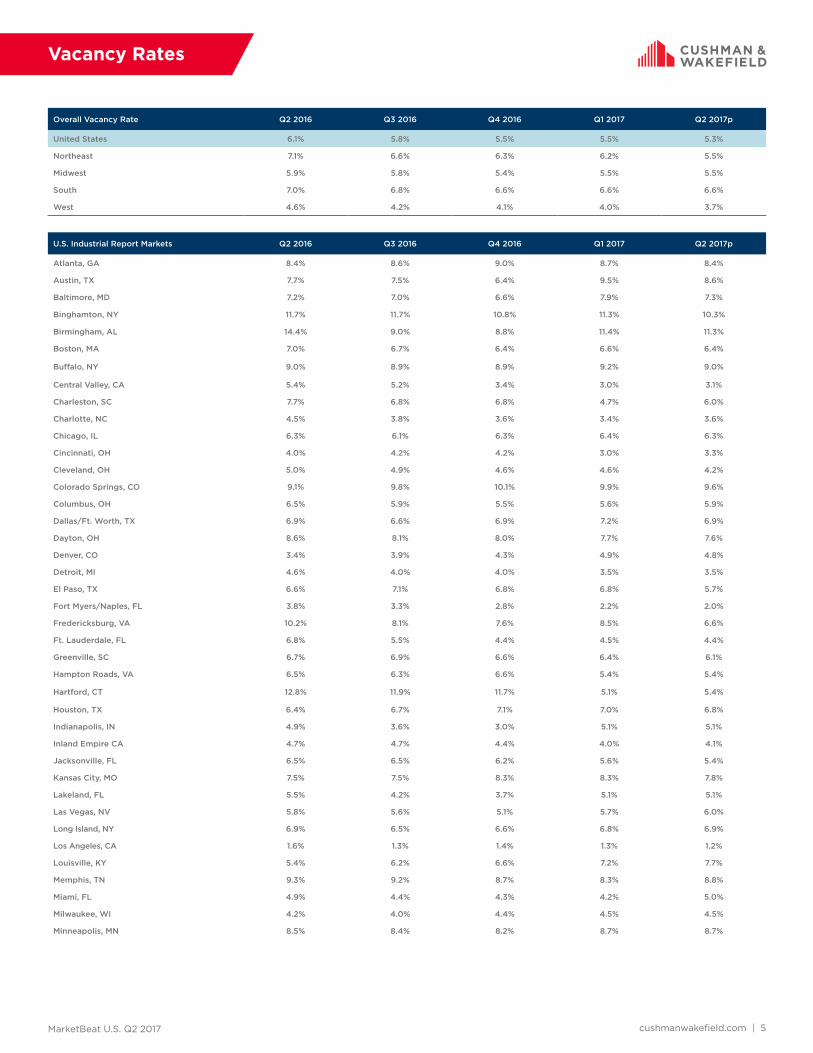
MarketBeat U.S. Q2 2017 cushmanwakefield.com | 5
Vacancy Rates
Overall Vacancy Rate Q2 2016 Q3 2016 Q4 2016 Q1 2017 Q2 2017p
United States 6.1% 5.8% 5.5% 5.5% 5.3%
Northeast 7.1% 6.6% 6.3% 6.2% 5.5%
Midwest 5.9% 5.8% 5.4% 5.5% 5.5%
South 7.0% 6.8% 6.6% 6.6% 6.6%
West 4.6% 4.2% 4.1% 4.0% 3.7%
U.S. Industrial Report Markets Q2 2016 Q3 2016 Q4 2016 Q1 2017 Q2 2017p
Atlanta, GA 8.4% 8.6% 9.0% 8.7% 8.4%
Austin, TX 7.7% 7.5% 6.4% 9.5% 8.6%
Baltimore, MD 7.2% 7.0% 6.6% 7.9% 7.3%
Binghamton, NY 11.7% 11.7% 10.8% 11.3% 10.3%
Birmingham, AL 14.4% 9.0% 8.8% 11.4% 11.3%
Boston, MA 7.0% 6.7% 6.4% 6.6% 6.4%
Buffalo, NY 9.0% 8.9% 8.9% 9.2% 9.0%
Central Valley, CA 5.4% 5.2% 3.4% 3.0% 3.1%
Charleston, SC 7.7% 6.8% 6.8% 4.7% 6.0%
Charlotte, NC 4.5% 3.8% 3.6% 3.4% 3.6%
Chicago, IL 6.3% 6.1% 6.3% 6.4% 6.3%
Cincinnati, OH 4.0% 4.2% 4.2% 3.0% 3.3%
Cleveland, OH 5.0% 4.9% 4.6% 4.6% 4.2%
Colorado Springs, CO 9.1% 9.8% 10.1% 9.9% 9.6%
Columbus, OH 6.5% 5.9% 5.5% 5.6% 5.9%
Dallas/Ft. Worth, TX 6.9% 6.6% 6.9% 7.2% 6.9%
Dayton, OH 8.6% 8.1% 8.0% 7.7% 7.6%
Denver, CO 3.4% 3.9% 4.3% 4.9% 4.8%
Detroit, MI 4.6% 4.0% 4.0% 3.5% 3.5%
El Paso, TX 6.6% 7.1% 6.8% 6.8% 5.7%
Fort Myers/Naples, FL 3.8% 3.3% 2.8% 2.2% 2.0%
Fredericksburg, VA 10.2% 8.1% 7.6% 8.5% 6.6%
Ft. Lauderdale, FL 6.8% 5.5% 4.4% 4.5% 4.4%
Greenville, SC 6.7% 6.9% 6.6% 6.4% 6.1%
Hampton Roads, VA 6.5% 6.3% 6.6% 5.4% 5.4%
Hartford, CT 12.8% 11.9% 11.7% 5.1% 5.4%
Houston, TX 6.4% 6.7% 7.1% 7.0% 6.8%
Indianapolis, IN 4.9% 3.6% 3.0% 5.1% 5.1%
Inland Empire CA 4.7% 4.7% 4.4% 4.0% 4.1%
Jacksonville, FL 6.5% 6.5% 6.2% 5.6% 5.4%
Kansas City, MO 7.5% 7.5% 8.3% 8.3% 7.8%
Lakeland, FL 5.5% 4.2% 3.7% 5.1% 5.1%
Las Vegas, NV 5.8% 5.6% 5.1% 5.7% 6.0%
Long Island, NY 6.9% 6.5% 6.6% 6.8% 6.9%
Los Angeles, CA 1.6% 1.3% 1.4% 1.3% 1.2%
Louisville, KY 5.4% 6.2% 6.6% 7.2% 7.7%
Memphis, TN 9.3% 9.2% 8.7% 8.3% 8.8%
Miami, FL 4.9% 4.4% 4.3% 4.2% 5.0%
Milwaukee, WI 4.2% 4.0% 4.4% 4.5% 4.5%
Minneapolis, MN 8.5% 8.4% 8.2% 8.7% 8.7%
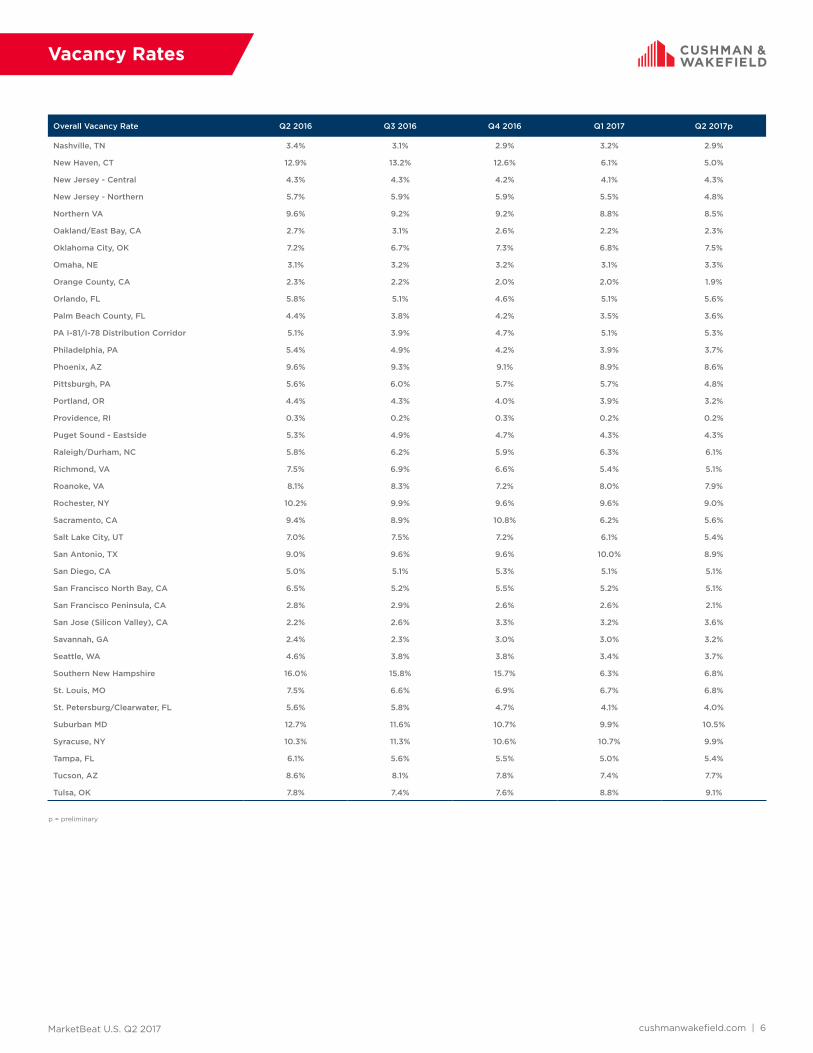
MarketBeat U.S. Q2 2017 cushmanwakefield.com | 6
Vacancy Rates
Overall Vacancy Rate Q2 2016 Q3 2016 Q4 2016 Q1 2017 Q2 2017p
Nashville, TN 3.4% 3.1% 2.9% 3.2% 2.9%
New Haven, CT 12.9% 13.2% 12.6% 6.1% 5.0%
New Jersey - Central 4.3% 4.3% 4.2% 4.1% 4.3%
New Jersey - Northern 5.7% 5.9% 5.9% 5.5% 4.8%
Northern VA 9.6% 9.2% 9.2% 8.8% 8.5%
Oakland/East Bay, CA 2.7% 3.1% 2.6% 2.2% 2.3%
Oklahoma City, OK 7.2% 6.7% 7.3% 6.8% 7.5%
Omaha, NE 3.1% 3.2% 3.2% 3.1% 3.3%
Orange County, CA 2.3% 2.2% 2.0% 2.0% 1.9%
Orlando, FL 5.8% 5.1% 4.6% 5.1% 5.6%
Palm Beach County, FL 4.4% 3.8% 4.2% 3.5% 3.6%
PA I-81/I-78 Distribution Corridor 5.1% 3.9% 4.7% 5.1% 5.3%
Philadelphia, PA 5.4% 4.9% 4.2% 3.9% 3.7%
Phoenix, AZ 9.6% 9.3% 9.1% 8.9% 8.6%
Pittsburgh, PA 5.6% 6.0% 5.7% 5.7% 4.8%
Portland, OR 4.4% 4.3% 4.0% 3.9% 3.2%
Providence, RI 0.3% 0.2% 0.3% 0.2% 0.2%
Puget Sound - Eastside 5.3% 4.9% 4.7% 4.3% 4.3%
Raleigh/Durham, NC 5.8% 6.2% 5.9% 6.3% 6.1%
Richmond, VA 7.5% 6.9% 6.6% 5.4% 5.1%
Roanoke, VA 8.1% 8.3% 7.2% 8.0% 7.9%
Rochester, NY 10.2% 9.9% 9.6% 9.6% 9.0%
Sacramento, CA 9.4% 8.9% 10.8% 6.2% 5.6%
Salt Lake City, UT 7.0% 7.5% 7.2% 6.1% 5.4%
San Antonio, TX 9.0% 9.6% 9.6% 10.0% 8.9%
San Diego, CA 5.0% 5.1% 5.3% 5.1% 5.1%
San Francisco North Bay, CA 6.5% 5.2% 5.5% 5.2% 5.1%
San Francisco Peninsula, CA 2.8% 2.9% 2.6% 2.6% 2.1%
San Jose (Silicon Valley), CA 2.2% 2.6% 3.3% 3.2% 3.6%
Savannah, GA 2.4% 2.3% 3.0% 3.0% 3.2%
Seattle, WA 4.6% 3.8% 3.8% 3.4% 3.7%
Southern New Hampshire 16.0% 15.8% 15.7% 6.3% 6.8%
St. Louis, MO 7.5% 6.6% 6.9% 6.7% 6.8%
St. Petersburg/Clearwater, FL 5.6% 5.8% 4.7% 4.1% 4.0%
Suburban MD 12.7% 11.6% 10.7% 9.9% 10.5%
Syracuse, NY 10.3% 11.3% 10.6% 10.7% 9.9%
Tampa, FL 6.1% 5.6% 5.5% 5.0% 5.4%
Tucson, AZ 8.6% 8.1% 7.8% 7.4% 7.7%
Tulsa, OK 7.8% 7.4% 7.6% 8.8% 9.1%
p = preliminary
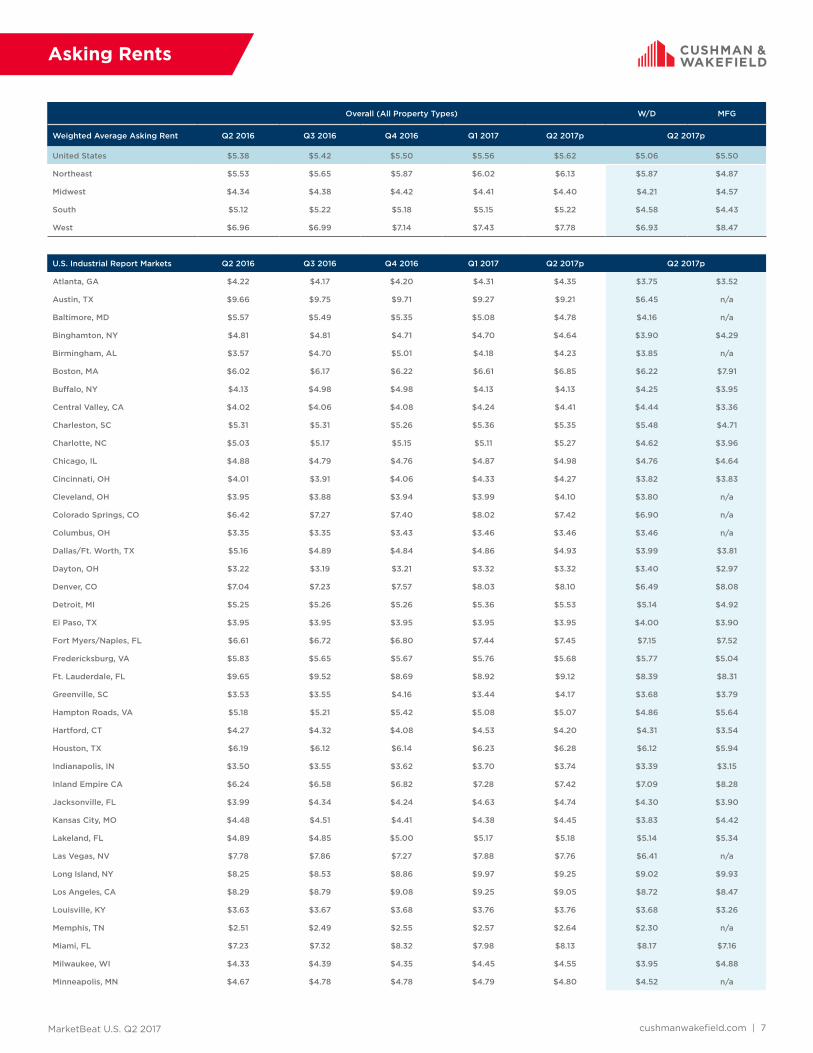
MarketBeat U.S. Q2 2017 cushmanwakefield.com | 7
Asking Rents
Overall (All Property Types) W/D MFG
Weighted Average Asking Rent Q2 2016 Q3 2016 Q4 2016 Q1 2017 Q2 2017p Q2 2017p
United States $5.38 $5.42 $5.50 $5.56 $5.62 $5.06 $5.50
Northeast $5.53 $5.65 $5.87 $6.02 $6.13 $5.87 $4.87
Midwest $4.34 $4.38 $4.42 $4.41 $4.40 $4.21 $4.57
South $5.12 $5.22 $5.18 $5.15 $5.22 $4.58 $4.43
West $6.96 $6.99 $7.14 $7.43 $7.78 $6.93 $8.47
U.S. Industrial Report Markets Q2 2016 Q3 2016 Q4 2016 Q1 2017 Q2 2017p Q2 2017p
Atlanta, GA $4.22 $4.17 $4.20 $4.31 $4.35 $3.75 $3.52
Austin, TX $9.66 $9.75 $9.71 $9.27 $9.21 $6.45 n/a
Baltimore, MD $5.57 $5.49 $5.35 $5.08 $4.78 $4.16 n/a
Binghamton, NY $4.81 $4.81 $4.71 $4.70 $4.64 $3.90 $4.29
Birmingham, AL $3.57 $4.70 $5.01 $4.18 $4.23 $3.85 n/a
Boston, MA $6.02 $6.17 $6.22 $6.61 $6.85 $6.22 $7.91
Buffalo, NY $4.13 $4.98 $4.98 $4.13 $4.13 $4.25 $3.95
Central Valley, CA $4.02 $4.06 $4.08 $4.24 $4.41 $4.44 $3.36
Charleston, SC $5.31 $5.31 $5.26 $5.36 $5.35 $5.48 $4.71
Charlotte, NC $5.03 $5.17 $5.15 $5.11 $5.27 $4.62 $3.96
Chicago, IL $4.88 $4.79 $4.76 $4.87 $4.98 $4.76 $4.64
Cincinnati, OH $4.01 $3.91 $4.06 $4.33 $4.27 $3.82 $3.83
Cleveland, OH $3.95 $3.88 $3.94 $3.99 $4.10 $3.80 n/a
Colorado Springs, CO $6.42 $7.27 $7.40 $8.02 $7.42 $6.90 n/a
Columbus, OH $3.35 $3.35 $3.43 $3.46 $3.46 $3.46 n/a
Dallas/Ft. Worth, TX $5.16 $4.89 $4.84 $4.86 $4.93 $3.99 $3.81
Dayton, OH $3.22 $3.19 $3.21 $3.32 $3.32 $3.40 $2.97
Denver, CO $7.04 $7.23 $7.57 $8.03 $8.10 $6.49 $8.08
Detroit, MI $5.25 $5.26 $5.26 $5.36 $5.53 $5.14 $4.92
El Paso, TX $3.95 $3.95 $3.95 $3.95 $3.95 $4.00 $3.90
Fort Myers/Naples, FL $6.61 $6.72 $6.80 $7.44 $7.45 $7.15 $7.52
Fredericksburg, VA $5.83 $5.65 $5.67 $5.76 $5.68 $5.77 $5.04
Ft. Lauderdale, FL $9.65 $9.52 $8.69 $8.92 $9.12 $8.39 $8.31
Greenville, SC $3.53 $3.55 $4.16 $3.44 $4.17 $3.68 $3.79
Hampton Roads, VA $5.18 $5.21 $5.42 $5.08 $5.07 $4.86 $5.64
Hartford, CT $4.27 $4.32 $4.08 $4.53 $4.20 $4.31 $3.54
Houston, TX $6.19 $6.12 $6.14 $6.23 $6.28 $6.12 $5.94
Indianapolis, IN $3.50 $3.55 $3.62 $3.70 $3.74 $3.39 $3.15
Inland Empire CA $6.24 $6.58 $6.82 $7.28 $7.42 $7.09 $8.28
Jacksonville, FL $3.99 $4.34 $4.24 $4.63 $4.74 $4.30 $3.90
Kansas City, MO $4.48 $4.51 $4.41 $4.38 $4.45 $3.83 $4.42
Lakeland, FL $4.89 $4.85 $5.00 $5.17 $5.18 $5.14 $5.34
Las Vegas, NV $7.78 $7.86 $7.27 $7.88 $7.76 $6.41 n/a
Long Island, NY $8.25 $8.53 $8.86 $9.97 $9.25 $9.02 $9.93
Los Angeles, CA $8.29 $8.79 $9.08 $9.25 $9.05 $8.72 $8.47
Louisville, KY $3.63 $3.67 $3.68 $3.76 $3.76 $3.68 $3.26
Memphis, TN $2.51 $2.49 $2.55 $2.57 $2.64 $2.30 n/a
Miami, FL $7.23 $7.32 $8.32 $7.98 $8.13 $8.17 $7.16
Milwaukee, WI $4.33 $4.39 $4.35 $4.45 $4.55 $3.95 $4.88
Minneapolis, MN $4.67 $4.78 $4.78 $4.79 $4.80 $4.52 n/a

MarketBeat U.S. Q2 2017 cushmanwakefield.com | 8
Asking Rents
p = preliminary
Overall (All Property Types) W/D MFG
Weighted Average Asking Rent Q2 2016 Q3 2016 Q4 2016 Q1 2017 Q2 2017p Q2 2017p
Nashville, TN $3.97 $4.14 $4.07 $4.18 $5.14 $4.98 $4.04
New Haven, CT $5.20 $5.68 $5.24 $5.85 $5.30 $4.75 $5.32
New Jersey - Central $6.97 $7.18 $7.28 $7.31 $7.40 $6.31 $6.39
New Jersey - Northern $7.71 $7.71 $7.90 $7.60 $7.78 $7.56 $6.28
Northern VA $10.89 $11.11 $11.12 $11.15 $11.16 $8.87 n/a
Oakland/East Bay, CA $8.52 $8.88 $9.01 $9.65 $9.98 $9.03 $10.56
Oklahoma City, OK $4.57 $4.65 $4.61 $4.86 $4.98 $4.08 $3.12
Omaha, NE $5.22 $5.55 $5.41 $5.63 $5.57 $5.20 $4.85
Orange County, CA $10.44 $10.91 $11.21 $11.10 $11.40 $9.70 $12.30
Orlando, FL $6.65 $6.45 $6.48 $6.32 $6.29 $5.43 $5.17
Palm Beach County, FL $9.35 $9.64 $10.71 $11.12 $10.62 $10.12 $8.15
PA I-81/I-78 Distribution Corridor $4.57 $4.53 $4.64 $4.72 $4.74 $4.74 n/a
Philadelphia, PA $4.52 $4.65 $4.63 $4.81 $4.95 $4.25 $4.30
Phoenix, AZ $6.43 $6.54 $7.05 $7.03 $6.80 $5.03 $7.52
Pittsburgh, PA $7.70 $7.72 $7.84 $7.54 $7.09 $5.01 $5.11
Portland, OR $7.22 $7.62 $8.02 $7.73 $8.30 $8.53 $6.88
Providence, RI $4.85 $4.85 $4.85 $4.85 $4.85 $4.70 n/a
Puget Sound - Eastside $10.89 $11.24 $11.62 $12.27 $12.12 $10.69 $7.78
Raleigh/Durham, NC $6.44 $7.06 $6.99 $7.28 $7.50 $5.51 $6.98
Richmond, VA $4.34 $4.67 $4.72 $4.71 $4.79 $4.17 $3.84
Roanoke, VA $4.10 $4.18 $4.32 $3.94 $3.99 $3.78 $4.30
Rochester, NY $4.84 $4.84 $4.84 $4.84 $4.84 $3.25 $4.75
Sacramento, CA $4.40 $4.43 $4.55 $4.68 $4.80 $4.80 $5.52
Salt Lake City, UT $5.40 $5.47 $5.45 $5.37 $5.49 $5.06 $5.72
San Antonio, TX $5.83 $5.85 $5.98 $6.04 $5.77 $4.97 n/a
San Diego, CA $12.12 $12.00 $12.12 $12.00 $11.76 $8.76 $10.20
San Francisco North Bay, CA $9.87 $9.97 $10.23 $10.04 $9.42 $9.42 $6.42
San Francisco Peninsula, CA $13.50 $15.95 $14.12 $14.72 $16.18 $15.18 $18.68
San Jose (Silicon Valley), CA $9.96 $11.88 $12.60 $12.00 $12.48 $11.28 $13.32
Savannah, GA $4.55 $4.79 $4.75 $4.75 $4.69 $4.32 n/a
Seattle, WA $6.04 $6.61 $6.73 $7.15 $7.38 $6.65 $5.95
Southern New Hampshire $6.14 $6.07 $5.53 $5.90 $5.72 $5.02 $5.26
St. Louis, MO $4.28 $4.27 $4.39 $4.45 $4.58 $4.17 $8.94
St. Petersburg/Clearwater, FL $7.61 $7.34 $7.72 $7.93 $8.05 $5.96 $6.44
Suburban MD $9.20 $9.44 $9.57 $10.11 $9.36 $7.67 n/a
Syracuse, NY $3.65 $3.81 $3.83 $3.85 $4.07 $4.37 $3.13
Tampa, FL $5.48 $6.12 $6.10 $6.15 $5.77 $4.91 $4.09
Tucson, AZ $6.80 $6.81 $6.67 $6.44 $6.30 $6.07 $5.48
Tulsa, OK $4.50 $4.52 $4.52 $4.52 $4.53 $4.85 $3.79

MarketBeat U.S. Q2 2017 cushmanwakefield.com | 9
Inventory
Inventory Inventory Deliveries YTD 2017 Under Construction as of Q2 2017p
United States 14,046,531,597 107,189,445 237,079,831
Northeast 2,119,104,897 15,967,555 28,891,269
Midwest 3,886,798,622 23,405,869 56,302,386
South 4,132,307,732 45,552,246 84,740,445
West 3,908,320,346 22,263,775 67,145,731
U.S. Industrial Report Markets Inventory Deliveries YTD 2017 Under Construction as of Q2 2017p
Atlanta, GA 559,993,730 9,659,538 18,348,937
Austin, TX 38,644,449 659,646 964,274
Baltimore, MD 202,439,604 574,856 6,173,519
Binghamton, NY 17,613,764 **** 700,000
Birmingham, AL 14,708,455 0 127,000
Boston, MA 131,368,666 342,014 1,004,432
Buffalo, NY 111,277,196 55,000 280,400
Central Valley, CA 114,598,292 899,800 4,405,420
Charleston, SC 64,992,311 893,002 6,113,074
Charlotte, NC 179,957,857 1,509,406 1,345,483
Chicago, IL 1,180,989,237 8,723,232 18,428,814
Cincinnati, OH 282,271,739 1,409,824 3,012,883
Cleveland, OH 491,873,019 977,725 1,648,000
Colorado Springs, CO 31,763,212 0 163,440
Columbus, OH 248,036,749 364,000 6,339,360
Dallas/Ft. Worth, TX 592,329,583 11,104,431 14,589,175
Dayton, OH 114,223,181 873,700 1,503,349
Denver, CO 243,119,997 2,527,522 5,959,170
Detroit, MI 494,341,274 1,257,261 3,273,214
El Paso, TX 52,037,278 0 436,500
Fort Myers/Naples, FL 41,999,724 105,953 282,860
Fredericksburg, VA 10,494,825 0 900,000
Ft. Lauderdale, FL 87,512,218 289,137 1,031,524
Greenville, SC 125,492,543 950,538 694,850
Hampton Roads, VA 96,470,662 329,580 445,000
Hartford, CT 92,730,283 634,000 1,061,850
Houston, TX 412,853,101 3,095,146 2,122,737
Indianapolis, IN 250,704,546 2,041,463 7,222,684
Inland Empire CA 504,886,132 6,603,227 27,207,194
Jacksonville, FL 104,507,696 0 3,343,476
Kansas City, MO 212,037,190 3,995,305 7,473,110
Lakeland, FL 30,928,525 820,316 605,920
Las Vegas, NV 119,620,990 3,601,254 3,387,731
Long Island, NY 130,593,153 0 719,297
Los Angeles, CA 1,077,285,198 1,544,968 8,630,386
Louisville, KY 153,461,087 3,043,625 4,882,895
Memphis, TN 193,376,072 2,641,192 3,193,010
Miami, FL 157,179,499 2,049,276 2,385,130
Milwaukee, WI 198,182,412 682,330 550,337
Minneapolis, MN 105,822,567 766,373 2,254,542

MarketBeat U.S. Q2 2017 cushmanwakefield.com | 10
Inventory
Inventory Inventory Deliveries YTD 2017 Under Construction as of Q2 2017p
Nashville, TN 204,479,749 2,020,132 4,448,300
New Haven, CT 47,798,552 30,000 130,500
New Jersey - Central 338,995,144 4,751,804 5,846,034
New Jersey - Northern 285,876,477 441,600 1,716,735
Northern VA 57,051,702 0 399,485
Oakland/East Bay, CA 204,831,460 161,483 1,499,605
Oklahoma City, OK 70,590,005 345,000 926,200
Omaha, NE 68,235,589 579,256 1,012,695
Orange County, CA 283,176,958 274,185 585,904
Orlando, FL 117,043,071 1,843,183 1,209,615
Palm Beach County, FL 40,517,552 361,690 296,860
PA I-81/I-78 Distribution Corridor 259,997,039 7,588,663 12,438,409
Philadelphia, PA 294,311,006 1,298,650 3,039,169
Phoenix, AZ 307,138,523 2,211,399 3,991,235
Pittsburgh, PA 167,747,744 789,204 395,570
Portland, OR 195,050,921 1,068,870 2,302,100
Providence, RI 77,727,305 n/a n/a
Puget Sound - Eastside 61,325,797 268,447 386,677
Raleigh/Durham, NC 51,378,896 184,500 871,914
Richmond, VA 95,679,695 397,600 474,333
Roanoke, VA 50,093,282 100,000 250,000
Rochester, NY 73,551,473 0 50,000
Sacramento, CA 141,000,710 443,734 1,212,223
Salt Lake City, UT 125,875,624 600,198 3,117,647
San Antonio, TX 39,305,488 593,726 1,061,068
San Diego, CA 162,738,462 178,336 1,168,757
San Francisco North Bay, CA 21,960,430 125,020 0
San Francisco Peninsula, CA 41,954,253 0 0
San Jose (Silicon Valley), CA 85,154,559 182,000 450,610
Savannah, GA 51,503,655 1,043,671 5,092,142
Seattle, WA 144,096,189 1,433,172 2,647,821
Southern New Hampshire 46,774,564 0 1,404,873
St. Louis, MO 240,081,119 1,735,400 3,583,398
St. Petersburg/Clearwater, FL 47,606,481 291,976 242,000
Suburban MD 48,594,729 216,000 136,666
Syracuse, NY 42,742,531 36,620 104,000
Tampa, FL 78,861,533 387,126 1,241,498
Tucson, AZ 42,742,639 140,160 29,811
Tulsa, OK 60,222,675 42,000 105,000
p = preliminary

Methodology
Cushman & Wakefield’s quarterly estimates are derived from a variety of data sources, including its own proprietary database, and historical data from third party data sources. The market statistics are calculated from a base building inventory made up of industrial properties deemed to be competitive in the local industrial markets. Generally, owner-occupied and federally-owned buildings are not included. Older buildings unfit for occupancy or ones that require substantial renovation before tenancy are generally not included in the competitive inventory. The inventory is subject to revisions due to resampling. Vacant space is defined as space that is available immediately or imminently after the end of the quarter. Sublet space still occupied by the tenant is not counted as available space. The figures provided for the current quarter are preliminary, and all information contained in the report is subject to correction of errors and revisions based on additional data received.
Regional Map
WestMidwestSouthNortheast
Jason Tolliver Head of Industrial Research, Americas Tel: +1 317.639.0549 cushmanwakefield.com
Explanation of Terms
Total Inventory: The total amount of industrial space (in buildings of a
predetermined size by market) that can be rented by a third party.
Overall Vacancy Rate: The amount of unoccupied space (new, relet, and
sublet) expressed as a percentage of total inventory.
Absorption: The net change in occupied space between two points in time.
(Total occupied space in the present quarter minus total occupied space from
the previous quarter, quoted on a net, not gross, basis.)
Leasing Activity: The sum of all leases over a period of time. This includes
pre-leasing activity as well as expansions. It does not include renewals.
Overall Weighted Asking Rents: NNN average asking rents weighted by the
amount of available direct and sublease space in industrial properties.
W/D: Warehouse and or distribution properties.
MFG: Manufacturing properties.
About Cushman & Wakefield
Cushman & Wakefield is a leading global real estate services firm that helps clients transform the way people work, shop, and live. Our 45,000 employees in more than 70 countries help occupiers and investors optimize the value of their real estate by combining our global perspective and deep local knowledge with an impressive platform of real estate solutions. Cushman & Wakefield is among the largest commercial real estate services firms with revenue of $6 billion across core services of agency leasing, asset services, capital markets, facility services (C&W Services), global occupier services, investment & asset management (DTZ Investors), project & development services, tenant representation, and valuation & advisory. 2017 marks the 100-year anniversary of the Cushman & Wakefield brand. 100 years of taking our clients’ ideas and putting them into action. To learn more, visit www.cushwakecentennial.com, www.cushmanwakefield.com or follow @CushWake on Twitter.
Cushman & Wakefield Copyright 2017. No warranty or representation, express or implied, is made to the accuracy or completeness of the information contained herein, and same is submitted subject to errors, omissions, change of price, rental or other conditions, withdrawal without notice, and to any special listing conditions imposed by the property owner(s). As applicable, we make no representation as to the condition of the property (or properties) in question.
Carolyn Salzer Industrial Research Analyst, Americas Tel: +1 847.518.3212 cushmanwakefield.com

cushmanwakefi eld.com | 1
U.S. IndustrialQ1 2017
MARKETBEAT
U.S. INDUSTRIAL
Overall Vacancy
Net Absorption/Rent NNN4-QTR TRAILING AVERAGE
Market IndicatorsQ1 16 Q1 17 12-Month
Forecast
Overall Vacancy 6.1% 5.3%
Net Absorption 62.8M 53.8M
Under Construction 175.6M 219.3M
Weighted Asking Rent (NNN) $5.44 $5.67
Employment IndicatorsQ1 16 Q1 17 12-Month
Forecast
Total Nonfarm Employment 143.4M 145.7M
Industrial Employment 25.3M 25.6M
Unemployment 4.9% 4.6%
$4.00
$4.50
$5.00
$5.50
$6.00
0
10
20
30
40
50
60
70
80
2012 2013 2014 2015 2016 2017
Net Absorption, MSF Weighted Asking Rent, $ PSF
0.0%
2.0%
4.0%
6.0%
8.0%
10.0%
2012 2013 2014 2015 2016 2017
Historical Average = 8.3%
EconomyEmployment growth in the fi rst quarter of 2017 was solid — averaging 178,000 jobs per month and thus a sizeable increase from the monthly average of 148,000 jobs added in the fourth quarter of 2016. Q1 2017 job growth was roughly on par with the average of 187,000 per month for 2016 as a whole. The March job gains of 98,000, while comparatively small, continued the record-setting streak of employment growth that began in the fourth quarter of 2010.
The manufacturing sector is on a roll. The Institute for Supply Management’s (ISM) Purchasing Managers’ Index has been in expansionary territory for seven straight months, registering 57.2 in March. That indicates conditions within the sector are much improved. The subcomponents of the ISM index painted an even stronger picture, showing new orders expanding vigorously, exports at their highest point since 2013, and employment at levels not seen since 2011. Improvement is also evident in an uptick in rail volumes. The American Association of Railroads reports that year-to-date total carloads through March totaled 180,655 — up 5.7% from a year-ago, and year-to-date intermodal volume was up 1.4% (47,977 units) over last year.
However, U.S. retail sales fell for a second straight month in March. The U.S. Commerce Department reported that retail sales declined by 0.2%, led by a decline in auto sales which were down 1.6% from the same month a year prior. Sales of cars and light trucks declined to a 16.5 million-unit pace, the slowest in more than two years, and is evidence that the auto market has cooled somewhat after an unprecedented seventh straight year of record sales. In contrast, eCommerce sales continued to grow, with online sales up 11.9% from a year ago.
The Conference Board’s Consumer Confi dence Index surged in March to 125.6 — its highest level in more than 16 years— amid growing market optimism. This reading suggests that consumer spending will accelerate. With confi dence upbeat and household balance sheets healthy, real consumption should fi rm moving forward, serving as a catalyst for industrial-related leasing.
Market OverviewThe U.S. industrial market absorbed 53.8 million square feet (MSF) of space in the fi rst quarter of 2017, a 14.4% decline from that registered in the fi rst quarter 2016. Still, Q1 2017 absorption was well above the quarterly average of 49.3 MSF of absorption witnessed during the current economic recovery and signifi cantly higher than the average quarterly absorption of 40.6 MSF registered during the last two economic growth cycles. Q1 2017 marks 28 quarters of net occupancy gains, placing the current expansion among the longest on record. The current expansion is also among the strongest with net absorption now having surpassing 1.3 billion square feet added since 2010.
The current booming industrial expansion has been more broad-based than prior expansions, and widespread occupancy gains continue across the country. Nineteen
Source: Cushman & Wakefi eld Research
Source: BLS
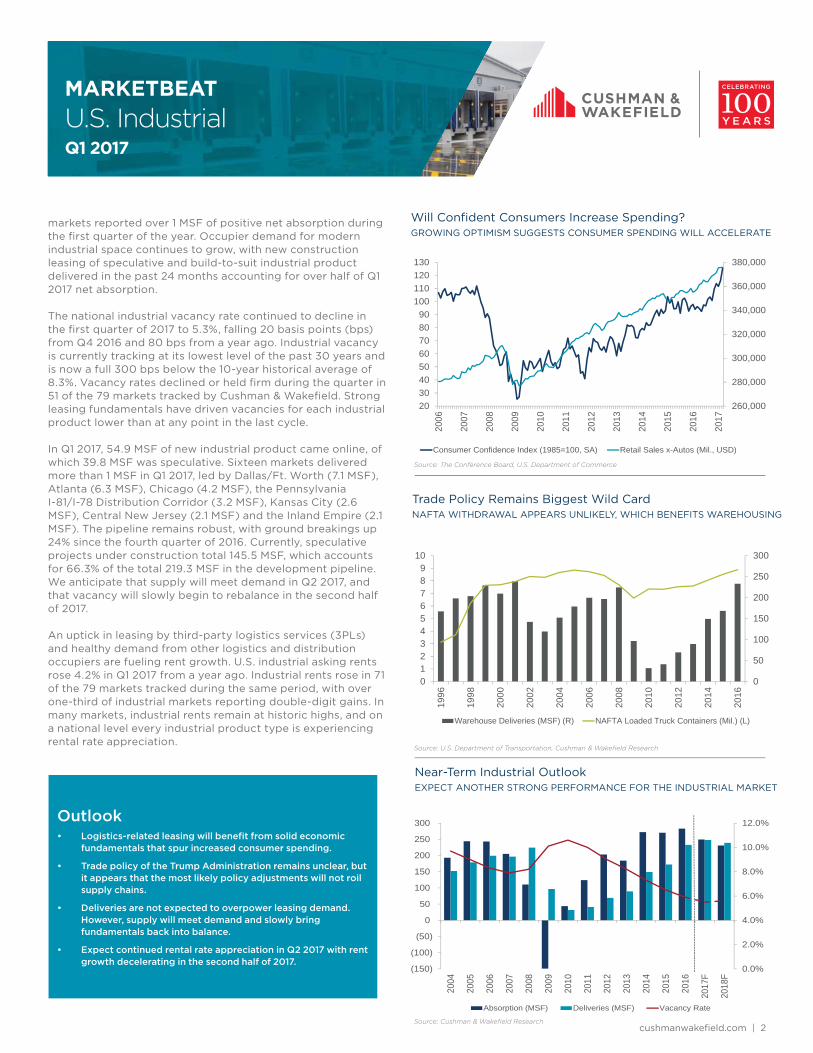
cushmanwakefi eld.com | 2
U.S. IndustrialQ1 2017
MARKETBEAT
Trade Policy Remains Biggest Wild CardNAFTA WITHDRAWAL APPEARS UNLIKELY, WHICH BENEFITS WAREHOUSING
Near-Term Industrial OutlookEXPECT ANOTHER STRONG PERFORMANCE FOR THE INDUSTRIAL MARKET
Will Confi dent Consumers Increase Spending?GROWING OPTIMISM SUGGESTS CONSUMER SPENDING WILL ACCELERATE
Outlook• Logistics-related leasing will benefi t from solid economic
fundamentals that spur increased consumer spending.
• Trade policy of the Trump Administration remains unclear, but it appears that the most likely policy adjustments will not roil supply chains.
• Deliveries are not expected to overpower leasing demand. However, supply will meet demand and slowly bring fundamentals back into balance.
• Expect continued rental rate appreciation in Q2 2017 with rent growth decelerating in the second half of 2017.
Source: The Conference Board, U.S. Department of Commerce
Source: U.S. Department of Transportation, Cushman & Wakefi eld Research
Source: Cushman & Wakefi eld Research
markets reported over 1 MSF of positive net absorption during the fi rst quarter of the year. Occupier demand for modern industrial space continues to grow, with new construction leasing of speculative and build-to-suit industrial product delivered in the past 24 months accounting for over half of Q1 2017 net absorption.
The national industrial vacancy rate continued to decline in the fi rst quarter of 2017 to 5.3%, falling 20 basis points (bps) from Q4 2016 and 80 bps from a year ago. Industrial vacancy is currently tracking at its lowest level of the past 30 years and is now a full 300 bps below the 10-year historical average of 8.3%. Vacancy rates declined or held fi rm during the quarter in 51 of the 79 markets tracked by Cushman & Wakefi eld. Strong leasing fundamentals have driven vacancies for each industrial product lower than at any point in the last cycle.
In Q1 2017, 54.9 MSF of new industrial product came online, of which 39.8 MSF was speculative. Sixteen markets delivered more than 1 MSF in Q1 2017, led by Dallas/Ft. Worth (7.1 MSF), Atlanta (6.3 MSF), Chicago (4.2 MSF), the Pennsylvania I-81/I-78 Distribution Corridor (3.2 MSF), Kansas City (2.6 MSF), Central New Jersey (2.1 MSF) and the Inland Empire (2.1 MSF). The pipeline remains robust, with ground breakings up 24% since the fourth quarter of 2016. Currently, speculative projects under construction total 145.5 MSF, which accounts for 66.3% of the total 219.3 MSF in the development pipeline. We anticipate that supply will meet demand in Q2 2017, and that vacancy will slowly begin to rebalance in the second half of 2017.
An uptick in leasing by third-party logistics services (3PLs) and healthy demand from other logistics and distribution occupiers are fueling rent growth. U.S. industrial asking rents rose 4.2% in Q1 2017 from a year ago. Industrial rents rose in 71 of the 79 markets tracked during the same period, with over one-third of industrial markets reporting double-digit gains. In many markets, industrial rents remain at historic highs, and on a national level every industrial product type is experiencing rental rate appreciation.
0
50
100
150
200
250
300
0123456789
10
1996
1998
2000
2002
2004
2006
2008
2010
2012
2014
2016
Warehouse Deliveries (MSF) (R) NAFTA Loaded Truck Containers (Mil.) (L)
260,000
280,000
300,000
320,000
340,000
360,000
380,000
2030405060708090
100110120130
2006
2007
2008
2009
2010
2011
2012
2013
2014
2015
2016
2017
Consumer Confidence Index (1985=100, SA) Retail Sales x-Autos (Mil., USD)
0.0%
2.0%
4.0%
6.0%
8.0%
10.0%
12.0%
(150)
(100)
(50)
0
50
100
150
200
250
300
2004
2005
2006
2007
2008
2009
2010
2011
2012
2013
2014
2015
2016
2017
F
2018
F
Absorption (MSF) Deliveries (MSF) Vacancy Rate

MarketBeat U.S. Q1 2017 cushmanwakefi eld.com | 3
Net Absorption Leasing Activity
Demand Indicators (Overall) Q1 2016 Q2 2016 Q3 2016 Q4 2016 Q1 2017p Q1 2017p
United States 62,787,242 77,284,442 78,483,313 63,129,827 53,769,325 128,175,083
Northeast 13,416,209 13,074,715 17,790,157 7,233,913 6,013,365 14,960,702
Midwest 11,960,215 14,865,228 23,968,635 15,788,785 12,488,915 26,166,406
South 25,281,012 23,715,895 21,353,134 27,857,093 18,921,872 36,325,403
West 12,129,806 25,628,604 15,371,387 12,250,036 16,345,173 50,722,572
U.S. Industrial Report Markets Q1 2016 Q2 2016 Q3 2016 Q4 2016 Q1 2017p Q1 2017p
Atlanta, GA 4,014,644 3,852,450 2,245,312 3,546,425 6,360,431 5,970,364
Austin, TX 171,666 242,070 80,659 116,610 -209,019 524,496
Baltimore, MD 1,611,283 506,425 1,029,640 944,082 90,618 3,742,266
Binghamton, NY 35,384 117,480 80,204 8,605 99,383 6,790
Birmingham, AL 108,076 403,623 826,217 33,863 -340,522 530,455
Boston, MA -245,725 1,079,816 2,190,787 996,083 -267,560 1,424,557
Buff alo, NY -276,271 136,985 500,257 1,217,645 -952,685 268,129
Charleston, SC 647,660 646,339 -42,512 1,001,344 1,293,927 374,646
Charlotte, NC 119,578 1,503,782 1,158,781 1,812,029 756,188 2,332,572
Chicago, IL 2,437,786 5,656,574 10,474,949 4,149,725 2,667,241 3,529,733
Cincinnati, OH 849,734 1,787,525 1,833,726 556,179 4,033,174 3,188,127
Cleveland, OH 962,071 -36,295 331,032 1,187,461 180,990 1,281,985
Colorado Springs, CO 32,126 98,615 -97,504 -160,026 59,099 14,234
Columbus, OH 1,381,183 180,470 1,349,355 2,080,666 193,936 1,814,510
Dallas/Ft. Worth, TX 6,357,032 4,809,247 7,200,702 5,298,286 5,361,376 4,004,573
Dayton, OH 564,858 328,464 306,394 525,747 929,381 110,891
Denver, CO -97,905 1,450,866 746,413 596,022 136,784 3,327,450
Detroit, MI 2,368,339 1,478,756 1,070,776 985,441 113,412 2,547,399
El Paso, TX 1,576,642 712,193 -293,711 -78,692 76,000 76,000
Fort Myers/Naples, FL 141,662 351,557 272,489 206,876 218,558 82,973
Fredericksburg, VA -76 70,112 189,844 173,790 -124,975 89,726
Ft. Lauderdale, FL 26,560 20,012 702,011 858,893 385,012 584,077
Greenville, SC 830,107 3,131,610 1,560,194 1,353,175 515,093 1,115,201
Hampton Roads, VA -204,133 390,311 -3,892 -359,777 20,276 180,180
Hartford, CT -161,857 347,113 866,772 125,862 183,652 468,262
Houston, TX 1,550,857 92,367 810,247 4,065,736 366,980 4,693,879
Indianapolis, IN 881,633 2,720,089 3,108,214 1,848,702 481,004 1,932,119
Inland Empire CA 3,483,292 8,608,335 3,784,917 3,636,653 4,215,907 12,075,658
Jacksonville, FL 1,023,149 727,867 239,728 161,043 409,928 847,739
Kansas City, MO 773,318 1,775,923 1,134,989 1,840,583 2,446,833 7,855,614
Lakeland, FL 247,320 90,185 231,791 93,900 262,677 426,657
Las Vegas, NV 792,135 441,278 698,467 955,129 540,804 n/a
Long Island, NY 493,677 112,036 365,094 -230,288 -231,655 367,827
Los Angeles, CA 2,246,044 2,769,413 1,783,386 250,202 1,365,680 10,209,325
Louisville, KY 967,870 1,599,711 491,942 322,851 489,567 1,109,418
Memphis, TN 1,690,863 341,427 695,753 3,011,967 2,240,074 2,862,686
Miami, FL 779,691 353,972 624,408 438,808 58,180 914,476
Milwaukee, WI 885,374 743,340 585,596 -12,492 327 773,266
Minneapolis, MN 1,041,300 403,691 459,794 519,293 -361,946 n/a
Nashville, TN 1,287,008 1,433,052 578,168 2,529,427 450,792 2,116,243
Demand Indicators
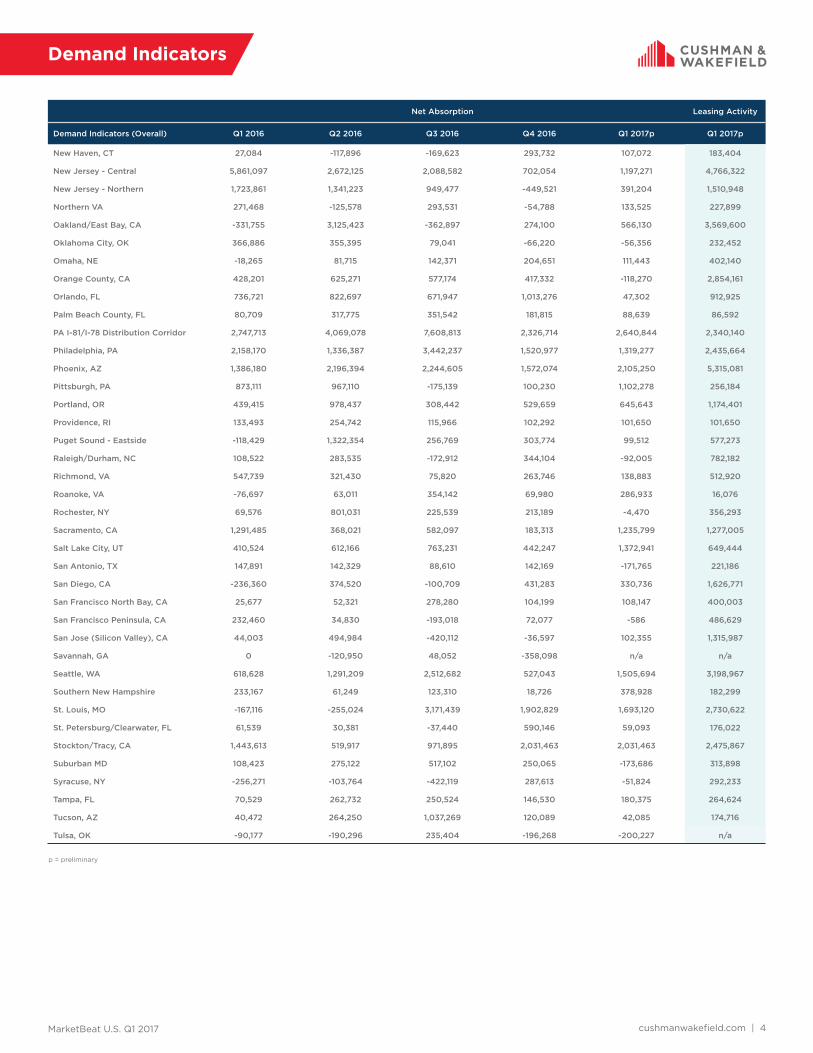
MarketBeat U.S. Q1 2017 cushmanwakefi eld.com | 4
Net Absorption Leasing Activity
Demand Indicators (Overall) Q1 2016 Q2 2016 Q3 2016 Q4 2016 Q1 2017p Q1 2017p
New Haven, CT 27,084 -117,896 -169,623 293,732 107,072 183,404
New Jersey - Central 5,861,097 2,672,125 2,088,582 702,054 1,197,271 4,766,322
New Jersey - Northern 1,723,861 1,341,223 949,477 -449,521 391,204 1,510,948
Northern VA 271,468 -125,578 293,531 -54,788 133,525 227,899
Oakland/East Bay, CA -331,755 3,125,423 -362,897 274,100 566,130 3,569,600
Oklahoma City, OK 366,886 355,395 79,041 -66,220 -56,356 232,452
Omaha, NE -18,265 81,715 142,371 204,651 111,443 402,140
Orange County, CA 428,201 625,271 577,174 417,332 -118,270 2,854,161
Orlando, FL 736,721 822,697 671,947 1,013,276 47,302 912,925
Palm Beach County, FL 80,709 317,775 351,542 181,815 88,639 86,592
PA I-81/I-78 Distribution Corridor 2,747,713 4,069,078 7,608,813 2,326,714 2,640,844 2,340,140
Philadelphia, PA 2,158,170 1,336,387 3,442,237 1,520,977 1,319,277 2,435,664
Phoenix, AZ 1,386,180 2,196,394 2,244,605 1,572,074 2,105,250 5,315,081
Pittsburgh, PA 873,111 967,110 -175,139 100,230 1,102,278 256,184
Portland, OR 439,415 978,437 308,442 529,659 645,643 1,174,401
Providence, RI 133,493 254,742 115,966 102,292 101,650 101,650
Puget Sound - Eastside -118,429 1,322,354 256,769 303,774 99,512 577,273
Raleigh/Durham, NC 108,522 283,535 -172,912 344,104 -92,005 782,182
Richmond, VA 547,739 321,430 75,820 263,746 138,883 512,920
Roanoke, VA -76,697 63,011 354,142 69,980 286,933 16,076
Rochester, NY 69,576 801,031 225,539 213,189 -4,470 356,293
Sacramento, CA 1,291,485 368,021 582,097 183,313 1,235,799 1,277,005
Salt Lake City, UT 410,524 612,166 763,231 442,247 1,372,941 649,444
San Antonio, TX 147,891 142,329 88,610 142,169 -171,765 221,186
San Diego, CA -236,360 374,520 -100,709 431,283 330,736 1,626,771
San Francisco North Bay, CA 25,677 52,321 278,280 104,199 108,147 400,003
San Francisco Peninsula, CA 232,460 34,830 -193,018 72,077 -586 486,629
San Jose (Silicon Valley), CA 44,003 494,984 -420,112 -36,597 102,355 1,315,987
Savannah, GA 0 -120,950 48,052 -358,098 n/a n/a
Seattle, WA 618,628 1,291,209 2,512,682 527,043 1,505,694 3,198,967
Southern New Hampshire 233,167 61,249 123,310 18,726 378,928 182,299
St. Louis, MO -167,116 -255,024 3,171,439 1,902,829 1,693,120 2,730,622
St. Petersburg/Clearwater, FL 61,539 30,381 -37,440 590,146 59,093 176,022
Stockton/Tracy, CA 1,443,613 519,917 971,895 2,031,463 2,031,463 2,475,867
Suburban MD 108,423 275,122 517,102 250,065 -173,686 313,898
Syracuse, NY -256,271 -103,764 -422,119 287,613 -51,824 292,233
Tampa, FL 70,529 262,732 250,524 146,530 180,375 264,624
Tucson, AZ 40,472 264,250 1,037,269 120,089 42,085 174,716
Tulsa, OK -90,177 -190,296 235,404 -196,268 -200,227 n/a
Demand Indicators
p = preliminary
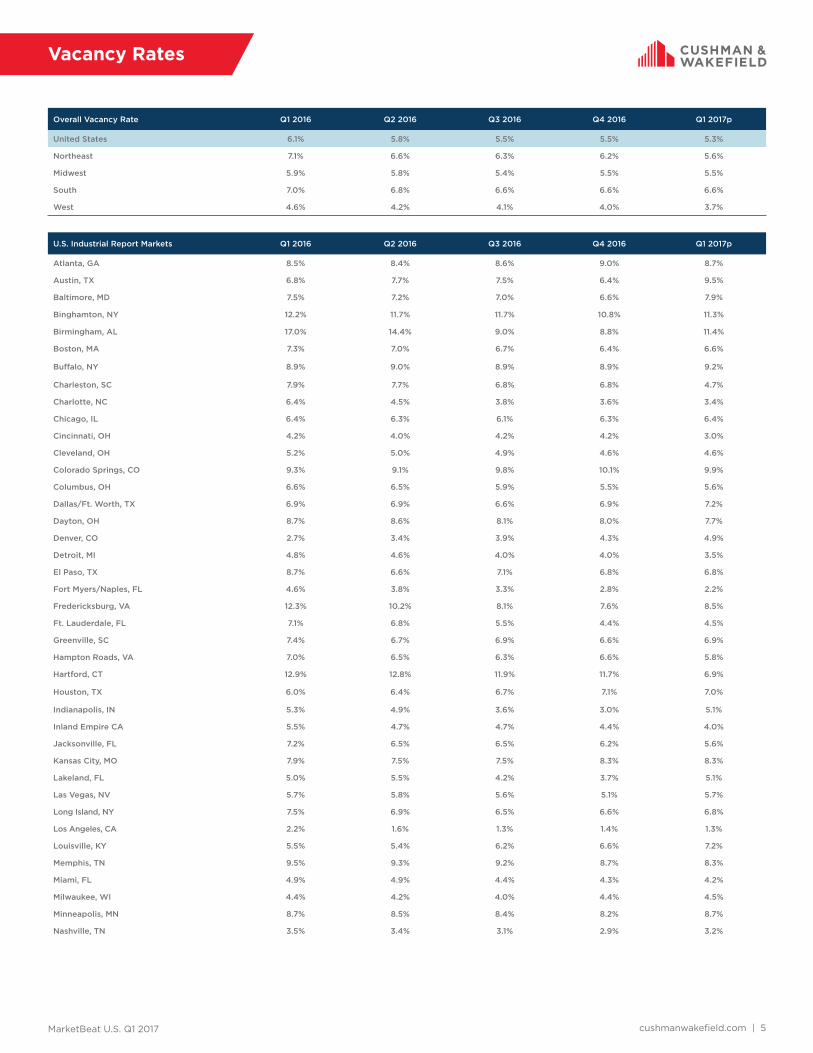
MarketBeat U.S. Q1 2017 cushmanwakefi eld.com | 5
Vacancy Rates
Overall Vacancy Rate Q1 2016 Q2 2016 Q3 2016 Q4 2016 Q1 2017p
United States 6.1% 5.8% 5.5% 5.5% 5.3%
Northeast 7.1% 6.6% 6.3% 6.2% 5.6%
Midwest 5.9% 5.8% 5.4% 5.5% 5.5%
South 7.0% 6.8% 6.6% 6.6% 6.6%
West 4.6% 4.2% 4.1% 4.0% 3.7%
U.S. Industrial Report Markets Q1 2016 Q2 2016 Q3 2016 Q4 2016 Q1 2017p
Atlanta, GA 8.5% 8.4% 8.6% 9.0% 8.7%
Austin, TX 6.8% 7.7% 7.5% 6.4% 9.5%
Baltimore, MD 7.5% 7.2% 7.0% 6.6% 7.9%
Binghamton, NY 12.2% 11.7% 11.7% 10.8% 11.3%
Birmingham, AL 17.0% 14.4% 9.0% 8.8% 11.4%
Boston, MA 7.3% 7.0% 6.7% 6.4% 6.6%
Buff alo, NY 8.9% 9.0% 8.9% 8.9% 9.2%
Charleston, SC 7.9% 7.7% 6.8% 6.8% 4.7%
Charlotte, NC 6.4% 4.5% 3.8% 3.6% 3.4%
Chicago, IL 6.4% 6.3% 6.1% 6.3% 6.4%
Cincinnati, OH 4.2% 4.0% 4.2% 4.2% 3.0%
Cleveland, OH 5.2% 5.0% 4.9% 4.6% 4.6%
Colorado Springs, CO 9.3% 9.1% 9.8% 10.1% 9.9%
Columbus, OH 6.6% 6.5% 5.9% 5.5% 5.6%
Dallas/Ft. Worth, TX 6.9% 6.9% 6.6% 6.9% 7.2%
Dayton, OH 8.7% 8.6% 8.1% 8.0% 7.7%
Denver, CO 2.7% 3.4% 3.9% 4.3% 4.9%
Detroit, MI 4.8% 4.6% 4.0% 4.0% 3.5%
El Paso, TX 8.7% 6.6% 7.1% 6.8% 6.8%
Fort Myers/Naples, FL 4.6% 3.8% 3.3% 2.8% 2.2%
Fredericksburg, VA 12.3% 10.2% 8.1% 7.6% 8.5%
Ft. Lauderdale, FL 7.1% 6.8% 5.5% 4.4% 4.5%
Greenville, SC 7.4% 6.7% 6.9% 6.6% 6.9%
Hampton Roads, VA 7.0% 6.5% 6.3% 6.6% 5.8%
Hartford, CT 12.9% 12.8% 11.9% 11.7% 6.9%
Houston, TX 6.0% 6.4% 6.7% 7.1% 7.0%
Indianapolis, IN 5.3% 4.9% 3.6% 3.0% 5.1%
Inland Empire CA 5.5% 4.7% 4.7% 4.4% 4.0%
Jacksonville, FL 7.2% 6.5% 6.5% 6.2% 5.6%
Kansas City, MO 7.9% 7.5% 7.5% 8.3% 8.3%
Lakeland, FL 5.0% 5.5% 4.2% 3.7% 5.1%
Las Vegas, NV 5.7% 5.8% 5.6% 5.1% 5.7%
Long Island, NY 7.5% 6.9% 6.5% 6.6% 6.8%
Los Angeles, CA 2.2% 1.6% 1.3% 1.4% 1.3%
Louisville, KY 5.5% 5.4% 6.2% 6.6% 7.2%
Memphis, TN 9.5% 9.3% 9.2% 8.7% 8.3%
Miami, FL 4.9% 4.9% 4.4% 4.3% 4.2%
Milwaukee, WI 4.4% 4.2% 4.0% 4.4% 4.5%
Minneapolis, MN 8.7% 8.5% 8.4% 8.2% 8.7%
Nashville, TN 3.5% 3.4% 3.1% 2.9% 3.2%
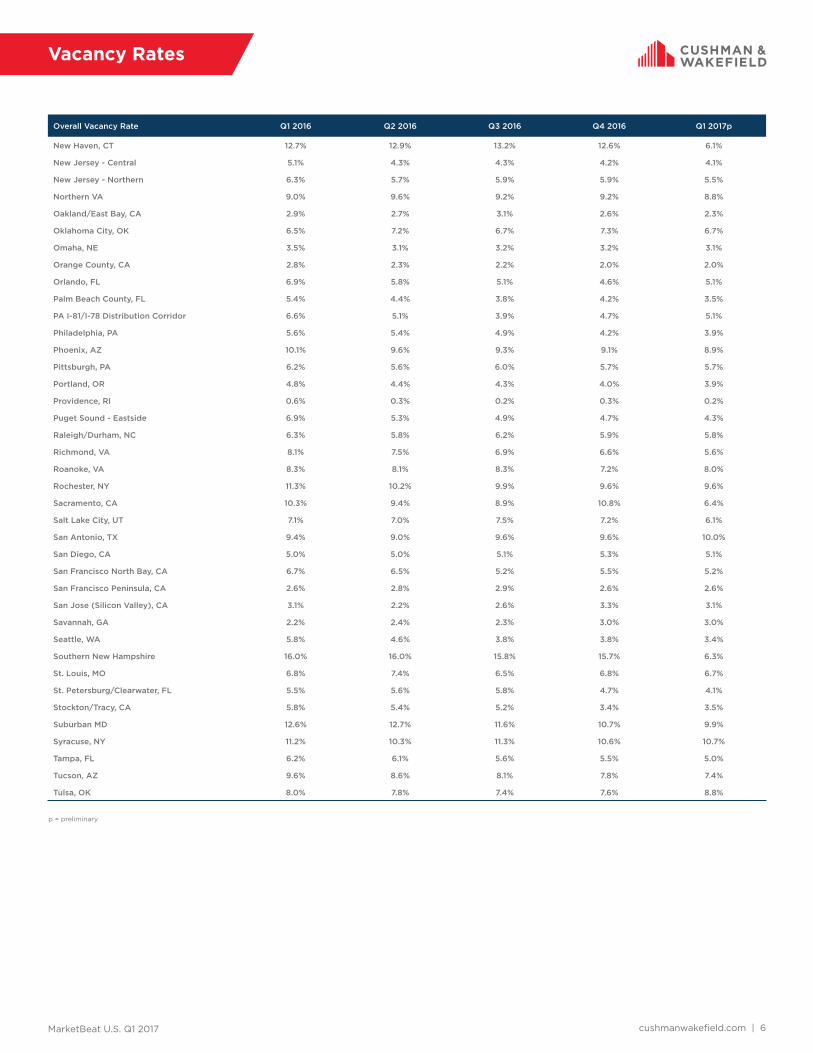
MarketBeat U.S. Q1 2017 cushmanwakefi eld.com | 6
Vacancy Rates
Overall Vacancy Rate Q1 2016 Q2 2016 Q3 2016 Q4 2016 Q1 2017p
New Haven, CT 12.7% 12.9% 13.2% 12.6% 6.1%
New Jersey - Central 5.1% 4.3% 4.3% 4.2% 4.1%
New Jersey - Northern 6.3% 5.7% 5.9% 5.9% 5.5%
Northern VA 9.0% 9.6% 9.2% 9.2% 8.8%
Oakland/East Bay, CA 2.9% 2.7% 3.1% 2.6% 2.3%
Oklahoma City, OK 6.5% 7.2% 6.7% 7.3% 6.7%
Omaha, NE 3.5% 3.1% 3.2% 3.2% 3.1%
Orange County, CA 2.8% 2.3% 2.2% 2.0% 2.0%
Orlando, FL 6.9% 5.8% 5.1% 4.6% 5.1%
Palm Beach County, FL 5.4% 4.4% 3.8% 4.2% 3.5%
PA I-81/I-78 Distribution Corridor 6.6% 5.1% 3.9% 4.7% 5.1%
Philadelphia, PA 5.6% 5.4% 4.9% 4.2% 3.9%
Phoenix, AZ 10.1% 9.6% 9.3% 9.1% 8.9%
Pittsburgh, PA 6.2% 5.6% 6.0% 5.7% 5.7%
Portland, OR 4.8% 4.4% 4.3% 4.0% 3.9%
Providence, RI 0.6% 0.3% 0.2% 0.3% 0.2%
Puget Sound - Eastside 6.9% 5.3% 4.9% 4.7% 4.3%
Raleigh/Durham, NC 6.3% 5.8% 6.2% 5.9% 5.8%
Richmond, VA 8.1% 7.5% 6.9% 6.6% 5.6%
Roanoke, VA 8.3% 8.1% 8.3% 7.2% 8.0%
Rochester, NY 11.3% 10.2% 9.9% 9.6% 9.6%
Sacramento, CA 10.3% 9.4% 8.9% 10.8% 6.4%
Salt Lake City, UT 7.1% 7.0% 7.5% 7.2% 6.1%
San Antonio, TX 9.4% 9.0% 9.6% 9.6% 10.0%
San Diego, CA 5.0% 5.0% 5.1% 5.3% 5.1%
San Francisco North Bay, CA 6.7% 6.5% 5.2% 5.5% 5.2%
San Francisco Peninsula, CA 2.6% 2.8% 2.9% 2.6% 2.6%
San Jose (Silicon Valley), CA 3.1% 2.2% 2.6% 3.3% 3.1%
Savannah, GA 2.2% 2.4% 2.3% 3.0% 3.0%
Seattle, WA 5.8% 4.6% 3.8% 3.8% 3.4%
Southern New Hampshire 16.0% 16.0% 15.8% 15.7% 6.3%
St. Louis, MO 6.8% 7.4% 6.5% 6.8% 6.7%
St. Petersburg/Clearwater, FL 5.5% 5.6% 5.8% 4.7% 4.1%
Stockton/Tracy, CA 5.8% 5.4% 5.2% 3.4% 3.5%
Suburban MD 12.6% 12.7% 11.6% 10.7% 9.9%
Syracuse, NY 11.2% 10.3% 11.3% 10.6% 10.7%
Tampa, FL 6.2% 6.1% 5.6% 5.5% 5.0%
Tucson, AZ 9.6% 8.6% 8.1% 7.8% 7.4%
Tulsa, OK 8.0% 7.8% 7.4% 7.6% 8.8%
p = preliminary

MarketBeat U.S. Q1 2017 cushmanwakefi eld.com | 7
Asking Rents
Overall (All Property Types) W/D MFG
Weighted Average Asking Rent Q1 2016 Q2 2016 Q3 2016 Q4 2016 Q1 2017p Q1 2017p
United States $5.44 $5.50 $5.57 $5.63 $5.67 $5.01 $5.32
Northeast $5.66 $5.83 $6.02 $6.03 $6.15 $5.94 $4.68
Midwest $4.38 $4.41 $4.39 $4.42 $4.48 $4.19 $4.41
South $5.17 $5.23 $5.18 $5.21 $5.20 $4.44 $4.27
West $7.01 $7.15 $7.41 $7.65 $7.92 $6.72 $8.19
U.S. Industrial Report Markets Q1 2016 Q2 2016 Q3 2016 Q4 2016 Q1 2017p Q1 2017p
Atlanta, GA $4.27 $4.22 $4.17 $4.20 $4.31 $3.76 $3.53
Austin, TX $9.72 $9.66 $9.75 $9.71 $9.27 $6.48 $8.74
Baltimore, MD $5.48 $5.57 $5.49 $5.35 $5.08 $4.45 n/a
Binghamton, NY $4.74 $4.81 $4.81 $4.71 $4.70 $4.23 $4.32
Birmingham, AL $3.61 $3.57 $4.70 $5.01 $4.18 $3.83 n/a
Boston, MA $5.86 $6.02 $6.17 $6.22 $6.69 $6.06 $7.72
Buff alo, NY $4.13 $4.13 $4.98 $4.98 $4.13 $4.25 $3.95
Charleston, SC $5.07 $5.31 $5.31 $5.26 $5.36 $5.43 $4.67
Charlotte, NC $5.02 $5.03 $5.17 $5.15 $5.11 $4.52 $4.04
Chicago, IL $4.87 $4.88 $4.79 $4.76 $4.87 $4.78 $4.58
Cincinnati, OH $3.97 $4.01 $3.91 $4.06 $4.33 $3.80 $3.82
Cleveland, OH $3.89 $3.95 $3.88 $3.94 $3.99 $3.73 n/a
Colorado Springs, CO $6.11 $6.42 $7.27 $7.40 $8.02 $6.69 $6.53
Columbus, OH $3.35 $3.35 $3.35 $3.43 $3.46 $3.46 n/a
Dallas/Ft. Worth, TX $5.47 $5.16 $4.89 $4.84 $4.86 $3.99 $3.69
Dayton, OH $3.21 $3.22 $3.19 $3.21 $3.32 $3.37 $2.96
Denver, CO $7.71 $7.04 $7.23 $7.57 $8.03 $6.84 $7.24
Detroit, MI $5.15 $5.25 $5.26 $5.26 $5.36 $4.94 $4.79
El Paso, TX $3.90 $3.95 $3.95 $3.95 $3.95 $4.00 $3.90
Fort Myers/Naples, FL $6.36 $6.61 $6.72 $6.80 $7.44 $6.98 $8.15
Fredericksburg, VA $5.72 $5.83 $5.65 $5.67 $5.76 $5.92 $4.92
Ft. Lauderdale, FL $8.76 $9.65 $9.52 $8.69 $8.92 $8.45 $8.63
Greenville, SC $3.44 $3.53 $3.55 $4.16 $3.44 $3.22 $3.87
Hampton Roads, VA $5.06 $5.18 $5.21 $5.42 $5.39 $5.22 $5.14
Hartford, CT $4.22 $4.27 $4.32 $4.08 $4.53 $4.42 $4.34
Houston, TX $6.02 $6.19 $6.12 $6.14 $6.23 $6.08 $5.99
Indianapolis, IN $3.47 $3.50 $3.55 $3.62 $3.70 $3.34 $3.13
Inland Empire CA $5.90 $6.24 $6.58 $6.82 $7.28 $6.69 $8.17
Jacksonville, FL $4.05 $3.99 $4.34 $4.24 $4.63 $4.26 $2.97
Kansas City, MO $4.39 $4.48 $4.51 $4.41 $4.38 $3.88 $4.35
Lakeland, FL $4.63 $4.89 $4.85 $5.00 $5.17 $5.15 $4.55
Las Vegas, NV $7.74 $7.78 $7.86 $7.27 $7.88 $6.95 n/a
Long Island, NY $8.15 $8.25 $8.53 $8.86 $9.81 $9.76 $9.11
Los Angeles, CA $8.26 $8.29 $8.79 $9.08 $9.25 $8.94 $8.40
Louisville, KY $3.61 $3.63 $3.67 $3.68 $3.76 $3.66 $3.13
Memphis, TN $2.35 $2.51 $2.49 $2.55 $2.57 $2.28 n/a
Miami, FL $7.47 $7.23 $7.32 $8.32 $7.98 $8.03 $7.40
Milwaukee, WI $4.39 $4.33 $4.39 $4.35 $4.45 $3.88 $4.70
Minneapolis, MN $4.65 $4.67 $4.78 $4.78 $4.79 $4.44 n/a
Nashville, TN $3.97 $3.97 $4.14 $4.07 $4.18 $4.30 $2.57

MarketBeat U.S. Q1 2017 cushmanwakefi eld.com | 8
Asking Rents
p = preliminary
Overall (All Property Types) W/D MFG
Weighted Average Asking Rent Q1 2016 Q2 2016 Q3 2016 Q4 2016 Q1 2017p Q1 2017p
New Haven, CT $5.18 $5.20 $5.68 $5.24 $5.85 $5.41 $5.54
New Jersey - Central $6.59 $6.97 $7.18 $7.28 $7.31 $6.45 $4.42
New Jersey - Northern $7.42 $7.71 $7.71 $7.90 $7.60 $7.29 $6.38
Northern VA $11.14 $10.89 $11.11 $11.12 $11.15 $8.84 n/a
Oakland/East Bay, CA $8.84 $8.52 $8.88 $9.01 $9.59 $8.34 $10.57
Oklahoma City, OK $4.21 $4.57 $4.65 $4.61 $4.86 $4.22 $2.50
Omaha, NE $5.16 $5.22 $5.55 $5.41 $5.63 $5.28 $4.85
Orange County, CA $9.76 $10.44 $10.91 $11.21 $11.10 $9.58 $11.35
Orlando, FL $6.51 $6.65 $6.45 $6.48 $6.32 $5.27 $5.19
Palm Beach County, FL $9.30 $9.35 $9.64 $10.71 $11.12 $10.76 $9.21
PA I-81/I-78 Distribution Corridor $4.35 $4.57 $4.53 $4.64 $4.72 $4.72 n/a
Philadelphia, PA $4.52 $4.52 $4.65 $4.63 $4.81 $4.26 $3.69
Phoenix, AZ $6.26 $6.43 $6.54 $7.05 $7.03 $4.88 $7.41
Pittsburgh, PA $7.21 $7.70 $7.72 $7.84 $7.54 $5.25 $5.24
Portland, OR $7.07 $7.22 $7.62 $8.02 $7.73 $6.75 $6.23
Providence, RI $4.85 $4.85 $4.85 $4.85 $4.85 $4.70 n/a
Puget Sound - Eastside $9.89 $10.89 $11.24 $11.62 $12.27 $10.72 $7.21
Raleigh/Durham, NC $6.34 $6.44 $7.06 $6.99 $7.28 $5.60 $6.73
Richmond, VA $4.41 $4.34 $4.67 $4.72 $4.71 $4.10 $3.84
Roanoke, VA $4.23 $4.10 $4.18 $4.32 $3.94 $3.66 $4.23
Rochester, NY $4.84 $4.84 $4.84 $4.84 $4.84 $3.25 $4.75
Sacramento, CA $4.40 $4.40 $4.43 $4.55 $4.66 $4.54 $5.60
Salt Lake City, UT $5.30 $5.40 $5.47 $5.45 $5.37 $5.10 $4.76
San Antonio, TX $5.76 $5.83 $5.85 $5.98 $6.04 $5.00 n/a
San Diego, CA $11.76 $12.12 $12.00 $12.12 $12.00 $9.12 $9.96
San Francisco North Bay, CA $7.98 $9.87 $9.97 $10.23 $10.04 $10.05 $4.91
San Francisco Peninsula, CA $13.09 $13.50 $15.95 $14.12 $14.72 $13.73 $18.35
San Jose (Silicon Valley), CA $9.60 $9.96 $11.88 $12.60 $12.12 $9.84 $13.32
Savannah, GA $4.22 $4.55 $4.79 $4.75 $4.75 $4.32 n/a
Seattle, WA $5.85 $6.04 $6.61 $6.73 $7.15 $6.31 $5.46
Southern New Hampshire $5.73 $6.14 $6.07 $5.53 $5.90 $5.45 $5.42
St. Louis, MO $4.31 $4.28 $4.27 $4.39 $4.45 $4.07 $7.40
St. Petersburg/Clearwater, FL $7.40 $7.61 $7.34 $7.72 $7.93 $5.80 $5.63
Stockton/Tracy, CA $3.98 $4.02 $4.06 $4.08 $4.06 $4.44 $3.24
Suburban MD $9.19 $9.20 $9.44 $9.57 $10.12 $8.42 n/a
Syracuse, NY $3.56 $3.65 $3.81 $3.83 $3.85 $4.31 $2.93
Tampa, FL $5.42 $5.48 $6.12 $6.10 $6.15 $5.38 $4.00
Tucson, AZ $6.90 $6.80 $6.81 $6.67 $6.44 $5.87 $5.86
Tulsa, OK $4.49 $4.50 $4.52 $4.52 $4.52 $4.83 $3.81
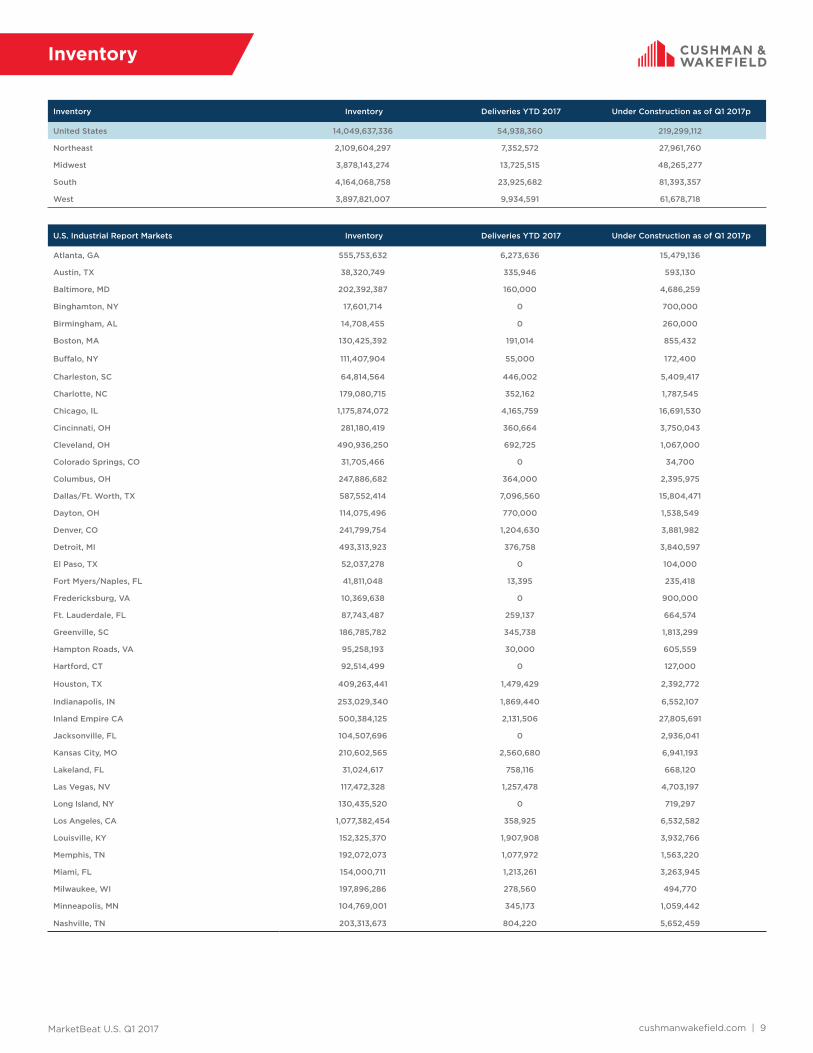
MarketBeat U.S. Q1 2017 cushmanwakefi eld.com | 9
Inventory
Inventory Inventory Deliveries YTD 2017 Under Construction as of Q1 2017p
United States 14,049,637,336 54,938,360 219,299,112
Northeast 2,109,604,297 7,352,572 27,961,760
Midwest 3,878,143,274 13,725,515 48,265,277
South 4,164,068,758 23,925,682 81,393,357
West 3,897,821,007 9,934,591 61,678,718
U.S. Industrial Report Markets Inventory Deliveries YTD 2017 Under Construction as of Q1 2017p
Atlanta, GA 555,753,632 6,273,636 15,479,136
Austin, TX 38,320,749 335,946 593,130
Baltimore, MD 202,392,387 160,000 4,686,259
Binghamton, NY 17,601,714 0 700,000
Birmingham, AL 14,708,455 0 260,000
Boston, MA 130,425,392 191,014 855,432
Buff alo, NY 111,407,904 55,000 172,400
Charleston, SC 64,814,564 446,002 5,409,417
Charlotte, NC 179,080,715 352,162 1,787,545
Chicago, IL 1,175,874,072 4,165,759 16,691,530
Cincinnati, OH 281,180,419 360,664 3,750,043
Cleveland, OH 490,936,250 692,725 1,067,000
Colorado Springs, CO 31,705,466 0 34,700
Columbus, OH 247,886,682 364,000 2,395,975
Dallas/Ft. Worth, TX 587,552,414 7,096,560 15,804,471
Dayton, OH 114,075,496 770,000 1,538,549
Denver, CO 241,799,754 1,204,630 3,881,982
Detroit, MI 493,313,923 376,758 3,840,597
El Paso, TX 52,037,278 0 104,000
Fort Myers/Naples, FL 41,811,048 13,395 235,418
Fredericksburg, VA 10,369,638 0 900,000
Ft. Lauderdale, FL 87,743,487 259,137 664,574
Greenville, SC 186,785,782 345,738 1,813,299
Hampton Roads, VA 95,258,193 30,000 605,559
Hartford, CT 92,514,499 0 127,000
Houston, TX 409,263,441 1,479,429 2,392,772
Indianapolis, IN 253,029,340 1,869,440 6,552,107
Inland Empire CA 500,384,125 2,131,506 27,805,691
Jacksonville, FL 104,507,696 0 2,936,041
Kansas City, MO 210,602,565 2,560,680 6,941,193
Lakeland, FL 31,024,617 758,116 668,120
Las Vegas, NV 117,472,328 1,257,478 4,703,197
Long Island, NY 130,435,520 0 719,297
Los Angeles, CA 1,077,382,454 358,925 6,532,582
Louisville, KY 152,325,370 1,907,908 3,932,766
Memphis, TN 192,072,073 1,077,972 1,563,220
Miami, FL 154,000,711 1,213,261 3,263,945
Milwaukee, WI 197,896,286 278,560 494,770
Minneapolis, MN 104,769,001 345,173 1,059,442
Nashville, TN 203,313,673 804,220 5,652,459
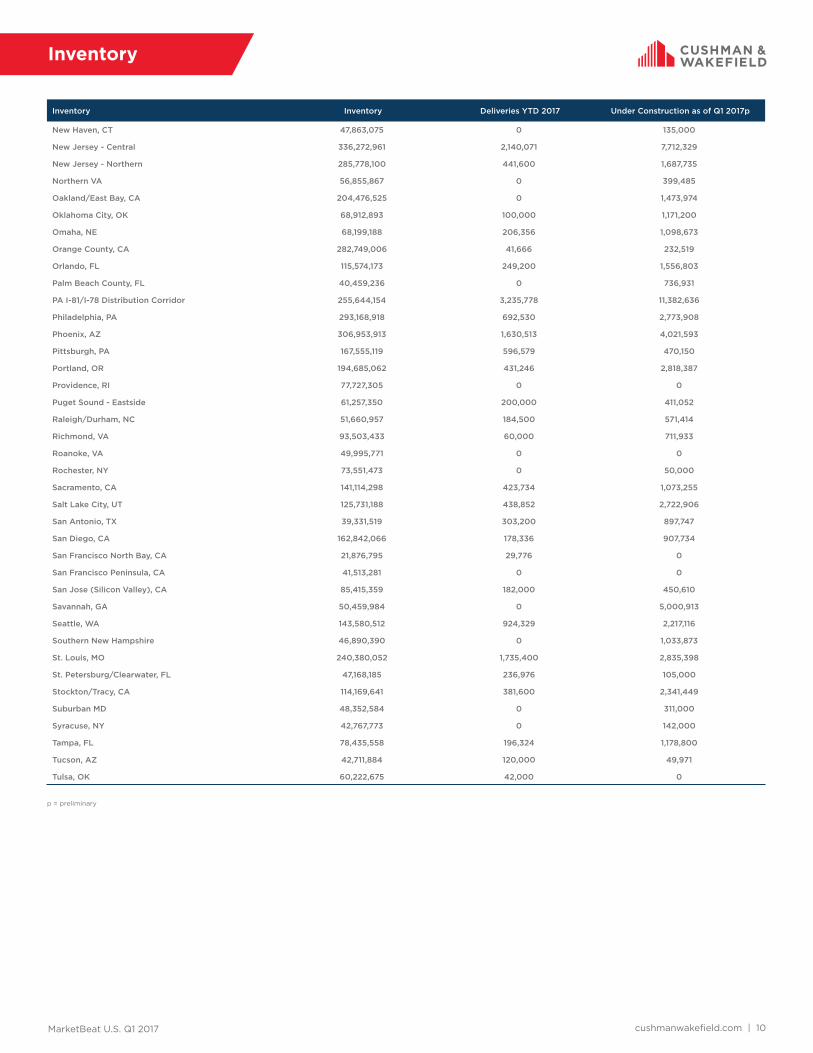
MarketBeat U.S. Q1 2017 cushmanwakefi eld.com | 10
Inventory
Inventory Inventory Deliveries YTD 2017 Under Construction as of Q1 2017p
New Haven, CT 47,863,075 0 135,000
New Jersey - Central 336,272,961 2,140,071 7,712,329
New Jersey - Northern 285,778,100 441,600 1,687,735
Northern VA 56,855,867 0 399,485
Oakland/East Bay, CA 204,476,525 0 1,473,974
Oklahoma City, OK 68,912,893 100,000 1,171,200
Omaha, NE 68,199,188 206,356 1,098,673
Orange County, CA 282,749,006 41,666 232,519
Orlando, FL 115,574,173 249,200 1,556,803
Palm Beach County, FL 40,459,236 0 736,931
PA I-81/I-78 Distribution Corridor 255,644,154 3,235,778 11,382,636
Philadelphia, PA 293,168,918 692,530 2,773,908
Phoenix, AZ 306,953,913 1,630,513 4,021,593
Pittsburgh, PA 167,555,119 596,579 470,150
Portland, OR 194,685,062 431,246 2,818,387
Providence, RI 77,727,305 0 0
Puget Sound - Eastside 61,257,350 200,000 411,052
Raleigh/Durham, NC 51,660,957 184,500 571,414
Richmond, VA 93,503,433 60,000 711,933
Roanoke, VA 49,995,771 0 0
Rochester, NY 73,551,473 0 50,000
Sacramento, CA 141,114,298 423,734 1,073,255
Salt Lake City, UT 125,731,188 438,852 2,722,906
San Antonio, TX 39,331,519 303,200 897,747
San Diego, CA 162,842,066 178,336 907,734
San Francisco North Bay, CA 21,876,795 29,776 0
San Francisco Peninsula, CA 41,513,281 0 0
San Jose (Silicon Valley), CA 85,415,359 182,000 450,610
Savannah, GA 50,459,984 0 5,000,913
Seattle, WA 143,580,512 924,329 2,217,116
Southern New Hampshire 46,890,390 0 1,033,873
St. Louis, MO 240,380,052 1,735,400 2,835,398
St. Petersburg/Clearwater, FL 47,168,185 236,976 105,000
Stockton/Tracy, CA 114,169,641 381,600 2,341,449
Suburban MD 48,352,584 0 311,000
Syracuse, NY 42,767,773 0 142,000
Tampa, FL 78,435,558 196,324 1,178,800
Tucson, AZ 42,711,884 120,000 49,971
Tulsa, OK 60,222,675 42,000 0
p = preliminary
Methodology
Cushman & Wakefi eld’s quarterly estimates are derived from a variety of data sources, including its own proprietary database, and historical data from third party data sources. The market statistics are calculated from a base building inventory made up of industrial properties deemed to be competitive in the local industrial markets. Generally, owner-occupied and federally-owned buildings are not included. Older buildings unfi t for occupancy or ones that require substantial renovation before tenancy are generally not included in the competitive inventory. The inventory is subject to revisions due to resampling. Vacant space is defi ned as space that is available immediately or imminently after the end of the quarter. Sublet space still occupied by the tenant is not counted as available space. The fi gures provided for the current quarter are preliminary, and all information contained in the report is subject to correction of errors and revisions based on additional data received.
Regional Map
WestMidwestSouthNortheast
Jason TolliverHead of Industrial Research, AmericasTel: +1 317.639.0549cushmanwakefi eld.com
Explanation of Terms
Total Inventory: The total amount of industrial space (in buildings of a
predetermined size by market) that can be rented by a third party.
Overall Vacancy Rate: The amount of unoccupied space (new, relet, and
sublet) expressed as a percentage of total inventory.
Absorption: The net change in occupied space between two points in time.
(Total occupied space in the present quarter minus total occupied space from
the previous quarter, quoted on a net, not gross, basis.)
Leasing Activity: The sum of all leases over a period of time. This includes
pre-leasing activity as well as expansions. It does not include renewals.
Overall Weighted Asking Rents: NNN average asking rents weighted by the
amount of available direct and sublease space in industrial properties.
W/D: Warehouse and or distribution properties.
MFG: Manufacturing properties.
About Cushman & Wakefi eld
Cushman & Wakefi eld is a leading global real estate services fi rm that helps clients transform the way people work, shop, and live. Our 45,000 employees in more than 70 countries help occupiers and investors optimize the value of their real estate by combining our global perspective and deep local knowledge with an impressive platform of real estate solutions. Cushman & Wakefi eld is among the largest commercial real estate services fi rms with revenue of $6 billion across core services of agency leasing, asset services, capital markets, facility services (C&W Services), global occupier services, investment & asset management (DTZ Investors), project & development services, tenant representation, and valuation & advisory. 2017 marks the 100-year anniversary of the Cushman & Wakefi eld brand. 100 years of taking our clients’ ideas and putting them into action. To learn more, visit www.cushwakecentennial.com, www.cushmanwakefi eld.com or follow @CushWake on Twitter.
Cushman & Wakefi eld Copyright 2017. No warranty or representation, express or implied, is made to the accuracy or completeness of the information contained herein, and same is submitted subject to errors, omissions, change of price, rental or other conditions, withdrawal without notice, and to any special listing conditions imposed by the property owner(s). As applicable, we make no representation as to the condition of the property (or properties) in question.
Carolyn SalzerIndustrial Research Analyst, AmericasTel: +1 847.518.3212cushmanwakefi eld.com

cushmanwakefi eld.com | 1
U.S. IndustrialQ4 2016
MARKETBEAT
U.S. INDUSTRIAL
Overall Vacancy
Net Absorption/Rent NNN4-QTR TRAILING AVERAGE
Market IndicatorsQ4 15 Q4 16 12-Month
Forecast
Overall Vacancy 6.5% 5.5%
Net Absorption 67.3M 63.6M
Under Construction 185.6M 215.6M
Weighted Asking Rent (NNN) $5.43 $5.64
Employment IndicatorsQ4 15 Q4 16 12-Month
Forecast
Total Nonfarm Employment 142.8M 144.6M
Industrial Employment 25.1M 25.2M
Unemployment 5.0% 4.7%
$4.50
$5.00
$5.50
$6.00
0
10
20
30
40
50
60
70
80
2011 2012 2013 2014 2015 2016
Net Absorption, MSF Weighted Asking Rent, $ PSF
0.0%
2.0%
4.0%
6.0%
8.0%
10.0%
12.0%
2011 2012 2013 2014 2015 2016
Historical Average = 8.4%
EconomyThe U.S. economy and industrial market are positioned to perform well in 2017. In the third quarter of 2016 real GDP expanded at a 3.5% annual rate — the strongest growth rate in two years and more than triple the rate of growth for the fi rst half of 2016. Nationally, 2.2 million jobs were created during 2016, and the unemployment rate (4.7% in December) declined to its lowest level since 2007. Wage growth is fi rming: hourly earnings rose 2.9% year-over-year in December — a post-recession high. The increase in wages will enable households to further increase consumption in 2017, sustaining economic momentum and bolstering logistics-related leasing. Economic data refl ect an increasingly confi dent consumer. The Conference Board’s Consumer Confi dence Index rose to 113.7 in December — its highest level this business cycle — with the expectation series of the index showing that consumers anticipate business conditions, jobs and their income to improve in the next six months. Given that consumer spending is a dominant driver of industrial demand these readings indicate more momentum for the industrial sector, especially as eCommerce continues to grow rapidly. As a share of retail sales, excluding autos, eCommerce has grown from 1% in Q1 2000 to 9.3% in Q3 2016. We expect that share to increase by another 1% by the end of 2018; that means the current rate of $100 billion eCommerce sales per quarter will increase roughly 25% to nearly $125 billion per quarter in Q4 2018 as retail sales increase. This equates to an additional $2 billion in eCommerce sales per month within the next two years. This growth trajectory suggests similar, if not more, robust absorption for warehouse and distribution product.
The U.S. manufacturing sector ended 2016 on a strong note: the ISM manufacturing index rose to a two-year high of 54.7 in December as production and new orders surged. The strength in production and new orders reported in the ISM index are consistent with other economic data including core capital goods orders and the manufacturing portion of industrial production, both of which indicate a stronger manufacturing sector. Domestic companies have also reined in inventories to more closely align with sales and there are early signs corporate investment is beginning to fi rm, both of which bode well for the industrial market.
Market OverviewDemand remained robust in the fi nal quarter of 2016 as the U.S. industrial market absorbed 63.6 million square feet (MSF) of space. This propelled annual net absorption to a record-setting 282.9 MSF and pushed deliveries to a cyclical high of 232.9 MSF. Typically such a robust development pipeline would dramatically rebalance supply and demand fundamentals and elevate the vacancy rate, but these are not typical times. Ecommerce continues to structurally alter supply chains and drive robust levels of leasing. As a result, the vacancy rate tightened in Q4 2016 falling by 30 basis points (bps) to 5.5% for all industrial product types.
Every industrial segment remains in growth mode: in 2016, logistics-related warehousing posted 242.9 MSF of net absorption, manufacturing registered 25.1 MSF of growth, fl ex
Source: Cushman & Wakefi eld Research
Source: BLS
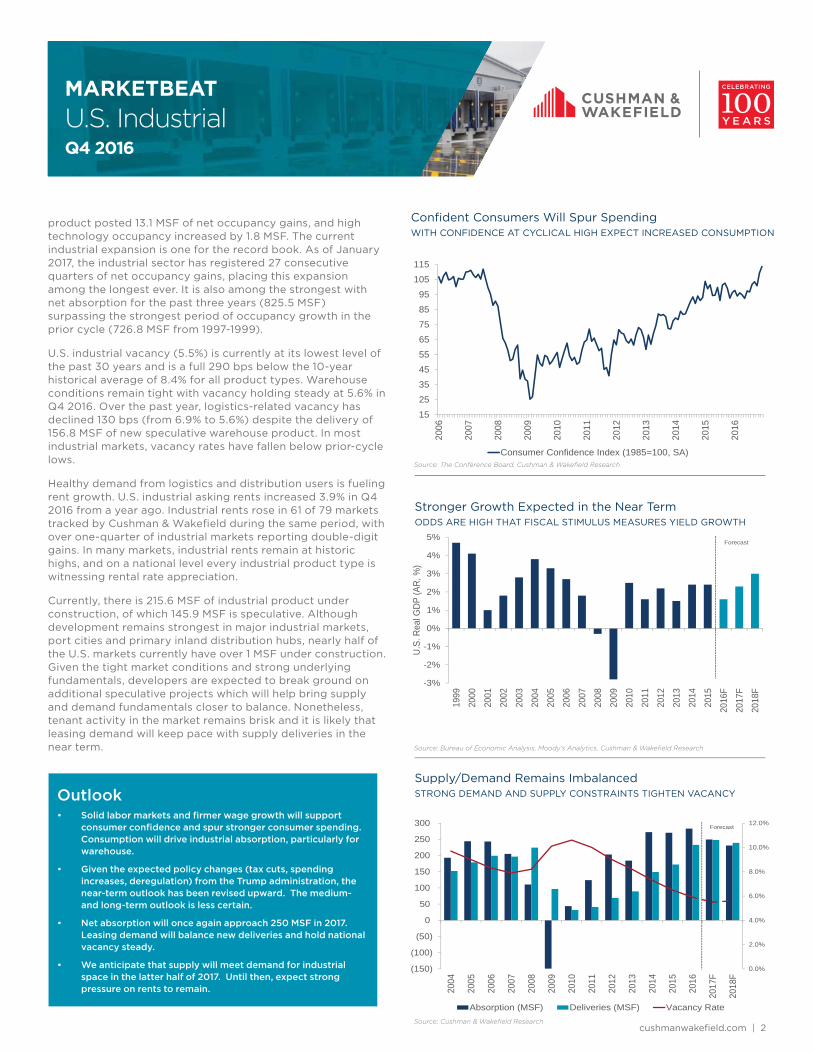
cushmanwakefi eld.com | 2
U.S. IndustrialQ4 2016
MARKETBEAT
Stronger Growth Expected in the Near Term ODDS ARE HIGH THAT FISCAL STIMULUS MEASURES YIELD GROWTH
Supply/Demand Remains ImbalancedSTRONG DEMAND AND SUPPLY CONSTRAINTS TIGHTEN VACANCY
Confi dent Consumers Will Spur SpendingWITH CONFIDENCE AT CYCLICAL HIGH EXPECT INCREASED CONSUMPTION
Outlook• Solid labor markets and fi rmer wage growth will support
consumer confi dence and spur stronger consumer spending. Consumption will drive industrial absorption, particularly for warehouse.
• Given the expected policy changes (tax cuts, spending increases, deregulation) from the Trump administration, the near-term outlook has been revised upward. The medium- and long-term outlook is less certain.
• Net absorption will once again approach 250 MSF in 2017. Leasing demand will balance new deliveries and hold national vacancy steady.
• We anticipate that supply will meet demand for industrial space in the latter half of 2017. Until then, expect strong pressure on rents to remain.
Source: The Conference Board, Cushman & Wakefi eld Research
Source: Bureau of Economic Analysis, Moody’s Analytics, Cushman & Wakefi eld Research
Source: Cushman & Wakefi eld Research
product posted 13.1 MSF of net occupancy gains, and high technology occupancy increased by 1.8 MSF. The current industrial expansion is one for the record book. As of January 2017, the industrial sector has registered 27 consecutive quarters of net occupancy gains, placing this expansion among the longest ever. It is also among the strongest with net absorption for the past three years (825.5 MSF) surpassing the strongest period of occupancy growth in the prior cycle (726.8 MSF from 1997-1999).
U.S. industrial vacancy (5.5%) is currently at its lowest level of the past 30 years and is a full 290 bps below the 10-year historical average of 8.4% for all product types. Warehouse conditions remain tight with vacancy holding steady at 5.6% in Q4 2016. Over the past year, logistics-related vacancy has declined 130 bps (from 6.9% to 5.6%) despite the delivery of 156.8 MSF of new speculative warehouse product. In most industrial markets, vacancy rates have fallen below prior-cycle lows.
Healthy demand from logistics and distribution users is fueling rent growth. U.S. industrial asking rents increased 3.9% in Q4 2016 from a year ago. Industrial rents rose in 61 of 79 markets tracked by Cushman & Wakefi eld during the same period, with over one-quarter of industrial markets reporting double-digit gains. In many markets, industrial rents remain at historic highs, and on a national level every industrial product type is witnessing rental rate appreciation.
Currently, there is 215.6 MSF of industrial product under construction, of which 145.9 MSF is speculative. Although development remains strongest in major industrial markets, port cities and primary inland distribution hubs, nearly half of the U.S. markets currently have over 1 MSF under construction. Given the tight market conditions and strong underlying fundamentals, developers are expected to break ground on additional speculative projects which will help bring supply and demand fundamentals closer to balance. Nonetheless, tenant activity in the market remains brisk and it is likely that leasing demand will keep pace with supply deliveries in the near term.
-3%
-2%
-1%
0%
1%
2%
3%
4%
5%
1999
2000
2001
2002
2003
2004
2005
2006
2007
2008
2009
2010
2011
2012
2013
2014
2015
2016
F
2017
F
2018
F
U.S.
Rea
l GDP
(AR,
%)
Forecast
152535455565758595
105115
2006
2007
2008
2009
2010
2011
2012
2013
2014
2015
2016
Consumer Confidence Index (1985=100, SA)
0.0%
2.0%
4.0%
6.0%
8.0%
10.0%
12.0%
(150)
(100)
(50)
0
50
100
150
200
250
300
2004
2005
2006
2007
2008
2009
2010
2011
2012
2013
2014
2015
2016
2017
F
2018
F
Absorption (MSF) Deliveries (MSF) Vacancy Rate
Forecast
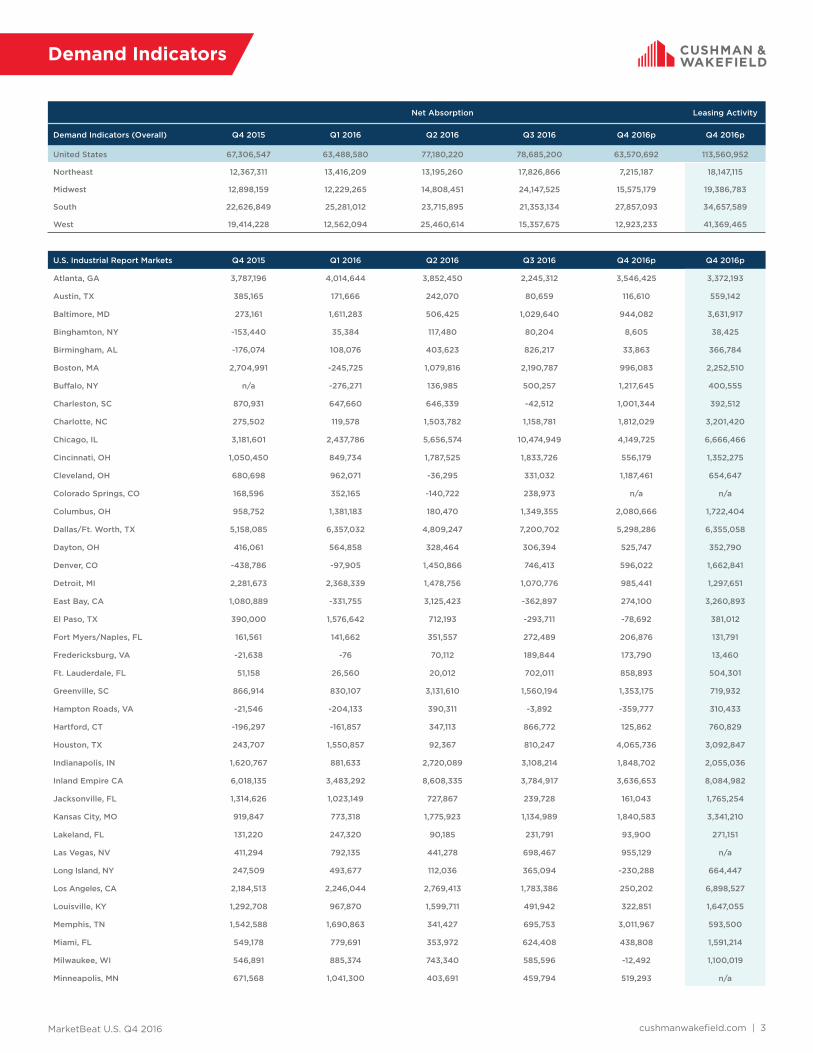
MarketBeat U.S. Q4 2016 cushmanwakefi eld.com | 3
Net Absorption Leasing Activity
Demand Indicators (Overall) Q4 2015 Q1 2016 Q2 2016 Q3 2016 Q4 2016p Q4 2016p
United States 67,306,547 63,488,580 77,180,220 78,685,200 63,570,692 113,560,952
Northeast 12,367,311 13,416,209 13,195,260 17,826,866 7,215,187 18,147,115
Midwest 12,898,159 12,229,265 14,808,451 24,147,525 15,575,179 19,386,783
South 22,626,849 25,281,012 23,715,895 21,353,134 27,857,093 34,657,589
West 19,414,228 12,562,094 25,460,614 15,357,675 12,923,233 41,369,465
U.S. Industrial Report Markets Q4 2015 Q1 2016 Q2 2016 Q3 2016 Q4 2016p Q4 2016p
Atlanta, GA 3,787,196 4,014,644 3,852,450 2,245,312 3,546,425 3,372,193
Austin, TX 385,165 171,666 242,070 80,659 116,610 559,142
Baltimore, MD 273,161 1,611,283 506,425 1,029,640 944,082 3,631,917
Binghamton, NY -153,440 35,384 117,480 80,204 8,605 38,425
Birmingham, AL -176,074 108,076 403,623 826,217 33,863 366,784
Boston, MA 2,704,991 -245,725 1,079,816 2,190,787 996,083 2,252,510
Buff alo, NY n/a -276,271 136,985 500,257 1,217,645 400,555
Charleston, SC 870,931 647,660 646,339 -42,512 1,001,344 392,512
Charlotte, NC 275,502 119,578 1,503,782 1,158,781 1,812,029 3,201,420
Chicago, IL 3,181,601 2,437,786 5,656,574 10,474,949 4,149,725 6,666,466
Cincinnati, OH 1,050,450 849,734 1,787,525 1,833,726 556,179 1,352,275
Cleveland, OH 680,698 962,071 -36,295 331,032 1,187,461 654,647
Colorado Springs, CO 168,596 352,165 -140,722 238,973 n/a n/a
Columbus, OH 958,752 1,381,183 180,470 1,349,355 2,080,666 1,722,404
Dallas/Ft. Worth, TX 5,158,085 6,357,032 4,809,247 7,200,702 5,298,286 6,355,058
Dayton, OH 416,061 564,858 328,464 306,394 525,747 352,790
Denver, CO -438,786 -97,905 1,450,866 746,413 596,022 1,662,841
Detroit, MI 2,281,673 2,368,339 1,478,756 1,070,776 985,441 1,297,651
East Bay, CA 1,080,889 -331,755 3,125,423 -362,897 274,100 3,260,893
El Paso, TX 390,000 1,576,642 712,193 -293,711 -78,692 381,012
Fort Myers/Naples, FL 161,561 141,662 351,557 272,489 206,876 131,791
Fredericksburg, VA -21,638 -76 70,112 189,844 173,790 13,460
Ft. Lauderdale, FL 51,158 26,560 20,012 702,011 858,893 504,301
Greenville, SC 866,914 830,107 3,131,610 1,560,194 1,353,175 719,932
Hampton Roads, VA -21,546 -204,133 390,311 -3,892 -359,777 310,433
Hartford, CT -196,297 -161,857 347,113 866,772 125,862 760,829
Houston, TX 243,707 1,550,857 92,367 810,247 4,065,736 3,092,847
Indianapolis, IN 1,620,767 881,633 2,720,089 3,108,214 1,848,702 2,055,036
Inland Empire CA 6,018,135 3,483,292 8,608,335 3,784,917 3,636,653 8,084,982
Jacksonville, FL 1,314,626 1,023,149 727,867 239,728 161,043 1,765,254
Kansas City, MO 919,847 773,318 1,775,923 1,134,989 1,840,583 3,341,210
Lakeland, FL 131,220 247,320 90,185 231,791 93,900 271,151
Las Vegas, NV 411,294 792,135 441,278 698,467 955,129 n/a
Long Island, NY 247,509 493,677 112,036 365,094 -230,288 664,447
Los Angeles, CA 2,184,513 2,246,044 2,769,413 1,783,386 250,202 6,898,527
Louisville, KY 1,292,708 967,870 1,599,711 491,942 322,851 1,647,055
Memphis, TN 1,542,588 1,690,863 341,427 695,753 3,011,967 593,500
Miami, FL 549,178 779,691 353,972 624,408 438,808 1,591,214
Milwaukee, WI 546,891 885,374 743,340 585,596 -12,492 1,100,019
Minneapolis, MN 671,568 1,041,300 403,691 459,794 519,293 n/a
Demand Indicators

MarketBeat U.S. Q4 2016 cushmanwakefi eld.com | 4
Net Absorption Leasing Activity
Demand Indicators (Overall) Q4 2015 Q1 2016 Q2 2016 Q3 2016 Q4 2016p Q4 2016p
Nashville, TN 3,115,044 1,287,008 1,433,052 578,168 2,529,427 1,109,119
New Haven, CT -120,269 27,084 -117,896 -169,623 293,732 504,192
New Jersey - Central 2,797,263 5,861,097 2,672,125 2,088,582 702,054 3,929,231
New Jersey - Northern 1,281,402 1,723,861 1,341,223 949,477 -449,521 2,512,247
Oklahoma City, OK -249,225 366,886 355,395 79,041 -66,220 n/a
Omaha, NE -67,189 -18,265 81,715 142,371 204,651 349,282
Orange County, CA 554,044 428,201 625,271 577,174 417,332 2,110,423
Orlando, FL 393,499 736,721 822,697 671,947 1,013,276 708,743
Palm Beach County, FL 277,198 80,709 317,775 351,542 181,815 103,189
PA I-81/I-78 Distribution Corridor 2,109,790 2,747,713 4,069,078 7,608,813 2,326,714 3,220,418
Philadelphia, PA 1,852,105 2,158,170 1,336,387 3,442,237 1,520,977 2,705,267
Phoenix, AZ 4,027,249 1,386,180 2,196,394 2,244,605 1,572,074 4,970,674
Pittsburgh, PA 1,189,636 873,111 967,110 -175,139 100,230 855,723
Portland, OR 3,128,684 439,415 978,437 308,442 529,659 1,498,415
Providence, RI n/a 133,493 254,742 115,966 102,292 102,292
Puget Sound - Eastside 213,643 -118,429 1,322,354 256,769 303,774 560,558
Raleigh/Durham, NC 847,787 108,522 283,535 -172,912 344,104 276,401
Richmond, VA -197,984 547,739 321,430 75,820 263,746 376,678
Roanoke, VA 239,271 -76,697 63,011 354,142 69,980 55,368
Rochester, NY 338,920 69,576 801,031 225,539 213,189 66,658
Sacramento, CA -134,622 1,291,485 368,021 582,097 183,313 946,930
Salt Lake City, UT 512,920 410,524 612,166 763,231 442,247 2,175,660
San Antonio, TX 304,981 147,891 142,329 88,610 142,169 332,021
San Diego, CA 611,932 -236,360 374,520 -100,709 431,283 1,538,161
San Francisco North Bay, CA 73,004 25,677 52,321 278,280 104,199 312,185
San Francisco Peninsula, CA 100,315 232,460 34,830 -193,018 72,077 410,723
San Jose (Silicon Valley), CA 455,549 44,003 494,984 -420,112 -36,597 1,479,305
Savannah, GA 610,191 0 -120,950 48,052 -358,098 1,536,630
Seattle, WA -737,959 618,628 1,291,209 2,512,682 527,043 2,011,211
Southern New Hampshire 303,388 233,167 181,794 160,019 n/a n/a
St. Louis, MO 637,040 101,934 -311,801 3,350,329 1,689,223 495,003
St. Petersburg/Clearwater, FL 20,082 61,539 30,381 -37,440 590,146 344,814
Stockton/Tracy, CA 1,080,889 1,555,862 591,264 621,706 2,544,634 2,850,526
Suburban MD 107,919 108,423 275,122 517,102 250,065 428,279
Suburban VA -196,354 271,468 -125,578 293,531 -54,788 125,262
Syracuse, NY 12,313 -256,271 -103,764 -422,119 287,613 134,321
Tampa, FL 375,052 70,529 262,732 250,524 146,530 360,109
Tucson, AZ 103,939 40,472 264,250 1,037,269 120,089 597,451
Tulsa, OK -95,054 -90,177 -190,296 235,404 -196,268 n/a
Demand Indicators
p = preliminary

MarketBeat U.S. Q4 2016 cushmanwakefi eld.com | 5
Vacancy Rates
Overall Vacancy Rate Q4 2015 Q1 2016 Q2 2016 Q3 2016 Q4 2016p
United States 6.5% 6.2% 6.1% 5.8% 5.5%
Northeast 7.7% 7.3% 7.1% 6.5% 6.3%
Midwest 6.2% 6.2% 5.9% 5.8% 5.4%
South 7.4% 7.0% 7.0% 6.8% 6.6%
West 5.1% 4.9% 4.6% 4.2% 4.1%
U.S. Industrial Report Markets Q4 2015 Q1 2016 Q2 2016 Q3 2016 Q4 2016p
Atlanta, GA 7.9% 8.5% 8.4% 8.6% 9.0%
Austin, TX 6.1% 6.8% 7.7% 7.5% 6.4%
Baltimore, MD 8.3% 7.5% 7.2% 7.0% 6.6%
Binghamton, NY 12.4% 12.2% 11.7% 11.7% 10.8%
Birmingham, AL 12.4% 17.0% 14.4% 9.0% 8.8%
Boston, MA 7.6% 7.3% 7.0% 6.7% 6.5%
Buff alo, NY 8.8% 8.9% 9.0% 8.9% 8.9%
Charleston, SC 7.3% 7.9% 7.7% 6.8% 6.8%
Charlotte, NC 6.0% 6.4% 4.5% 3.8% 3.6%
Chicago, IL 6.4% 6.4% 6.3% 6.1% 6.3%
Cincinnati, OH 4.5% 4.2% 4.0% 4.2% 4.2%
Cleveland, OH 5.3% 5.2% 5.0% 4.9% 4.6%
Colorado Springs, CO 7.9% 6.3% 7.8% 7.3% 7.3%
Columbus, OH 6.5% 6.6% 6.5% 5.9% 5.5%
Dallas/Ft. Worth, TX 7.5% 6.9% 6.9% 6.6% 6.9%
Dayton, OH 9.1% 8.7% 8.6% 8.1% 8.0%
Denver, CO 4.3% 2.7% 3.4% 3.9% 4.3%
Detroit, MI 5.4% 4.8% 4.6% 4.0% 4.0%
East Bay, CA 3.5% 2.9% 2.7% 3.1% 2.9%
El Paso, TX 11.6% 8.7% 6.6% 7.1% 6.8%
Fort Myers/Naples, FL 5.8% 4.6% 3.8% 3.3% 2.8%
Fredericksburg, VA 12.8% 12.3% 10.2% 8.1% 7.6%
Ft. Lauderdale, FL 6.4% 7.1% 6.8% 5.5% 4.4%
Greenville, SC 6.8% 7.4% 6.7% 6.9% 6.6%
Hampton Roads, VA 6.4% 7.0% 6.5% 6.3% 6.6%
Hartford, CT 12.6% 12.9% 12.8% 11.9% 11.7%
Houston, TX 5.5% 6.0% 6.4% 6.7% 7.1%
Indianapolis, IN 7.3% 5.3% 4.9% 3.6% 3.0%
Inland Empire CA 5.7% 5.5% 4.7% 4.7% 4.4%
Jacksonville, FL 8.0% 7.2% 6.5% 6.5% 6.2%
Kansas City, MO 7.4% 7.9% 7.5% 7.5% 8.3%
Lakeland, FL 3.5% 5.0% 5.5% 4.2% 3.7%
Las Vegas, NV 6.8% 5.7% 5.9% 5.8% 5.4%
Long Island, NY 8.3% 7.5% 6.9% 6.5% 6.6%
Los Angeles, CA 2.3% 2.2% 1.6% 1.3% 1.4%
Louisville, KY 4.9% 5.5% 5.4% 6.2% 6.6%
Memphis, TN 9.8% 9.5% 9.3% 9.2% 8.7%
Miami, FL 5.7% 4.9% 4.9% 4.4% 4.3%
Milwaukee, WI 4.7% 4.4% 4.2% 4.0% 4.4%
Minneapolis, MN 9.9% 8.7% 8.5% 8.4% 8.2%

MarketBeat U.S. Q4 2016 cushmanwakefi eld.com | 6
Vacancy Rates
Overall Vacancy Rate Q4 2015 Q1 2016 Q2 2016 Q3 2016 Q4 2016p
Nashville, TN 4.7% 3.5% 3.4% 3.1% 2.9%
New Haven, CT 12.4% 12.7% 12.9% 13.2% 12.6%
New Jersey - Central 6.1% 5.1% 4.3% 4.3% 4.2%
New Jersey - Northern 6.7% 6.3% 5.7% 5.9% 5.9%
Oklahoma City, OK 6.7% 6.5% 7.2% 6.7% 7.3%
Omaha, NE 3.0% 3.5% 3.1% 3.2% 3.2%
Orange County, CA 2.8% 2.8% 2.3% 2.2% 2.0%
Orlando, FL 7.3% 6.9% 5.8% 5.1% 4.6%
Palm Beach County, FL 4.4% 5.4% 4.4% 3.8% 4.2%
PA I-81/I-78 Distribution Corridor 5.2% 6.6% 5.1% 3.9% 4.7%
Philadelphia, PA 5.6% 5.6% 5.4% 4.9% 4.2%
Phoenix, AZ 10.3% 10.1% 9.6% 9.3% 9.1%
Pittsburgh, PA 6.8% 6.2% 5.6% 6.0% 5.7%
Portland, OR 4.9% 4.8% 4.4% 4.3% 4.0%
Providence, RI 0.8% 0.6% 0.3% 0.2% 0.3%
Puget Sound - Eastside 6.2% 6.9% 5.3% 4.9% 4.7%
Raleigh/Durham, NC 5.0% 6.3% 5.8% 6.2% 5.9%
Richmond, VA 7.9% 8.1% 7.5% 6.9% 6.6%
Roanoke, VA 7.6% 8.3% 8.1% 8.3% 7.2%
Rochester, NY 11.4% 11.3% 10.2% 9.9% 9.6%
Sacramento, CA 10.8% 10.3% 9.4% 8.9% 10.8%
Salt Lake City, UT 7.3% 7.1% 7.0% 7.5% 7.2%
San Antonio, TX 10.4% 9.4% 9.0% 9.6% 9.6%
San Diego, CA 5.0% 5.0% 5.0% 5.1% 5.3%
San Francisco North Bay, CA 6.2% 6.7% 6.5% 5.2% 5.5%
San Francisco Peninsula, CA 3.4% 2.6% 2.8% 2.9% 2.6%
San Jose (Silicon Valley), CA 3.4% 3.1% 2.2% 2.6% 3.3%
Savannah, GA 2.2% 2.2% 2.4% 2.3% 3.0%
Seattle, WA 5.0% 5.8% 4.6% 3.8% 3.8%
Southern New Hampshire 16.2% 16.0% 15.7% 15.3% 15.3%
St. Louis, MO 6.6% 6.9% 7.3% 6.4% 6.6%
St. Petersburg/Clearwater, FL 5.1% 5.5% 5.6% 5.8% 4.7%
Stockton/Tracy, CA 7.1% 6.9% 6.3% 6.0% 3.4%
Suburban MD 12.2% 12.6% 12.7% 11.6% 10.7%
Suburban VA 11.9% 9.0% 9.6% 9.2% 9.2%
Syracuse, NY 10.8% 11.2% 10.3% 11.3% 10.6%
Tampa, FL 6.1% 6.2% 6.1% 5.6% 5.5%
Tucson, AZ 9.2% 9.6% 8.6% 8.1% 7.8%
Tulsa, OK 7.8% 8.0% 7.8% 7.4% 7.6%
p = preliminary

MarketBeat U.S. Q4 2016 cushmanwakefi eld.com | 7
Asking Rents
Overall (All Property Types) W/D MFG
Weighted Average Asking Rent Q4 2015 Q1 2016 Q2 2016 Q3 2016 Q4 2016p Q4 2016p
United States $5.43 $5.48 $5.52 $5.57 $5.64 $4.98 $5.20
Northeast $5.65 $5.75 $5.84 $5.98 $6.06 $5.70 $4.52
Midwest $4.33 $4.35 $4.40 $4.38 $4.40 $4.14 $4.32
South $5.12 $5.21 $5.19 $5.24 $5.24 $4.46 $4.17
West $7.09 $7.09 $7.19 $7.42 $7.62 $6.43 $7.95
U.S. Industrial Report Markets Q4 2015 Q1 2016 Q2 2016 Q3 2016 Q4 2016p Q4 2016p
Atlanta, GA $4.29 $4.27 $4.22 $4.17 $4.20 $3.68 $3.52
Austin, TX $9.94 $9.72 $9.66 $9.75 $9.71 $6.92 $7.80
Baltimore, MD $5.61 $5.48 $5.57 $5.49 $5.35 $4.86 n/a
Binghamton, NY $4.83 $4.74 $4.81 $4.81 $4.71 $4.23 $4.42
Birmingham, AL $4.58 $3.61 $3.57 $4.70 $5.01 $4.57 n/a
Boston, MA $5.96 $5.86 $6.02 $6.17 $6.22 $5.83 $5.66
Buff alo, NY $4.13 $4.13 $4.13 $4.98 $4.98 $4.75 $3.95
Charleston, SC $4.93 $5.07 $5.31 $5.31 $5.26 $5.46 $4.35
Charlotte, NC $4.81 $5.02 $5.03 $5.17 $5.15 $4.73 $4.19
Chicago, IL $4.85 $4.87 $4.88 $4.79 $4.76 $4.68 $4.46
Cincinnati, OH $3.89 $3.97 $4.01 $3.91 $4.06 $3.64 $3.74
Cleveland, OH $3.87 $3.89 $3.95 $3.88 $3.94 $3.60 n/a
Colorado Springs, CO $6.83 $6.41 $6.56 $6.54 $6.54 $6.54 n/a
Columbus, OH $3.38 $3.35 $3.35 $3.35 $3.43 $3.43 n/a
Dallas/Ft. Worth, TX $5.09 $5.47 $5.16 $4.89 $4.84 $4.04 $3.84
Dayton, OH $3.21 $3.21 $3.22 $3.19 $3.21 $3.01 $2.93
Denver, CO $8.24 $7.71 $7.04 $7.23 $7.57 $6.29 $8.78
Detroit, MI $5.04 $5.15 $5.25 $5.26 $5.26 $4.74 $4.72
East Bay, CA $7.98 $8.84 $8.52 $8.88 $9.01 $7.46 $10.34
El Paso, TX $3.75 $3.90 $3.95 $3.95 $3.95 $4.00 $3.90
Fort Myers/Naples, FL $6.37 $6.36 $6.61 $6.72 $6.80 $6.39 $6.60
Fredericksburg, VA $5.53 $5.72 $5.83 $5.65 $5.67 $5.85 $4.82
Ft. Lauderdale, FL $7.75 $8.76 $9.65 $9.52 $8.69 $7.96 $7.24
Greenville, SC $3.86 $3.44 $3.53 $3.55 $4.16 $3.48 $3.36
Hampton Roads, VA $5.03 $5.06 $5.18 $5.21 $5.42 $5.28 $4.80
Hartford, CT $4.18 $4.22 $4.27 $4.32 $4.08 $4.13 $3.52
Houston, TX $6.05 $6.02 $6.19 $6.12 $6.14 $6.05 $5.72
Indianapolis, IN $3.55 $3.47 $3.50 $3.55 $3.62 $3.53 $3.55
Inland Empire CA $5.75 $5.90 $6.24 $6.58 $6.82 $6.31 $7.54
Jacksonville, FL $4.05 $4.05 $3.99 $4.34 $4.24 $3.82 $3.08
Kansas City, MO $4.14 $4.39 $4.48 $4.51 $4.41 $3.92 $4.44
Lakeland, FL $4.53 $4.63 $4.89 $4.85 $5.00 $4.94 $4.55
Las Vegas, NV $7.19 $7.69 $7.74 $7.80 $7.24 $6.15 n/a
Long Island, NY $8.63 $8.15 $8.25 $8.53 $8.86 $8.51 $8.15
Los Angeles, CA $8.09 $8.26 $8.29 $8.79 $9.08 $8.94 $7.96
Louisville, KY $3.52 $3.61 $3.63 $3.67 $3.68 $3.58 $3.16
Memphis, TN $2.50 $2.35 $2.51 $2.49 $2.55 $2.37 n/a
Miami, FL $7.08 $7.47 $7.23 $7.32 $8.32 $8.01 $6.65
Milwaukee, WI $4.29 $4.39 $4.33 $4.39 $4.35 $3.85 $4.46
Minneapolis, MN $4.63 $4.65 $4.67 $4.78 $4.78 $4.61 n/a

MarketBeat U.S. Q4 2016 cushmanwakefi eld.com | 8
Asking Rents
p = preliminary
Overall (All Property Types) W/D MFG
Weighted Average Asking Rent Q4 2015 Q1 2016 Q2 2016 Q3 2016 Q4 2016p Q4 2016p
Nashville, TN $4.03 $3.97 $3.97 $4.14 $4.07 $5.19 $2.58
New Haven, CT $5.23 $5.18 $5.20 $5.68 $5.24 $5.16 $4.33
New Jersey - Central $6.06 $6.59 $6.97 $7.18 $7.28 $6.29 $4.39
New Jersey - Northern $7.03 $7.42 $7.71 $7.71 $7.90 $7.44 $6.23
Oklahoma City, OK $4.00 $4.21 $4.57 $4.65 $4.61 $3.96 $2.50
Omaha, NE $5.28 $5.16 $5.22 $5.55 $5.41 $5.15 $5.05
Orange County, CA $9.62 $9.76 $10.44 $10.91 $11.21 $9.03 $11.56
Orlando, FL $6.36 $6.51 $6.65 $6.45 $6.48 $5.34 $5.34
Palm Beach County, FL $7.93 $9.30 $9.35 $9.64 $10.71 $9.98 $9.43
PA I-81/I-78 Distribution Corridor $4.31 $4.35 $4.57 $4.53 $4.64 $4.63 $3.50
Philadelphia, PA $4.70 $4.52 $4.52 $4.65 $4.63 $4.22 $3.64
Phoenix, AZ $6.29 $6.26 $6.43 $6.54 $7.05 $4.86 $7.40
Pittsburgh, PA $5.74 $7.21 $7.70 $7.72 $7.84 $5.01 $4.58
Portland, OR $6.72 $7.07 $7.22 $7.62 $8.02 $6.55 $6.00
Providence, RI $4.85 $4.85 $4.85 $4.85 $4.85 $4.70 n/a
Puget Sound - Eastside $9.84 $9.89 $10.89 $11.24 $11.62 $10.21 $7.19
Raleigh/Durham, NC $7.77 $6.34 $6.44 $7.06 $6.99 $5.51 $5.57
Richmond, VA $4.43 $4.41 $4.34 $4.67 $4.72 $4.03 $3.83
Roanoke, VA $4.14 $4.23 $4.10 $4.18 $4.32 $4.28 $4.33
Rochester, NY $4.84 $4.84 $4.84 $4.84 $4.84 $3.25 $4.75
Sacramento, CA $4.74 $4.40 $4.40 $4.43 $4.55 $4.51 $4.76
Salt Lake City, UT $5.28 $5.30 $5.40 $5.47 $5.45 $5.18 $4.38
San Antonio, TX $5.74 $5.76 $5.83 $5.85 $5.98 $4.97 n/a
San Diego, CA $11.52 $11.76 $12.12 $12.00 $12.12 $9.00 $10.20
San Francisco North Bay, CA $10.69 $7.98 $9.87 $9.97 $10.23 $10.23 $4.39
San Francisco Peninsula, CA $11.64 $13.09 $13.50 $15.95 $14.12 $13.33 $17.62
San Jose (Silicon Valley), CA $9.84 $9.60 $9.96 $11.88 $12.60 $9.84 $14.04
Savannah, GA $4.22 $4.22 $4.55 $4.79 $4.75 $4.32 n/a
Seattle, WA $5.84 $5.85 $6.04 $6.61 $6.73 $6.12 $4.90
Southern New Hampshire $5.69 $5.73 $6.14 $6.07 $6.07 $5.54 $5.05
St. Louis, MO $4.22 $4.07 $4.14 $4.22 $4.28 $4.00 $7.29
St. Petersburg/Clearwater, FL $7.43 $7.40 $7.61 $7.34 $7.72 $5.85 $6.32
Stockton/Tracy, CA $3.96 $3.96 $4.08 $4.20 $4.32 $4.44 $3.96
Suburban MD $9.20 $9.19 $9.20 $9.44 $9.57 $8.27 n/a
Suburban VA $10.97 $11.14 $10.89 $11.11 $11.12 $9.02 n/a
Syracuse, NY $3.82 $3.56 $3.65 $3.81 $3.83 $4.44 $2.87
Tampa, FL $5.31 $5.42 $5.48 $6.12 $6.10 $5.27 $3.92
Tucson, AZ $6.92 $6.90 $6.80 $6.81 $6.67 $6.47 $6.04
Tulsa, OK $4.52 $4.49 $4.50 $4.52 $4.52 $4.83 $3.81
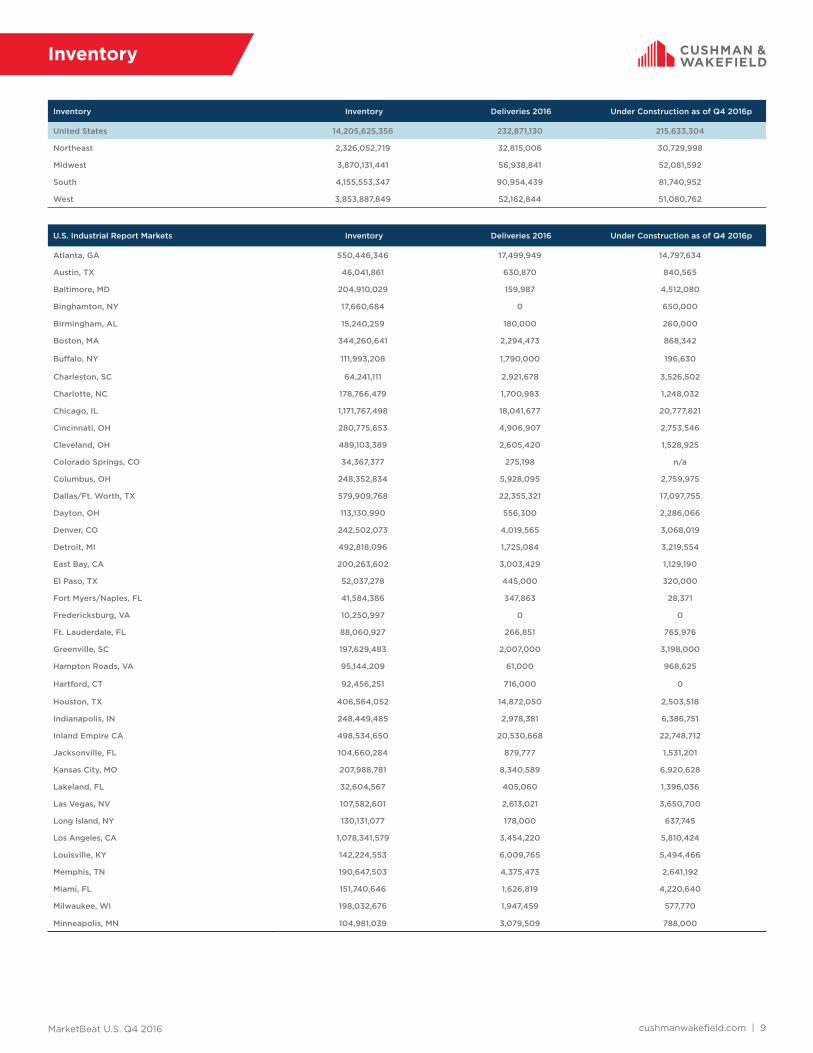
MarketBeat U.S. Q4 2016 cushmanwakefi eld.com | 9
Inventory
Inventory Inventory Deliveries 2016 Under Construction as of Q4 2016p
United States 14,205,625,356 232,871,130 215,633,304
Northeast 2,326,052,719 32,815,006 30,729,998
Midwest 3,870,131,441 56,938,841 52,081,592
South 4,155,553,347 90,954,439 81,740,952
West 3,853,887,849 52,162,844 51,080,762
U.S. Industrial Report Markets Inventory Deliveries 2016 Under Construction as of Q4 2016p
Atlanta, GA 550,446,346 17,499,949 14,797,634
Austin, TX 46,041,861 630,870 840,565
Baltimore, MD 204,910,029 159,987 4,512,080
Binghamton, NY 17,660,684 0 650,000
Birmingham, AL 15,240,259 180,000 260,000
Boston, MA 344,260,641 2,294,473 868,342
Buff alo, NY 111,993,208 1,790,000 196,630
Charleston, SC 64,241,111 2,921,678 3,526,502
Charlotte, NC 178,766,479 1,700,983 1,248,032
Chicago, IL 1,171,767,498 18,041,677 20,777,821
Cincinnati, OH 280,775,653 4,906,907 2,753,546
Cleveland, OH 489,103,389 2,605,420 1,528,925
Colorado Springs, CO 34,367,377 275,198 n/a
Columbus, OH 248,352,834 5,928,095 2,759,975
Dallas/Ft. Worth, TX 579,909,768 22,355,321 17,097,755
Dayton, OH 113,130,990 556,300 2,286,066
Denver, CO 242,502,073 4,019,565 3,068,019
Detroit, MI 492,818,096 1,725,084 3,219,554
East Bay, CA 200,263,602 3,003,429 1,129,190
El Paso, TX 52,037,278 445,000 320,000
Fort Myers/Naples, FL 41,584,386 347,863 28,371
Fredericksburg, VA 10,250,997 0 0
Ft. Lauderdale, FL 88,060,927 266,851 765,976
Greenville, SC 197,629,483 2,007,000 3,198,000
Hampton Roads, VA 95,144,209 61,000 968,625
Hartford, CT 92,456,251 716,000 0
Houston, TX 406,564,052 14,872,050 2,503,518
Indianapolis, IN 248,449,485 2,978,381 6,386,751
Inland Empire CA 498,534,650 20,530,668 22,748,712
Jacksonville, FL 104,660,284 879,777 1,531,201
Kansas City, MO 207,988,781 8,340,589 6,920,628
Lakeland, FL 32,604,567 405,060 1,396,036
Las Vegas, NV 107,582,601 2,613,021 3,650,700
Long Island, NY 130,131,077 178,000 637,745
Los Angeles, CA 1,078,341,579 3,454,220 5,810,424
Louisville, KY 142,224,553 6,009,765 5,494,466
Memphis, TN 190,647,503 4,375,473 2,641,192
Miami, FL 151,740,646 1,626,819 4,220,640
Milwaukee, WI 198,032,676 1,947,459 577,770
Minneapolis, MN 104,981,039 3,079,509 788,000
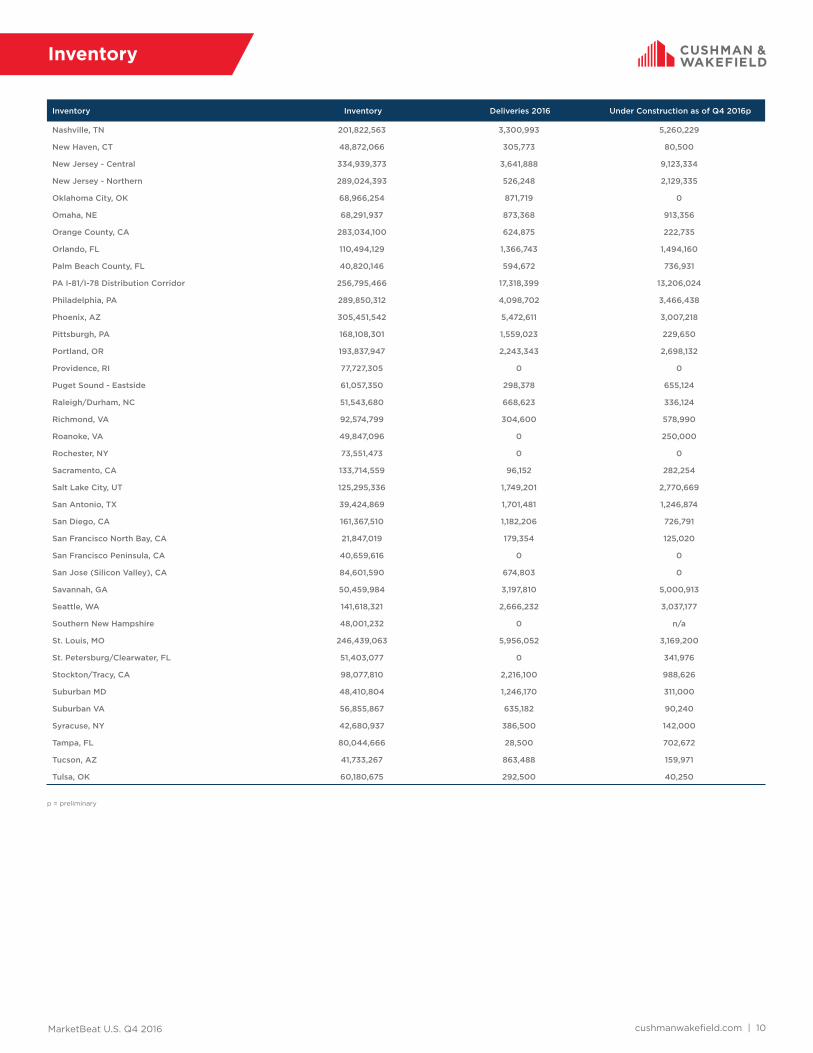
MarketBeat U.S. Q4 2016 cushmanwakefi eld.com | 10
Inventory
Inventory Inventory Deliveries 2016 Under Construction as of Q4 2016p
Nashville, TN 201,822,563 3,300,993 5,260,229
New Haven, CT 48,872,066 305,773 80,500
New Jersey - Central 334,939,373 3,641,888 9,123,334
New Jersey - Northern 289,024,393 526,248 2,129,335
Oklahoma City, OK 68,966,254 871,719 0
Omaha, NE 68,291,937 873,368 913,356
Orange County, CA 283,034,100 624,875 222,735
Orlando, FL 110,494,129 1,366,743 1,494,160
Palm Beach County, FL 40,820,146 594,672 736,931
PA I-81/I-78 Distribution Corridor 256,795,466 17,318,399 13,206,024
Philadelphia, PA 289,850,312 4,098,702 3,466,438
Phoenix, AZ 305,451,542 5,472,611 3,007,218
Pittsburgh, PA 168,108,301 1,559,023 229,650
Portland, OR 193,837,947 2,243,343 2,698,132
Providence, RI 77,727,305 0 0
Puget Sound - Eastside 61,057,350 298,378 655,124
Raleigh/Durham, NC 51,543,680 668,623 336,124
Richmond, VA 92,574,799 304,600 578,990
Roanoke, VA 49,847,096 0 250,000
Rochester, NY 73,551,473 0 0
Sacramento, CA 133,714,559 96,152 282,254
Salt Lake City, UT 125,295,336 1,749,201 2,770,669
San Antonio, TX 39,424,869 1,701,481 1,246,874
San Diego, CA 161,367,510 1,182,206 726,791
San Francisco North Bay, CA 21,847,019 179,354 125,020
San Francisco Peninsula, CA 40,659,616 0 0
San Jose (Silicon Valley), CA 84,601,590 674,803 0
Savannah, GA 50,459,984 3,197,810 5,000,913
Seattle, WA 141,618,321 2,666,232 3,037,177
Southern New Hampshire 48,001,232 0 n/a
St. Louis, MO 246,439,063 5,956,052 3,169,200
St. Petersburg/Clearwater, FL 51,403,077 0 341,976
Stockton/Tracy, CA 98,077,810 2,216,100 988,626
Suburban MD 48,410,804 1,246,170 311,000
Suburban VA 56,855,867 635,182 90,240
Syracuse, NY 42,680,937 386,500 142,000
Tampa, FL 80,044,666 28,500 702,672
Tucson, AZ 41,733,267 863,488 159,971
Tulsa, OK 60,180,675 292,500 40,250
p = preliminary
Methodology
Cushman & Wakefi eld’s quarterly estimates are derived from a variety of data sources, including its own proprietary database, and historical data from third party data sources. The market statistics are calculated from a base building inventory made up of industrial properties deemed to be competitive in the local industrial markets. Generally, owner-occupied and federally-owned buildings are not included. Older buildings unfi t for occupancy or ones that require substantial renovation before tenancy are generally not included in the competitive inventory. The inventory is subject to revisions due to resampling. Vacant space is defi ned as space that is available immediately or imminently after the end of the quarter. Sublet space still occupied by the tenant is not counted as available space. The fi gures provided for the current quarter are preliminary, and all information contained in the report is subject to correction of errors and revisions based on additional data received.
Regional Map
WestMidwestSouthNortheast
Jason TolliverHead of Industrial Research, AmericasTel: +1 317.634.6363cushmanwakefi eld.com
Explanation of Terms
Total Inventory: The total amount of industrial space (in buildings of a
predetermined size by market) that can be rented by a third party.
Overall Vacancy Rate: The amount of unoccupied space (new, relet, and
sublet) expressed as a percentage of total inventory.
Absorption: The net change in occupied space between two points in time.
(Total occupied space in the present quarter minus total occupied space from
the previous quarter, quoted on a net, not gross, basis.)
Leasing Activity: The sum of all leases over a period of time. This includes
pre-leasing activity as well as expansions. It does not include renewals.
Overall Weighted Asking Rents: NNN average asking rents weighted by the
amount of available direct and sublease space in industrial properties.
W/D: Warehouse and or distribution properties.
MFG: Manufacturing properties.
About Cushman & Wakefi eld
Cushman & Wakefi eld is a leading global real estate services fi rm that helps clients transform the way people work, shop, and live. Our 43,000 employees in more than 60 countries help investors and occupiers optimize the value of their real estate by combining our global perspective and deep local knowledge with an impressive platform of real estate solutions. Cushman & Wakefi eld is among the largest commercial real estate services fi rms with revenue of $5 billion across core services of agency leasing, asset services, capital markets, facility services (C&W Services), global occupier services, investment & asset management (DTZ Investors), project & development services, tenant representation, and valuation & advisory. To learn more, visit www.cushmanwakefi eld.com or follow @CushWake on Twitter.
Cushman & Wakefi eld Copyright 2016. No warranty or representation, express or implied, is made to the accuracy or completeness of the information contained herein, and same is submitted subject to errors, omissions, change of price, rental or other conditions, withdrawal without notice, and to any special listing conditions imposed by the property owner(s). As applicable, we make no representation as to the condition of the property (or properties) in question.
cushmanwakefield.com | 1
U.S. IndustrialQ3 2016
MARKETBEAT
U.S. INDUSTRIAL
Overall Vacancy
Net Absorption/Rent NNN 4-QTR TRAILING AVERAGE
Market IndicatorsQ3 15 Q3 16 12-Month
Forecast
Overall Vacancy 6.5% 5.6%
Net Absorption 58.0M 74.9M
Under Construction 182.3M 214.5M
Weighted Asking Rent (NNN) $5.30 $5.57
Employment IndicatorsQ3 15 Q3 16 12-Month
Forecast
Total Nonfarm Employment 142.2M 144.6M
Industrial Employment 24.8M 25.2M
Unemployment 5.2% 4.9%
EconomyDespite a series of shocks to the U.S. economy this year and uncertainties surrounding the U.S. presidential election, the fundamentals that drive demand for industrial space remain firmly intact. Important indicators that correlate well with the industrial sector, such as containerized traffic flows, transportation indices and consumer confidence, are still trending in a positive direction. The ever-important employment figures also point to ongoing industrial growth. The U.S. economy added a solid 575,00 jobs over the past three months ending in September, and wage growth is accelerating. The latest trends in the labor markets are consistent with stronger consumer spending as well as housing and construction improvements, all of which bode well for industrial-related leasing.
A bounce-back in the ISM manufacturing index in September should also help allay concerns that growth will stall in the fourth quarter of 2016. The manufacturing index returned to expansion territory, rising 2.1 points to 51.5 at the end of the third quarter. Aside from continued weakness in manufacturing employment, the sub-index readings were generally upbeat. Notably, the new orders component surged 6.0 points to 55.1, which provides some hope that business spending will improve in the fourth quarter. Order backlogs also jumped — another reason for optimism. It is also promising to see the production component move back into expansionary territory (52.8), with 10 of 18 industry sectors reporting growth in production.
Clearly the sector is confronting headwinds. Exporters continue to face a stronger U.S. dollar, global weakness persists, and firms continue to be challenged by elevated inventories which hamper freight movements by ocean, rail and trucking. For five consecutive quarters, elevated inventories have also been a drag on GDP growth. That is the longest stretch since 1957. The ISM customer inventories component climbed to 53.0 in September, its second highest reading of the current expansion. This indicates that inventories remain too high in some places along the supply chain, which will temporarily curb demand for industrial space in certain areas. But all these developments aren’t new challenges; indeed the industrial market has performed remarkably well despite them. Looking forward we still see the positives outweighing the negatives in the industrial market.
Market OverviewU.S. industrial markets absorbed 74.9 million square feet (MSF) of space in the third quarter of 2016, up 29.1% from the third quarter of 2015. This propelled year-to-date net absorption to 212.9 MSF, up 17.9% from the same period a year prior. The industrial sector has now registered 26 consecutive quarters of net occupancy gains. Although 18 markets witnessed over 1 MSF of absorption during Q3 2016, the bulk of leasing activity remained concentrated near port cities, inland distribution hubs, and population centers. Every industrial segment continued in growth mode during the quarter: through the nine months ending in September, logistics-related warehousing has posted 185.6 MSF of net absorption, manufacturing has registered 16.2 MSF of growth, and flex
Source: Cushman & Wakefield Research
Source: BLS
$4.00
$4.50
$5.00
$5.50
-30
-10
10
30
50
70
2011 2012 2013 2014 2015 2016
Net Absorption, MSF Weighted Asking Rent, $ PSF
5.0%
7.0%
9.0%
11.0%
2011 2012 2013 2014 2015 2016
Historical Average = 8.4%
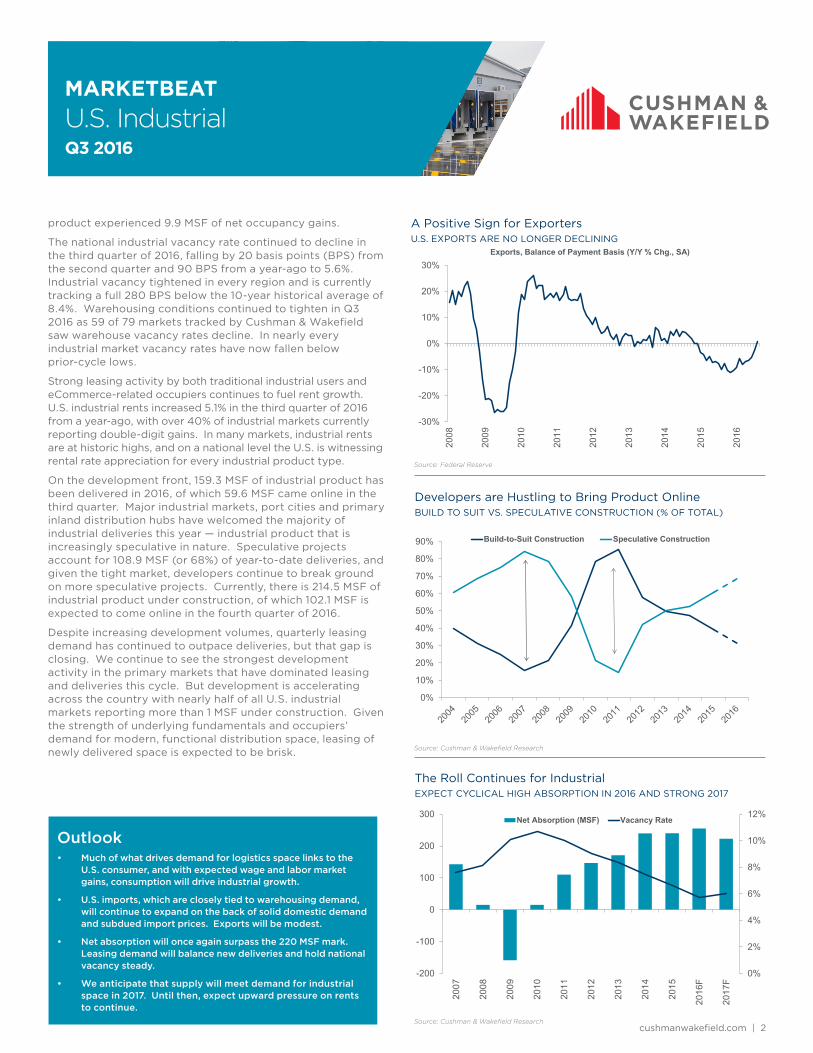
cushmanwakefield.com | 2
U.S. IndustrialQ3 2016
MARKETBEAT
Developers are Hustling to Bring Product Online BUILD TO SUIT VS. SPECULATIVE CONSTRUCTION (% OF TOTAL)
The Roll Continues for Industrial EXPECT CYCLICAL HIGH ABSORPTION IN 2016 AND STRONG 2017
A Positive Sign for Exporters U.S. EXPORTS ARE NO LONGER DECLINING
Outlook• Much of what drives demand for logistics space links to the
U.S. consumer, and with expected wage and labor market gains, consumption will drive industrial growth.
• U.S. imports, which are closely tied to warehousing demand, will continue to expand on the back of solid domestic demand and subdued import prices. Exports will be modest.
• Net absorption will once again surpass the 220 MSF mark. Leasing demand will balance new deliveries and hold national vacancy steady.
• We anticipate that supply will meet demand for industrial space in 2017. Until then, expect upward pressure on rents to continue.
Source: Federal Reserve
Source: Cushman & Wakefield Research
Source: Cushman & Wakefield Research
product experienced 9.9 MSF of net occupancy gains.
The national industrial vacancy rate continued to decline in the third quarter of 2016, falling by 20 basis points (BPS) from the second quarter and 90 BPS from a year-ago to 5.6%. Industrial vacancy tightened in every region and is currently tracking a full 280 BPS below the 10-year historical average of 8.4%. Warehousing conditions continued to tighten in Q3 2016 as 59 of 79 markets tracked by Cushman & Wakefield saw warehouse vacancy rates decline. In nearly every industrial market vacancy rates have now fallen below prior-cycle lows.
Strong leasing activity by both traditional industrial users and eCommerce-related occupiers continues to fuel rent growth. U.S. industrial rents increased 5.1% in the third quarter of 2016 from a year-ago, with over 40% of industrial markets currently reporting double-digit gains. In many markets, industrial rents are at historic highs, and on a national level the U.S. is witnessing rental rate appreciation for every industrial product type.
On the development front, 159.3 MSF of industrial product has been delivered in 2016, of which 59.6 MSF came online in the third quarter. Major industrial markets, port cities and primary inland distribution hubs have welcomed the majority of industrial deliveries this year — industrial product that is increasingly speculative in nature. Speculative projects account for 108.9 MSF (or 68%) of year-to-date deliveries, and given the tight market, developers continue to break ground on more speculative projects. Currently, there is 214.5 MSF of industrial product under construction, of which 102.1 MSF is expected to come online in the fourth quarter of 2016.
Despite increasing development volumes, quarterly leasing demand has continued to outpace deliveries, but that gap is closing. We continue to see the strongest development activity in the primary markets that have dominated leasing and deliveries this cycle. But development is accelerating across the country with nearly half of all U.S. industrial markets reporting more than 1 MSF under construction. Given the strength of underlying fundamentals and occupiers’ demand for modern, functional distribution space, leasing of newly delivered space is expected to be brisk.
0%
10%
20%
30%
40%
50%
60%
70%
80%
90% Build-to-Suit Construction Speculative Construction
-30%
-20%
-10%
0%
10%
20%
30%
2008
2009
2010
2011
2012
2013
2014
2015
2016
Exports, Balance of Payment Basis (Y/Y % Chg., SA)
0%
2%
4%
6%
8%
10%
12%
-200
-100
0
100
200
300
2007
2008
2009
2010
2011
2012
2013
2014
2015
2016
F
2017
F
Net Absorption (MSF) Vacancy Rate

MarketBeat U.S. Q3 2016 cushmanwakefield.com | 3
Net Absorption Leasing Activity
Demand Indicators (Overall) Q3 2015 Q4 2015 Q1 2016 Q2 2016 Q3 2016p Q3 2016p
United States 57,990,810 67,349,408 62,185,362 75,832,135 74,851,732 125,945,554
Northeast 8,613,248 12,344,677 12,839,338 12,022,967 16,626,347 24,894,889
Midwest 15,436,849 12,898,159 12,406,846 15,279,958 23,604,939 21,348,209
South 16,640,923 22,626,849 25,197,809 23,123,902 20,701,692 37,301,226
West 17,299,790 19,479,723 11,741,369 25,405,308 13,918,754 42,401,230
U.S. Industrial Report Markets Q3 2015 Q4 2015 Q1 2016 Q2 2016 Q3 2016p Q3 2016p
Atlanta, GA 2,024,104 3,787,196 3,665,803 3,730,462 2,212,205 7,383,701
Austin, TX 535,220 385,165 171,666 242,070 80,659 470,958
Baltimore, MD 515,020 273,161 1,611,283 506,425 1,029,640 2,619,155
Binghamton, NY 47,200 -176,074 35,384 117,480 117,480 130,826
Birmingham, AL -8,894 -176,074 108,076 403,623 826,217 128,815
Boston, MA -564,925 2,704,991 -247,193 851,845 2,485,635 1,247,619
Buffalo, NY n/a n/a -276,271 136,985 500,257 155,732
Charleston, SC -671,776 870,931 647,674 402,519 831,567 804,785
Charlotte, NC 44,315 275,502 -326,334 2,060,434 935,694 1,802,889
Chicago, IL 5,537,960 3,181,601 2,698,851 6,006,916 10,016,494 8,067,389
Cincinnati, OH 1,085,966 1,050,450 849,734 1,793,770 1,693,178 1,318,395
Cleveland, OH 264,832 680,698 962,071 -36,295 331,032 428,536
Colorado Springs, CO 197,926 168,596 352,165 211,443 n/a 104,005
Columbus, OH 316,303 958,752 1,381,183 180,470 1,349,355 1,684,084
Dallas/Ft. Worth, TX 1,344,169 5,158,085 6,652,163 5,062,495 7,763,907 7,556,865
Dayton, OH 909,642 416,061 564,858 336,924 552,184 381,278
Denver, CO 748,877 -438,786 73,814 1,478,592 163,723 1,061,689
Detroit, MI 2,527,064 2,281,673 2,284,855 1,250,999 769,656 1,342,533
East Bay, CA 360,593 1,080,889 -109,633 2,908,795 -144,738 4,073,936
El Paso, TX 683,500 390,000 1,576,642 712,193 -293,711 257,861
Fort Myers/Naples, FL 44,970 161,561 140,362 354,599 230,115 166,005
Fredericksburg, VA 53,029 -21,638 -76 70,112 170,419 66,727
Ft. Lauderdale, FL 482,672 51,158 750,090 570,142 511,427 508,890
Greenville, SC 1,108,045 866,914 830,107 3,131,610 1,560,194 604,526
Hampton Roads, VA 579,468 -21,546 -204,133 407,321 28,648 599,378
Hartford, CT 146,502 -196,297 -161,857 186,593 866,772 1,217,217
Houston, TX 2,062,877 243,707 1,477,233 -267,093 111,061 4,066,869
Indianapolis, IN 1,571,505 1,620,767 881,633 2,720,089 3,349,822 3,849,001
Inland Empire CA 3,778,078 6,018,135 3,354,969 8,375,828 3,804,033 7,735,438
Jacksonville, FL 782,236 1,314,626 1,023,149 604,465 296,244 890,133
Kansas City, MO 1,032,936 919,847 773,318 1,775,923 1,134,989 1,922,159
Lakeland, FL 171,050 131,220 247,320 78,085 179,091 131,752
Las Vegas, NV 767,457 411,294 789,986 444,432 667,316 n/a
Long Island, NY -653,171 247,509 434,777 102,586 232,379 934,171
Los Angeles, CA 3,591,968 2,184,513 2,251,117 2,651,195 1,503,682 8,267,830
Louisville, KY 1,380,064 1,292,708 928,800 1,599,711 478,317 1,711,900
Memphis, TN 2,186,850 1,542,588 1,690,863 341,427 695,753 2,171,394
Miami, FL 278,677 549,178 1,244,887 241,954 712,127 892,383
Milwaukee, WI 144,626 546,891 885,374 743,340 585,596 1,102,221
Minneapolis, MN 1,646,823 671,568 1,041,300 403,691 459,794 n/a
Demand Indicators

MarketBeat U.S. Q3 2016 cushmanwakefield.com | 4
Net Absorption Leasing Activity
Demand Indicators (Overall) Q3 2015 Q4 2015 Q1 2016 Q2 2016 Q3 2016p Q3 2016p
Nashville, TN 1,149,509 3,115,044 368,767 445,274 241,518 687,478
New Haven, CT 242,326 -120,269 27,084 98,418 -169,623 872,179
New Jersey - Central 2,889,095 2,797,263 5,857,597 2,321,967 1,568,411 4,171,636
New Jersey - Northern 988,107 1,281,402 1,672,285 1,388,969 367,936 2,554,459
Oklahoma City, OK -91,810 -249,225 366,886 355,395 79,041 n/a
Omaha, NE 100,304 -67,189 -18,265 50,348 87,731 494,780
Orange County, CA 673,150 554,044 395,017 470,515 166,260 2,636,774
Orlando, FL 987,678 393,499 736,721 820,417 404,180 1,104,005
Palm Beach County, FL 159,760 277,198 378,706 349,274 321,054 94,310
PA I-81/I-78 Distribution Corridor 3,888,287 2,109,790 2,747,713 3,631,632 7,155,768 8,634,585
Philadelphia, PA 2,044,302 1,852,105 1,696,743 1,060,782 3,631,433 3,945,206
Phoenix, AZ 821,688 4,027,249 1,386,180 2,196,394 2,244,605 7,200,347
Pittsburgh, PA -25,911 1,189,636 873,111 991,907 -209,506 409,491
Portland, OR 919,682 3,128,684 439,415 978,437 308,442 1,476,673
Providence, RI n/a n/a 133,493 254,742 115,966 115,966
Puget Sound - Eastside 189,875 213,643 -118,429 1,322,354 256,769 589,999
Raleigh/Durham, NC -24,322 847,787 108,522 283,535 -172,912 489,149
Richmond, VA -88,609 -197,984 547,939 338,680 -81,087 180,709
Roanoke, VA 53,300 239,271 -106,122 63,011 -70,667 46,406
Rochester, NY -386,210 338,920 69,576 801,031 225,539 14,700
Sacramento, CA 1,163,411 -134,622 304,430 734,847 582,097 1,219,630
Salt Lake City, UT 977,388 512,920 410,524 612,166 763,231 1,678,706
San Antonio, TX -64,086 304,981 147,891 84,870 378,273 323,357
San Diego, CA 1,072,702 677,427 -236,360 374,520 -100,709 1,833,911
San Francisco North Bay, CA 389,837 73,004 17,284 5,328 159,067 326,339
San Francisco Peninsula, CA 61,178 100,315 230,460 10,890 -212,958 333,435
San Jose (Silicon Valley), CA 365,336 455,549 39,803 494,984 -378,224 965,950
Savannah, GA n/a 610,191 n/a -120,950 48,052 48,052
Seattle, WA 443,811 -737,959 618,628 1,291,209 2,512,682 895,109
Southern New Hampshire -66,015 303,388 233,167 181,794 160,019 386,230
St. Louis, MO 298,888 637,040 101,934 53,783 3,275,108 757,833
St. Petersburg/Clearwater, FL 6,741 20,082 54,945 17,940 -44,662 197,503
Stockton/Tracy, CA 360,593 1,080,889 1,570,362 590,564 645,595 1,840,014
Suburban MD 177,624 107,919 108,423 275,122 517,102 473,481
Suburban VA 122,019 -196,354 271,468 -125,578 293,531 412,640
Syracuse, NY 63,661 12,313 -256,271 -103,764 -422,119 104,872
Tampa, FL 610,082 375,052 68,265 274,654 193,291 409,150
Tucson, AZ 416,240 103,939 -28,363 252,815 977,881 265,450
Tulsa, OK 47,441 -95,054 -90,177 -190,296 235,404 n/a*
Demand Indicators
p = preliminary

MarketBeat U.S. Q3 2016 cushmanwakefield.com | 5
Vacancy Rates
Overall Vacancy Rate Q3 2015 Q4 2015 Q1 2016 Q2 2016 Q3 2016p
United States 6.5% 6.2% 6.1% 5.8% 5.6%
Northeast 7.7% 7.3% 7.2% 6.6% 6.3%
Midwest 6.2% 6.2% 5.9% 5.8% 5.4%
South 7.4% 7.0% 7.1% 6.9% 6.7%
West 5.1% 4.9% 4.6% 4.2% 4.0%
U.S. Industrial Report Markets Q3 2015 Q4 2015 Q1 2016 Q2 2016 Q3 2016p
Atlanta, GA 8.3% 7.9% 8.5% 8.4% 8.6%
Austin, TX 6.9% 6.1% 6.8% 7.7% 7.5%
Baltimore, MD 8.3% 8.3% 7.5% 7.2% 7.0%
Binghamton, NY 11.1% 12.4% 12.2% 11.7% 11.7%
Birmingham, AL 11.7% 12.4% 17.0% 14.4% 9.0%
Boston, MA 8.2% 7.6% 7.7% 7.4% 6.8%
Buffalo, NY 8.7% 8.8% 8.9% 9.0% 8.9%
Charleston, SC 8.6% 7.3% 7.9% 7.7% 6.4%
Charlotte, NC 6.2% 6.0% 6.4% 4.5% 3.8%
Chicago, IL 6.4% 6.4% 6.4% 6.3% 6.1%
Cincinnati, OH 4.4% 4.5% 4.2% 4.0% 4.2%
Cleveland, OH 5.4% 5.3% 5.2% 5.0% 4.9%
Colorado Springs, CO 7.7% 7.9% 6.3% 6.3% 7.3%
Columbus, OH 6.6% 6.5% 6.6% 6.5% 5.9%
Dallas/Ft. Worth, TX 7.7% 7.5% 6.9% 6.9% 6.6%
Dayton, OH 9.4% 9.1% 8.7% 8.6% 8.1%
Denver, CO 4.0% 4.3% 2.7% 3.4% 3.9%
Detroit, MI 5.7% 5.4% 4.8% 4.6% 4.0%
East Bay, CA 3.5% 3.5% 2.9% 2.7% 3.0%
El Paso, TX 12.1% 11.6% 8.7% 6.6% 7.1%
Fort Myers/Naples, FL 6.2% 5.8% 4.6% 3.8% 3.3%
Fredericksburg, VA 12.6% 12.8% 12.3% 10.2% 8.1%
Ft. Lauderdale, FL 6.0% 6.4% 7.1% 6.8% 5.5%
Greenville, SC 7.3% 6.8% 7.4% 6.7% 6.9%
Hampton Roads, VA 6.5% 6.4% 7.0% 6.4% 6.5%
Hartford, CT 12.7% 12.6% 12.9% 12.6% 11.7%
Houston, TX 5.4% 5.5% 6.0% 6.4% 6.7%
Indianapolis, IN 7.6% 7.3% 5.3% 4.9% 3.7%
Inland Empire CA 6.0% 5.7% 5.5% 4.7% 4.7%
Jacksonville, FL 8.8% 8.0% 7.2% 6.5% 6.5%
Kansas City, MO 7.6% 7.4% 7.9% 7.5% 7.5%
Lakeland, FL 4.1% 3.5% 5.0% 5.5% 4.2%
Las Vegas, NV 6.3% 6.8% 5.7% 5.9% 5.8%
Long Island, NY 9.2% 8.3% 7.5% 6.9% 6.5%
Los Angeles, CA 2.7% 2.3% 2.2% 1.6% 1.3%
Louisville, KY 5.6% 4.9% 5.5% 5.4% 6.2%
Memphis, TN 10.6% 9.8% 9.9% 9.7% 9.2%
Miami, FL 6.1% 5.7% 4.9% 4.9% 4.4%
Milwaukee, WI 4.8% 4.7% 4.4% 4.2% 4.0%
Minneapolis, MN 9.7% 9.9% 8.7% 8.5% 8.4%

MarketBeat U.S. Q3 2016 cushmanwakefield.com | 6
Vacancy Rates
Overall Vacancy Rate Q3 2015 Q4 2015 Q1 2016 Q2 2016 Q3 2016p
Nashville, TN 5.4% 4.7% 3.5% 3.5% 3.3%
New Haven, CT 12.7% 12.4% 12.7% 12.4% 12.7%
New Jersey - Central 7.4% 6.1% 5.1% 4.3% 4.3%
New Jersey - Northern 7.0% 6.7% 6.3% 5.7% 5.9%
Oklahoma City, OK 6.2% 6.7% 6.5% 7.2% 6.7%
Omaha, NE 2.7% 3.0% 3.5% 3.1% 3.2%
Orange County, CA 3.0% 2.8% 2.8% 2.3% 2.2%
Orlando, FL 7.5% 7.3% 6.9% 5.8% 5.1%
Palm Beach County, FL 4.9% 4.4% 5.4% 4.4% 3.8%
PA I-81/I-78 Distribution Corridor 5.0% 5.2% 6.6% 5.1% 3.9%
Philadelphia, PA 5.8% 5.6% 5.6% 5.4% 4.9%
Phoenix, AZ 11.1% 10.3% 10.1% 9.6% 9.3%
Pittsburgh, PA 7.2% 6.8% 6.2% 5.6% 6.0%
Portland, OR 5.3% 4.9% 4.8% 4.4% 4.3%
Providence, RI 1.3% 0.8% 0.6% 0.3% 0.2%
Puget Sound - Eastside 6.5% 6.2% 6.9% 5.3% 4.9%
Raleigh/Durham, NC 6.1% 5.0% 6.3% 5.8% 6.2%
Richmond, VA 7.7% 7.9% 8.1% 7.5% 7.2%
Roanoke, VA 8.3% 7.6% 8.3% 8.1% 8.3%
Rochester, NY 11.8% 11.4% 11.3% 10.2% 9.9%
Sacramento, CA 10.5% 10.8% 9.9% 9.4% 8.9%
Salt Lake City, UT 7.2% 7.3% 7.1% 7.0% 7.5%
San Antonio, TX 11.2% 10.4% 10.2% 10.5% 9.3%
San Diego, CA 5.3% 5.0% 5.0% 4.9% 5.1%
San Francisco North Bay, CA 6.5% 6.2% 6.5% 6.5% 5.7%
San Francisco Peninsula, CA 3.6% 3.4% 2.6% 2.8% 2.9%
San Jose (Silicon Valley), CA 4.0% 3.4% 3.0% 2.1% 2.3%
Savannah, GA 5.6% 2.2% 2.2% 2.4% 2.3%
Seattle, WA 4.3% 5.0% 5.8% 4.6% 3.8%
Southern New Hampshire 17.4% 16.2% 16.0% 15.7% 15.3%
St. Louis, MO 6.5% 6.6% 6.9% 7.3% 6.4%
St. Petersburg/Clearwater, FL 5.6% 5.1% 5.5% 5.6% 5.8%
Stockton/Tracy, CA 7.1% 7.1% 7.0% 6.3% 6.2%
Suburban MD 12.2% 12.2% 12.6% 12.7% 11.6%
Suburban VA 11.5% 11.9% 9.0% 9.6% 9.2%
Syracuse, NY 10.9% 10.8% 11.2% 10.3% 11.3%
Tampa, FL 6.7% 6.1% 6.2% 6.1% 5.6%
Tucson, AZ 9.4% 9.2% 9.6% 8.6% 8.1%
Tulsa, OK 8.3% 7.8% 8.0% 7.8% 7.4%
p = preliminary

MarketBeat U.S. Q3 2016 cushmanwakefield.com | 7
Asking Rents
Overall (All Property Types) W/D MFG
Weighted Average Asking Rent Q3 2015 Q4 2015 Q1 2016 Q2 2016 Q3 2016p Q3 2016p
United States $5.30 $5.40 $5.44 $5.49 $5.57 $4.88 $5.11
Northeast $5.60 $5.61 $5.66 $5.83 $6.03 $5.55 $4.52
Midwest $4.30 $4.36 $4.37 $4.40 $4.42 $4.09 $4.31
South $4.96 $5.10 $5.18 $5.23 $5.19 $4.44 $4.17
West $6.83 $7.01 $7.00 $7.10 $7.36 $6.23 $7.55
U.S. Industrial Report Markets Q3 2015 Q4 2015 Q1 2016 Q2 2016 Q3 2016p Q3 2016p
Atlanta, GA $4.20 $4.29 $4.27 $4.22 $4.17 $3.63 $3.45
Austin, TX $9.84 $9.94 $9.72 $9.66 $9.75 $6.96 $7.80
Baltimore, MD $5.40 $5.61 $5.48 $5.57 $5.49 $4.58 n/a
Binghamton, NY $4.83 $4.83 $4.74 $4.81 $4.81 $4.36 $3.50
Birmingham, AL $4.69 $4.58 $3.61 $3.57 $4.70 $4.19 n/a
Boston, MA $5.94 $5.96 $5.86 $6.02 $6.17 $5.67 $5.64
Buffalo, NY $4.13 $4.13 $4.13 $4.13 $4.98 $4.75 $3.95
Charleston, SC $4.67 $4.93 $4.92 $5.16 $5.24 $5.32 $4.63
Charlotte, NC $4.26 $4.24 $4.96 $4.99 $5.34 $4.56 $5.68
Chicago, IL $4.79 $4.85 $4.87 $4.88 $4.79 $4.66 $4.52
Cincinnati, OH $3.81 $3.89 $3.97 $4.01 $3.91 $3.49 $3.63
Cleveland, OH $3.86 $3.87 $3.89 $3.95 $3.88 $3.57 n/a
Colorado Springs, CO $6.92 $6.83 $6.41 $6.56 $6.54 $6.54 n/a
Columbus, OH $3.30 $3.38 $3.35 $3.35 $3.35 $3.35 n/a
Dallas/Ft. Worth, TX $5.00 $5.09 $5.47 $5.16 $4.89 $4.07 $3.97
Dayton, OH $3.19 $3.21 $3.21 $3.22 $3.19 $3.10 $2.90
Denver, CO $7.96 $8.24 $7.71 $7.04 $7.23 $5.98 $8.02
Detroit, MI $4.92 $5.04 $5.15 $5.25 $5.26 $4.70 $4.74
East Bay, CA $6.76 $7.23 $7.76 $7.55 $8.00 $6.99 $8.85
El Paso, TX $3.75 $3.75 $3.90 $3.95 $3.95 $4.00 $3.90
Fort Myers/Naples, FL $6.25 $6.37 $6.36 $6.61 $6.72 $6.43 $6.37
Fredericksburg, VA $5.47 $5.53 $5.72 $5.83 $5.65 $5.82 $4.80
Ft. Lauderdale, FL $7.63 $7.75 $7.84 $7.98 $8.12 $7.38 $7.47
Greenville, SC $3.44 $3.86 $3.44 $3.53 $3.55 $3.55 $3.40
Hampton Roads, VA $4.87 $5.03 $5.06 $5.19 $5.21 $5.02 $4.52
Hartford, CT $4.21 $4.18 $4.22 $4.25 $4.32 $4.44 $3.70
Houston, TX $6.09 $6.05 $6.02 $6.19 $6.12 $6.04 $5.65
Indianapolis, IN $3.93 $3.97 $3.47 $3.50 $3.55 $3.49 $3.41
Inland Empire CA $5.38 $5.75 $5.90 $6.24 $6.58 $6.11 $7.18
Jacksonville, FL $3.91 $4.05 $4.05 $3.99 $4.34 $4.01 $3.23
Kansas City, MO $4.10 $4.14 $4.39 $4.48 $4.51 $3.87 $4.56
Lakeland, FL $4.50 $4.53 $4.63 $4.89 $4.85 $4.73 $4.60
Las Vegas, NV $7.18 $7.19 $7.56 $7.32 $7.68 $6.60 n/a
Long Island, NY $8.87 $8.63 $8.15 $8.25 $8.53 $7.90 $8.93
Los Angeles, CA $7.79 $8.09 $8.26 $8.29 $8.79 $8.41 $8.07
Louisville, KY $3.65 $3.52 $3.61 $3.63 $3.67 $3.59 $3.03
Memphis, TN $2.53 $2.50 $2.35 $2.51 $2.49 $2.28 n/a
Miami, FL $6.95 $7.08 $7.47 $7.23 $7.32 $7.09 $6.04
Milwaukee, WI $4.22 $4.29 $4.39 $4.33 $4.39 $4.01 $4.36
Minneapolis, MN $4.48 $4.63 $4.65 $4.67 $4.78 $4.71 n/a

MarketBeat U.S. Q3 2016 cushmanwakefield.com | 8
Asking Rents
p = preliminary
Overall (All Property Types) W/D MFG
Weighted Average Asking Rent Q3 2015 Q4 2015 Q1 2016 Q2 2016 Q3 2016p Q3 2016p
Nashville, TN $3.94 $4.03 $5.25 $5.35 $5.47 $4.86 $2.65
New Haven, CT $5.08 $5.23 $5.18 $5.20 $5.68 $5.20 $5.22
New Jersey - Central $5.82 $6.06 $6.59 $6.97 $7.18 $6.07 $3.39
New Jersey - Northern $6.92 $7.03 $7.42 $7.71 $7.71 $7.15 $6.24
Oklahoma City, OK $4.03 $4.00 $4.21 $4.57 $4.65 $3.88 $2.50
Omaha, NE $5.34 $5.28 $5.83 $5.22 $5.55 $5.10 $5.10
Orange County, CA $9.42 $9.62 $9.76 $10.44 $10.91 $8.68 $11.70
Orlando, FL $6.25 $6.36 $6.51 $6.65 $6.45 $5.29 $6.14
Palm Beach County, FL $7.79 $7.93 $9.30 $9.35 $9.64 $8.49 $7.10
PA I-81/I-78 Distribution Corridor $4.07 $4.31 $4.35 $4.57 $4.53 $4.51 $3.50
Philadelphia, PA $4.76 $4.70 $4.52 $4.52 $4.65 $4.24 $3.75
Phoenix, AZ $6.14 $6.29 $6.26 $6.43 $6.54 $4.77 $7.27
Pittsburgh, PA $5.69 $5.74 $7.21 $7.70 $7.72 $4.80 $4.62
Portland, OR $6.47 $6.72 $7.07 $7.22 $7.62 $6.42 $6.14
Providence, RI $4.85 $4.85 $4.85 $4.85 $4.85 $4.70 n/a
Puget Sound - Eastside $9.22 $9.84 $9.89 $10.89 $11.24 $9.64 $6.54
Raleigh/Durham, NC $7.24 $7.77 $7.39 $7.98 $7.05 $5.65 $5.48
Richmond, VA $4.43 $4.43 $4.41 $4.34 $4.67 $3.91 $3.87
Roanoke, VA $3.93 $4.14 $4.23 $4.10 $4.18 $4.13 $4.19
Rochester, NY $4.84 $4.84 $4.84 $4.84 $4.84 $3.25 $4.75
Sacramento, CA $4.65 $4.74 $4.40 $4.39 $4.43 $4.36 $4.85
Salt Lake City, UT $5.16 $5.28 $5.30 $5.40 $5.47 $5.18 $3.96
San Antonio, TX $5.76 $5.74 $5.57 $5.74 $5.78 $4.76 n/a
San Diego, CA $11.40 $11.52 $11.76 $12.12 $12.00 $8.88 $9.84
San Francisco North Bay, CA $10.22 $10.69 $9.74 $9.97 $10.10 $10.10 $11.66
San Francisco Peninsula, CA $12.12 $11.64 $13.09 $13.50 $15.95 $14.01 $21.94
San Jose (Silicon Valley), CA $8.93 $9.84 $9.60 $9.84 $11.88 $8.64 $13.92
Savannah, GA $4.03 $4.22 $4.22 $4.55 $4.79 $4.18 n/a
Seattle, WA $5.94 $5.84 $5.85 $6.04 $6.61 $6.11 $4.10
Southern New Hampshire $5.74 $5.69 $5.73 $6.14 $6.07 $5.54 $5.05
St. Louis, MO $4.21 $4.22 $4.07 $4.14 $4.22 $3.96 $6.87
St. Petersburg/Clearwater, FL $7.23 $7.43 $7.40 $7.61 $7.34 $5.36 $6.11
Stockton/Tracy, CA $3.75 $3.88 $4.18 $4.23 $4.32 $4.20 $4.20
Suburban MD $8.62 $9.20 $9.19 $9.20 $9.43 $8.28 n/a
Suburban VA $8.62 $9.20 $11.14 $10.89 $11.11 $8.97 n/a
Syracuse, NY $3.87 $3.82 $3.56 $3.65 $3.81 $4.28 $2.87
Tampa, FL $5.30 $5.31 $5.42 $5.48 $6.12 $5.31 $3.65
Tucson, AZ $6.39 $6.92 $6.90 $6.80 $6.81 $6.00 $6.22
Tulsa, OK $4.56 $4.52 $4.49 $4.50 $4.52 $4.89 $3.81

MarketBeat U.S. Q3 2016 cushmanwakefield.com | 9
Inventory
Inventory Inventory Deliveries YTD Under Construction as of Q3 2016p
United States 14,044,295,164 159,261,143 214,502,985
Northeast 2,318,000,139 22,867,637 29,373,671
Midwest 3,848,658,406 37,360,796 52,076,536
South 4,034,293,908 57,889,347 90,761,790
West 3,843,342,711 41,143,363 42,290,988
U.S. Industrial Report Markets Inventory Deliveries YTD Under Construction as of Q3 2016p
Atlanta, GA 543,860,764 11,011,545 18,877,589
Austin, TX 45,836,565 573,270 653,635
Baltimore, MD 204,750,042 0 2,317,543
Binghamton, NY 17,674,534 0 0
Birmingham, AL 15,240,259 0 440,000
Boston, MA 344,823,044 1,826,673 861,862
Buffalo, NY 110,618,208 415,000 1,571,630
Charleston, SC 63,862,024 2,321,526 4,023,468
Charlotte, NC 158,284,451 1,168,874 649,337
Chicago, IL 1,165,049,536 12,203,962 18,933,428
Cincinnati, OH 280,358,303 3,966,857 2,198,274
Cleveland, OH 487,312,807 2,109,000 1,546,345
Colorado Springs, CO 34,367,377 n/a n/a
Columbus, OH 246,897,728 4,385,226 3,111,600
Dallas/Ft. Worth, TX 572,491,660 15,719,720 21,745,608
Dayton, OH 112,765,194 406,300 2,411,906
Denver, CO 242,737,305 3,026,990 3,440,675
Detroit, MI 491,044,546 1,084,219 2,351,387
East Bay, CA 199,366,413 3,003,429 556,556
El Paso, TX 51,790,980 445,000 n/a
Fort Myers/Naples, FL 41,143,463 173,965 239,643
Fredericksburg, VA 10,250,597 0 n/a
Ft. Lauderdale, FL 88,289,538 163,419 910,108
Greenville, SC 195,703,177 1,605,000 3,600,000
Hampton Roads, VA 94,944,013 61,000 534,045
Hartford, CT 92,057,251 0 0
Houston, TX 398,217,339 7,590,028 6,836,968
Indianapolis, IN 247,037,923 2,343,869 4,428,137
Inland Empire CA 495,532,371 17,742,804 18,395,253
Jacksonville, FL 104,595,284 814,777 1,418,201
Kansas City, MO 204,155,531 4,539,519 7,759,235
Lakeland, FL 32,528,297 405,060 1,264,036
Las Vegas, NV 108,937,843 1,740,327 1,240,647
Long Island, NY 129,926,108 178,000 569,000
Los Angeles, CA 1,075,836,395 1,553,944 6,195,466
Louisville, KY 141,131,592 4,916,804 6,467,340
Memphis, TN 188,522,906 1,981,513 5,035,152
Miami, FL 152,564,498 1,362,762 4,507,643
Milwaukee, WI 197,466,132 1,295,479 1,098,750
Minneapolis, MN 104,472,070 1,387,759 2,168,800

MarketBeat U.S. Q3 2016 cushmanwakefield.com | 10
Inventory
Inventory Inventory Deliveries YTD Under Construction as of Q3 2016p
Nashville, TN 131,970,543 239,203 924,697
New Haven, CT 48,566,293 0 80,500
New Jersey - Central 334,145,825 2,826,828 6,567,422
New Jersey - Northern 289,076,403 336,708 1,376,765
Oklahoma City, OK 68,540,201 445,666 59,000
Omaha, NE 68,634,237 441,707 1,025,661
Orange County, CA 282,663,728 624,875 222,735
Orlando, FL 109,840,019 632,633 1,799,630
Palm Beach County, FL 39,985,916 329,749 635,760
PA I-81/I-78 Distribution Corridor 251,873,791 11,960,584 14,430,953
Philadelphia, PA 289,240,195 3,886,702 3,108,508
Phoenix, AZ 304,151,338 4,172,407 2,066,259
Pittsburgh, PA 168,120,151 1,264,642 471,031
Portland, OR 192,613,739 981,408 2,641,548
Providence, RI 77,727,305 n/a n/a
Puget Sound - Eastside 61,057,350 298,378 386,534
Raleigh/Durham, NC 51,272,732 253,350 552,273
Richmond, VA 91,701,177 304,600 216,000
Roanoke, VA 49,848,993 0 250,000
Rochester, NY 73,551,473 0 0
Sacramento, CA 134,076,760 96,152 282,254
Salt Lake City, UT 125,295,336 1,749,201 2,134,476
San Antonio, TX 40,843,302 1,493,721 520,551
San Diego, CA 161,134,604 949,300 635,931
San Francisco North Bay, CA 21,416,354 0 313,020
San Francisco Peninsula, CA 39,821,951 0 0
San Jose (Silicon Valley), CA 83,646,398 111,043 563,760
Savannah, GA 49,047,984 1,785,810 5,022,871
Seattle, WA 140,965,606 2,013,517 1,981,566
Southern New Hampshire 48,001,232 0 0
St. Louis, MO 243,464,399 3,196,899 5,043,013
St. Petersburg/Clearwater, FL 51,393,192 0 341,976
Stockton/Tracy, CA 98,377,416 2,216,100 1,074,337
Suburban MD 48,684,918 1,246,170 311,000
Suburban VA 56,855,867 635,182 90,240
Syracuse, NY 42,598,326 172,500 336,000
Tampa, FL 80,232,940 28,500 365,226
Tucson, AZ 41,344,427 863,488 159,971
Tulsa, OK 60,068,675 180,500 152,250
p = preliminary

Methodology
Cushman & Wakefield’s quarterly estimates are derived from a variety of data sources, including its own proprietary database, and historical data from third party data sources. The market statistics are calculated from a base building inventory made up of industrial properties deemed to be competitive in the local industrial markets. Generally, owner-occupied and federally-owned buildings are not included. Older buildings unfit for occupancy or ones that require substantial renovation before tenancy are generally not included in the competitive inventory. The inventory is subject to revisions due to resampling. Vacant space is defined as space that is available immediately or imminently after the end of the quarter. Sublet space still occupied by the tenant is not counted as available space. The figures provided for the current quarter are preliminary, and all information contained in the report is subject to correction of errors and revisions based on additional data received.
Regional Map
WestMidwestSouthNortheast
Jason Tolliver Head of Industrial Research, Americas Tel: +1 317.634.6363 cushmanwakefield.com
Explanation of Terms
Total Inventory: The total amount of industrial space (in buildings of a
predetermined size by market) that can be rented by a third party.
Overall Vacancy Rate: The amount of unoccupied space (new, relet, and
sublet) expressed as a percentage of total inventory.
Absorption: The net change in occupied space between two points in time.
(Total occupied space in the present quarter minus total occupied space from
the previous quarter, quoted on a net, not gross, basis.)
Leasing Activity: The sum of all leases over a period of time. This includes
pre-leasing activity as well as expansions. It does not include renewals.
Overall Weighted Asking Rents: NNN average asking rents weighted by the
amount of available direct and sublease space in industrial properties.
W/D: Warehouse and or distribution properties.
MFG: Manufacturing properties.
About Cushman & Wakefield
Cushman & Wakefield is a leading global real estate services firm that helps clients transform the way people work, shop, and live. Our 43,000 employees in more than 60 countries help investors and occupiers optimize the value of their real estate by combining our global perspective and deep local knowledge with an impressive platform of real estate solutions. Cushman & Wakefield is among the largest commercial real estate services firms with revenue of $5 billion across core services of agency leasing, asset services, capital markets, facility services (C&W Services), global occupier services, investment & asset management (DTZ Investors), project & development services, tenant representation, and valuation & advisory. To learn more, visit www.cushmanwakefield.com or follow @CushWake on Twitter.
Cushman & Wakefield Copyright 2016. No warranty or representation, express or implied, is made to the accuracy or completeness of the information contained herein, and same is submitted subject to errors, omissions, change of price, rental or other conditions, withdrawal without notice, and to any special listing conditions imposed by the property owner(s). As applicable, we make no representation as to the condition of the property (or properties) in question.
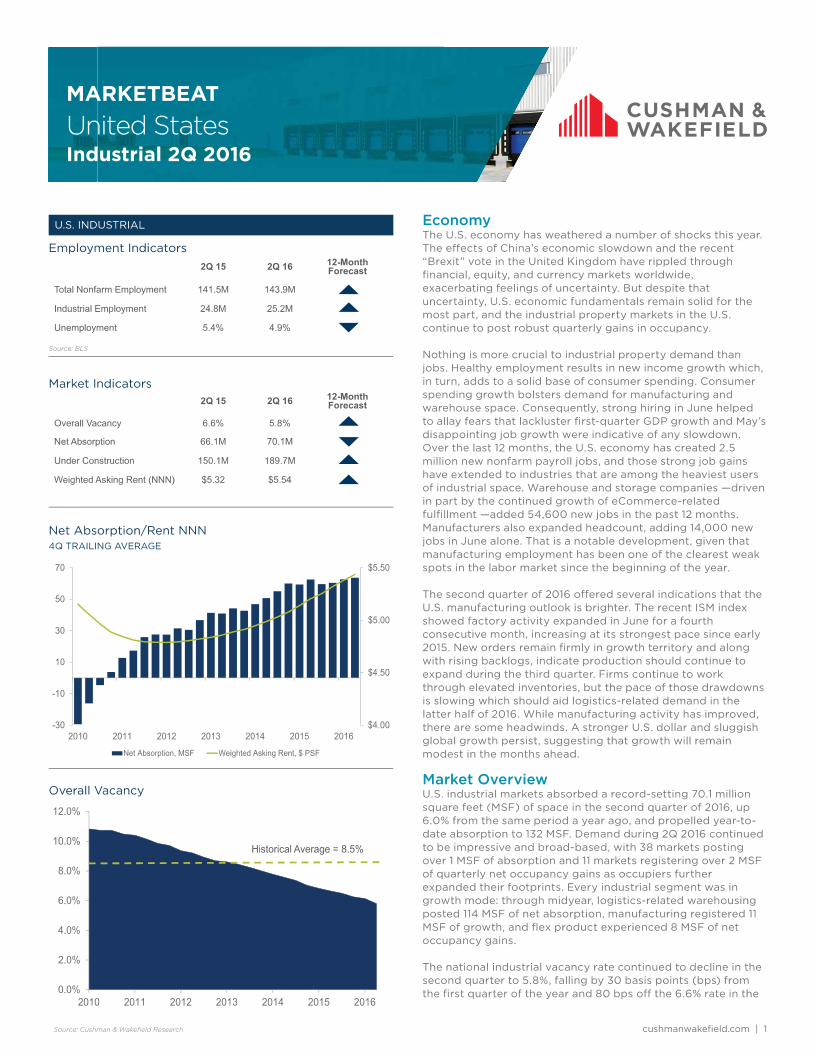
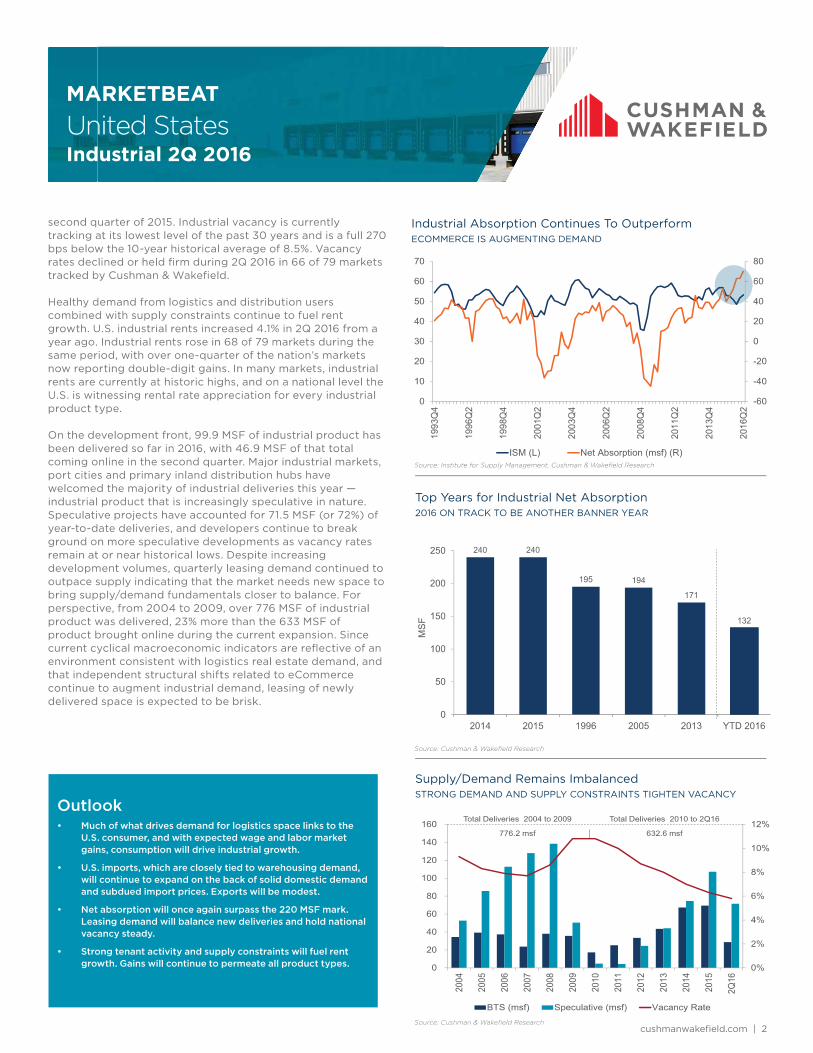


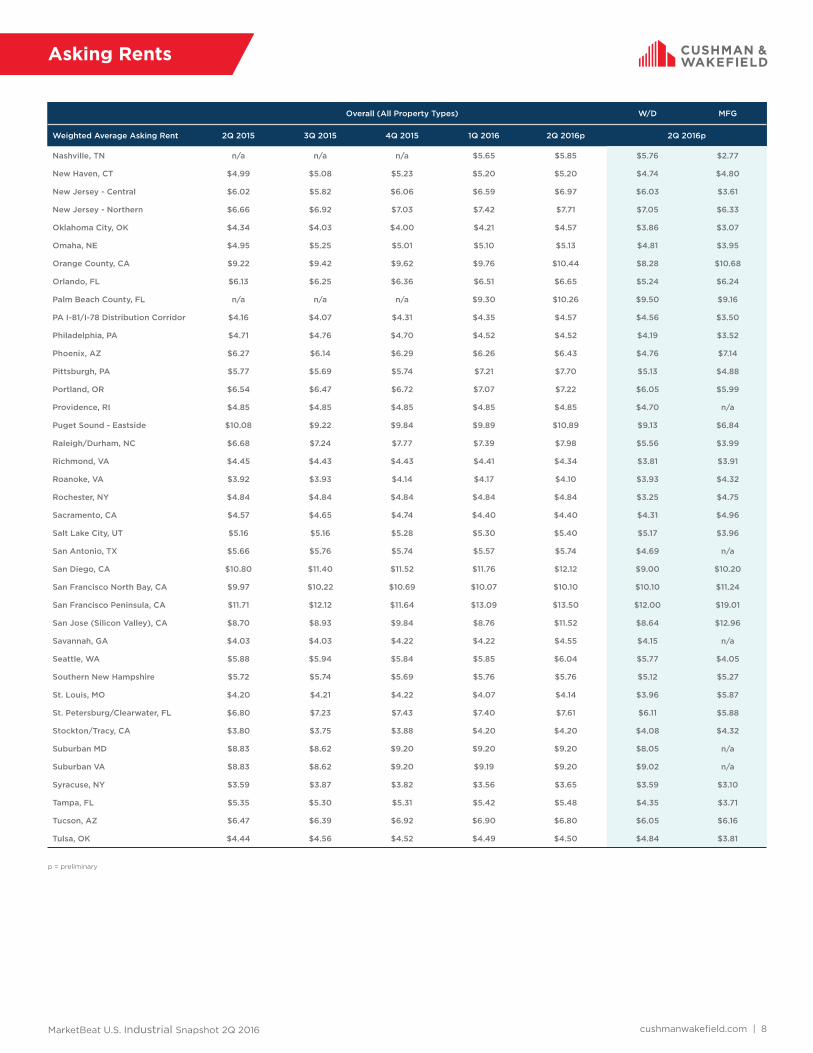


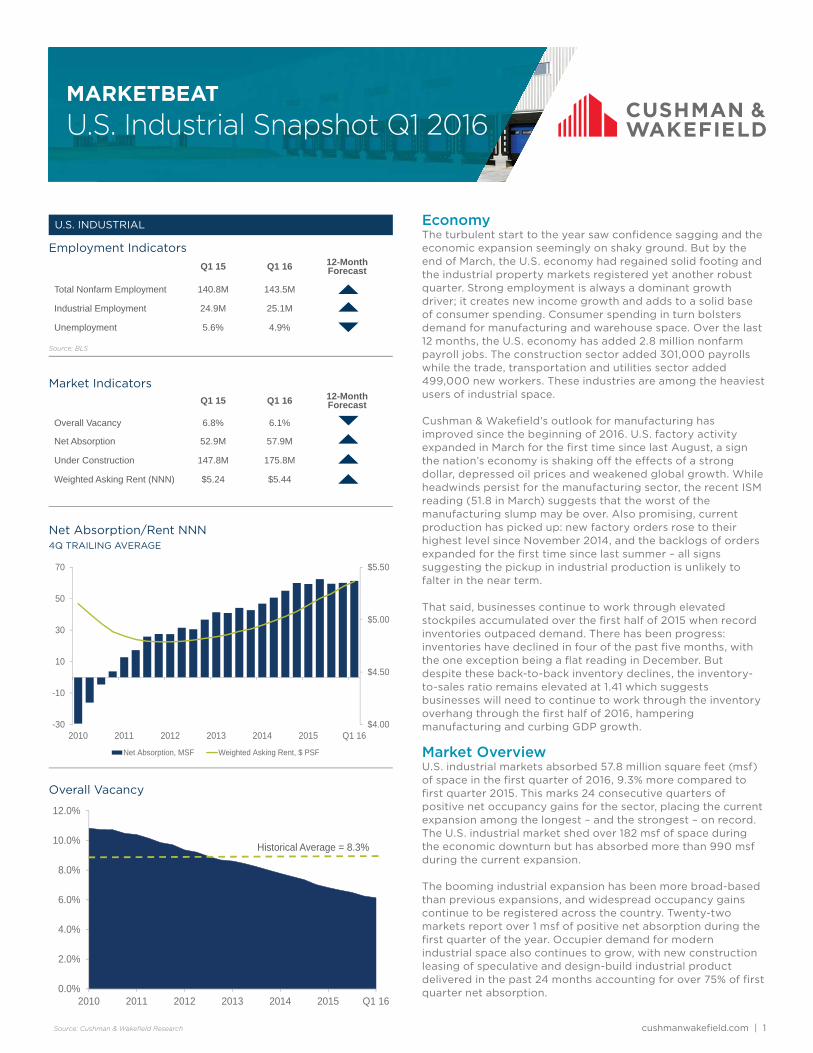
U.S. Industrial Snapshot Q1 2016MARKETBEAT
cushmanwakefi eld.com | 1
U.S. INDUSTRIAL
Overall Vacancy
Net Absorption/Rent NNN4Q TRAILING AVERAGE
Market IndicatorsQ1 15 Q1 16 12-Month
Forecast
Overall Vacancy 6.8% 6.1%
Net Absorption 52.9M 57.9M
Under Construction 147.8M 175.8M
Weighted Asking Rent (NNN) $5.24 $5.44
Employment IndicatorsQ1 15 Q1 16 12-Month
Forecast
Total Nonfarm Employment 140.8M 143.5M
Industrial Employment 24.9M 25.1M
Unemployment 5.6% 4.9%
$4.00
$4.50
$5.00
$5.50
-30
-10
10
30
50
70
2010 2011 2012 2013 2014 2015 Q1 16
Net Absorption, MSF Weighted Asking Rent, $ PSF
0.0%
2.0%
4.0%
6.0%
8.0%
10.0%
12.0%
2010 2011 2012 2013 2014 2015 Q1 16
Historical Average = 8.3%
EconomyThe turbulent start to the year saw confi dence sagging and the economic expansion seemingly on shaky ground. But by the end of March, the U.S. economy had regained solid footing and the industrial property markets registered yet another robust quarter. Strong employment is always a dominant growth driver; it creates new income growth and adds to a solid base of consumer spending. Consumer spending in turn bolsters demand for manufacturing and warehouse space. Over the last 12 months, the U.S. economy has added 2.8 million nonfarm payroll jobs. The construction sector added 301,000 payrolls while the trade, transportation and utilities sector added 499,000 new workers. These industries are among the heaviest users of industrial space.
Cushman & Wakefi eld’s outlook for manufacturing has improved since the beginning of 2016. U.S. factory activity expanded in March for the fi rst time since last August, a sign the nation’s economy is shaking off the eff ects of a strong dollar, depressed oil prices and weakened global growth. While headwinds persist for the manufacturing sector, the recent ISM reading (51.8 in March) suggests that the worst of the manufacturing slump may be over. Also promising, current production has picked up: new factory orders rose to their highest level since November 2014, and the backlogs of orders expanded for the fi rst time since last summer – all signs suggesting the pickup in industrial production is unlikely to falter in the near term.
That said, businesses continue to work through elevated stockpiles accumulated over the fi rst half of 2015 when record inventories outpaced demand. There has been progress: inventories have declined in four of the past fi ve months, with the one exception being a fl at reading in December. But despite these back-to-back inventory declines, the inventory-to-sales ratio remains elevated at 1.41 which suggests businesses will need to continue to work through the inventory overhang through the fi rst half of 2016, hampering manufacturing and curbing GDP growth.
Market OverviewU.S. industrial markets absorbed 57.8 million square feet (msf) of space in the fi rst quarter of 2016, 9.3% more compared to fi rst quarter 2015. This marks 24 consecutive quarters of positive net occupancy gains for the sector, placing the current expansion among the longest – and the strongest – on record. The U.S. industrial market shed over 182 msf of space during the economic downturn but has absorbed more than 990 msf during the current expansion.
The booming industrial expansion has been more broad-based than previous expansions, and widespread occupancy gains continue to be registered across the country. Twenty-two markets report over 1 msf of positive net absorption during the fi rst quarter of the year. Occupier demand for modern industrial space also continues to grow, with new construction leasing of speculative and design-build industrial product delivered in the past 24 months accounting for over 75% of fi rst quarter net absorption.
Source: Cushman & Wakefi eld Research
Source: BLS

U.S. Industrial Snapshot Q1 2016MARKETBEAT
cushmanwakefi eld.com | 2
Top Five Years for Industrial Net Absorption2016 IS ON TRACK TO BE ANOTHER STRONG YEAR
Development Trends by Type (% of Total)
SPEC CONSTRUCTION IS CONTROLLED BUT GROWING
E-commerce SalesGROWTH OF ONLINE SALES IS A BOON FOR INDUSTRIAL
240 240
195 194
171
220
0
50
100
150
200
250
2014 2015 1996 2005 2013 2016
Q1 16
0%
3%
6%
9%
12%
15%
18%
2005
2006
2007
2008
2009
2010
2011
2012
2013
2014
2015
2016
2017
2018
2019
2020
$0
$100
$200
$300
$400
$500
$600
Total E-commerce $ (mill)
0%
30%
60%
90%
2004
2005
2006
2007
2008
2009
2010
2011
2012
2013
2014
2015
2016
BTS Speculative
Outlook• The demand drivers for industrial remain fi rmly intact. Much
of what drives demand for industrial space links to the U.S. consumer, and with expected wage and labor market gains, the consumer will have the wherewithal to drive growth.
• U.S. imports, which are closely tied to warehousing demand, will continue expanding in 2016 on the back of solid domestic demand and subdued import prices. Exports will rebound modestly.
• Expect 2016 to be another year where net absorption passes the 200 msf mark. Leasing demand will balance new deliveries and hold national vacancy steady.
• Rent growth is expected to drive value in 2016. Gains will continue to permeate all product types but will be most pronounced for product located in supply constrained infi ll locations.
The national industrial vacancy rate continued to decline in the fi rst quarter, falling by 20 basis points (bps) from the prior quarter and 70 bps from the prior year to 6.1%. Industrial vacancy is currently tracking at its lowest level of the past 30 years and is now a full 220 bps below its 10-year historical average. Vacancy rates declined or held fi rm during the quarter in 44 of the 79 markets tracked by Cushman & Wakefi eld. Strong leasing fundamentals have also driven vacancies for each industrial product lower than at any point in the last cycle.
The shopping fulfi llment channel migration, to e-commerce, continues to support fundamentals by giving rise to net new users of industrial space. Over the past three years, e-commerce related tenant requirements have accounted for more than 40% of industrial net absorption. With e-commerce sales growing fi ve times faster than overall retail sales, there is expected to be signifi cant requirements for new industrial space in the future.
With vacancy at such low levels, there is a lack of functional, modern space on the market, and developers are responding with more speculative construction. In the fi rst quarter, speculative projects under construction totaled 109.9 msf, which comprised 62.5% of the total 175.8 msf currently under construction. Despite this uptick in speculative construction, it remains a controlled development environment and the market is still well below the levels of development observed at the peak of the last cycle. From 2004 to 2009 over 776 msf of industrial product was delivered, 27% more than the 566 msf of product brought online during the current expansion.
U.S. industrial rents increased 3.8% in the fi rst quarter from their year-ago level. Industrial rents increased in 68 of 79 markets tracked by Cushman & Wakefi eld year over year, with over one-fi fth of the markets across the country now registering double-digit gains. In many markets, industrial rents are currently either at their historic highs or quickly approaching them; on a national level we are witnessing rental rate appreciation for every industrial product type.
Source: U.S. Census Bureau
Source: Cushman & Wakefi eld Research
Source: Cushman & Wakefi eld Research
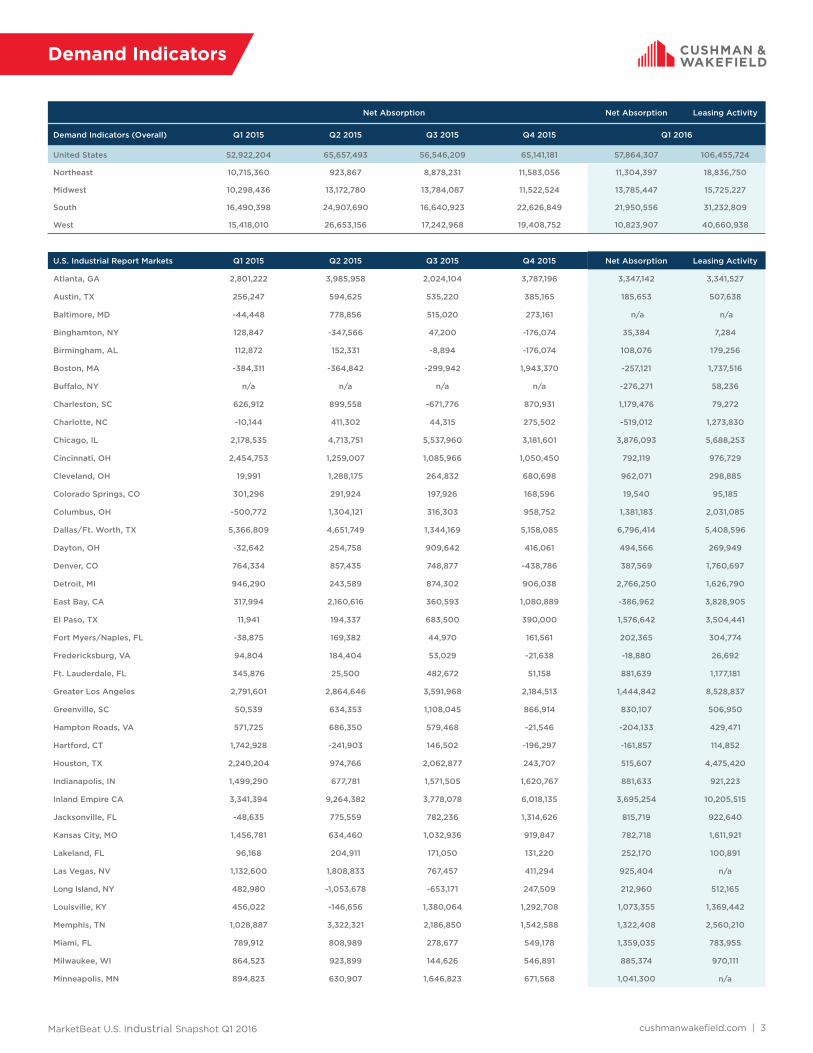
MarketBeat U.S. Industrial Snapshot Q1 2016 cushmanwakefi eld.com | 3
Net Absorption Net Absorption Leasing Activity
Demand Indicators (Overall) Q1 2015 Q2 2015 Q3 2015 Q4 2015 Q1 2016
United States 52,922,204 65,657,493 56,546,209 65,141,181 57,864,307 106,455,724
Northeast 10,715,360 923,867 8,878,231 11,583,056 11,304,397 18,836,750
Midwest 10,298,436 13,172,780 13,784,087 11,522,524 13,785,447 15,725,227
South 16,490,398 24,907,690 16,640,923 22,626,849 21,950,556 31,232,809
West 15,418,010 26,653,156 17,242,968 19,408,752 10,823,907 40,660,938
U.S. Industrial Report Markets Q1 2015 Q2 2015 Q3 2015 Q4 2015 Net Absorption Leasing Activity
Atlanta, GA 2,801,222 3,985,958 2,024,104 3,787,196 3,347,142 3,341,527
Austin, TX 256,247 594,625 535,220 385,165 185,653 507,638
Baltimore, MD -44,448 778,856 515,020 273,161 n/a n/a
Binghamton, NY 128,847 -347,566 47,200 -176,074 35,384 7,284
Birmingham, AL 112,872 152,331 -8,894 -176,074 108,076 179,256
Boston, MA -384,311 -364,842 -299,942 1,943,370 -257,121 1,737,516
Buff alo, NY n/a n/a n/a n/a -276,271 58,236
Charleston, SC 626,912 899,558 -671,776 870,931 1,179,476 79,272
Charlotte, NC -10,144 411,302 44,315 275,502 -519,012 1,273,830
Chicago, IL 2,178,535 4,713,751 5,537,960 3,181,601 3,876,093 5,688,253
Cincinnati, OH 2,454,753 1,259,007 1,085,966 1,050,450 792,119 976,729
Cleveland, OH 19,991 1,288,175 264,832 680,698 962,071 298,885
Colorado Springs, CO 301,296 291,924 197,926 168,596 19,540 95,185
Columbus, OH -500,772 1,304,121 316,303 958,752 1,381,183 2,031,085
Dallas/Ft. Worth, TX 5,366,809 4,651,749 1,344,169 5,158,085 6,796,414 5,408,596
Dayton, OH -32,642 254,758 909,642 416,061 494,566 269,949
Denver, CO 764,334 857,435 748,877 -438,786 387,569 1,760,697
Detroit, MI 946,290 243,589 874,302 906,038 2,766,250 1,626,790
East Bay, CA 317,994 2,160,616 360,593 1,080,889 -386,962 3,828,905
El Paso, TX 11,941 194,337 683,500 390,000 1,576,642 3,504,441
Fort Myers/Naples, FL -38,875 169,382 44,970 161,561 202,365 304,774
Fredericksburg, VA 94,804 184,404 53,029 -21,638 -18,880 26,692
Ft. Lauderdale, FL 345,876 25,500 482,672 51,158 881,639 1,177,181
Greater Los Angeles 2,791,601 2,864,646 3,591,968 2,184,513 1,444,842 8,528,837
Greenville, SC 50,539 634,353 1,108,045 866,914 830,107 506,950
Hampton Roads, VA 571,725 686,350 579,468 -21,546 -204,133 429,471
Hartford, CT 1,742,928 -241,903 146,502 -196,297 -161,857 114,852
Houston, TX 2,240,204 974,766 2,062,877 243,707 515,607 4,475,420
Indianapolis, IN 1,499,290 677,781 1,571,505 1,620,767 881,633 921,223
Inland Empire CA 3,341,394 9,264,382 3,778,078 6,018,135 3,695,254 10,205,515
Jacksonville, FL -48,635 775,559 782,236 1,314,626 815,719 922,640
Kansas City, MO 1,456,781 634,460 1,032,936 919,847 782,718 1,611,921
Lakeland, FL 96,168 204,911 171,050 131,220 252,170 100,891
Las Vegas, NV 1,132,600 1,808,833 767,457 411,294 925,404 n/a
Long Island, NY 482,980 -1,053,678 -653,171 247,509 212,960 512,165
Louisville, KY 456,022 -146,656 1,380,064 1,292,708 1,073,355 1,369,442
Memphis, TN 1,028,887 3,322,321 2,186,850 1,542,588 1,322,408 2,560,210
Miami, FL 789,912 808,989 278,677 549,178 1,359,035 783,955
Milwaukee, WI 864,523 923,899 144,626 546,891 885,374 970,111
Minneapolis, MN 894,823 630,907 1,646,823 671,568 1,041,300 n/a
Demand Indicators
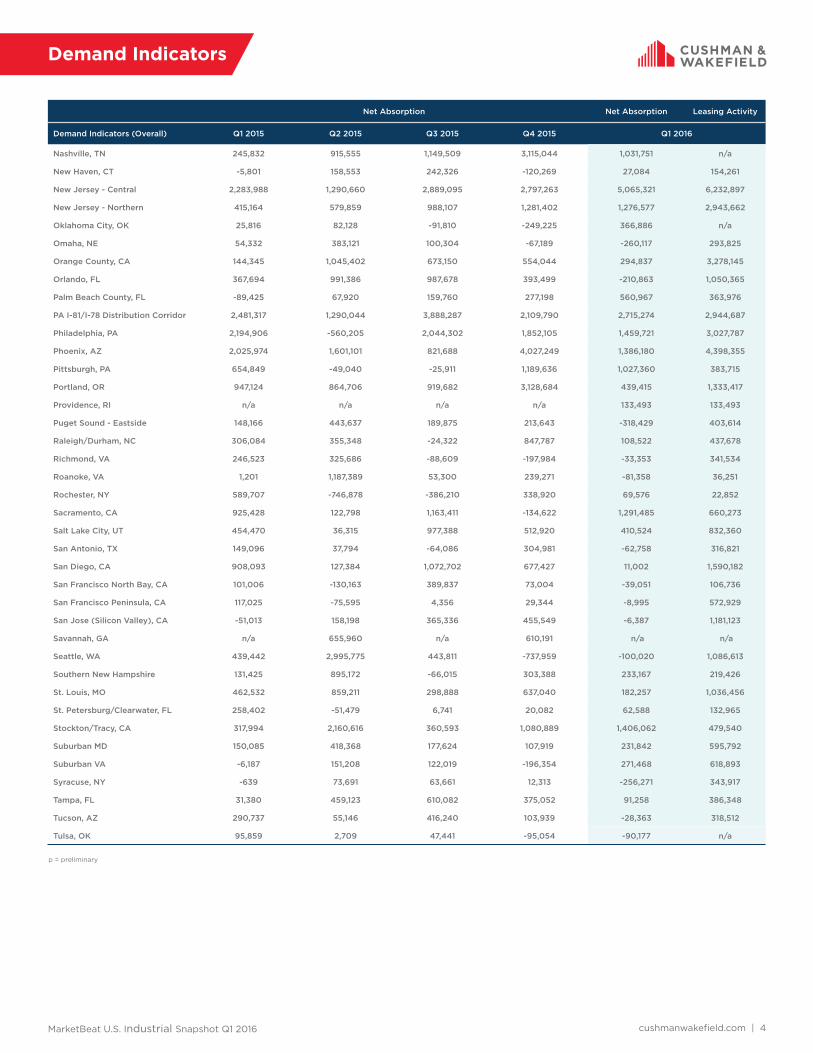
MarketBeat U.S. Industrial Snapshot Q1 2016 cushmanwakefi eld.com | 4
Net Absorption Net Absorption Leasing Activity
Demand Indicators (Overall) Q1 2015 Q2 2015 Q3 2015 Q4 2015 Q1 2016
Nashville, TN 245,832 915,555 1,149,509 3,115,044 1,031,751 n/a
New Haven, CT -5,801 158,553 242,326 -120,269 27,084 154,261
New Jersey - Central 2,283,988 1,290,660 2,889,095 2,797,263 5,065,321 6,232,897
New Jersey - Northern 415,164 579,859 988,107 1,281,402 1,276,577 2,943,662
Oklahoma City, OK 25,816 82,128 -91,810 -249,225 366,886 n/a
Omaha, NE 54,332 383,121 100,304 -67,189 -260,117 293,825
Orange County, CA 144,345 1,045,402 673,150 554,044 294,837 3,278,145
Orlando, FL 367,694 991,386 987,678 393,499 -210,863 1,050,365
Palm Beach County, FL -89,425 67,920 159,760 277,198 560,967 363,976
PA I-81/I-78 Distribution Corridor 2,481,317 1,290,044 3,888,287 2,109,790 2,715,274 2,944,687
Philadelphia, PA 2,194,906 -560,205 2,044,302 1,852,105 1,459,721 3,027,787
Phoenix, AZ 2,025,974 1,601,101 821,688 4,027,249 1,386,180 4,398,355
Pittsburgh, PA 654,849 -49,040 -25,911 1,189,636 1,027,360 383,715
Portland, OR 947,124 864,706 919,682 3,128,684 439,415 1,333,417
Providence, RI n/a n/a n/a n/a 133,493 133,493
Puget Sound - Eastside 148,166 443,637 189,875 213,643 -318,429 403,614
Raleigh/Durham, NC 306,084 355,348 -24,322 847,787 108,522 437,678
Richmond, VA 246,523 325,686 -88,609 -197,984 -33,353 341,534
Roanoke, VA 1,201 1,187,389 53,300 239,271 -81,358 36,251
Rochester, NY 589,707 -746,878 -386,210 338,920 69,576 22,852
Sacramento, CA 925,428 122,798 1,163,411 -134,622 1,291,485 660,273
Salt Lake City, UT 454,470 36,315 977,388 512,920 410,524 832,360
San Antonio, TX 149,096 37,794 -64,086 304,981 -62,758 316,821
San Diego, CA 908,093 127,384 1,072,702 677,427 11,002 1,590,182
San Francisco North Bay, CA 101,006 -130,163 389,837 73,004 -39,051 106,736
San Francisco Peninsula, CA 117,025 -75,595 4,356 29,344 -8,995 572,929
San Jose (Silicon Valley), CA -51,013 158,198 365,336 455,549 -6,387 1,181,123
Savannah, GA n/a 655,960 n/a 610,191 n/a n/a
Seattle, WA 439,442 2,995,775 443,811 -737,959 -100,020 1,086,613
Southern New Hampshire 131,425 895,172 -66,015 303,388 233,167 219,426
St. Louis, MO 462,532 859,211 298,888 637,040 182,257 1,036,456
St. Petersburg/Clearwater, FL 258,402 -51,479 6,741 20,082 62,588 132,965
Stockton/Tracy, CA 317,994 2,160,616 360,593 1,080,889 1,406,062 479,540
Suburban MD 150,085 418,368 177,624 107,919 231,842 595,792
Suburban VA -6,187 151,208 122,019 -196,354 271,468 618,893
Syracuse, NY -639 73,691 63,661 12,313 -256,271 343,917
Tampa, FL 31,380 459,123 610,082 375,052 91,258 386,348
Tucson, AZ 290,737 55,146 416,240 103,939 -28,363 318,512
Tulsa, OK 95,859 2,709 47,441 -95,054 -90,177 n/a
Demand Indicators
p = preliminary
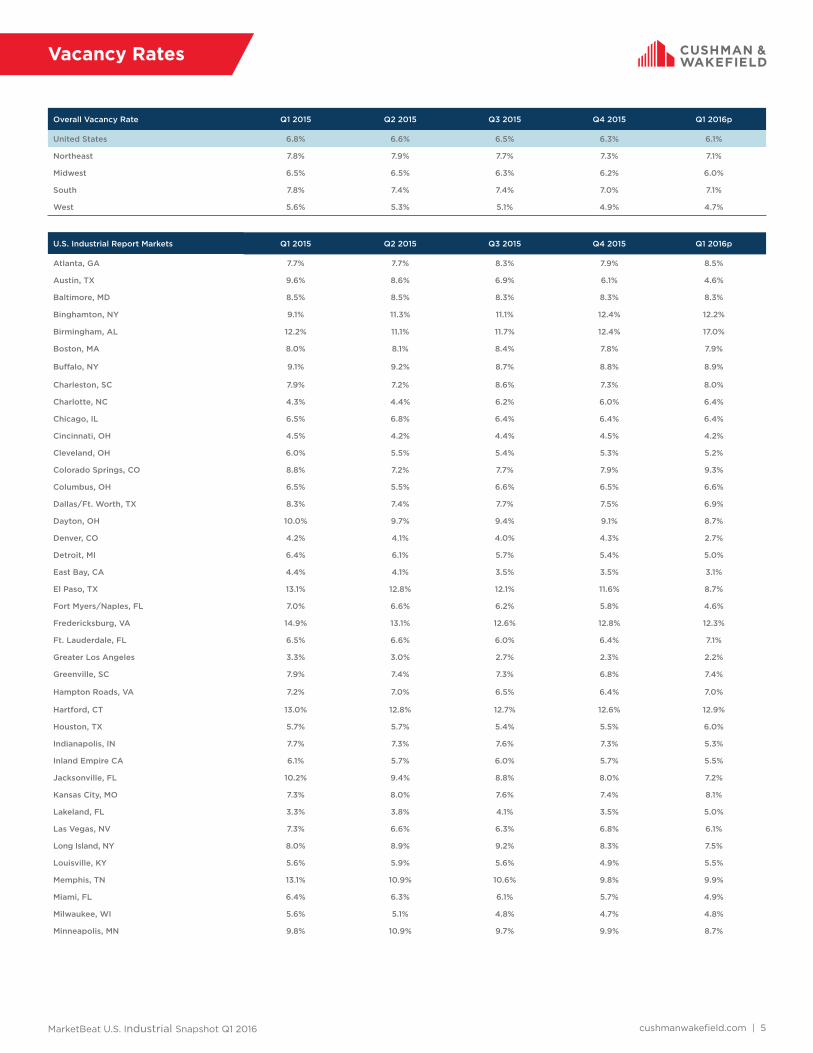
MarketBeat U.S. Industrial Snapshot Q1 2016 cushmanwakefi eld.com | 5
Vacancy Rates
Overall Vacancy Rate Q1 2015 Q2 2015 Q3 2015 Q4 2015 Q1 2016p
United States 6.8% 6.6% 6.5% 6.3% 6.1%
Northeast 7.8% 7.9% 7.7% 7.3% 7.1%
Midwest 6.5% 6.5% 6.3% 6.2% 6.0%
South 7.8% 7.4% 7.4% 7.0% 7.1%
West 5.6% 5.3% 5.1% 4.9% 4.7%
U.S. Industrial Report Markets Q1 2015 Q2 2015 Q3 2015 Q4 2015 Q1 2016p
Atlanta, GA 7.7% 7.7% 8.3% 7.9% 8.5%
Austin, TX 9.6% 8.6% 6.9% 6.1% 4.6%
Baltimore, MD 8.5% 8.5% 8.3% 8.3% 8.3%
Binghamton, NY 9.1% 11.3% 11.1% 12.4% 12.2%
Birmingham, AL 12.2% 11.1% 11.7% 12.4% 17.0%
Boston, MA 8.0% 8.1% 8.4% 7.8% 7.9%
Buff alo, NY 9.1% 9.2% 8.7% 8.8% 8.9%
Charleston, SC 7.9% 7.2% 8.6% 7.3% 8.0%
Charlotte, NC 4.3% 4.4% 6.2% 6.0% 6.4%
Chicago, IL 6.5% 6.8% 6.4% 6.4% 6.4%
Cincinnati, OH 4.5% 4.2% 4.4% 4.5% 4.2%
Cleveland, OH 6.0% 5.5% 5.4% 5.3% 5.2%
Colorado Springs, CO 8.8% 7.2% 7.7% 7.9% 9.3%
Columbus, OH 6.5% 5.5% 6.6% 6.5% 6.6%
Dallas/Ft. Worth, TX 8.3% 7.4% 7.7% 7.5% 6.9%
Dayton, OH 10.0% 9.7% 9.4% 9.1% 8.7%
Denver, CO 4.2% 4.1% 4.0% 4.3% 2.7%
Detroit, MI 6.4% 6.1% 5.7% 5.4% 5.0%
East Bay, CA 4.4% 4.1% 3.5% 3.5% 3.1%
El Paso, TX 13.1% 12.8% 12.1% 11.6% 8.7%
Fort Myers/Naples, FL 7.0% 6.6% 6.2% 5.8% 4.6%
Fredericksburg, VA 14.9% 13.1% 12.6% 12.8% 12.3%
Ft. Lauderdale, FL 6.5% 6.6% 6.0% 6.4% 7.1%
Greater Los Angeles 3.3% 3.0% 2.7% 2.3% 2.2%
Greenville, SC 7.9% 7.4% 7.3% 6.8% 7.4%
Hampton Roads, VA 7.2% 7.0% 6.5% 6.4% 7.0%
Hartford, CT 13.0% 12.8% 12.7% 12.6% 12.9%
Houston, TX 5.7% 5.7% 5.4% 5.5% 6.0%
Indianapolis, IN 7.7% 7.3% 7.6% 7.3% 5.3%
Inland Empire CA 6.1% 5.7% 6.0% 5.7% 5.5%
Jacksonville, FL 10.2% 9.4% 8.8% 8.0% 7.2%
Kansas City, MO 7.3% 8.0% 7.6% 7.4% 8.1%
Lakeland, FL 3.3% 3.8% 4.1% 3.5% 5.0%
Las Vegas, NV 7.3% 6.6% 6.3% 6.8% 6.1%
Long Island, NY 8.0% 8.9% 9.2% 8.3% 7.5%
Louisville, KY 5.6% 5.9% 5.6% 4.9% 5.5%
Memphis, TN 13.1% 10.9% 10.6% 9.8% 9.9%
Miami, FL 6.4% 6.3% 6.1% 5.7% 4.9%
Milwaukee, WI 5.6% 5.1% 4.8% 4.7% 4.8%
Minneapolis, MN 9.8% 10.9% 9.7% 9.9% 8.7%

MarketBeat U.S. Industrial Snapshot Q1 2016 cushmanwakefi eld.com | 6
Vacancy Rates
Overall Vacancy Rate Q1 2015 Q2 2015 Q3 2015 Q4 2015 Q1 2016p
Nashville, TN 6.3% 6.0% 5.4% 4.7% 4.3%
New Haven, CT 13.7% 12.9% 12.7% 12.4% 12.7%
New Jersey - Central 8.4% 8.0% 7.4% 6.1% 5.1%
New Jersey - Northern 7.7% 7.2% 7.0% 6.7% 6.3%
Oklahoma City, OK 6.2% 6.3% 6.2% 6.7% 6.5%
Omaha, NE 2.8% 2.9% 2.7% 3.0% 3.5%
Orange County, CA 3.8% 3.5% 3.0% 2.8% 2.8%
Orlando, FL 8.1% 7.9% 7.5% 7.3% 6.9%
Palm Beach County, FL 5.7% 5.5% 4.9% 4.4% 5.4%
PA I-81/I-78 Distribution Corridor 4.4% 5.4% 5.0% 5.2% 6.6%
Philadelphia, PA 5.3% 6.2% 5.8% 5.6% 5.6%
Phoenix, AZ 11.1% 11.2% 11.1% 10.3% 10.1%
Pittsburgh, PA 7.5% 6.8% 7.2% 6.8% 6.2%
Portland, OR 5.1% 5.3% 5.3% 4.9% 4.8%
Providence, RI 2.0% 1.7% 1.3% 0.8% 0.6%
Puget Sound - Eastside 10.2% 9.5% 6.5% 6.2% 6.9%
Raleigh/Durham, NC 8.1% 7.0% 6.1% 5.0% 6.3%
Richmond, VA 8.0% 7.8% 7.7% 7.9% 8.1%
Roanoke, VA 9.2% 8.4% 8.3% 7.6% 9.6%
Rochester, NY 10.3% 11.3% 11.8% 11.4% 11.3%
Sacramento, CA 10.8% 10.9% 10.5% 10.8% 10.3%
Salt Lake City, UT 6.7% 6.7% 7.2% 7.3% 7.1%
San Antonio, TX 10.5% 11.4% 11.2% 10.4% 10.2%
San Diego, CA 6.0% 5.8% 5.3% 5.0% 5.0%
San Francisco North Bay, CA 7.0% 7.6% 6.5% 6.2% 6.7%
San Francisco Peninsula, CA 3.7% 3.9% 3.9% 3.8% 3.4%
San Jose (Silicon Valley), CA 4.9% 4.5% 4.0% 3.4% 3.2%
Savannah, GA 7.1% 5.6% 5.6% 2.2% 2.2%
Seattle, WA 5.9% 4.8% 4.3% 5.0% 5.8%
Southern New Hampshire 18.3% 17.7% 17.4% 16.2% 16.0%
St. Louis, MO 6.6% 6.7% 6.5% 6.6% 6.9%
St. Petersburg/Clearwater, FL 5.5% 5.7% 5.6% 5.1% 5.5%
Stockton/Tracy, CA 8.6% 6.3% 7.1% 7.1% 7.3%
Suburban MD 11.9% 11.7% 12.2% 12.2% 12.6%
Suburban VA 11.8% 11.7% 11.5% 11.9% 9.0%
Syracuse, NY 11.3% 11.1% 10.9% 10.8% 11.2%
Tampa, FL 7.8% 7.6% 6.7% 6.1% 6.2%
Tucson, AZ 10.2% 10.0% 9.4% 9.2% 9.6%
Tulsa, OK 8.5% 8.3% 8.3% 7.8% 8.0%
p = preliminary

MarketBeat U.S. Industrial Snapshot Q1 2016 cushmanwakefi eld.com | 7
Asking Rents
Overall (All Property Types) Overall (All Property Types) W/D MFG
Weighted Average Asking Rent Q1 2015 Q2 2015 Q3 2015 Q4 2015 Q1 2016
United States $5.24 $5.31 $5.31 $5.40 $5.44 $4.86 $5.04
Northeast $5.49 $5.49 $5.53 $5.53 $5.65 $5.35 $4.41
Midwest $4.11 $4.19 $4.25 $4.31 $4.40 $4.10 $4.14
South $4.94 $5.01 $5.01 $5.13 $5.18 $4.50 $4.14
West $6.69 $6.88 $6.83 $7.02 $6.97 $5.93 $7.29
U.S. Industrial Report Markets Q1 2015 Q2 2015 Q3 2015 Q4 2015 Overall W/D MFG
Atlanta, GA $4.03 $4.20 $4.20 $4.29 $4.27 $3.70 $3.34
Austin, TX $9.36 $9.36 $9.84 $9.94 $9.09 $8.38 n/a
Baltimore, MD $5.40 $5.37 $5.40 $5.61 $5.61 $4.72 n/a
Binghamton, NY $4.65 $4.71 $4.83 $4.83 $4.74 $4.36 $3.60
Birmingham, AL $4.49 $4.67 $4.69 $4.58 $3.61 $3.32 n/a
Boston, MA $5.28 $5.28 $5.40 $5.40 $5.79 $5.53 $5.29
Buff alo, NY $4.13 $4.13 $4.13 $4.13 $4.13 $4.25 $3.95
Charleston, SC $4.45 $4.53 $4.67 $4.93 $4.96 $4.95 $4.76
Charlotte, NC $4.88 $4.23 $4.26 $4.24 $4.96 $4.45 $4.51
Chicago, IL $4.54 $4.64 $4.79 $4.85 $4.87 $4.81 $4.31
Cincinnati, OH $3.76 $3.74 $3.81 $3.89 $3.97 $3.28 $3.74
Cleveland, OH $3.77 $3.78 $3.86 $3.87 $3.89 $3.60 n/a
Colorado Springs, CO $6.40 $6.43 $6.92 $6.83 $6.01 $6.01 n/a
Columbus, OH $3.20 $3.30 $3.30 $3.38 $3.35 $3.35 n/a
Dallas/Ft. Worth, TX $4.97 $5.00 $5.00 $5.09 $5.47 $4.19 $4.06
Dayton, OH $3.07 $3.05 $3.19 $3.21 $3.21 $3.22 $2.91
Denver, CO $7.60 $7.75 $7.96 $8.24 $7.71 $5.57 $8.52
Detroit, MI $4.80 $4.92 $4.92 $5.04 $5.15 $4.56 $4.56
East Bay, CA $6.70 $6.88 $6.76 $7.23 $7.72 $6.48 $9.49
El Paso, TX $3.70 $3.70 $3.75 $3.75 $3.90 $3.95 $3.80
Fort Myers/Naples, FL $5.83 $6.10 $6.25 $6.37 $6.36 $6.03 $6.03
Fredericksburg, VA $5.66 $5.55 $5.47 $5.53 $5.72 $5.87 $5.04
Ft. Lauderdale, FL $7.50 $7.51 $7.63 $7.75 $8.76 $8.32 $8.49
Greater Los Angeles $7.37 $7.69 $7.79 $8.09 $8.26 $7.89 $7.88
Greenville, SC $3.43 $3.40 $3.44 $3.86 $3.44 $3.54 $3.15
Hampton Roads, VA $4.97 $4.96 $4.87 $5.03 $5.05 $4.86 $4.63
Hartford, CT $4.31 $4.28 $4.21 $4.18 $4.31 $4.39 $3.88
Houston, TX $5.68 $6.04 $6.09 $6.05 $6.02 $5.89 $5.16
Indianapolis, IN $3.90 $3.96 $3.93 $3.97 $4.20 $3.78 $4.05
Inland Empire CA $5.19 $5.24 $5.38 $5.75 $5.90 $4.93 $5.87
Jacksonville, FL $3.90 $4.00 $3.91 $4.05 $4.05 $3.57 $2.38
Kansas City, MO $4.01 $4.12 $4.10 $4.14 $4.29 $3.81 $3.79
Lakeland, FL $4.62 $4.64 $4.50 $4.53 $4.63 $4.53 $4.55
Las Vegas, NV $6.73 $7.02 $7.18 $7.19 $7.01 $6.50 n/a
Long Island, NY $8.78 $8.83 $8.87 $8.63 $8.15 $8.00 $7.89
Louisville, KY $3.61 $3.66 $3.65 $3.52 $3.61 $3.51 $3.03
Memphis, TN $2.47 $2.47 $2.53 $2.50 $2.35 $2.14 n/a
Miami, FL $6.42 $6.85 $6.95 $7.08 $7.98 $8.19 $5.56
Milwaukee, WI $4.12 $4.10 $4.22 $4.29 $4.41 $3.95 $4.31
Minneapolis, MN $4.43 $4.33 $4.48 $4.63 $4.65 $4.41 n/a
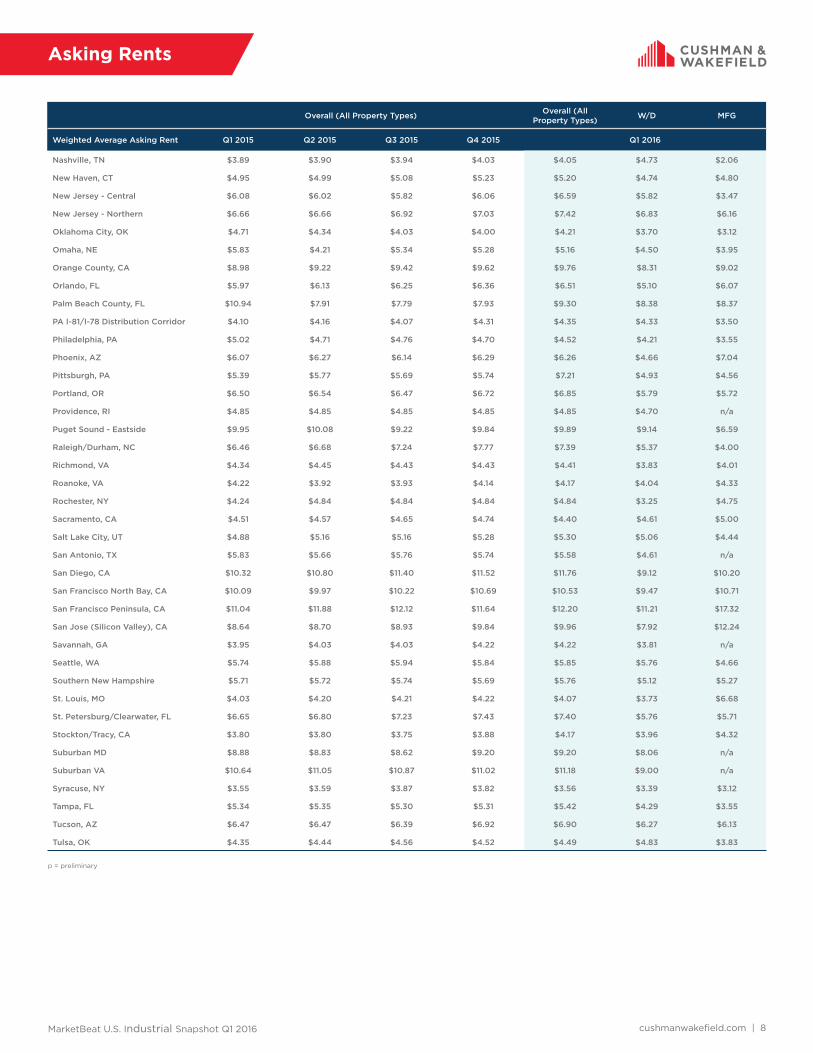
MarketBeat U.S. Industrial Snapshot Q1 2016 cushmanwakefi eld.com | 8
Asking Rents
p = preliminary
Overall (All Property Types) Overall (All Property Types) W/D MFG
Weighted Average Asking Rent Q1 2015 Q2 2015 Q3 2015 Q4 2015 Q1 2016
Nashville, TN $3.89 $3.90 $3.94 $4.03 $4.05 $4.73 $2.06
New Haven, CT $4.95 $4.99 $5.08 $5.23 $5.20 $4.74 $4.80
New Jersey - Central $6.08 $6.02 $5.82 $6.06 $6.59 $5.82 $3.47
New Jersey - Northern $6.66 $6.66 $6.92 $7.03 $7.42 $6.83 $6.16
Oklahoma City, OK $4.71 $4.34 $4.03 $4.00 $4.21 $3.70 $3.12
Omaha, NE $5.83 $4.21 $5.34 $5.28 $5.16 $4.50 $3.95
Orange County, CA $8.98 $9.22 $9.42 $9.62 $9.76 $8.31 $9.02
Orlando, FL $5.97 $6.13 $6.25 $6.36 $6.51 $5.10 $6.07
Palm Beach County, FL $10.94 $7.91 $7.79 $7.93 $9.30 $8.38 $8.37
PA I-81/I-78 Distribution Corridor $4.10 $4.16 $4.07 $4.31 $4.35 $4.33 $3.50
Philadelphia, PA $5.02 $4.71 $4.76 $4.70 $4.52 $4.21 $3.55
Phoenix, AZ $6.07 $6.27 $6.14 $6.29 $6.26 $4.66 $7.04
Pittsburgh, PA $5.39 $5.77 $5.69 $5.74 $7.21 $4.93 $4.56
Portland, OR $6.50 $6.54 $6.47 $6.72 $6.85 $5.79 $5.72
Providence, RI $4.85 $4.85 $4.85 $4.85 $4.85 $4.70 n/a
Puget Sound - Eastside $9.95 $10.08 $9.22 $9.84 $9.89 $9.14 $6.59
Raleigh/Durham, NC $6.46 $6.68 $7.24 $7.77 $7.39 $5.37 $4.00
Richmond, VA $4.34 $4.45 $4.43 $4.43 $4.41 $3.83 $4.01
Roanoke, VA $4.22 $3.92 $3.93 $4.14 $4.17 $4.04 $4.33
Rochester, NY $4.24 $4.84 $4.84 $4.84 $4.84 $3.25 $4.75
Sacramento, CA $4.51 $4.57 $4.65 $4.74 $4.40 $4.61 $5.00
Salt Lake City, UT $4.88 $5.16 $5.16 $5.28 $5.30 $5.06 $4.44
San Antonio, TX $5.83 $5.66 $5.76 $5.74 $5.58 $4.61 n/a
San Diego, CA $10.32 $10.80 $11.40 $11.52 $11.76 $9.12 $10.20
San Francisco North Bay, CA $10.09 $9.97 $10.22 $10.69 $10.53 $9.47 $10.71
San Francisco Peninsula, CA $11.04 $11.88 $12.12 $11.64 $12.20 $11.21 $17.32
San Jose (Silicon Valley), CA $8.64 $8.70 $8.93 $9.84 $9.96 $7.92 $12.24
Savannah, GA $3.95 $4.03 $4.03 $4.22 $4.22 $3.81 n/a
Seattle, WA $5.74 $5.88 $5.94 $5.84 $5.85 $5.76 $4.66
Southern New Hampshire $5.71 $5.72 $5.74 $5.69 $5.76 $5.12 $5.27
St. Louis, MO $4.03 $4.20 $4.21 $4.22 $4.07 $3.73 $6.68
St. Petersburg/Clearwater, FL $6.65 $6.80 $7.23 $7.43 $7.40 $5.76 $5.71
Stockton/Tracy, CA $3.80 $3.80 $3.75 $3.88 $4.17 $3.96 $4.32
Suburban MD $8.88 $8.83 $8.62 $9.20 $9.20 $8.06 n/a
Suburban VA $10.64 $11.05 $10.87 $11.02 $11.18 $9.00 n/a
Syracuse, NY $3.55 $3.59 $3.87 $3.82 $3.56 $3.39 $3.12
Tampa, FL $5.34 $5.35 $5.30 $5.31 $5.42 $4.29 $3.55
Tucson, AZ $6.47 $6.47 $6.39 $6.92 $6.90 $6.27 $6.13
Tulsa, OK $4.35 $4.44 $4.56 $4.52 $4.49 $4.83 $3.83
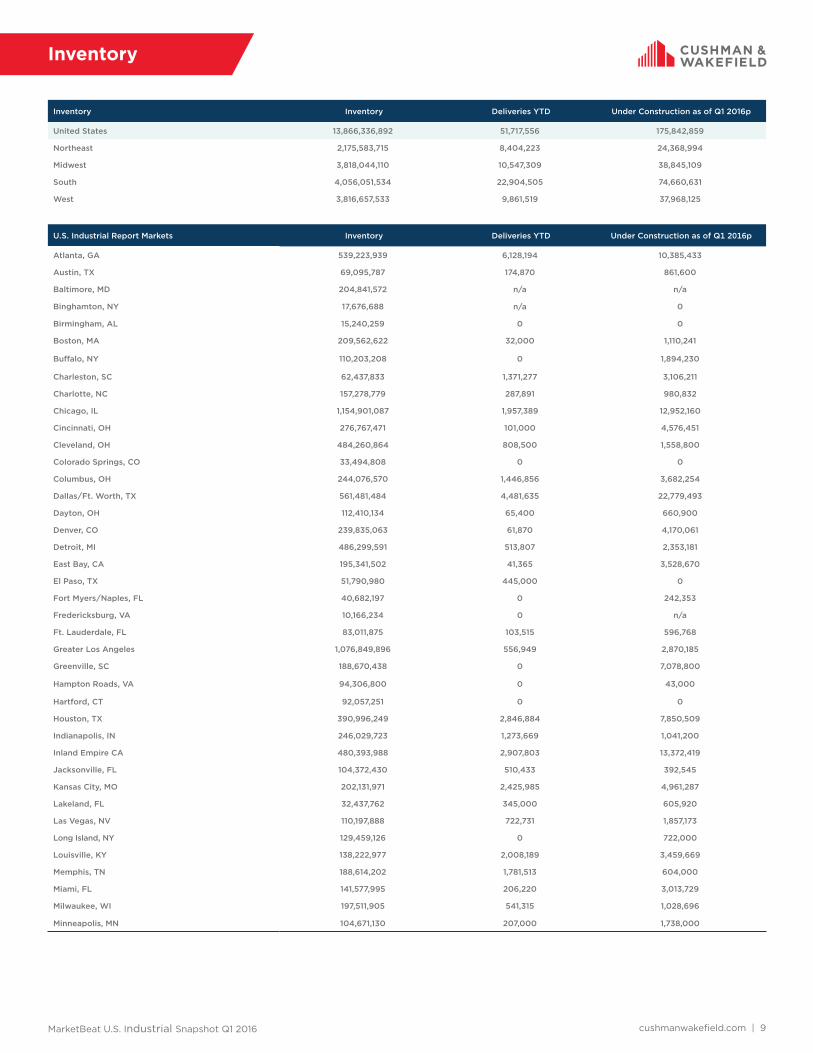
MarketBeat U.S. Industrial Snapshot Q1 2016 cushmanwakefi eld.com | 9
Inventory
Inventory Inventory Deliveries YTD Under Construction as of Q1 2016p
United States 13,866,336,892 51,717,556 175,842,859
Northeast 2,175,583,715 8,404,223 24,368,994
Midwest 3,818,044,110 10,547,309 38,845,109
South 4,056,051,534 22,904,505 74,660,631
West 3,816,657,533 9,861,519 37,968,125
U.S. Industrial Report Markets Inventory Deliveries YTD Under Construction as of Q1 2016p
Atlanta, GA 539,223,939 6,128,194 10,385,433
Austin, TX 69,095,787 174,870 861,600
Baltimore, MD 204,841,572 n/a n/a
Binghamton, NY 17,676,688 n/a 0
Birmingham, AL 15,240,259 0 0
Boston, MA 209,562,622 32,000 1,110,241
Buff alo, NY 110,203,208 0 1,894,230
Charleston, SC 62,437,833 1,371,277 3,106,211
Charlotte, NC 157,278,779 287,891 980,832
Chicago, IL 1,154,901,087 1,957,389 12,952,160
Cincinnati, OH 276,767,471 101,000 4,576,451
Cleveland, OH 484,260,864 808,500 1,558,800
Colorado Springs, CO 33,494,808 0 0
Columbus, OH 244,076,570 1,446,856 3,682,254
Dallas/Ft. Worth, TX 561,481,484 4,481,635 22,779,493
Dayton, OH 112,410,134 65,400 660,900
Denver, CO 239,835,063 61,870 4,170,061
Detroit, MI 486,299,591 513,807 2,353,181
East Bay, CA 195,341,502 41,365 3,528,670
El Paso, TX 51,790,980 445,000 0
Fort Myers/Naples, FL 40,682,197 0 242,353
Fredericksburg, VA 10,166,234 0 n/a
Ft. Lauderdale, FL 83,011,875 103,515 596,768
Greater Los Angeles 1,076,849,896 556,949 2,870,185
Greenville, SC 188,670,438 0 7,078,800
Hampton Roads, VA 94,306,800 0 43,000
Hartford, CT 92,057,251 0 0
Houston, TX 390,996,249 2,846,884 7,850,509
Indianapolis, IN 246,029,723 1,273,669 1,041,200
Inland Empire CA 480,393,988 2,907,803 13,372,419
Jacksonville, FL 104,372,430 510,433 392,545
Kansas City, MO 202,131,971 2,425,985 4,961,287
Lakeland, FL 32,437,762 345,000 605,920
Las Vegas, NV 110,197,888 722,731 1,857,173
Long Island, NY 129,459,126 0 722,000
Louisville, KY 138,222,977 2,008,189 3,459,669
Memphis, TN 188,614,202 1,781,513 604,000
Miami, FL 141,577,995 206,220 3,013,729
Milwaukee, WI 197,511,905 541,315 1,028,696
Minneapolis, MN 104,671,130 207,000 1,738,000
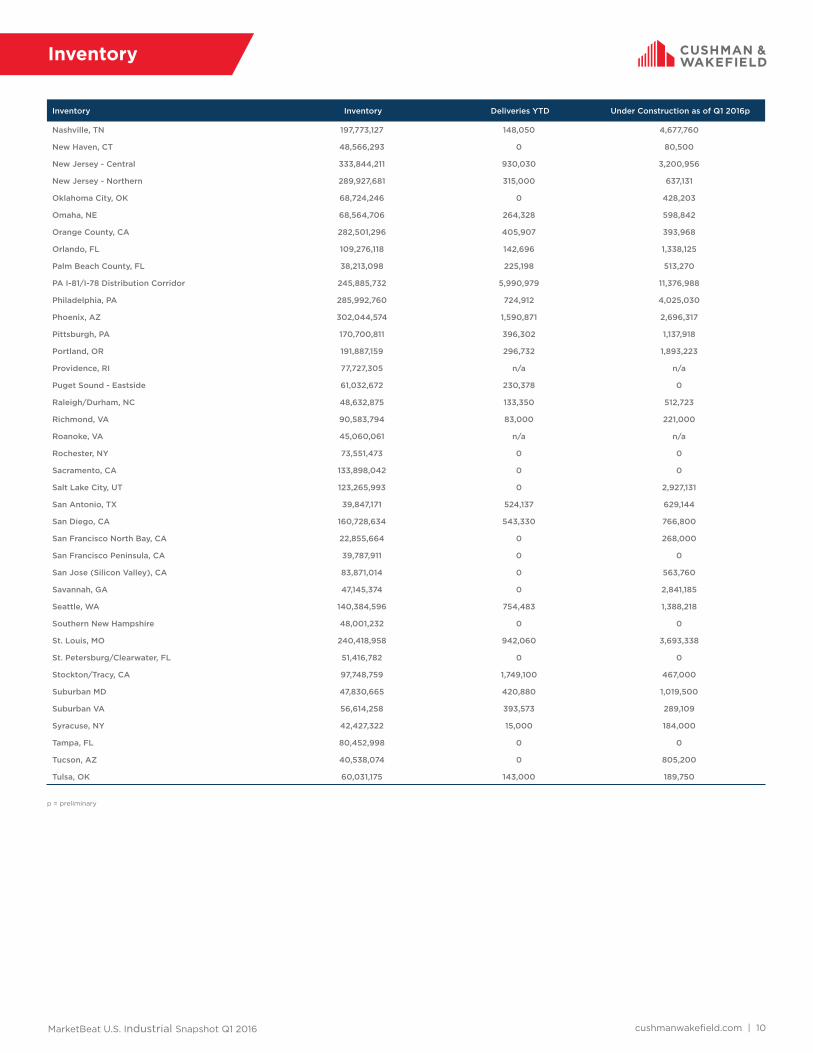
MarketBeat U.S. Industrial Snapshot Q1 2016 cushmanwakefi eld.com | 10
Inventory
Inventory Inventory Deliveries YTD Under Construction as of Q1 2016p
Nashville, TN 197,773,127 148,050 4,677,760
New Haven, CT 48,566,293 0 80,500
New Jersey - Central 333,844,211 930,030 3,200,956
New Jersey - Northern 289,927,681 315,000 637,131
Oklahoma City, OK 68,724,246 0 428,203
Omaha, NE 68,564,706 264,328 598,842
Orange County, CA 282,501,296 405,907 393,968
Orlando, FL 109,276,118 142,696 1,338,125
Palm Beach County, FL 38,213,098 225,198 513,270
PA I-81/I-78 Distribution Corridor 245,885,732 5,990,979 11,376,988
Philadelphia, PA 285,992,760 724,912 4,025,030
Phoenix, AZ 302,044,574 1,590,871 2,696,317
Pittsburgh, PA 170,700,811 396,302 1,137,918
Portland, OR 191,887,159 296,732 1,893,223
Providence, RI 77,727,305 n/a n/a
Puget Sound - Eastside 61,032,672 230,378 0
Raleigh/Durham, NC 48,632,875 133,350 512,723
Richmond, VA 90,583,794 83,000 221,000
Roanoke, VA 45,060,061 n/a n/a
Rochester, NY 73,551,473 0 0
Sacramento, CA 133,898,042 0 0
Salt Lake City, UT 123,265,993 0 2,927,131
San Antonio, TX 39,847,171 524,137 629,144
San Diego, CA 160,728,634 543,330 766,800
San Francisco North Bay, CA 22,855,664 0 268,000
San Francisco Peninsula, CA 39,787,911 0 0
San Jose (Silicon Valley), CA 83,871,014 0 563,760
Savannah, GA 47,145,374 0 2,841,185
Seattle, WA 140,384,596 754,483 1,388,218
Southern New Hampshire 48,001,232 0 0
St. Louis, MO 240,418,958 942,060 3,693,338
St. Petersburg/Clearwater, FL 51,416,782 0 0
Stockton/Tracy, CA 97,748,759 1,749,100 467,000
Suburban MD 47,830,665 420,880 1,019,500
Suburban VA 56,614,258 393,573 289,109
Syracuse, NY 42,427,322 15,000 184,000
Tampa, FL 80,452,998 0 0
Tucson, AZ 40,538,074 0 805,200
Tulsa, OK 60,031,175 143,000 189,750
p = preliminary
About Cushman & Wakefi eld
Cushman & Wakefi eld is a leading global real estate services fi rm that helps clients transform the way people work, shop, and live. The fi rm’s 43,000 employees in more than 60 countries provide deep local and global insights that create signifi cant value for occupiers and investors around the world. Cushman & Wakefi eld is among the largest commercial real estate services fi rms with revenue of $5 billion across core services of agency leasing, asset services, capital markets, facility services (C&W Services), global occupier services, investment & asset management (DTZ Investors), project & development services, tenant representation, and valuation & advisory. To learn more, visit www.cushmanwakefi eld.com or follow @CushWake on Twitter
Methodology
Cushman & Wakefi eld’s quarterly estimates are derived from a variety of data sources, including its own proprietary database, and historical data from third party data sources. The market statistics are calculated from a base building inventory made up of industrial properties deemed to be competitive in the local industrial markets. Generally, owner-occupied and federally-owned buildings are not included. Older buildings unfi t for occupancy or ones that require substantial renovation before tenancy are generally not included in the competitive inventory. The inventory is subject to revisions due to resampling. Vacant space is defi ned as space that is available immediately or imminently after the end of the quarter. Sublet space still occupied by the tenant is not counted as available space. The fi gures provided for the current quarter are preliminary, and all information contained in the report is subject to correction of errors and revisions based on additional data received.
Regional Map
WestMidwestSouthNortheast
Cushman & Wakefi eld Copyright 2016. No warranty or representation, express or implied, is made to the accuracy or completeness of the information contained herein, and same is submitted subject to errors, omissions, change of price, rental or other conditions, withdrawal without notice, and to any special listing conditions imposed by the property owner(s). As applicable, we make no representation as to the condition of the property (or properties) in question.
Jason TolliverHead of Industrial Research, AmericasTel: +1 317.634.6363cushmanwakefi eld.com
Explanation of Terms
Total Inventory: The total amount of industrial space (in buildings of a
predetermined size by market) that can be rented by a third party.
Overall Vacancy Rate: The amount of unoccupied space (new, relet, and
sublet) expressed as a percentage of total inventory.
Absorption: The net change in occupied space between two points in time.
(Total occupied space in the present quarter minus total occupied space from
the previous quarter, quoted on a net, not gross, basis.)
Leasing Activity: The sum of all leases over a period of time. This includes
pre-leasing activity as well as expansions. It does not include renewals.
Overall Weighted Asking Rents: NNN average asking rents weighted by the
amount of available direct and sublease space in industrial properties.
W/D: Warehouse and or distribution properties.
MFG: Manufacturing properties.

cushmanwakefi eld.com
U.S. Industrial Snapshot Q3 2015MARKETBEAT
EconomyDespite concerns about slower growth in China and increased volatility in the U.S. and global fi nancial markets, the U.S. economy maintained its trajectory of steady and modest growth in the third quarter. Nonfarm job creation is on track to increase at a rate of 2.1% in 2015—its fastest pace in 15 years. As more Americans found work, new home construction and sales of existing homes have vastly improved. This bodes well for the industrial sector as a boost in housing typically translates into greater demand for warehouse space to store building materials. Moreover, housing also has a multiplier impact on consumer spending via the wealth eff ect.
Market OverviewHealthy industrial fundamentals can still be found across the nation and the industrial sector continues to perform strongly, however, despite the slowdown in economic activity in some areas of the country. Net absorption of 57.9 million square feet (msf) in the third quarter refl ected this strength, and brought the year-to-date occupancy gain in industrial properties to 173.1 msf. This puts the U.S. industrial sector on track to have another record-setting year in terms of demand for space. Signifi cant demand, space absorption and low vacancies continue to put upward pressure on rents in most major industrial hubs. The weighted average U.S. rental rate reached $5.34 NNN in the third quarter, a year-over-year increase of 4.8%. About 70% of all markets are experiencing positive rental growth, and 45% have seen year-over-year growth above 5% with double-digit gains in 14 markets.
The nationwide average vacancy of 7.4% clearly refl ects the fact that market-level supply pipelines, though growing, are still below the pace of demand in most markets. Secondary markets have seen an increase in development, but activity in primary markets, particularly distribution center hubs, has been stronger. There was 182.3 msf of construction underway across the country at the end of the third quarter.
OutlookThe economic environment in 2016 should support continued job gains, pushing the unemployment rate down below 5%, and improving the outlook for the American consumer. The shift toward online shopping will continue to be a leading demand driver for the industrial sector. Requirements for big-box space are common among e-commerce tenants, but there is also growing demand for smaller- and mid-size buildings. Increasing service expectations and the need to access labor are leading e-commerce companies to establish smaller infi ll locations around major population centers. Demand for Class A logistics product will remain strong and continue to fuel the rapid increase in construction. The need to replace aging stock should also drive a signifi cant volume of new development. Our forecast is for net absorption to continue to outpace new supply in 2016; however, the demand/supply imbalance is expected to narrow.
U.S. INDUSTRIAL
Overall Vacancy
Net Absorption/Rent NNN4Q TRAILING AVERAGE
Market IndicatorsQ3 14 Q3 15 12-Month
Forecast
Overall Vacancy 8.3% 7.4%
Net Absorption 67.2M 57.9M
Under Construction 160.9M 182.3M
Weighted Asking Rent (NNN) $5.10 $5.34
Employment IndicatorsQ3 14 Q3 15 12-Month
Forecast
Total Nonfarm Employment 139.4M 142.2M
Industrial Employment 23.3M 23.6M
Unemployment 6.1% 5.2%
$4.00
$4.50
$5.00
$5.50
-40,000,000
-5,000,000
30,000,000
65,000,000
2010 2011 2012 2013 2014 Q3 15
Net Absorption, SF Weighted Asking Rent, $ PSF
6.5%
7.5%
8.5%
9.5%
10.5%
2010 2011 2012 2013 2014 Q3 15
Historical Average = 9.0%

cushmanwakefi eld.comMarketBeat U.S. Industrial Snapshot Q3 2015
Overall Net Absorption Q3 2014 Q4 2014 Q1 2015 Q2 2015 Q3 2015p
United States 67,214,679 69,832,212 53,876,596 61,302,664 57,927,727
Northeast 15,417,593 9,017,883 10,868,266 751,671 8,995,075
Midwest 14,468,284 14,185,781 10,044,719 12,992,438 13,509,848
South 18,419,734 27,372,952 17,772,112 23,571,098 16,807,763
West 18,909,068 19,255,596 15,191,499 23,987,457 18,615,041
U.S. Industrial Report Markets Q3 2014 Q4 2014 Q1 2015 Q2 2015 Q3 2015p
Atlanta, GA 1,037,293 6,224,617 2,985,686 3,870,059 1,144,670
Austin, TX 15,743 582,323 256,247 594,625 535,220
Baltimore, MD 988,941 2,082,291 -44,448 778,856 515,020
Bellevue, WA -54,011 -121,331 148,166 443,637 1,400,803
Binghamton, NY 29,000 42,713 128,847 -347,566 47,200
Birmingham, AL 294,146 439,425 112,872 152,331 -8,894
Boston, MA 958,062 639,001 69,468 -226,334 744,749
Buff alo, NY n/a n/a n/a n/a n/a
Charleston, SC 646,286 303,858 927,823 965,661 593,087
Charlotte, NC 1,198,912 -105,703 -178,760 -96,289 443,913
Chicago, IL 5,448,310 3,473,748 2,354,963 3,932,839 5,161,780
Cincinnati, OH 631,603 698,644 2,334,169 1,197,258 1,046,595
Cleveland, OH 891,638 937,723 19,991 1,288,175 264,832
Colorado Springs, CO n/a n/a 301,296 291,924 197,926
Columbus, OH 1,746,014 -82,247 -500,772 1,402,273 316,303
Dallas/Fort Worth, TX 2,232,785 3,243,044 5,360,532 4,526,621 1,065,913
Dayton, OH 301,949 2,389,613 49,767 191,162 859,296
Denver, CO 790,763 2,056,618 823,744 893,754 717,454
Detroit, MI -377,699 739,803 990,983 557,248 1,311,308
East Bay, CA 1,471,696 683,023 332,910 1,160,381 247,894
El Paso, TX n/a n/a 11,941 194,337 683,500
Fort Myers/Naples FL 551,455 -124,379 -57,075 165,607 46,788
Fredericksburg, VA 38,045 -7,600 94,304 183,804 53,829
Ft. Lauderdale, FL 160,388 566,527 441,595 25,500 599,357
Greater Los Angeles 1,426,493 4,618,811 2,726,914 2,635,706 3,286,060
Greenville, SC 41,807 2,107,933 874,210 729,174 1,011,049
Hampton Roads, VA -17,601 499,398 571,725 686,350 579,468
Hartford, CT -103,215 724,156 1,732,588 -281,503 123,423
Houston, TX 2,787,290 2,203,125 2,033,276 832,255 1,963,076
Indianapolis, IN 1,420,748 2,001,103 1,499,290 987,637 1,071,505
Inland Empire CA 6,967,854 4,387,163 3,334,878 9,256,882 3,696,359
Jacksonville, FL 477,664 14,378 -62,843 799,162 702,265
Kansas City, MO 1,981,595 1,129,525 1,467,833 632,888 1,072,542
Lakeland, FL 1,133,037 188,254 83,368 232,011 144,250
Las Vegas, NV 800,334 659,285 1,132,600 1,808,833 767,457
Long Island, NY 44,150 38,025 514,710 -1,101,376 -810,758
Louisville, KY 1,741,430 1,036,456 651,291 -194,746 1,393,205
Memphis, TN 889,476 2,506,028 1,028,887 3,322,321 2,186,850
Miami, FL 514,166 682,668 530,266 672,037 219,743
Milwaukee, WI 829,335 932,633 864,523 923,899 144,626
Minneapolis, MN 645,260 538,252 753,691 624,161 1,596,352
Nashville, TN 1,676,014 592,599 303,183 915,555 1,156,109
Net Absorption
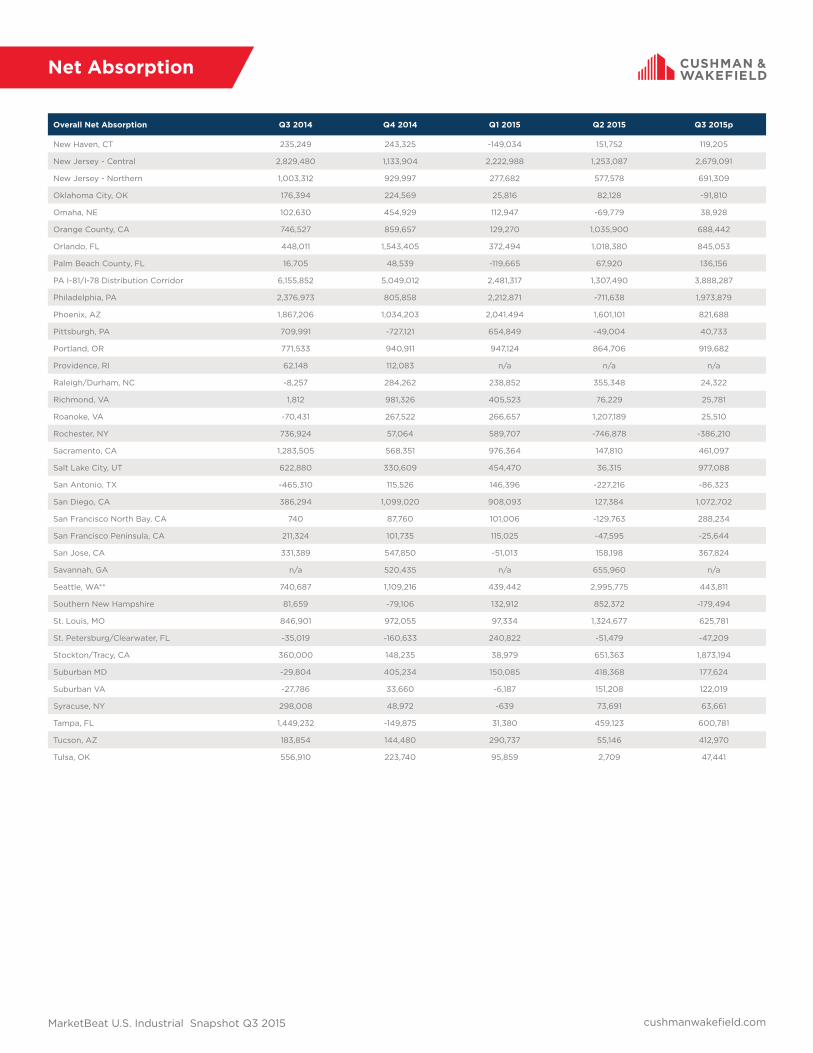
cushmanwakefi eld.comMarketBeat U.S. Industrial Snapshot Q3 2015
Overall Net Absorption Q3 2014 Q4 2014 Q1 2015 Q2 2015 Q3 2015p
New Haven, CT 235,249 243,325 -149,034 151,752 119,205
New Jersey - Central 2,829,480 1,133,904 2,222,988 1,253,087 2,679,091
New Jersey - Northern 1,003,312 929,997 277,682 577,578 691,309
Oklahoma City, OK 176,394 224,569 25,816 82,128 -91,810
Omaha, NE 102,630 454,929 112,947 -69,779 38,928
Orange County, CA 746,527 859,657 129,270 1,035,900 688,442
Orlando, FL 448,011 1,543,405 372,494 1,018,380 845,053
Palm Beach County, FL 16,705 48,539 -119,665 67,920 136,156
PA I-81/I-78 Distribution Corridor 6,155,852 5,049,012 2,481,317 1,307,490 3,888,287
Philadelphia, PA 2,376,973 805,858 2,212,871 -711,638 1,973,879
Phoenix, AZ 1,867,206 1,034,203 2,041,494 1,601,101 821,688
Pittsburgh, PA 709,991 -727,121 654,849 -49,004 40,733
Portland, OR 771,533 940,911 947,124 864,706 919,682
Providence, RI 62,148 112,083 n/a n/a n/a
Raleigh/Durham, NC -8,257 284,262 238,852 355,348 24,322
Richmond, VA 1,812 981,326 405,523 76,229 25,781
Roanoke, VA -70,431 267,522 266,657 1,207,189 25,510
Rochester, NY 736,924 57,064 589,707 -746,878 -386,210
Sacramento, CA 1,283,505 568,351 976,364 147,810 461,097
Salt Lake City, UT 622,880 330,609 454,470 36,315 977,088
San Antonio, TX -465,310 115,526 146,396 -227,216 -86,323
San Diego, CA 386,294 1,099,020 908,093 127,384 1,072,702
San Francisco North Bay, CA 740 87,760 101,006 -129,763 288,234
San Francisco Peninsula, CA 211,324 101,735 115,025 -47,595 -25,644
San Jose, CA 331,389 547,850 -51,013 158,198 367,824
Savannah, GA n/a 520,435 n/a 655,960 n/a
Seattle, WA** 740,687 1,109,216 439,442 2,995,775 443,811
Southern New Hampshire 81,659 -79,106 132,912 852,372 -179,494
St. Louis, MO 846,901 972,055 97,334 1,324,677 625,781
St. Petersburg/Clearwater, FL -35,019 -160,633 240,822 -51,479 -47,209
Stockton/Tracy, CA 360,000 148,235 38,979 651,363 1,873,194
Suburban MD -29,804 405,234 150,085 418,368 177,624
Suburban VA -27,786 33,660 -6,187 151,208 122,019
Syracuse, NY 298,008 48,972 -639 73,691 63,661
Tampa, FL 1,449,232 -149,875 31,380 459,123 600,781
Tucson, AZ 183,854 144,480 290,737 55,146 412,970
Tulsa, OK 556,910 223,740 95,859 2,709 47,441
Net Absorption
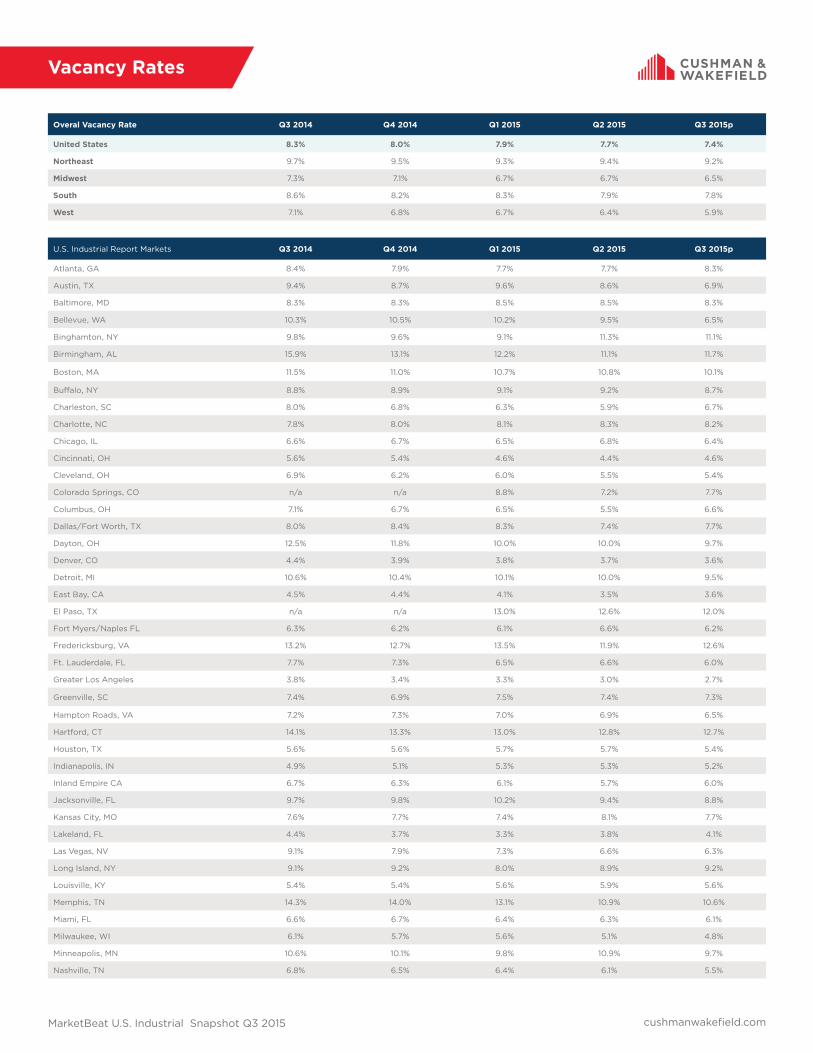
cushmanwakefi eld.comMarketBeat U.S. Industrial Snapshot Q3 2015
Vacancy Rates
Overal Vacancy Rate Q3 2014 Q4 2014 Q1 2015 Q2 2015 Q3 2015p
United States 8.3% 8.0% 7.9% 7.7% 7.4%
Northeast 9.7% 9.5% 9.3% 9.4% 9.2%
Midwest 7.3% 7.1% 6.7% 6.7% 6.5%
South 8.6% 8.2% 8.3% 7.9% 7.8%
West 7.1% 6.8% 6.7% 6.4% 5.9%
U.S. Industrial Report Markets Q3 2014 Q4 2014 Q1 2015 Q2 2015 Q3 2015p
Atlanta, GA 8.4% 7.9% 7.7% 7.7% 8.3%
Austin, TX 9.4% 8.7% 9.6% 8.6% 6.9%
Baltimore, MD 8.3% 8.3% 8.5% 8.5% 8.3%
Bellevue, WA 10.3% 10.5% 10.2% 9.5% 6.5%
Binghamton, NY 9.8% 9.6% 9.1% 11.3% 11.1%
Birmingham, AL 15.9% 13.1% 12.2% 11.1% 11.7%
Boston, MA 11.5% 11.0% 10.7% 10.8% 10.1%
Buff alo, NY 8.8% 8.9% 9.1% 9.2% 8.7%
Charleston, SC 8.0% 6.8% 6.3% 5.9% 6.7%
Charlotte, NC 7.8% 8.0% 8.1% 8.3% 8.2%
Chicago, IL 6.6% 6.7% 6.5% 6.8% 6.4%
Cincinnati, OH 5.6% 5.4% 4.6% 4.4% 4.6%
Cleveland, OH 6.9% 6.2% 6.0% 5.5% 5.4%
Colorado Springs, CO n/a n/a 8.8% 7.2% 7.7%
Columbus, OH 7.1% 6.7% 6.5% 5.5% 6.6%
Dallas/Fort Worth, TX 8.0% 8.4% 8.3% 7.4% 7.7%
Dayton, OH 12.5% 11.8% 10.0% 10.0% 9.7%
Denver, CO 4.4% 3.9% 3.8% 3.7% 3.6%
Detroit, MI 10.6% 10.4% 10.1% 10.0% 9.5%
East Bay, CA 4.5% 4.4% 4.1% 3.5% 3.6%
El Paso, TX n/a n/a 13.0% 12.6% 12.0%
Fort Myers/Naples FL 6.3% 6.2% 6.1% 6.6% 6.2%
Fredericksburg, VA 13.2% 12.7% 13.5% 11.9% 12.6%
Ft. Lauderdale, FL 7.7% 7.3% 6.5% 6.6% 6.0%
Greater Los Angeles 3.8% 3.4% 3.3% 3.0% 2.7%
Greenville, SC 7.4% 6.9% 7.5% 7.4% 7.3%
Hampton Roads, VA 7.2% 7.3% 7.0% 6.9% 6.5%
Hartford, CT 14.1% 13.3% 13.0% 12.8% 12.7%
Houston, TX 5.6% 5.6% 5.7% 5.7% 5.4%
Indianapolis, IN 4.9% 5.1% 5.3% 5.3% 5.2%
Inland Empire CA 6.7% 6.3% 6.1% 5.7% 6.0%
Jacksonville, FL 9.7% 9.8% 10.2% 9.4% 8.8%
Kansas City, MO 7.6% 7.7% 7.4% 8.1% 7.7%
Lakeland, FL 4.4% 3.7% 3.3% 3.8% 4.1%
Las Vegas, NV 9.1% 7.9% 7.3% 6.6% 6.3%
Long Island, NY 9.1% 9.2% 8.0% 8.9% 9.2%
Louisville, KY 5.4% 5.4% 5.6% 5.9% 5.6%
Memphis, TN 14.3% 14.0% 13.1% 10.9% 10.6%
Miami, FL 6.6% 6.7% 6.4% 6.3% 6.1%
Milwaukee, WI 6.1% 5.7% 5.6% 5.1% 4.8%
Minneapolis, MN 10.6% 10.1% 9.8% 10.9% 9.7%
Nashville, TN 6.8% 6.5% 6.4% 6.1% 5.5%

cushmanwakefi eld.comMarketBeat U.S. Industrial Snapshot Q3 2015
Vacancy Rates
Overal Vacancy Rate Q3 2014 Q4 2014 Q1 2015 Q2 2015 Q3 2015p
New Haven, CT 14.5% 13.9% 13.7% 12.9% 12.7%
New Jersey - Central 9.0% 8.8% 8.4% 8.0% 7.4%
New Jersey - Northern 7.5% 7.5% 7.7% 7.2% 7.0%
Oklahoma City, OK 6.7% 5.7% 6.2% 6.3% 6.2%
Omaha, NE 2.9% 3.0% 2.7% 2.9% 2.7%
Orange County, CA 3.8% 3.7% 3.8% 3.5% 3.0%
Orlando, FL 8.8% 8.5% 8.1% 7.9% 7.5%
Palm Beach County, FL 6.3% 6.2% 5.7% 5.5% 4.9%
PA I-81/I-78 Distribution Corridor 5.8% 5.2% 4.4% 5.4% 5.0%
Philadelphia, PA 4.7% 4.7% 5.3% 6.2% 5.8%
Phoenix, AZ 11.2% 11.4% 11.1% 11.2% 11.1%
Pittsburgh, PA 6.8% 7.6% 7.5% 6.8% 7.2%
Portland, OR 5.6% 5.3% 5.1% 5.3% 5.3%
Providence, RI 2.2% 2.0% 2.0% 1.7% 1.3%
Raleigh/Durham, NC 7.5% 7.2% 7.2% 6.3% 6.1%
Richmond, VA 7.8% 7.6% 8.0% 7.8% 7.7%
Roanoke, VA 12.7% 9.3% 9.2% 8.5% 8.3%
Rochester, NY 11.1% 11.1% 10.3% 11.3% 11.8%
Sacramento, CA 11.9% 11.4% 10.9% 10.9% 10.6%
Salt Lake City, UT 6.6% 6.8% 6.7% 6.7% 7.2%
San Antonio, TX 10.6% 10.9% 10.5% 11.4% 11.2%
San Diego, CA 7.1% 6.4% 6.0% 5.8% 5.3%
San Francisco North Bay, CA 7.9% 7.5% 7.0% 7.6% 6.6%
San Francisco Peninsula, CA 4.3% 4.0% 3.7% 3.8% 3.9%
San Jose, CA 5.6% 4.9% 4.9% 4.5% 4.1%
Savannah, GA 8.2% 7.1% 7.1% 5.6% 5.6%
Seattle, WA 6.4% 6.3% 5.9% 4.8% 4.3%
Southern New Hampshire 19.1% 18.6% 18.3% 17.7% 17.4%
St. Louis, MO 6.7% 6.5% 6.5% 6.3% 6.0%
St. Petersburg/Clearwater, FL 5.2% 5.5% 5.5% 5.7% 5.6%
Stockton/Tracy, CA 8.2% 8.3% 8.9% 8.0% 5.1%
Suburban MD 13.0% 12.5% 11.9% 11.7% 12.2%
Suburban VA 12.1% 12.0% 11.8% 11.7% 11.5%
Syracuse, NY 11.8% 11.6% 11.3% 11.1% 10.9%
Tampa, FL 6.7% 6.8% 7.8% 7.6% 6.7%
Tucson, AZ 11.0% 10.7% 10.2% 10.0% 9.4%
Tulsa, OK 9.0% 8.7% 8.5% 8.1% 8.3%

cushmanwakefi eld.comMarketBeat U.S. Industrial Snapshot Q3 2015
Asking Rents
Overall Weighted Asking Rent Q3 2014 Q4 2014 Q1 2015 Q2 2015 Q3 2015p
United States $5.10 $5.12 $5.20 $5.28 $5.34
Northeast $5.29 $5.37 $5.39 $5.39 $5.40
Midwest $3.39 $3.42 $3.55 $3.57 $3.66
South $8.13 $8.19 $8.24 $8.40 $8.52
West $3.59 $3.51 $3.62 $3.76 $3.78
U.S. Industrial Report Markets Q3 2014 Q4 2014 Q1 2015 Q2 2015 Q3 2015p
Atlanta, GA $3.96 $4.00 $4.03 $4.20 $4.34
Austin, TX $9.00 $9.12 $9.36 $9.36 $9.84
Baltimore, MD $5.30 $5.25 $5.40 $5.37 $5.40
Bellevue, WA $9.77 $9.48 $9.95 $10.08 $9.22
Binghamton, NY $4.58 $4.58 $4.65 $4.71 $4.83
Birmingham, AL $4.36 $4.44 $4.49 $4.67 $4.69
Boston, MA $6.32 $6.37 $6.28 $6.35 $6.30
Buff alo, NY $4.66 $4.66 $4.13 $4.13 $4.13
Charleston, SC $4.38 $4.42 $4.45 $4.55 $4.69
Charlotte, NC $4.05 $4.15 $4.20 $4.16 $4.23
Chicago, IL $4.64 $4.56 $4.54 $4.64 $4.79
Cincinnati, OH $2.97 $2.91 $2.99 $3.00 $3.13
Cleveland, OH $3.76 $3.75 $3.77 $3.78 $3.86
Colorado Springs, CO n/a n/a $6.65 $6.37 $6.87
Columbus, OH $3.06 $3.09 $3.20 $3.30 $3.30
Dallas/Fort Worth, TX $5.08 $5.12 $4.97 $5.00 $5.00
Dayton, OH $2.55 $2.58 $2.56 $2.57 $3.01
Denver, CO $5.78 $6.08 $6.47 $6.66 $6.93
Detroit, MI $4.08 $4.08 $4.13 $4.22 $4.26
East Bay, CA $5.48 $5.57 $5.63 $5.66 $5.94
El Paso, TX n/a n/a $3.70 $3.70 $3.75
Fort Myers/Naples FL $5.70 $5.57 $5.73 $6.10 $6.25
Fredericksburg, VA $5.85 $5.78 $5.66 $5.61 $5.47
Ft. Lauderdale, FL $7.29 $7.45 $7.50 $7.51 $7.63
Greater Los Angeles $7.13 $7.24 $7.37 $7.69 $7.79
Greenville, SC $3.11 $3.26 $3.44 $3.38 $3.44
Hampton Roads, VA $4.96 $4.97 $4.95 $4.96 $4.87
Hartford, CT $4.24 $4.34 $4.31 $4.28 $4.21
Houston, TX $5.90 $5.79 $5.68 $6.04 $6.09
Indianapolis, IN $3.79 $3.81 $3.81 $3.83 $3.87
Inland Empire CA $5.15 $5.17 $5.19 $5.24 $5.38
Jacksonville, FL $3.98 $3.92 $3.90 $4.00 $3.91
Kansas City, MO $4.10 $4.21 $4.01 $4.12 $4.10
Lakeland, FL $4.40 $4.54 $4.62 $4.64 $4.50
Las Vegas, NV $6.48 $6.48 $6.73 $7.02 $7.18
Long Island, NY $8.17 $8.32 $8.78 $8.83 $8.87
Louisville, KY $3.63 $3.69 $3.61 $3.61 $3.65
Memphis, TN $2.79 $2.80 $2.47 $2.47 $2.53
Miami, FL $6.31 $6.52 $6.42 $6.85 $6.95
Milwaukee, WI $4.15 $4.21 $4.12 $4.10 $4.22
Minneapolis, MN $4.34 $4.37 $4.43 $4.33 $4.48
Nashville, TN $4.30 $4.48 $4.84 $4.70 $4.72
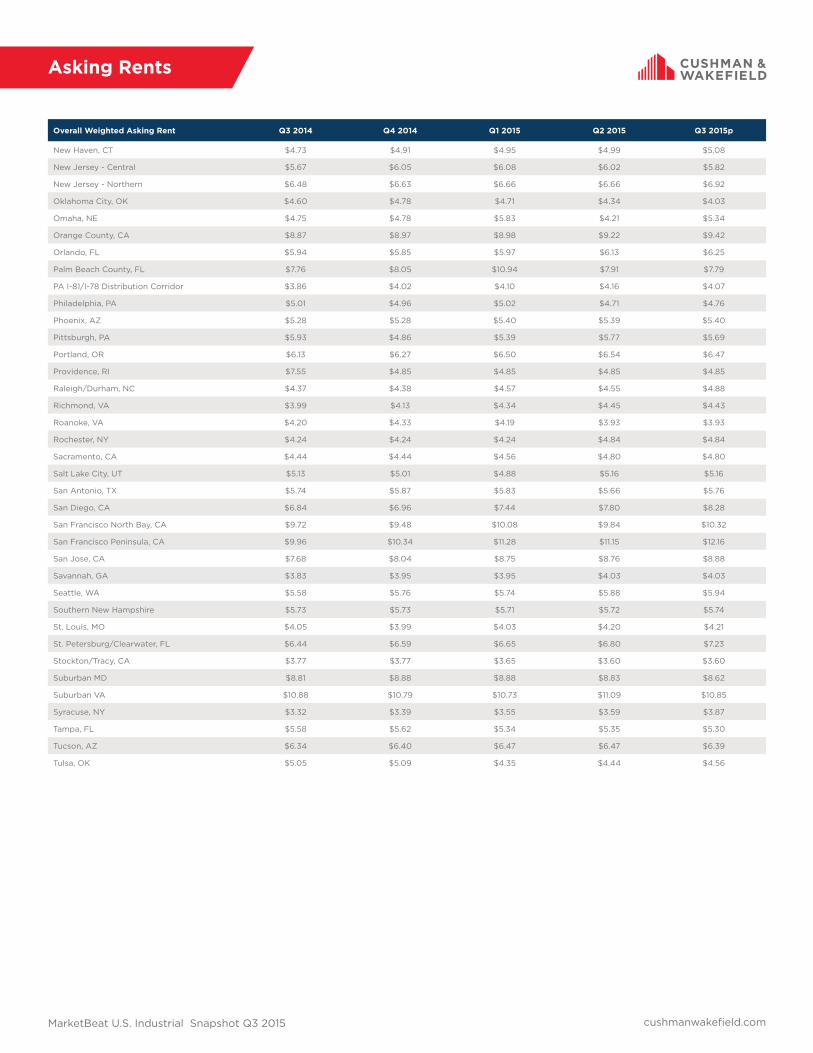
cushmanwakefi eld.comMarketBeat U.S. Industrial Snapshot Q3 2015
Asking Rents
Overall Weighted Asking Rent Q3 2014 Q4 2014 Q1 2015 Q2 2015 Q3 2015p
New Haven, CT $4.73 $4.91 $4.95 $4.99 $5.08
New Jersey - Central $5.67 $6.05 $6.08 $6.02 $5.82
New Jersey - Northern $6.48 $6.63 $6.66 $6.66 $6.92
Oklahoma City, OK $4.60 $4.78 $4.71 $4.34 $4.03
Omaha, NE $4.75 $4.78 $5.83 $4.21 $5.34
Orange County, CA $8.87 $8.97 $8.98 $9.22 $9.42
Orlando, FL $5.94 $5.85 $5.97 $6.13 $6.25
Palm Beach County, FL $7.76 $8.05 $10.94 $7.91 $7.79
PA I-81/I-78 Distribution Corridor $3.86 $4.02 $4.10 $4.16 $4.07
Philadelphia, PA $5.01 $4.96 $5.02 $4.71 $4.76
Phoenix, AZ $5.28 $5.28 $5.40 $5.39 $5.40
Pittsburgh, PA $5.93 $4.86 $5.39 $5.77 $5.69
Portland, OR $6.13 $6.27 $6.50 $6.54 $6.47
Providence, RI $7.55 $4.85 $4.85 $4.85 $4.85
Raleigh/Durham, NC $4.37 $4.38 $4.57 $4.55 $4.88
Richmond, VA $3.99 $4.13 $4.34 $4.45 $4.43
Roanoke, VA $4.20 $4.33 $4.19 $3.93 $3.93
Rochester, NY $4.24 $4.24 $4.24 $4.84 $4.84
Sacramento, CA $4.44 $4.44 $4.56 $4.80 $4.80
Salt Lake City, UT $5.13 $5.01 $4.88 $5.16 $5.16
San Antonio, TX $5.74 $5.87 $5.83 $5.66 $5.76
San Diego, CA $6.84 $6.96 $7.44 $7.80 $8.28
San Francisco North Bay, CA $9.72 $9.48 $10.08 $9.84 $10.32
San Francisco Peninsula, CA $9.96 $10.34 $11.28 $11.15 $12.16
San Jose, CA $7.68 $8.04 $8.75 $8.76 $8.88
Savannah, GA $3.83 $3.95 $3.95 $4.03 $4.03
Seattle, WA $5.58 $5.76 $5.74 $5.88 $5.94
Southern New Hampshire $5.73 $5.73 $5.71 $5.72 $5.74
St. Louis, MO $4.05 $3.99 $4.03 $4.20 $4.21
St. Petersburg/Clearwater, FL $6.44 $6.59 $6.65 $6.80 $7.23
Stockton/Tracy, CA $3.77 $3.77 $3.65 $3.60 $3.60
Suburban MD $8.81 $8.88 $8.88 $8.83 $8.62
Suburban VA $10.88 $10.79 $10.73 $11.09 $10.85
Syracuse, NY $3.32 $3.39 $3.55 $3.59 $3.87
Tampa, FL $5.58 $5.62 $5.34 $5.35 $5.30
Tucson, AZ $6.34 $6.40 $6.47 $6.47 $6.39
Tulsa, OK $5.05 $5.09 $4.35 $4.44 $4.56

cushmanwakefi eld.comMarketBeat U.S. Industrial Snapshot Q3 2015
Inventory
Inventory Inventory Deliveries YTD 2015 UC as of Q3 2015p
United States 13,484,056,533 124,790,917 182,312,969
Northeast 2,017,662,255 21,585,810 32,686,429
Midwest 3,376,298,378 36,916,908 53,026,318
South 5,392,989,888 51,933,451 78,949,528
West 2,637,217,837 13,054,748 17,315,944
U.S. Industrial Report Markets Inventory Deliveries YTD 2015 UC as of Q3 2015p
Atlanta, GA 530,410,460 8,157,556 16,454,748
Austin, TX 45,222,178 108,750 392,205
Baltimore, MD 204,823,798 852,295 994,678
Bellevue, WA 57,770,664 227,861 430,050
Binghamton, NY 17,688,409 n/a n/a
Birmingham, AL 14,415,116 0 100,000
Boston, MA 176,983,154 0 940,000
Buff alo, NY 110,086,978 50,000 1,894,230
Charleston, SC 51,566,502 1,248,441 5,233,479
Charlotte, NC 156,313,825 1,795,973 594,420
Chicago, IL 1,150,708,705 10,187,508 10,069,042
Cincinnati, OH 275,007,642 2,466,369 3,126,145
Cleveland, OH 482,301,850 226,000 2,481,200
Colorado Springs, CO 34,092,743 0 292,303
Columbus, OH 240,278,031 3,612,288 3,159,073
Dallas/Fort Worth, TX 551,292,966 10,912,819 20,932,835
Dayton, OH 111,655,032 735,320 422,900
Denver, CO 247,751,298 1,566,389 1,566,661
Detroit, MI 299,332,957 275,000 895,720
East Bay, CA 195,733,802 1,028,704 1,397,708
El Paso, TX 51,455,980 270,000 n/a
Fort Myers/Naples FL 40,390,687 0 59,379
Fredericksburg, VA 10,112,220 16,000 0
Ft. Lauderdale, FL 94,691,706 688,517 749,543
Greater Los Angeles 1,076,147,759 2,495,573 2,283,010
Greenville, SC 186,145,960 0 4,844,000
Hampton Roads, VA 94,243,759 699,000 128,209
Hartford, CT 91,812,974 1,500,000 0
Houston, TX 385,098,839 6,341,907 10,399,753
Indianapolis, IN 252,439,240 4,895,086 1,600,000
Inland Empire CA 471,059,648 15,153,753 19,445,832
Jacksonville, FL 103,503,458 508,094 1,601,976
Kansas City, MO 199,248,032 2,706,466 4,108,648
Lakeland, FL 29,710,946 397,400 376,170
Las Vegas, NV 102,856,003 1,989,630 3,157,576
Long Island, NY 129,117,332 0 475,000
Louisville, KY 131,338,827 2,188,295 3,535,380
Memphis, TN 186,663,234 2,596,064 1,556,113
Miami, FL 160,843,601 841,008 1,076,390
Milwaukee, WI 195,431,964 1,337,601 1,411,398
Minneapolis, MN 104,934,275 2,696,530 1,899,360
Nashville, TN 196,095,738 370,905 3,108,606

cushmanwakefi eld.comMarketBeat U.S. Industrial Snapshot Q3 2015
Inventory
Inventory Inventory Deliveries YTD 2015 UC as of Q3 2015p
New Haven, CT 48,432,317 0 82,251
New Jersey - Central 331,312,681 2,634,675 2,046,778
New Jersey - Northern 290,427,626 0 920,535
Oklahoma City, OK 69,522,067 345,000 1,655,395
Omaha, NE 68,349,607 399,244 811,504
Orange County, CA 281,710,879 502,882 1,267,078
Orlando, FL 109,410,639 1,313,745 839,434
Palm Beach County, FL 42,412,559 745,634 668,410
PA I-81/I-78 Distribution Corridor 237,320,372 6,970,344 12,319,667
Philadelphia, PA 283,375,803 1,898,064 5,245,342
Phoenix, AZ 302,642,401 3,991,073 4,206,215
Pittsburgh, PA 168,862,823 842,422 893,242
Portland, OR 188,465,888 1,762,862 3,110,189
Providence, RI 77,727,305 n/a n/a
Raleigh/Durham, NC 49,910,493 160,080 715,350
Richmond, VA 90,517,421 403,060 222,800
Roanoke, VA 44,227,910 n/a n/a
Rochester, NY 73,551,473 88,500 13,332
Sacramento, CA 134,111,126 243,147 943,738
Salt Lake City, UT 122,363,219 2,346,211 1,313,667
San Antonio, TX 38,155,019 689,115 1,448,937
San Diego, CA 159,530,676 111,638 439,638
San Francisco North Bay, CA 22,122,860 100,000 0
San Francisco Peninsula, CA 39,580,035 0 0
San Jose, CA 83,909,593 0 0
Savannah, GA 42,647,344 448,000 0
Seattle, WA 133,168,893 2,193,826 1,778,078
Southern New Hampshire 46,731,270 614,240 300,000
St. Louis, MO 238,509,655 1,148,272 3,951,821
St. Petersburg/Clearwater, FL 51,515,762 0 0
Stockton/Tracy, CA 48,856,682 1,196,000 1,001,378
Suburban MD 47,338,763 764,781 1,024,300
Suburban VA 47,314,800 0 610,400
Syracuse, NY 42,647,344 0 155,000
Tampa, FL 80,459,780 165,000 0
Tucson, AZ 40,246,981 270,000 800,000
Tulsa, OK 59,888,175 1,300,000 334,750

About Cushman & Wakefi eld
Cushman & Wakefi eld is a leading global real estate services fi rm that helps clients transform the way people work, shop and live. The fi rm’s 43,000 employees in more than 60 countries provide deep local and global insights that create signifi cant value for occupiers and investors around the world. Cushman & Wakefi eld is among the largest commercial real estate services fi rms with revenues of $5 billion across core services of agency leasing, asset services, capital markets, facility services (branded C&W Services), global occupier services, investment & asset management (branded DTZ Investors), project & development services, tenant representation and valuation & advisory. To learn more, visit www.cushmanwakefi eld.com or follow @CushWake on Twitter.
Methodology
Cushman & Wakefi eld’s quarterly estimates are derived from a variety of data sources, including its own proprietary database, and historical data from third party data sources. The market statistics are calculated from a base building inventory made up of offi ce properties deemed to be competitive in the local offi ce markets. Generally, owner-occupied and federally-owned buildings are not included. Single tenant buildings and privately-owned buildings in which the federal government leases space are included. Older buildings unfi t for occupancy or ones that require substantial renovation before tenancy are generally not included in the competitive inventory. The inventory is subject to revisions due to resampling. Vacant space is defi ned as space that is available immediately or imminently after the end of the quarter. Sublet space still occupied by the tenant is not counted as available space. The fi gures provided for the current quarter are preliminary, and all information contained in the report is subject to correction of errors and revisions based on additional data received.
Regional Map
WestMidwestSouthNortheast
Explanation of Terms
Total Inventory: The total amount of offi ce space (in buildings of a predetermined size by market) that can be rented by a third party.
Vacancy Rate: The amount of unoccupied space (new, relet, and sublet) expressed as a percentage of total inventory.
Absorption: The net change in occupied space between two points in time. (Total occupied space in the present quarter minus total occupied space from the previous quarter, quoted on a net, not gross, basis.)
Weighted Asking Rents: NNN average asking rents.
Cushman & Wakefi eld Copyright 2015. No warranty or representation, express or implied, is made to the accuracy or completeness of the information contained herein, and same is submitted subject to errors, omissions, change of price, rental or other conditions, withdrawal without notice, and to any special listing conditions imposed by the property owner(s). As applicable, we make no representation as to the condition of the property (or properties) in question.
U.S ResearchTel: +1 202 463 2100
cushmanwakefi eld.com
DisclaimerAs you are probably aware, on September 1 the successful merger between Cushman & Wakefi eld and DTZ was fi nalized, creating one of the world’s largest real estate services fi rms. We are currently going through the process of merging both legacy Cushman & Wakefi eld and DTZ datasets, and the preliminary results of the initial eff ort to merge the two data sets are reported in our Q3 indicators.
We also expect to deliver Q4 consistent with historical deliverables, with a transition to a merged dataset being delivered for Q1 2016. This enhanced dataset may diff er from what you have received in the past.
We believe the changes we are making following the integration will result in a more robust and comprehensive dataset for you. If you have any issues once you receive fi rst quarter results, we’d be happy to discuss other options. Your satisfaction is our top priority.