u.s. hotel industry overview - iare · u.s. hotel industry overview vail r. brown, chms vice...
TRANSCRIPT

U.S. Hotel Industry Overview
Vail R. Brown, CHMS
Vice President, Global Business Development & Marketing
vail_str [email protected]
IARE September 22, 2014

About STR
• Founded in 1985
• STR Family of Companies Include: STR, STR Global, STR Analytics, HotelNewsNow.com, & Hotel Data Conference (Aug. 4-6, 2015)
• The recognized leader in hotel performance benchmarking - Impartial, timely, confidential
• Sample over 70% of total U.S. room supply; 52% of total global room supply.
• Provide monthly, weekly, and daily STAR reports to over 50,000 hotels, representing close to 8 million rooms worldwide

Background: STR SHARE Center partnership with AH&LA Educational Institute
Acronym: Certification in Hotel Industry Analytics
About: Leading certification for hospitality and tourism
More Info: [email protected]
Get C.H.I.A Certified!

1. Industry Pulse from 30,000 ft.
2. Group Demand ‘Comeback’?
3. Best & Worst Market Performance
4. Pipeline Growth
5. Where Are We Headed?
5 Things to Know …..

1. Visit www.HotelNewsNow.com 2. Create Free Login 3. Click on “Data Presentations”


U.S. Pulse - Positive So Far 1

U.S. Records Set in 2013!
Most Rooms Available
Most Rooms Sold
Highest Rooms Revenue
Highest ADR ($110)
Highest RevPAR ($70)
Full Year 2013

May 2014 RevPAR Growth
10% Highest May of any on
record…ever!

June 2014 Occupancy 71.7%
Highest June occupancy this century!

July 2014: Most Rooms Sold Ever!
113 Million

Strong Demand Drives Very Strong RevPAR
% Change
• Room Supply* 0.8%
• Room Demand* 4.2%
• Occupancy 65.1% 3.4%
• A.D.R.* $115 4.3%
• RevPAR* $75 7.8%
• Room Revenue* 8.6%
Total U.S. As of July 2014 YTD *All Time High for First 7 Months

Demand Growth Accelerates. How Long Can That Last?
-8
-4
0
4
8
1990 1992 1994 1996 1998 2000 2002 2004 2006 2008 2010 2012 2014
Supply Demand
-6.9%
-0.9%
- 4.7%
Total U.S. Supply & Demand % Change 12 Month Moving Average Jan. 1990 – July 2014
8.0%
3.4%
0.8%
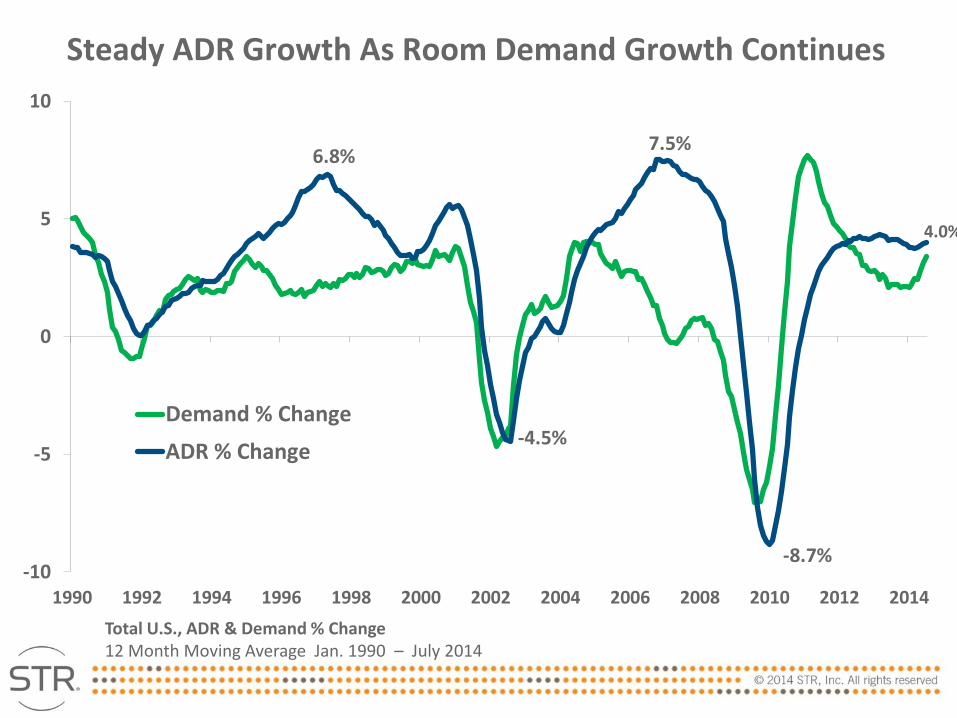
Steady ADR Growth As Room Demand Growth Continues
-10
-5
0
5
10
1990 1992 1994 1996 1998 2000 2002 2004 2006 2008 2010 2012 2014
Demand % Change
ADR % Change -4.5%
7.5% 6.8%
-8.7%
4.0%
Total U.S., ADR & Demand % Change 12 Month Moving Average Jan. 1990 – July 2014

$30
$50
$70
$90
$110
$130
2007 2009 2011 2013
Bill
ion
s
Total U.S.: Rooms Revenue 12 Month Moving Average: January 2005 – July 2014
Room Revenue > $128bn

Total U.S.: 2013 Revenue Variance from 2012 Source: 2014 STR Analytics HOST Almanac

• Luxury – Fairmont, Four Seasons, Ritz Carlton, JW Marriott
• Upper Upscale – Sheraton, Hilton, Hyatt, Marriott,
• Upscale – Radisson, Hilton Garden Inn, Residence Inn, Springhill Suites, Homewood Suites, Courtyard, Best Western Premier
• Upper Midscale – Fairfield Inn/Suites, Holiday Inn, Clarion, Hampton Inn/Suites, Best Western PLUS
• Midscale – Country Inn & Suites, Best Western, Candlewood Suites, Quality Inn/Suites
• Economy – Extended Stay America, Red Roof, Days Inn, Microtel
2014 STR Chain Scales *Full list go to www.str.com

A Tale of 2 Supply Growth Scenarios
0.8 1.5
3.5
0.4
-0.7
0.4
1.6
3.8
6.6
4.0
3.0
4.3
Luxury Upper Upscale Upscale Upper Midscale Midscale Economy
Supply % Change
Demand % Change
U.S. Chain Scales: Supply / Demand % Change As of July 2014 YTD

ADR Growth Strong Across The Board
0.7
2.3
3.0
3.6 3.7 3.9
5.0 4.7 4.7
3.9 3.7
4.4
Luxury Upper Upscale Upscale Upper Midscale Midscale Economy
Occupancy % Change
ADR % Change
U.S. Chain Scales: OCC / ADR % Change As of July 2014 YTD
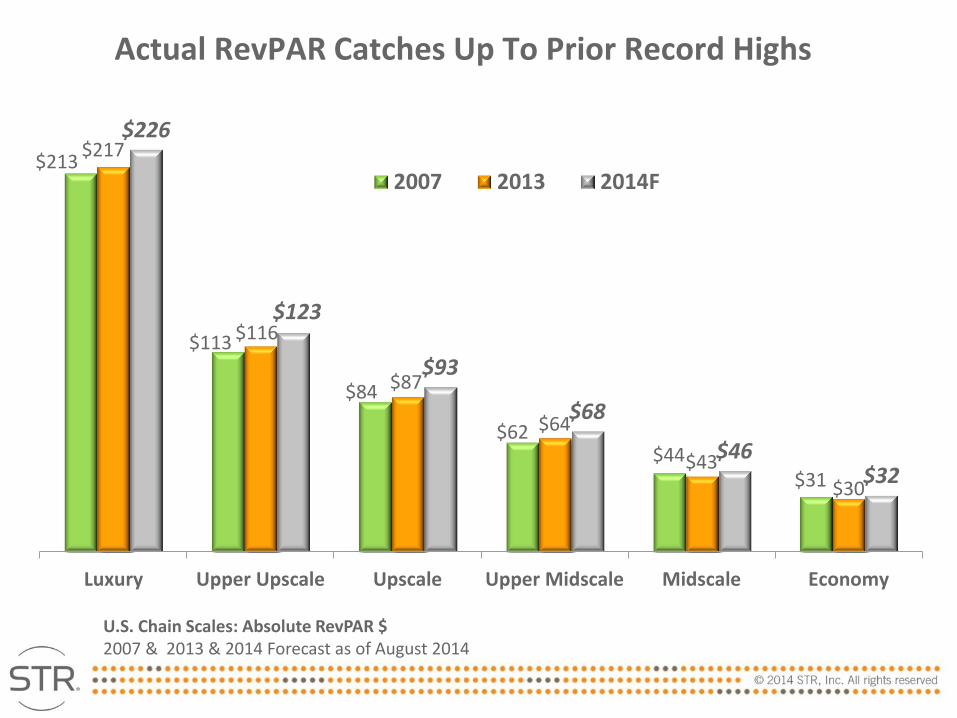
Actual RevPAR Catches Up To Prior Record Highs
$213
$113
$84
$62 $44
$31
$217
$116
$87
$64
$43
$30
$226
$123
$93
$68
$46 $32
Luxury Upper Upscale Upscale Upper Midscale Midscale Economy
2007 2013 2014F
U.S. Chain Scales: Absolute RevPAR $ 2007 & 2013 & 2014 Forecast as of August 2014

Group Demand ‘Comeback’?
Group Transient Contract
Segmentation
2

Total U.S.: Group Occupancy Share Decreases
43% 57%
Group
Transient
36%
64%
U.S. Transient and Group Occupancy as Share of Total OCC 2005 and 2013 (Share does not include contract)
2005 2013

-2%
-1%
1%
2%
3%
4%
5%
2012 2013 2014
Demand ADR
Group Demand and ADR % Change, 12 MMA, 1/2012 – 7/2014
Group Demand Is (Finally!) Recovering
*2013 Easter Comp
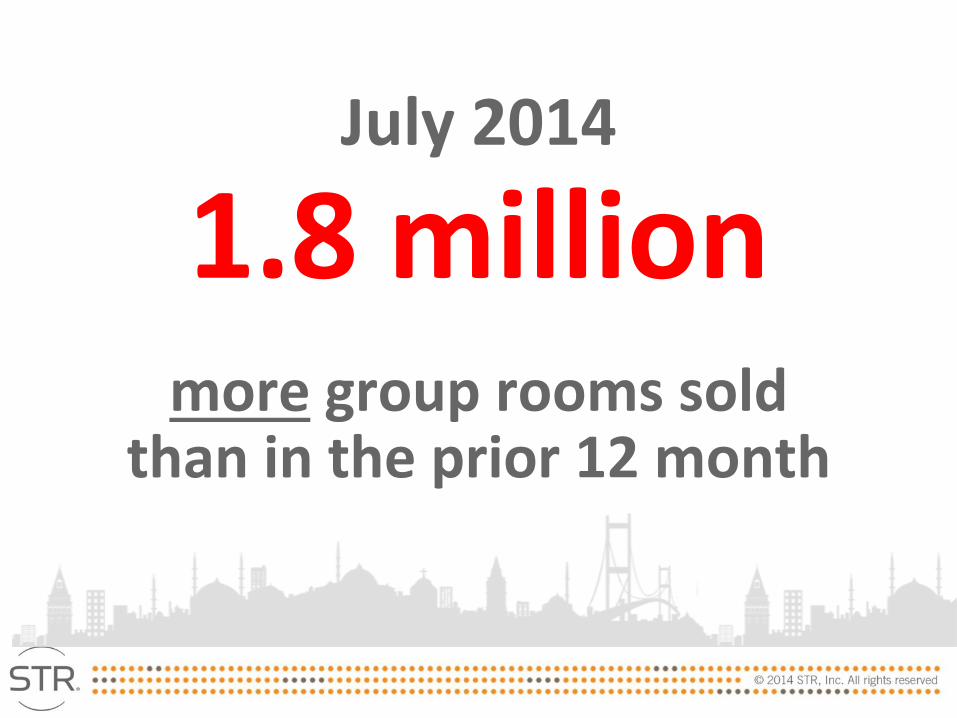
July 2014
1.8 million
more group rooms sold than in the prior 12 month
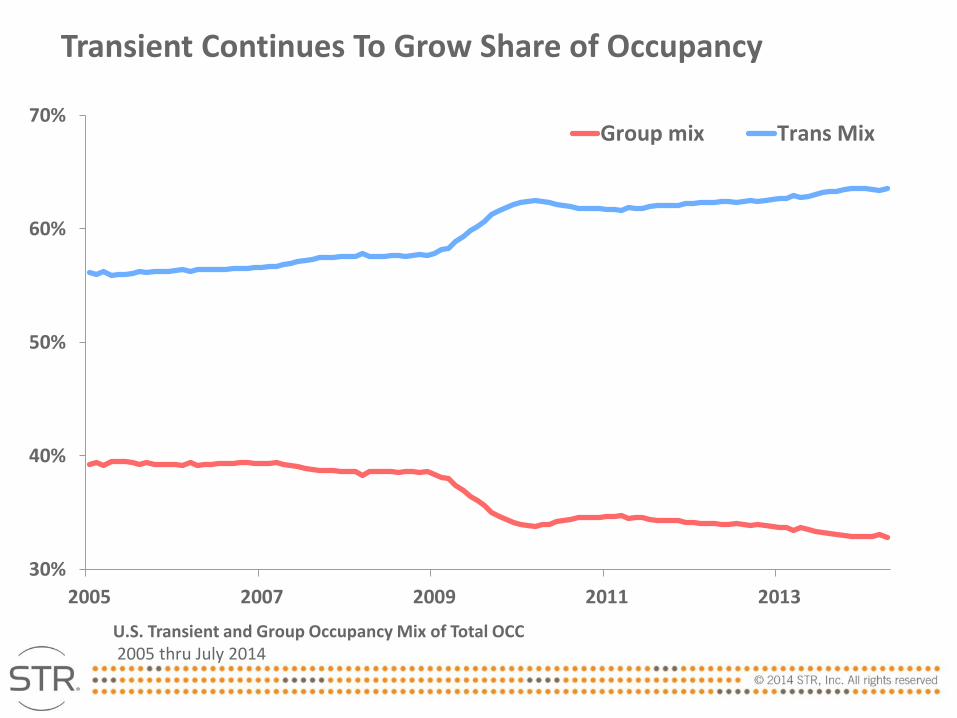
U.S. Transient and Group Occupancy Mix of Total OCC 2005 thru July 2014
Transient Continues To Grow Share of Occupancy
30%
40%
50%
60%
70%
2005 2007 2009 2011 2013
Group mix Trans Mix

Transient Room Premium Back to 2008 Levels
$194
$164 $168
$178
$186
$194
$204
$173
$161 $157
$161
$166
$172
$177
2008 2009 2010 2011 2012 2013 YTD 2014
Transient Group
U.S. Customer Segmentation ADR $ 2008 – YTD July 2014

3 U.S. Market Performance

Top U.S. Markets Demand Growth %, July 2014 YTD
Markets With Demand Growth > 4%

The Chinese Guest Still to Come…

Actual OCC & ADR % Change in Top 25 5 Best / 5 Worst Performing Markets ending July 2014 YTD
Market OCC % ADR % Change
Nashville, TN 72.8 13.2
San Francisco/San Mateo, CA 83.2 11.3
Denver, CO 76.2 8.1
Seattle, WA 75.4 7.6
Boston, MA 74.3 7.1
Chicago, IL 67.9 1.7
Norfolk/Virginia Beach, VA 55.5 1.7
New Orleans, LA 71.2 1.6
Philadelphia, PA-NJ 68.5 0.2
Washington, DC-MD-VA 70.3 -1.2
Not all growth or declines are created equal…many factors

Pipeline Accelerates
4
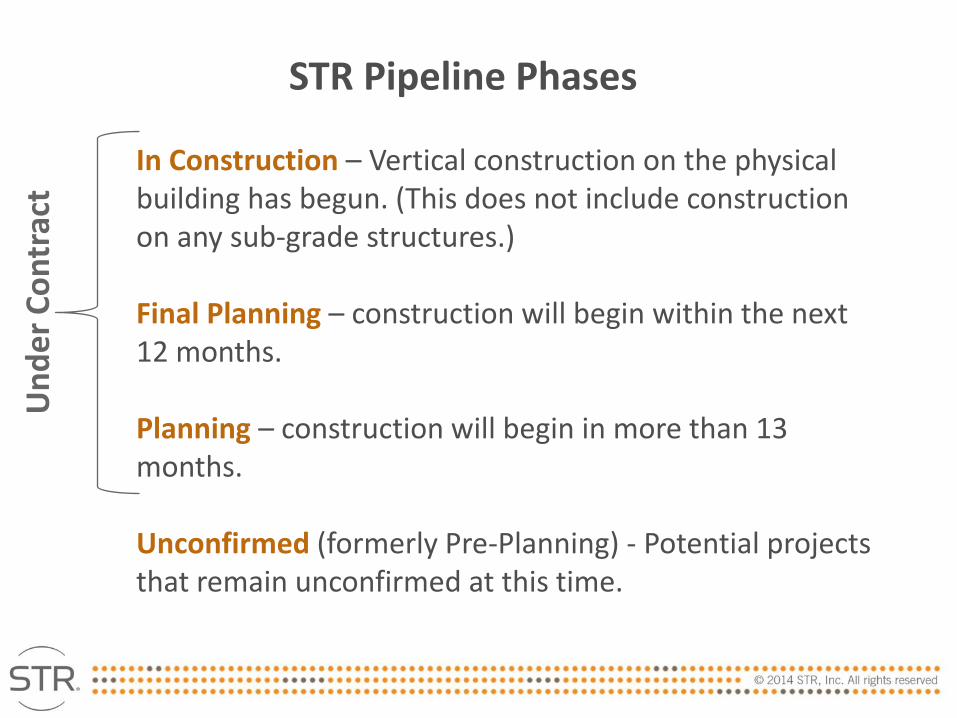
In Construction – Vertical construction on the physical building has begun. (This does not include construction on any sub-grade structures.) Final Planning – construction will begin within the next 12 months. Planning – construction will begin in more than 13 months. Unconfirmed (formerly Pre-Planning) - Potential projects that remain unconfirmed at this time.
Un
de
r C
on
trac
t STR Pipeline Phases

Under Contract Pipeline- 12% Increase
Phase 2014 2013 % Change
In Construction 108 75 44%
Final Planning 124 126 -1%
Planning 155 144 8%
Under Contract 388 345 12%
Total U.S. Pipeline, by Phase, ‘000s Rooms July 2014 and 2013

Most In Upscale & Upper Midscale
3.5
10.3
40.4
30.9
5.1
0.8
15.4
Luxury UpperUpscale
Upscale UpperMidscale
Midscale Economy Unaffiliated
Total U.S. Pipeline, Rooms Under Construction ‘000s Rooms, by Scale, June 2014
67%

Construction In Top 26 Markets: 15 With 2%+ Of Supply
U.S. Pipeline, Top 26 Markets, U/C Rooms as % of Existing Supply, July 2014
Market Rooms U/C % Of Existing
Chicago, IL 2,292 2.1%
Minneapolis-St Paul, MN-WI 832 2.2%
New Orleans, LA 826 2.2%
Los Angeles-Long Beach, CA 2,187 2.2%
San Diego, CA 1,381 2.3%
Dallas, TX 1,826 2.3%
Washington, DC-MD-VA 2,507 2.3%
Boston, MA 1,379 2.7%
Denver, CO 1,250 2.9%
Nashville, TN 1,157 3.1%
Anaheim-Santa Ana, CA 2,394 4.4%
Seattle, WA 1,937 4.7%
Miami-Hialeah, FL 2,653 5.4%
Houston, TX 4,672 6.2%
New York, NY 13,989 12.5%

New Hotels w/ 50,000+ Sqft Meeting Space
12
9
5
2
0
2 2
2008 2009 2010 2011 2012 2013 YTD 2014
Total U.S. Count of New Hotels with 50k+ Sqft of meeting space By year, 2008 – YTD 2014

Where are we headed?
5
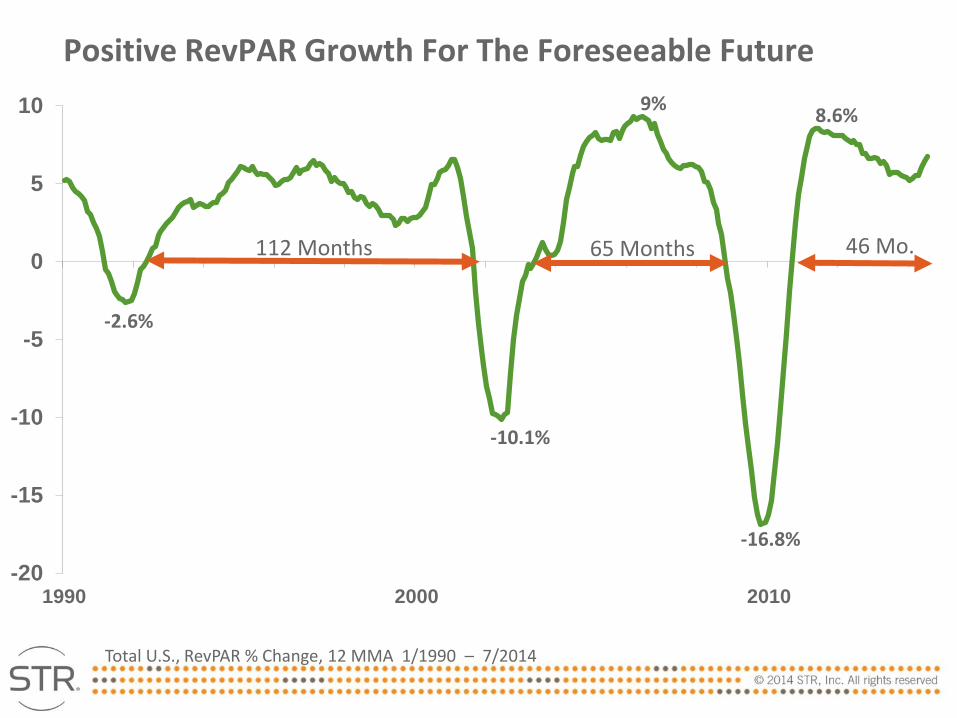
Positive RevPAR Growth For The Foreseeable Future
-20
-15
-10
-5
0
5
10
1990 2000 2010
-16.8%
-2.6%
-10.1%
9% 8.6%
Total U.S., RevPAR % Change, 12 MMA 1/1990 – 7/2014
65 Months 46 Mo. 112 Months

Total United States Key Performance Indicator Outlook (% Change vs. Prior Year) 2014 - 2015
U.S. Outlook
2014 Forecast
2015 Forecast
Supply 1.0% 1.3%
Demand 3.6% 2.1%
Occupancy 2.6% 0.7%
ADR 4.2% 4.4%
RevPAR 6.9% 5.2%

2014 Year End Outlook
U.S. Chain Scales Occupancy
(% chg) ADR
(% chg) RevPAR (%chg)
Luxury -0.1% 4.6% 4.5%
Upper Upscale 2.0% 4.4% 6.5%
Upscale 2.0% 4.4% 6.5%
Upper Midscale 2.6% 3.3% 6.0%
Midscale 3.0% 3.5% 6.6%
Economy 2.9% 3.9% 6.8%
Independent 2.8% 4.6% 7.5%
Total United States 2.6% 4.2% 6.9%
As of August 12th , 2014
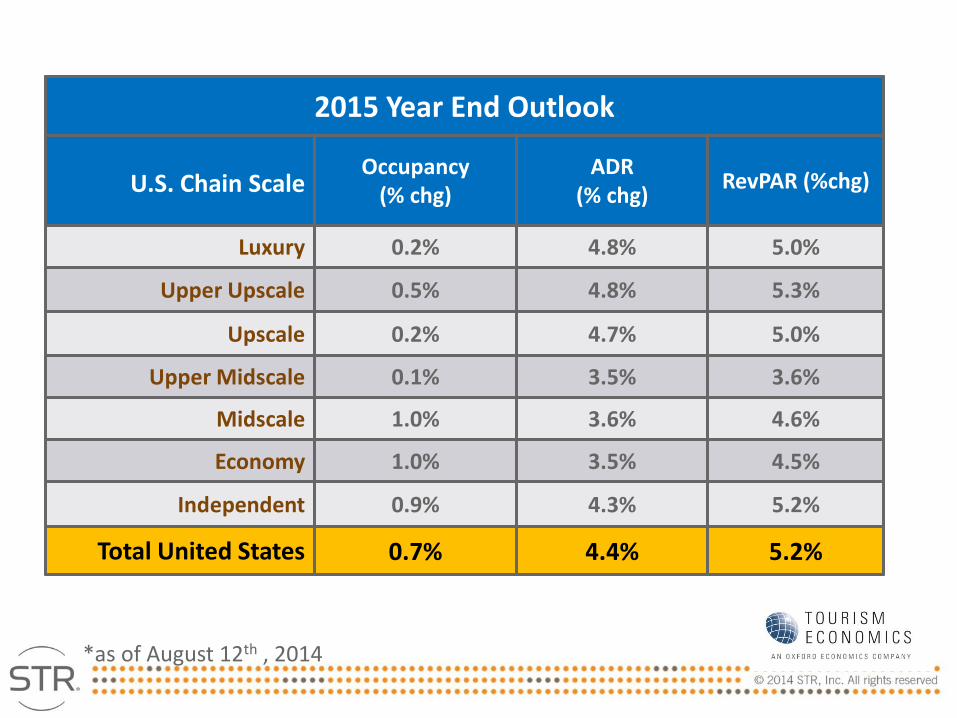
2015 Year End Outlook
U.S. Chain Scale Occupancy
(% chg) ADR
(% chg) RevPAR (%chg)
Luxury 0.2% 4.8% 5.0%
Upper Upscale 0.5% 4.8% 5.3%
Upscale 0.2% 4.7% 5.0%
Upper Midscale 0.1% 3.5% 3.6%
Midscale 1.0% 3.6% 4.6%
Economy 1.0% 3.5% 4.5%
Independent 0.9% 4.3% 5.2%
Total United States 0.7% 4.4% 5.2%
*as of August 12th , 2014

-5% to 0% 0% to 5% 5% to 10% 10% to 15% 15%+
Chicago Anaheim Atlanta Nashville
New Orleans Detroit Boston
New York Houston Dallas
Norfolk Los Angeles Denver
Philadelphia Miami San Francisco
Washington Minneapolis Seattle
Oahu Tampa
Orlando
Phoenix
San Diego
St. Louis
2014 Year End RevPAR Forecast
Top 25 U.S. Markets, August 2014 Forecast (Markets sorted alphabetically)

2015 Year End RevPAR Forecast
-5% to 0% 0% to 5% 5% to 10% 10% to 15%
New York Atlanta Anaheim Nashville
New Orleans Boston
Norfolk Chicago
Philadelphia Dallas
Washington Denver
Detroit Houston
Los Angeles
Miami
Minneapolis
Oahu
Orlando Phoenix
San Diego
San Francisco
Seattle
St. Louis
Tampa
Top 25 U.S. Markets, August 2014 Forecast (Markets sorted alphabetically)

To Recap…
• Life is Great! ‘Fish While the Fishing is Good’
• Demand Growth: Strong & Steady
• Group Demand: Still Wild Card (but better!)
• Supply growth: Not an Issue, yet
• YE RevPAR Forecast: Rosy!
