unit 5 reasearch project - referel - isabel collins
TRANSCRIPT
Unit 5 Research Project
Worthing College Sports ScienceIsabel Dunn Collins
2015

P2: Carry out / P4: Produce
To investigate if power and flexibility differences exist between 16-18 female
participation standard dancers and non-dancers.

Abstract
The aim of this project was to find out weather there were any differences between power and flexibility in dancers and non-dancers, this project was interesting as I was using 2 variables and 2 samples (dancers, non-dancers)the method used to find out the differences were the sit and reach box test and the vertical jump test,10 dancers and 10 non-dancers were used for both test (aged 16-18), the test were conducted 3 times to collect the best average of each subject. The results showed differences in flexibility, the dancers had more flexibility in the hips than the non-dancers by using excel I typed in the results from each subject and calculate the mean,medium,mode and rage, I found differences between the dancers who did other sports and the dancers who only specialized in dance and the results showed that the dancers that did more sports were generally more powerful but not such a big difference in flexibility, on the other hand the power test showed that the dancers also had more power in their legs than the none dancers and this could be due to their fitness levels as well as their training. However in the group of none dancers I saw a difference in a few of the participants so I looked through my questionnaires and found out that one of them did cheerleading and one of them did gymnastics which meant that they were more flexible than the rest of the none dancers.
I.D.Collins. sports and exercise science.2015.to investigate if power and flexibility differences exist between 16-18 female participant standard dancers and non-dancers.
P2: Carry out / P4: Produce
To investigate if power and flexibility differences exist between 16-18 female participation standard dancers and non-dancers.

Contents: GeneralP1P2 aim P3 abstract P4 general contents p1-26P5 contents appendix P6 contents figures and tablesP7 acknowledgement P8 introduction P9 literature reviewsP10 project hypothesisp11 method P12 data collectionP13 data analysisP14 results P15 discussion p16 conclusionP17 review 1P18 review 2P19 review 3
P2: Carry out / P4: Produce
P20 future recommendations 1P21 future recommendations 2P22 future recommendations 3P23 future recommendations 4P24 research project appendices P25 appendix 1P26 appendix 2P27 appendix 3P28 figures and tables P29 figures and tables 1 P30 figures and tables 2 P31 figures and tables 3P32 figures and tables 4P33 figures and tables 5

Contents: Appendices
P27 appendix 1 questionnaire p28 appendix 2 ParQ questionnaire
P2: Carry out / P4: Produce
Contents: Figures and Tables
P33 table used to collect data P34 graph used for analysis
P2: Carry out / P4: Produce

AcknowledgementsI would like to thank the subjects used to conduct the two test, I would not have been able to carry out this investigation and get good specific results without them, also the help of other peoples research found online helped me develop my tests to make sure no mistakes were made.
P2: Carry out / P4: Produce
Introduction
I am a Sport Science student and I am investigating whether power and flexibility differences exist between 16-18 female participation standard dancers and non-dancers.I choose to do this project on dancers and non-dancers because all the review found weren't the same as my aim so as far as I knew I thought it would be new helpful research to other, dance is also my greatest interest and I am passionate.
I’m hoping the literature reviews will help my research be perfected by looking at their research and seeing their mistakes , once I collect my data I will be able to compare it to other data found, my project aim could possibly help dance teachers find other ways of increasing flexibility on non-dancers and could also be used to improve further research on flexibility and power on different individuals I found my aim at the beginning of February 2015 and will be finishing it by April 2015.
P2: Carry out / P4: Produce
Literature Review and References
https://worthingsportscience.wordpress.com/2015/03/23/unit-5-literature-review-isabel-dunn-collins/
P2: Carry out / P4: Produce

Project Hypothesis
1. Dancers are likely to be more flexible than non-dancers2. Dancers are also likely to have more power in their legs as
they are always jumping and leaping.3. Dancers that participate in other sports are likely to have
more power and stronger muscles than a dancer who only takes part in dance.
P2: Carry out / P4: Produce

MethodMy research is quantitative as I chose it to show differences between dancers and non-dancers my aim is To investigate if power and flexibility differences exist between 16-18 female participation standard dancers and non-dancers.This data is classifies as primary and is also nominal data this is because I'm grouping my participants.I started by collecting 10 dancers and 10 non-dancers I picked the non-dancers at random from my college and used 10 dancers from AS. Before I started testing I gave them a parQ questionnaire followed by a warm up for health and safety, each warm up relates to power or flexibility.I constructed a Jump test by using a wall and a metre ruler to measure how high they jump, followed by a sit and reach test completed with a sit and reach box,These test took place in the dance studio. I chose to do these test to ensure the validity of the results to give me the results I plan to get, to make sure that my results are reliable I have made sure each test was completed 3 times and used the best number from each participant, conducting the test 3 times also helps achieve precise and accurate results this is because if I only did the test once the result could be a fluke. I will be collecting all the results on a table and then putting them onto a graph that shows the differences in measures.
P3: Collect and record / M2: Correctly analyse & describe techniques / D1: Correctly analyse & explain techniques

Data CollectionAll of my data was primary data as I was using questionnaires, PARQ test and graphs, my questioners included open and closed questions. I'm broke my data up into nominal as I am putting them into categories of dancers /non-dancers and flexibility/power.my experimental research is laboratory based to find out the deference's in dancers and non-dancer power and flexibility , the reason I chose to use primary data is because it helped me study the subjects them self's which will helped me analyse my results and explain any differences if there were any.I used mean, medium and mode which helped me see who's more flexible and who has more power. I choose to use a parQ because I needed to make sure all the subjects were healthy enough to take part in the test.my research is also qualitative as the aim is to find defences in two different variables and two groups of different samples. The results were collected on a table so that I could take a look at them and they could be placed on a graph in order to show the levels of power and flexibility. The data collected is discrete this is because its giving me a specific answer so dancers have more flexibility than non-dancers. I have found using comparative research has been interesting as you get to see how different two people can be.
P3: Collect and record / M2: Correctly analyse & describe techniques / D1: Correctly analyse & explain techniques
Data Analysis
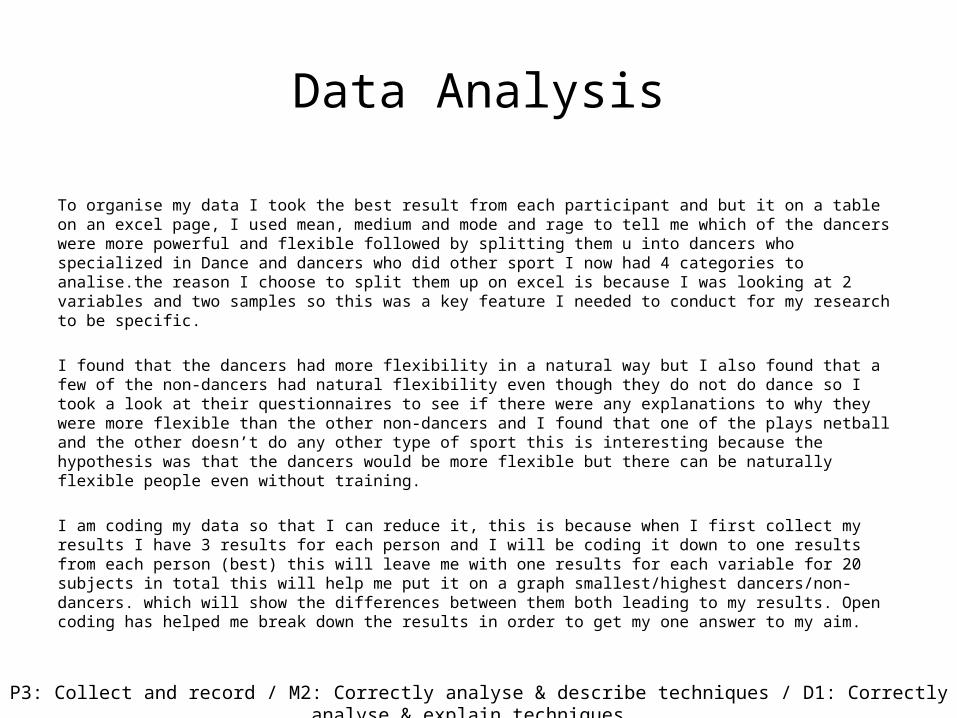
To organise my data I took the best result from each participant and but it on a table on an excel page, I used mean, medium and mode and rage to tell me which of the dancers were more powerful and flexible followed by splitting them u into dancers who specialized in Dance and dancers who did other sport I now had 4 categories to analise.the reason I choose to split them up on excel is because I was looking at 2 variables and two samples so this was a key feature I needed to conduct for my research to be specific.
I found that the dancers had more flexibility in a natural way but I also found that a few of the non-dancers had natural flexibility even though they do not do dance so I took a look at their questionnaires to see if there were any explanations to why they were more flexible than the other non-dancers and I found that one of the plays netball and the other doesn’t do any other type of sport this is interesting because the hypothesis was that the dancers would be more flexible but there can be naturally flexible people even without training.
I am coding my data so that I can reduce it, this is because when I first collect my results I have 3 results for each person and I will be coding it down to one results from each person (best) this will leave me with one results for each variable for 20 subjects in total this will help me put it on a graph smallest/highest dancers/non-dancers. which will show the differences between them both leading to my results. Open coding has helped me break down the results in order to get my one answer to my aim.
P3: Collect and record / M2: Correctly analyse & describe techniques / D1: Correctly analyse & explain techniques

Results
• Once I analysed my research I started taking a look at my results to find any correlations or any differences I saw that Dancers have higher levels of power than they did flexibility, I found this interesting as flexibility is a key thing in a dancers performance the more flexible you are the better the dance looks and the more fluid it is this does not link directly to my hypotheses but it does link to the fact I knew they would have higher level of power in their legs.
• I was surprised by the graphs for both dancers and dancers who do sports because they didn’t show many differences which contradicted a part of my hypothesis as I thought that the dancers who attended other sports would have more power and flexibility, although results did show higher revels of the two variables in the females who also took part in cheerleading and gymnastic, but also the dancers used are still in their first year and their flexibility will increase as the year goes on.
• Looking at the normative data tables I saw that all of the dancers are above average or excellent were as the non-dancers and average or good this links to my first hypotheses as I thought dancers would be more flexible and have more power

DiscussionI believe that the results I will collect from the dancers will be similar the same as all the dancers results will all be similar and they will all seem to have a similar degree of flexibility in the hips.I also think that all the results collected for the dancers will be above average if not excellent when compared to the normative table and the non-dancers will be average and possibly below average. There are similarities between dancers and non-dancers that do sports their power levels aren't too different.The people who take part in other sports dancers and non-dancers will be more powerful and more flexible than the rest of the subjects in their category which links to my hypotheses. This also matches my results.The deference between a dancer and a non-dancer can vary this is because the dancer has more power but if the non-dancer takes part in a more intensive sport such as rugby that person is also likely to have a good level of power within the legs. My reviews show results from a wide sample for example the research by J. Michael Ryan (2003) used 20 students from 5 different schools and that research did show defences in dancers and dancers who do sport as well as dance.
P2: Carry out / P4: Produce

ConclusionMy aim was to investigate if power and flexibility differences exist between 16-18 female participation standard dancers and non-dancers.
The key trends found in my literacy review was that all dancers had a lot more power and flexibility than people who didn’t dance, an interesting thing I found was that one of my non-dancers took part in gymnastics which took her power and flexibility levels close to the dancers level.
In conclusion my research is newer than a lot of the research I found related to my aim therefore making it more reliable the only disadvantage is my number of population as it isn't very big. my results met my hypotheses as they show that generally speaking dancers are stronger and have more flexibility, I also found that the dancers that did other sports as well as dancing had more power accept their flexibility levels weren't that much of a difference from the other dancers that only take part in dance. The results also support my discussion because I predicted that the two groups would have similar results within their category average.
This tell me that the non-dancers do not use flexibility often apart from two subjects who showed higher results than the other this was interesting so I took a look at their question air and parQ test to see if anything they do would have given me these results and I found one of the non-dancers plays netball which makes her more flexible than the subjects who do not do sports at all. The graph shows a positive correlation between the flexibility results for the non-dancers.
P2: Carry out / P4: Produce
Review (1/3)
My conclusion met my aim well because my aim was to find out the differences in dancers and non-dancers and their levels of flexibility and power, in my conclusion it shows that dancers have a lot more flexibility and power than non-dancers.something I found was that the dancers and non-dancers that did other sports were stronger and more flexible. This is good because my aim has been answered by also finding differences in the dancers themselves. My aim chosen was also a strength because of my acknowledgement of dance it self.
P5: Describe / M3: Explain / D2: Justify

Review (2/3)A great interest in my project was the use of the two different variables power/flexibility this is because it gave me more to look at and more to find more information which made it a lot more interesting than if I was only looking at flexibility.It was also good having to look at the two different groups of people as there is a lot of theories about flexibility and people being ‘born flexible‘ so having to find out for myself was good. Comparing the results to normative data was a strength as I was able to see at where the subjects should be and weather they are as good as they should be or not.Doing my test three times was a positive thing because I was able to take the best result out of 3 which made it more accurate and reliable.
P5: Describe / M3: Explain / D2: Justify

Review (3/3)The only struggle I found about this project was collecting the subjects in order to conduct the test this is because there was too many cancellations and I felt as if I couldn't really rely on them. Because of this I had to do all the test at different times with different people which was stressful. Next time I will have to have a back up plan and maybe do smaller groups at a time that just means I would need a larger timescale.
P5: Describe / M3: Explain / D2: Justify
Future Recommendations (1/5)
Next time I was thinking of researching power and flexibility against different type of dancers for example; street dance, ballet, tap dance ,Bollywood and many others, the reason I would like to do this is because all types of dance are different and a ballet dancer may be more likely to be more flexible than a tap, Bollywood dancer. The research found by Silva AH, Borodino KC (2008) got me interested in testing different dancers as she found differences in ballet dancers and contemporary dancers.
P4: Produce / P5: Describe / M3: Explain / D2: Justify

Future Recommendations (2/5)10 subjects of each category wasn’t enough as I didn’t feel that I had a wide range to compare in order to give me accurate results that apply to many other dancers and dance teachers.A wider range of students would have been more reliable there are many dance schools in the world and millions of dancers so 10 dancers being tested doesn’t give you a good conclusion, an accurate method would have a larger sample (100) when I tested differences between dancer specialist and dancers that do another sport there was 4 female in one group and 6 in the other which also didn’t give me a wide range to compare.In my literacy reviews they used a wider sample of people male/female given other researchers a reliable result.
P4: Produce / P5: Describe / M3: Explain / D2: Justify

Future Recommendations (3/5)
For further research I could use different test that measure flexibility and power which could give me different results to the ones I have and maybe just look into power and strength and conduct 3 /4 different ways of measuring power in deferent parts of the body upper/lower;1 rep max this test would be good as you're only doing one quick explosive movement leading to power.• Bench press • Squats squat For flexibility I could conduct a v-sit test, groin flexibility test, calf muscle flexibility test.
P4: Produce / P5: Describe / M3: Explain / D2: Justify

Future Recommendations (4/5)
• In the future a good thing that would improve project aims is using more experienced dancers as the dancers used for this project were in their first year which means that their power and flexibility still need to increase throughout the year.
Research Project Appendices

Appendix 1 Questionnaire Name:Contact details:Emergency contact: Are you currently taking part in any dance classes outside of college? Yes no 1a) if so how many times per week? 2 3 4 5 or more 1b) if yes how long have you been doing it for?
2-4 4-6 6 or more years Are you currently playing another sport on a regular basis? Yes No 2a) if so how many times per week? 1 2 3 4 5 6 or more 2b) if yes how long for?
0-2 2-4 4-6 6+ Following question 5 in the parQ questionnaire if your answer was yes, are you being treated for the injury and does it affect your level of physical activity?

Appendix 2
PARQ TEST http://www.fbpt.co.uk/PARQ.pdf

Appendix 3

Research Project Figures and Tables

Figures and tables 1 Non-dancers
P3: Collect and record / M2: Correctly analyse & describe techniques / D1: Correctly analyse & explain techniques
Category Sit and Reach (cms)Vertical Jump (cm) Other Sport
Non-Dancer 1 20 73 nothingNon-Dancer 2 18 52 nothingNon-Dancer 3 22 63 netballNon-Dancer 4 28 59 nothingNon-Dancer 5 19 65 netballNon-Dancer 6 18 50 nothingNon-Dancer 7 22 70 gymnasticsNon-Dancer 8 20 71 nothingNon-Dancer 9 15 62 nothingNon-Dancer 10 11 57 nothing
Mean 19.3 62.2
Minimum 0 11
Max 28 73
Range 28 62
Median 19.5 62.5
Mode 20 #N/A
Mean Minimum Max Range Median Mode0
10
20
30
40
50
60
70
80
Sit and Reach (cms) 20 18 22 28 19 18 22 20 15 11Vertical Jump (cm) 73 52 63 59 65 50 70 71 62 57Other Sport nothing nothing netball nothing netball noth-ing gymnastics nothing noth-ing nothing

Figures and tables 2
MeanMinimum Max Range Median Mode0
10
20
30
40
50
60
70
80
90
Sit and Reach (cms) 30 32 39 31 36 34 40 29 24 33Vertical Jump (cm) 82 76 69 73 68 75 84 81 78 66Other Sport netball dance dance dance cheerleader marshal arts gymnastics dance dance dance
Category Sit and Reach (cms) Vertical Jump (cm) Other Sport
Dancer 1 30 82 netball
Dancer 2 32 76 dance
Dancer 3 39 69 dance
Dancer 4 31 73 dance
Dancer 5 36 68 cheerleader
Dancer 6 34 75 marshal arts
Dancer 7 40 84 gymnastics
Dancer 8 29 81 dance
Dancer 9 24 78 dance
Dancer 33 66 dance
Mean 32.8 75.2
Minimum 0 24
Max 40 84
Range 40 60
Median 32.5 75.5
Mode #N/A #N/A

Figures and tables 3Category Sit and Reach (cms) Vertical Jump (cm) Other Sport
Dancer Specialist 32 76 dance
Dancer Specialist 39 69 dance
Dancer Specialist 31 73 dance
Dancer Specialist 29 81 dance
Dancer Specialist 24 78 dance
Dancer Specialist 33 66 dance
Dancer Specialist
Dancer Specialist
Dancer Specialist
Dancer Specialist
Mean 31.33333333 73.83333333
Minimum 0 24
Max 39 81
Range 39 57
Median 31.5 74.5
Mode #N/A #N/A
Dancer
Speci
alist
Dancer
Speci
alist
Dancer
Speci
alist
Dancer
Speci
alist
Mean
Minimum
MaxRan
ge
Median
Mode0
10
20
30
40
50
60
70
80
90
Sit and Reach (cms) 32 39 31 29 24 33Vertical Jump (cm) 76 69 73 81 78 66Other Sport dance dance dance dance dance dance

Figures and tables 4Category
Sit and Reach (cms) Vertical Jump (cm) Other Sport
Dancer and Sports person 40 84 gymnasticsDancer and Sports person 30 82 netballDancer and Sports person 36 68 cheerleaderDancer and Sports person 34 75 marshal artsDancer and Sports personDancer and Sports personDancer and Sports personDancer and Sports personDancer and Sports personDancer and Sports person
Mean 35 77.25
Minimum 0 30
Max 40 84
Range 40 54
Median 35 78.5
Mode #N/A #N/A
Dancer
and Sp
orts pers
on
Dancer
and Sp
orts pers
on
Dancer
and Sp
orts pers
onMea
nMax
Median
0
10
20
30
40
50
60
70
80
90
Sit and Reach (cms) 40 30 36 34Vertical Jump (cm) 84 82 68 75Other Sport gymnastics netball cheerleader marshal arts

Normative data for the sit and reach test and vertical jump test
Sit and reach test norms
Vertical jump test