ukraine second edition country profile decent work · tematic information on rights at work and...
TRANSCRIPT

Decent WorkCountry Profile
UKRAINESecond Edition
ILO
DECE
NT
WOR
K CO
UN
TRY
PROF
ILE
UKR
AIN
E Se
cond
Edi
tion
ISBN 978-92-2-127900-6
Published by the International Labour Office (ILO)with financial assistance from the European Union under the ILO/EC Project “Monitoring and Assessing Progress on Decent Work” (MAP).
Ukraine_Cover_E_Second Edition.indd 1Ukraine_Cover_E_Second Edition.indd 1 16.09.13 10:3516.09.13 10:35

Decent WorkCountry Profile
UKRAINESecond Edition
Ukraine_E_Second Edition.indd iUkraine_E_Second Edition.indd i 16.09.13 10:4016.09.13 10:40

Copyright © International Labour Organization 2013
Publications of the International Labour Office enjoy copyright under Protocol 2 of the Universal Copyright Conven-tion. Nevertheless, short excerpts from them may be reproduced without authorization, on condition that the source is indicated. For rights of reproduction or translation, application should be made to the Publications Bureau (Rights and Permissions), International Labour Office, CH-1211 Geneva 22, Switzerland. The International Labour Office welcomes such applications.
Libraries, institutions and other users registered in the United Kingdom with the Copyright Licensing Agency, 90 Tot-tenham Court Road, London W1T 4LP [Fax: (+44) (0)20 7631 5500; email: [email protected]], in the United States with the Copyright Clearance Center, 222 Rosewood Drive, Danvers, MA 01923 [Fax: (+1) (978) 750 4470; email: [email protected]] or in other countries with associated Reproduction Rights Organizations, may make photocopies in accordance with the licences issued to them for this purpose.
ILO Cataloguing in Publication Data
Decent work country profile: Ukraine / International Labour Office, ILO/EC Project “Monitoring and Assessing Progress on Decent Work” (MAP). – Geneva: ILO, 2013
ISBN: 978-92-2-127900-6 (print)ISBN: 978-92-2-127901-3 (web pdf)
International Labour Officedecent work / employment / employment opportunity / equal pay / hours of work / family responsibilities / employment security / social security / social dialogue / equal rights / Ukraine
13.01.1
General revision and editing of the document: V.V. Ivankevych, Director-General, Institute of Social Development, Pub-lic Health, Social Insurance and Lending; Igor Chernyshev, MAP/INTEGRATION ILO Geneva.
The designations employed in ILO publications, which are in conformity with United Nations practice, and the presenta-tion of material therein do not imply the expression of any opinion whatsoever on the part of the International Labour Office concerning the legal status of any country, area or territory or of its authorities, or concerning the delimitation of its frontiers.
The responsibility for opinions expressed in signed articles, studies and other contributions rests solely with their authors, and publication does not constitute an endorsement by the International Labour Office of the opinions expressed in them.
Reference to names of firms and commercial products and processes does not imply their endorsement by the Interna-tional Labour Office, and any failure to mention a particular firm, commercial product or process is not a sign of disap-proval.
This document has been produced with the financial assistance of the European Union. The views expressed herein can in no way be taken to reflect the official opinion of the European Union.
ILO publications can be obtained through major booksellers or ILO local offices in many countries, or direct from ILO Publications, International Labour Office, CH-1211 Geneva 22, Switzerland. Catalogues or lists of new publications are available free of charge from the above address, or by email: [email protected]
Visit our website: www.ilo.org/publns and www.ilo.org/map
Printed by the International Labour Office, Geneva, Switzerland
Ukraine_E_Second Edition.indd iiUkraine_E_Second Edition.indd ii 16.09.13 10:4016.09.13 10:40

Decent work is central to efforts to reduce poverty and is a means for achieving equitable, inclusive and sustainable development. Decent work sums up the aspirations of people worldwide in their working lives – their aspirations to opportunity and income; to rights, voice and recognition; to family stability and personal development; and to fairness and gender equality.
Monitoring and assessing progress towards decent work at the country level is a long-standing concern for the ILO and its constituents. The Decent Work Agenda comprises four inseparable, interrelated and mutu-ally supportive pillars: employment promotion, rights, social protection and social dialogue. Its multifac-eted nature means that measurement is a complex task. Thus, in 2008 the International Labour Conference adopted the ILO Declaration on Social Justice for a Fair Globalization which recommends that member States may consider “the establishment of appropriate indicators or statistics, if necessary with the assist-ance of the ILO, to monitor and evaluate progress made” on decent work (Paragraph II B ii).
Following a Tripartite Meeting of Experts (TME) on the Measurement of Decent Work held in Septem-ber 2008, the ILO adopted a framework of Decent Work Indicators based on technical guidance provided by the TME. The Governing Body endorsed the proposal to test the framework in a limited number of pilot countries. Since then, the so-called Decent Work Country Profiles have been developed for a number of countries.
In the past, countries have repeatedly called for the ILO to support their efforts to monitor and assess progress towards decent work. With funding from the European Union, the project on Monitoring and Assessing Progress on Decent Work (MAP) (2009–2013) works with government agencies, employers’ and workers’ organizations, as well as research institutions to strengthen the capacity to self-monitor and self-assess progress towards decent work. Based on consultations with tripartite constituents and various stake-holders, nine countries have been selected to participate in the global MAP project (see www.ilo.org/map).
The project facilitates the identification of decent work indicators that are relevant at the national level, supports data collection, and uses the collected data for an integrated policy analysis of decent work in order to make them relevant for decent work country programmes and national policies. The project also supports regional activities (regional database, training), and global activities (methodological tools, guidelines and manuals on measuring and assessing progress on decent work).
Ukraine is one of the countries participating in the MAP project and completed its first Decent Work Country Profile in 2011. This first edition of the Profile was discussed in a tripartite validation workshop and launched through a media conference in May 2011. An updated version of the Profile has been pro-duced in 2012 and presented at the National Training and Knowledge-Sharing Workshop on Measuring and Monitoring Progress on Decent Work (24-25 September 2012, Lviv, Ukraine). This second edition includes recent data (2010-2011) and revised data for 1998-2009.
In order to capture all four dimensions of the concept of decent work, the country profiles contain sys-tematic information on rights at work and the legal framework for decent work in addition to statistical Decent Work Indicators. The economic and social context for decent work is outlined and ten thematic
Preface
Ukraine_E_Second Edition.indd iiiUkraine_E_Second Edition.indd iii 16.09.13 10:4016.09.13 10:40

Decent Work Country Profile UKRAINE Second Editioniv
areas are covered, ranging from employment opportunities to combining work and family life to social dialogue.
The Country Profiles cover ten substantive elements corresponding to the four strategic pillars of the Decent Work Agenda (full and productive employment, rights at work, social protection and the pro-motion of social dialogue): employment opportunities; adequate earnings and productive work; decent hours; combining work, family and personal life; work that should be abolished; stability and security of work; equal opportunity and treatment in employment; safe work environment; social security; and, social dialogue, employers’ and workers’ representation.
The profiles compile in one document all available data on decent work, statistical and legal indicators, as well as analysis of gaps and trends where possible, while reflecting on the national context. This facilitates the evaluation of progress made towards decent work and informs national planning and poli-cymaking. The profiles can inform initiatives such as Decent Work Country Programmes and regional activities.
The Country Profiles have led to a better understanding of the role that the decent work indicators can play in the ILO country-level activities, especially for designing and monitoring the Decent Work Country Programmes. The decent work indicators can serve as a reliable baseline at the stage of defin-ing decent work targets, and as a powerful instrument for the evaluation of the Decent Work Country Programmes.
This second edition of the Decent Work Country Profile for Ukraine aims at critically assessing progress towards the achievement of decent work in Ukraine and at further informing social dialogue at the national level.
Stephen PurseyDirector
Policy Integration DepartmentGeneva
Mark LevinDirector
Country Office for Centraland Eastern Europe
Ukraine_E_Second Edition.indd ivUkraine_E_Second Edition.indd iv 16.09.13 10:4016.09.13 10:40

The global economic crisis put an abrupt end to almost a decade of buoyant economic growth in Ukraine. Economic activity contracted sharply with a large proportion of heavy industry clos-ing temporarily or operating far below capacity. Real GDP shrank by some 20 per cent and labour market conditions deteriorated dramatically (see Chapter 1 ‘Economic and social context for decent work’). This led to a significant expan-sion of involuntary part-time work, administered leave and an explosion in wage arrears. An Inter-national Monetary Fund (IMF) stand-by agree-ment of $16.4 billion has restored a degree of eco-nomic health – with an agreed GDP deficit fixed at six per cent – tied to reductions in public sector expenditures. Economic growth resumed in 2010 and the labour market began a tentative recovery that is continuing.
Between 2000 and 2008, the Ukrainian economy grew on average 6.9 per cent per year. This steady growth rate was achieved through reform meas-ures and thanks to favourable trading terms and inflow of capital. The global crisis, as well as leav-ing its own problems, exposed Ukraine’s structural weaknesses: a crumbling infrastructure, insecure property rights, an ageing population and sys-temic corruption. Moving forward, Ukraine needs to strengthen official labour market and social data to fully capture changes in social indicators and monitor progress towards decent work.
Prior to the crisis, employment growth for the population aged 15 to 64 averaged 0.6 per cent per year between 2000 and 2009, suggesting very low labour absorption despite higher economic growth rates. This is testament to the lingering effects of the 1990s transition period when Ukraine was consolidating its market economy after the fall of communism. The employment-to-population ratio for 15 to 70 year olds dropped to 57.7 per cent in 2009 as a result of the global crisis, although recovered its pre-crisis level by 2011. Despite crisis recovery, Ukraine continues to face chal-
lenges in both employment creation and improve-ment of working conditions. The quality of jobs created is a particular challenge, as employment in the informal economy has increased substan-tially: an extra 1.7 million people were working in the informal economy in 2011 compared to 2000. Reforms to the social security system are hoped to reverse this trend (see Chapter 2 ‘Employment opportunities’).
Over the last decade, there has been a strong increase in average in wages, although minimum wage remains very low. Wage arrears, which became a widespread phenomenon in the 1990s, had been pushed back, until the economic crisis caused a renewed upsurge of the problem (see Chapter 3 ‘Adequate earnings and productive work’). Needed wage policy responses are still being discussed with the Government, social part-ners and the IMF with a view to increasing pur-chasing power and pursuing economic reforms.
Ukraine has enacted legislation to regulate work-ing time at a statutory duration of 40 hours per week, although it has yet to ratify the ILO Hours of Work (Industry) Convention, 1919 (No. 1). In 2011, 11 per cent of people worked excessive hours (more than 48 hours per week), mainly to increase earnings. The majority of people work-ing excessive hours were employed in: wholesale and retail trade, motor vehicles repair, personal goods and household appliances, tourism, con-struction and agriculture. Underemployment affects eight per cent of employees, down from a recent high in 2009 of some 20 per cent. Over the last thirteen years, progress towards improv-ing working conditions for all, and especially for vulnerable groups has been registered despite the economic crisis (see Chapter 4 ‘Decent working time’). Such measures should be consolidated and enhanced in order to decrease the number of persons who work excessive hours, tackle under-employment and reduce involuntary part-time employment.
Summary
Ukraine_E_Second Edition.indd vUkraine_E_Second Edition.indd v 16.09.13 10:4016.09.13 10:40

Decent Work Country Profile UKRAINE Second Editionvi
Combining work, family and personal life is a complex goal to attain in Ukraine. People’s percep-tion of the difficulty in finding a balance between work and family life varies and depends on the age of workers, with the most affected age bracket generally being between 25 and 40 years. People who do not work as a result of family responsibili-ties make up over a quarter of the economically inactive population. A survey on decent work con-ducted in 2003 revealed that almost 28 per cent of women and more than 24 per cent of men said it was quite difficult or impossible to combine work with family life. This is an increasingly important reason for workers to remain outside the labour force, with women’s labour market participation suffering the most, especially in rural areas. As much of family responsibility falls on women, they tend to take more maternity and parental leave and often find themselves marginalized in the labour market (see Chapter 5 ‘Combining work, family and personal life’). Labour and social security authorities pay maternity benefits to different groups of women including the registered unem-ployed and those out of work, students in higher education institutions and medical practitioners. Substantial investments in enabling a better work life balance are needed, as is a stronger emphasis on gender equality, particularly as Ukraine is has an increasing ageing population.
The Worst Forms of Child Labour Convention, 1999 (No. 182) was ratified in 2000. However, individuals under the age of 18 are still allowed to perform certain types of hazardous work for training purposes or under certain specific con-ditions. The worst forms of child labour prevail in agriculture, street trade, informal coalmines, the entertainment industry, sex industry and ille-gal activities (see Chapter 6 ‘Work that should be abolished’). A 1999 study showed that 3.8 per cent of children aged from five to 17 years old were engaged in economic activities with a higher prevalence among boys (4.9 per cent) than girls (2.7 per cent). Moreover, the public education system suffers from a chronic lack of funds and children from poor families often leave school early. Since 1991, approximately 100,000 Ukrainian citizens have become victims of human trafficking, mainly for labour exploi-tation. Large-scale child prostitution and traf-
ficking in children remain serious problems in Ukraine.
Employment security means a shift from security in a specific job, to security resulting from higher employability through access to training and skills employment. Despite improvements in the 2000s, security of employment for Ukrainian workers, whether in formal or informal jobs, remains low. Compliance with labour legislation is limited due to weak state supervision and enforcement; this has led to a highly flexible labour market with a very low level of protection for workers. The onset of the global economic crisis in 2008 resulted in a significant deterioration of the stabil-ity and security of work in Ukraine. This is evident from the increasing pace of job losses that drove the unemployment rate to nine per cent in 2009. Time related under-employment also increased significantly (see Chapter 7 ‘Stability and secu-rity of work’). In rural areas, a rise in the number of self-employed people between 2008 and 2009, particularly in subsistence farming, resulted from the closure of large agricultural farms coupled with a lack of decent jobs in the non-agricultural sector. Since 2010, some of these trends have been reversed, for example unemployment and underemployment have both decreased, however employment in the informal sector remains stub-bornly high at over 20 per cent.
Ukraine has undertaken important steps in the establishment of a legal and institutional frame-work that promotes gender equality and tackles discrimination (see Chapter 8 ‘Equal opportunity and treatment in employment’). While legislative progress is evident, the implementation of legisla-tion and the development of appropriate policies are lagging behind. Gender discrimination persist meaning women and men face limited opportuni-ties in public and private life. The gender pay gap remains high at 25 per cent despite higher levels of educational attainment by women.
Occupational safety and health is an important indicator of decent work in a country, as it demon-strates that work should on no account be under-taken at the detriment of a worker’s health. Over the last 13 years, the incidence of non-fatal inju-ries has decreased, while only gradual reductions
Ukraine_E_Second Edition.indd viUkraine_E_Second Edition.indd vi 16.09.13 10:4016.09.13 10:40

viiSummary
in fatal occupational injuries have been made. A decline to 5.5 deaths per 100,000 workers was registered between 2008 and 2009 and has been maintained since. Some 72.7 per cent of work-place accidents result from organization problems in the workplace; technical problems cause 12.1 per cent, and psycho-physiological issues another three per cent of accidents. The general reduction in the rates of occupational injuries and fatali-ties may reflect a shift of the employment struc-ture rather than an improvement in occupational safety and health implementation; less people are now employed in high risk sectors such as coal mining and the service sector is growing, while labour inspections remain limited and lack techni-cal capacity (see Chapter 9 ‘Safe work environ-ment’).
Ukraine’s social security system covers the nine main branches listed in the ILO Social Secu-rity (Minimum Standards) Convention, 1952 (No. 102), with special provisions for victims of the Chernobyl nuclear accident and for veterans of the Second World War. From a low base of 13.6 per cent of total budget expenditure in 1998, state social security expenditure reached a high of 27.6 per cent in 2010, before falling to 25 per cent in 2011. Ukraine has taken major steps in shifting from patchy and shallow social insurance system to a more unified and coherent framework of social
benefits (see Chapter 10 ‘Social security’). None-theless, despite an ageing population and the pros-pect of growing inter-generational inequalities, the share of the working-age population that contrib-utes to the pension fund remains insignificant. At the same time, some 3 million people over retire-ment age were still working. Reforms to several areas of the social security system are still under discussion, with policy areas under review, includ-ing a reformed uniform social contribution sys-tem, health care and mandatory private pension.
Social dialogue in Ukraine has remained under-developed both in its bipartite and tripartite forms (see Chapter 11 ‘Social dialogue, employers’ and workers’ representation’). A new Labour Code, in draft form since 2002, has yet to be adopted, thus preventing the industrial relations system from functioning on a sound legal and institutional basis. Despite the Law on social dialogue that was recently adopted, legal obstacles to the full exer-cise of rights to freedom of association still exist in the legislation and new and small trade unions are frequently excluded from collective bargaining processes. The promotion of collective bargain-ing in the expanding private sector also remains a priority. Enabling social dialogue and collective bargaining and moving beyond the decent work deficit in this area, will promote and facilitate the attainment of decent work in all its facets.
Ukraine_E_Second Edition.indd viiUkraine_E_Second Edition.indd vii 16.09.13 10:4016.09.13 10:40

viii
Ukraine_E_Second Edition.indd viiiUkraine_E_Second Edition.indd viii 16.09.13 10:4016.09.13 10:40

List of abbreviations
CEACR International Labour Organization’s Committee of Experts on the Application of Conventions and Recommendations
CFTUU Confederation of Free Trade Unions of UkraineCIS Commonwealth of Independent StatesCPI Consumer price indexDerzhnahliadpratsi State Department for the Supervision over Labour Legislation Observance,
Ministry of Labour and Social PolicyEPLI Employment Protection Legislation IndexEU European UnionFGCSSIU Fund for General Compulsory State Social Insurance against UnemploymentFSIA Fund for Social Insurance against AccidentsFSITLWC Fund for General Compulsory State Social Insurance against Temporary
Loss of Working CapacityFTUU Federation of Trade Unions of UkraineGDP Gross domestic productICSE International Classification of Status in EmploymentIDSS Institute for Demography and Social Studies, National Academy
of Sciences of UkraineILO International Labour OrganizationIMF International Monetary FundIPEC The International Labour Organization’s International Programme
on the Elimination of Child LabourITUC International Trade Union ConfederationJRB(e) Joint Representative Body of the Employers’ Party on the National LevelJRB(t) Joint Representative Body of All-Ukrainian Trade Unions and Trade Union
AssociationsMAP The International Labour Organization’s Monitoring and Assessing Progress
on Decent Work projectMLSP Ministry of Labour and Social PolicyNMCS National Mediation and Conciliation ServiceNTSEC National Tripartite Social and Economic Council under the President of UkraineOECD Organization for Economic Cooperation and DevelopmentPES Public Employment ServicePPP Purchasing power parityRSEC Regional social and economic councilSSCU State Statistics Committee of UkraineUAH HryvniasUN United NationsUNDP United Nations Development ProgrammeUNICEF United Nations Children’s FundUSB Ukrainian Society of the BlindWHO World Health Organization
Ukraine_E_Second Edition.indd ixUkraine_E_Second Edition.indd ix 16.09.13 10:4016.09.13 10:40

Ukraine_E_Second Edition.indd xUkraine_E_Second Edition.indd x 16.09.13 10:4016.09.13 10:40

ContentsPreface iii
Summary v
List of abbreviations ix
Tables with statistical indicators xii
Legal Framework Indicators xiii
1. Economic and social context for decent work 1
2. Employment opportunities 7
3. Adequate earnings and productive work 13
4. Decent working time 19
5. Combining work, family and personal life 23
6. Work that should be abolished 29
7. Stability and security of work 33
8. Equal opportunity and treatment in employment 37
9. Safe work environment 41
10. Social security 49
11. Social dialogue, employers’ and workers’ representation 57
Ukraine_E_Second Edition.indd xiUkraine_E_Second Edition.indd xi 16.09.13 10:4016.09.13 10:40

Decent Work Country Profile UKRAINE Second Editionxii
Tables with statistical indicators
Table 1. Economic and social context for decent work 3
Table 2. Employment opportunities 9
Table 3. Adequate earnings and productive work 14
Table 4. Decent working time 20
Table 5. Combining work, family and personal life 27
Table 6. Work that should be abolished 32
Table 7. Stability and security of work 34
Table 8. Equal opportunity and treatment in employment 39
Table 9. Safe work environment 42
Table 10. Social security 50
Table 11. Social dialogue, employers’ and workers’ representation 61
Ukraine_E_Second Edition.indd xiiUkraine_E_Second Edition.indd xii 16.09.13 10:4016.09.13 10:40

xiiiContents
Legal Framework Indicators
Legal Framework Indicator 1. Labour administration 5
Legal Framework Indicator 2. Government commitment to full employment 8
Legal Framework Indicator 3. Unemployment insurance 10
Legal Framework Indicator 4. Statutory minimum wage 17
Legal Framework Indicator 5. Maximum hours of work 21
Legal Framework Indicator 6. Paid annual leave 21
Legal Framework Indicator 7. Maternity leave 24
Legal Framework Indicator 8. Parental leave 25
Legal Framework Indicator 9. Child labour 30
Legal Framework Indicator 10. Forced labour 31
Legal Framework Indicator 11. Termination of employment 35
Legal Framework Indicator 12. Equal opportunity and treatment 38
Legal Framework Indicator 13. Equal remuneration of men and women for work of equal value 39
Legal Framework Indicator 14. Employment injury benefits 44
Legal Framework Indicator 15. Labour inspection 46
Legal Framework Indicator 16. Pension 51
Legal Framework Indicator 17. Incapacity to work due to sickness/sick leave 52
Legal Framework Indicator 18. Incapacity for work due to invalidity 54
Legal Framework Indicator 19. Freedom of association and the right to organize 59
Legal Framework Indicator 20. Collective bargaining right 60
Legal Framework Indicator 21. Tripartite consultations 62
Ukraine_E_Second Edition.indd xiiiUkraine_E_Second Edition.indd xiii 16.09.13 10:4016.09.13 10:40

Ukraine_E_Second Edition.indd xivUkraine_E_Second Edition.indd xiv 16.09.13 10:4016.09.13 10:40

The period covered by this review commences and concludes with a severe financial crisis. In the autumn of 1998, Ukraine was on the precipice of defaulting on its foreign debt as currency reserves plummeted, the international financial institu-tions withdrew their support and bank deposits, diminished dramatically. These events unfolded rapidly in the wake of the Russian financial crash of August 1998, as international financial panic and contagion spread. In September and October 1998, the Government of Ukraine implemented a massive devaluation of the currency as well as an anti-crisis programme, but domestic eco-nomic policy fluctuated wildly over the next two years before a sustained economic recovery com-menced.
Almost a decade later, to the day, in October 2008, Ukraine faced a similar fate when a combination of domestic and international factors once again provoked a dramatic financial crisis characterized by massive capital outflows, significant devalu-ation and the de facto nationalization of several large commercial banks. As a result, the real economy declined rapidly with real GDP drop of 14.8 per cent in 2009.1 In 2010 the economy began to emerge from crisis, GDP grew by 4.1 per cent and in 2011 by a further 5.2 per cent.
However, there was a radical difference in the broad economic trends that existed prior to these two crises, and in the contributing domestic causes that triggered the two catastrophes. By the end of the 1990s, the economic and social situation in the Ukraine was disastrous. The country had endured a decade of uninterrupted economic decline with a cumulative fall in real GDP reaching 60 per cent between 1989 and 1999. Ukraine did not record
1 IMF: Press Release No. 09/259, July 10, 2009.
positive real GDP growth in a single year during the 1990s, and in several years the decline in real GDP exceeded ten percentage points, with the largest annual decline of around 23 percentage points occurring in 1994. Ukraine was the only post-communist country that failed to achieve a single year of economic growth for the entire dec-ade. The GDP per capita had also fallen sharply: in 1990, GDP per capita exceeded that of Russia, but by 2000 it had fallen to around one-third the level in Russia.
Following this lost economic decade, the social situation at the outset of this review period was bleak. By 1998 Ukraine had virtually become a barter economy. Wage and pension payment arrears reached alarming levels. Cash transactions between companies as well as tax payments had virtually ceased. Many of the poorer sections of the population survived by growing vegetables in small family land holdings. This form of sub-sistence agriculture contributes to the relatively high share of agriculture in total employment which reached 21.6 per cent in 2000, but has since declined to 15.4 per cent in 2010. The degree of economic stress and decent work deficits that pre-vailed at the end of the 1990s were significant and cannot be fully captured by official labour market and social data (employment rates, unemployment rates, measures of the informal economy and measures of the working poor and poverty levels).
While Ukraine underwent significant political reform during the 1990s, the economic reforms that characterized other post-communist states in this period were largely absent. Consequently a period of rapid “catch-up” economic reform took place in the 2000s. In the first few years of the cur-rent decade, successive Governments introduced a wide variety of stabilization and structural
1Economic and social context for decent work
Ukraine_E_Second Edition.indd 1Ukraine_E_Second Edition.indd 1 16.09.13 10:4016.09.13 10:40

Decent Work Country Profile UKRAINE Second Edition2
reforms which reduced reliance on barter and sig-nificantly improved the environment allowing for the expansion of the private sector. This included reforms to the Government, fiscal, energy and land policy reform, large scale privatization and various anticorruption measures. These policy innovations led to a period of rapid and reasonably well sustained economic growth. Between 2000 and mid-2008 Ukraine’s economy was buoyant with average annual growth of 6.9 per cent. Real GDP growth peaked at 12.1 per cent in 2004 when government expenditure expanded rapidly in the run up to presidential elections. Similar behaviour was seen in the per capita GDP growth rate that reached a peak of 13 per cent in 2005 (see Table 1 ‘Economic and social context for decent work’).
However, like many other countries in Europe, the Ukrainian economic upswing faltered in the sec-ond half of 2008 as commodity prices declined sharply and export markets contracted. In Octo-ber 2008, the situation deteriorated dramatically when one of the largest banks in the country was placed under receivership. This sparked massive capital outflows which in turn generated a crisis on the foreign exchange market, significant cur-rency devaluation despite interventions by the National Bank, and a major credit crunch for the real economy.
Economic activity contracted sharply between October 2008 and the end of 2009 with a large proportion of heavy industry temporarily closed or operating far below capacity. Real GDP declined by 14.8 per cent in 2009 and per capita GDP fell by 14.7 per cent. Industrial output declined by a massive 31.8 per cent in the first half of 2009 as compared to the same period a year earlier. As a result, labour market conditions deteriorated dra-matically. The unemployment rate among the pop-ulation aged 15 to 70 years increased from 6.4 per cent in 2008 to 8.8 per cent in 2009 (see Chapter 2 ‘Employment opportunities’), but this masks the real level of stress in the labour market. As in past recessions, labour market slack has been concen-trated in a significant expansion of involuntary part-time work and administered leave, as well as an explosion in wage arrears (see Chapter 3 ‘Ade-quate earnings and employment productivity’ and Chapter 7 ‘Stability and security of work’).
Economic growth resumed in 2010, and contin-ued in 2011 with a stronger GDP growth rate of 5.2 per cent, although indicators at the beginning of 2012 suggested a slower growth rate, with a first quarter GDP growth rate of two per cent. While GDP per capita remains low compared to other Commonwealth of Independent States (CIS) countries, the level may be higher than suggested by official data, as the shadow economy, esti-mated to account for between 15 and 45 per cent of total household income is not reflected in these data.2 Signs of labour market recovery have also appeared; in particular, the unemployment rate for the population aged 15 to 70 years had fallen to 8.1 per cent in 2010 and 7.9 per cent in 2011.
In early November 2008, the Ukrainian Govern-ment signed a standby agreement with the IMF for $16.4 billion. The original memorandum of understanding contained provisions requiring the Government to maintain tight fiscal discipline in the latter months of 2008 and produce a balanced budget for 2009. Much of the fiscal tightening in the original agreement was expected to result from reduced expenditure on public sector wages and benefits, as well as reductions in the overall level of social expenditure. Apparently the government agreed to freeze on public sector wages during 2009. Ukraine also agreed to revise the indexa-tion of various social transfers, using a forward-looking model tying increases to future expecta-tions of inflation rather than a backward-looking model. Since the contraction of domestic demand was expected to cause inflation to fall from 25 per cent in 2008 to 14 per cent in 2009, the timing of this reform implied a significant decline in the real value of pensions and other transfer payments. The Government also agreed to a two year post-ponement of a planned increase in the minimum wage of some 35 per cent to reach minimum sub-sistence level, going back on an earlier promise. In addition, a phased increase in energy prices was planned.
Implementation of these conditions has been problematic as the domestic economy deteriorated far more dramatically than expected at the time of
2 UNDP: Human Development Report Ukraine 2008: Human Development and Ukraine’s European Choice (Kyiv, 2008).
Ukraine_E_Second Edition.indd 2Ukraine_E_Second Edition.indd 2 16.09.13 10:4016.09.13 10:40

31. Economic and social context for decent work
Table 1. Economic and social context for decent work
1998 1999 2000 2001 2002 2003 2004 2005 2006 2007 2008 2009 2010 2011
Real GDP growth rates, in %1 -1.9 -0.2 5.9 9.2 5.2 9.6 12.1 2.7 7.3 7.9 2.3 -14.8 4.1 5.2
Per capita GDP1 3
US dollars in 2005 prices and PPP 3 444 3 468 3 706 4 085 4 337 4 793 5 416 5 605 6 058 6 578 6 766 5 770 _ _
US dollars in the current year prices and PPP _ _ _ 3 703 3 995 4 510 5 241 5 605 6 255 6 992 7 350 6 325 _ _
Growth rate, % in 2005 prices and PPP -1.1 0.7 6.9 10.2 6.2 10.5 13.0 3.5 8.1 8.6 2.9 -14.7 _ _
Index, 2005=100, in 2005 prices and PPP 61.4 61.9 66.1 72.9 77.4 85.5 96.6 100.0 108.1 117.4 120.7 102.9 _ _
Labour share in GDP, in %2 48.1 44.3 42.3 42.3 45.7 45.7 45.6 49.1 49.4 48.8 49.6 49.4 49.9 47.7
Labour productivity, growth rate, in %3 _ _ _ 10.3 4.6 9.1 11.4 1.1 7.2 6.7 2.0 -11.5 3.7 4.9
Inflation rate (CPI) %4 10.6 22.7 28.2 12.0 0.8 5.2 9.0 13.5 9.1 12.8 25.2 15.9 9.4 8.0
Income inequality5
Percentile ratio P90/P10 _ _ 6.4 6.9 6.8 6.5 6.9 6.9 7.1 5.1* 5.3 5.1 5.2 4.9
Gini coefficient _ 0.28 0.29 0.30 0.29 0.29 0.29 0.30 0.30 0.25* 0.26 0.26 0.25 _
Poverty headcount ratio, in %6 _ 27.8 26.4 27.2 27.2 26.6 27.3 27.1 28.1 27.3 27.0 26.4 24.1 _
Employment by branch of economic activity, in %7
Agriculture _ _ 21.6 20.8 20.6 20.4 19.7 19.4 17.6 16.7 15.9 15.6 15.4 16.8
Industry _ _ 27.3 26.3 25.2 24.6 24.6 24.2 24.2 23.9 23.4 22.4 21.7 16.5
Services _ _ 51.1 52.9 54.2 55.1 55.7 56.4 58.1 59.4 60.7 62.0 62.9 66.7
Net primary school enrolment rate, in %8 _ _ _ _ 90.9 87.4 88.0 90.6 90.2 89.4 88.9 _ _ _
Male _ _ _ _ 91.0 87.4 88.2 90.8 90.3 89.4 88.7 _ _ _
Female _ _ _ _ 90.7 87.4 87.7 90.5 90.0 89.3 89.1 _ _ _
Net secondary school enrolment rate, in %9 _ _ 90.7 91.0 86.5 86.9 86.3 82.3 83.8 84.5 85.0 _ _ _
Ukraine_E_Second Edition.indd 3Ukraine_E_Second Edition.indd 3 16.09.13 10:4016.09.13 10:40

Decent Work Country Profile UKRAINE Second Edition4
the original negations with the IMF. As a result of delays in implementation, loan disbursement was also held back. The initial agreement has now been modified to reflect the unexpected severity of the economic crisis. The emphasis on reduc-tions in public sector wages and social expendi-ture remains firm. However, due to the massive economic contraction and decline in tax receipts, the IMF accepted a widening in the general gov-ernment deficit, initially to four per cent of GDP and more recently to six per cent.
The fiscal position of the country prior to the crisis was relatively sound and the level of public foreign debt was moderate. However, much of the growth in private domestic demand was financed by com-mercial banks and was devoted to speculation in the real estate market, conspicuous consump-tion expenditure and private investment. Ukraine
experienced something similar to the US “sub-prime” explosion of debt without adequate collat-eral. However, a significant difference was that the vast majority of the commercial bank loans were denominated in foreign currency. Private banks borrowed substantial amounts of foreign currency and re-lent this money at a substantial margin. As a result, over 80 per cent of foreign debt is held by the private sector. With currency devaluation the repayments on these loans increased substantially and the probability of default rose significantly.
Among the social indicators, the rapid increase of HIV prevalence among the population aged 15 to 49 years is particularly notable. At 1.6 per cent in 2007, the Ukrainian prevalence rate was the highest among Eastern European countries for which data are available. Life expectancy at birth has remained low over the past fourteen years,
1998 1999 2000 2001 2002 2003 2004 2005 2006 2007 2008 2009 2010 2011
Male _ _ 89.1 90.1 85.8 86.4 85.9 84.7 84.1 84.5 _ _ _
Female _ _ 92.5 91.9 87.2 87.5 86.8 79.7 84.3 84.9 85.5 _ _ _
Adult literacy rate10 More than 99%
Estimated % of working-age population who are HIV positive11 0.5 0.6 0.7 0.8 0.9 1.1 1.3 1.5 1.5 1.6 _ _ _ _
Life expectancy at birth12 68.08 68.32 67.91 68.33 68.32 68.24 68.22 67.96 68.10 68.25 68.27 69.29 70.44 _
Male 62.74 62.95 62.44 62.77 62.70 62.64 62.60 62.23 62.38 62.51 62.51 63.79 65.28 _
Female 73.50 73.74 73.55 74.08 74.13 74.06 74.05 73.97 74.06 74.22 74.28 74.86 75.50 _
Notes:1 SSCU data.2 Calculations based on employee labour remuneration in actual prices, in per cent of GDP.3 Data by the Ministry of Economy, in per cent year-on-year. Calculated according to the Provisional Guidelines for the calculation of labour
productivity over the entire economy and by economic activity, approved by the Ministry of Economy Order No. 916 of 26.12.2008.4 Calculated as annual CPI year-on-year.5 Before 2006, average cumulative per capita spending was used as the differentiation criterion; since 2007, per capita total income is used. UNAIDS/WHO according to the Report on Global AIDS Epidemic 2008. 2008 data calculated as 9-month average6 National poverty line, defined as the expenditure level needed to satisfy main needs and calculated as 75 per cent of the median equivalent per
capita household expenditure. No disaggregation by sex is available.* Series break (see footnote5).7 Based on ICSE Rev. 2 (until 2000) and ICSE Rev. 3 (from 2001 onwards).8 The World Bank database9 See footnote8.10 UNDP data (Human Development Report). Calculated as December to December of the previous year.11 UNAIDS data, the Global AIDS Epidemic Report 2008, UNAIDS/WHO.12 The World Bank database.13 Data by the UNECE. UNECE Statistical Division Database, compiled from national and international (CIS, EUROSTAT, IMF, OECD) official sources.Source: SSCU, UNAIDS/WHO, World Bank (school enrolment rates).
Ukraine_E_Second Edition.indd 4Ukraine_E_Second Edition.indd 4 16.09.13 10:4016.09.13 10:40

51. Economic and social context for decent work
reaching 70.4 years in 2010 due to a fall in mor-tality from all statistically observed causes, except AIDS consequences. Life expectancy falls short of the levels reached in neighbouring countries such as Poland (75.1 years) and in OECD coun-tries (79.7 years)3. At just 65.3 years, men’s life expectancy is far lower than women’s. This gap results from differences in social attitudes con-cerning drinking, smoking, diet and exercise as
3 World Bank: World Development Indicators.
well as differences in safety and health conditions in the workplace.4 While primary school enrol-ment has remained relatively stable, net second-ary school enrolment has declined from 90.7 per cent in 2000 to 82.3 per cent in 2005; the decline was especially large for girls (79.7 per cent). Later this indicator grew annually to reach 85 per cent in 2008, but to date has not yet reached the 2000 level.
4 UNDP. Op.cit.
Legal Framework Indicator 1. Labour administrationLaw, policy or institutions: The Ministry of Labour and Social Policy (MLSP), guided and coordinated by the Cabinet of Ministers, is the main central executive authority ensuring the implementation of state policy on employment, social protection, social insurance, labour remuneration, occupational classification, working conditions, pension provision, social services, industrial relations, and labour migration. Sub-units have been established to fulfil these tasks. Public local authorities at the oblast (regional), district or local level perform these functions (in particular, functions of social protection, employment, and wage policy) at the local level. Some activities in the field of labour have been delegated to local governments, including those concerning local occupational safety and health and employment. Other ministries are involved in addressing specific issues such as occupational safety and health.
The main bodies involved in setting employment policy are the MLSP, which ensures policy coordination, and the Tri-partite Employment Promotion Coordinating Committee. The National Tripartite Social and Economic Council (NTSEC) is responsible for promoting the harmonization of the positions of the parties to social dialogue and agreement on issues concerning socio-economic and labour relations.
Further institutions: The State Department for the Supervision over Labour Legislation Observance, guided by the MLSP, is in charge of labour inspection. Its main tasks are to supervise compliance with labour legislation (except labour protection matters); legislation on compulsory state social insurance against industrial accidents and occupational dis-eases; compulsory state social unemployment insurance; compulsory state social insurance against temporary disabil-ity; and to provide recommendations to workers and employers on the application of labour legislation and legislation on compulsory state social insurance. Other ministries are involved in specific aspects of labour inspection.
Social security institutions: The general policy on employment and job placement guarantees is coordinated by the MLSP but the Public Employment Service (PES) which has headquarters and services at the national, regional, inter-district, district and local levels, administers the employment insurance programmes. Several funds managed by tripar-tite bodies were established: the Fund for General Compulsory State Social Insurance against Unemployment (FGCS-SIU), the Fund for Social Insurance against Accidents (FSIA) and the Fund for General Compulsory State Social Insur-ance against Temporary Loss of Working Capacity (FSITLWC).
Exclusion of parts of the workforce from coverage: None. Coverage in different forms.
Ratification of ILO Conventions:
The Labour Administration Convention, 1978 (No. 150) was ratified in 2004; the Labour Inspection Convention, 1947 (No. 81) was ratified in 2004, but not its Protocol; the Labour Inspection (Agriculture) Convention, 1969 (No. 129) was ratified in 2004; the Freedom of Association and Protection of the Right to Organise Convention, 1948 (No. 87) was ratified in 1956; the Right to Organise and Collective Bargaining Convention, 1949 (No. 98) was ratified in 1956; the Labour Statistics Convention, 1985 (No. 160) was ratified in 1991; the Employment Policy Convention, 1964 (No. 122) was ratified in 1968; the Human Resources Development Convention, 1975 (No. 142) was ratified in 1979; the Occu-pational Safety and Health Convention, 1981 (No. 155), was ratified in 2012.
The Social Security (Minimum Standards) Convention, 1952 (No. 102) and the Promotional Framework for Occupa-tional Safety and Health Convention, 2006 (No. 187) have not been ratified.
Ukraine_E_Second Edition.indd 5Ukraine_E_Second Edition.indd 5 16.09.13 10:4016.09.13 10:40

Decent Work Country Profile UKRAINE Second Edition6
The indicators for income inequality decreased slightly between 1999 and 2010, with a decline in the Gini coefficient from 0.28 to 0.25 and a decrease in the percentile ratio P90/P10 – that indicates the income difference between those near the top and those near the bottom of the dis-tribution – from 6.4 (2000) to 5.2 (2010). How-ever, this index is based on consumption, where inequality generally tends to be lower. Data based on gross earnings show significantly higher ine-quality, with Gini coefficients of around 0.41 in the mid-2000s and above 0.45 in the early 2000s
(compared to 0.25 in 1992).5 The poverty head-count ratio, based on the national poverty line of 75 per cent of median per capita household expenditure, has not declined over the past ten years but has fluctuated around 27 per cent. In 2010, this indicator stood at 24.1 per cent. Over-all, the country has made significant progress in some areas of human development, while in other areas progress has been negligible (poverty, male life expectancy, HIV and AIDS and tuberculosis, life-long quality education, gender equality, envi-ronmental protection standards).6
5 UNU-WIDER, World Income Inequality Database, version 2C.6 UNDP. Op.cit
Ukraine_E_Second Edition.indd 6Ukraine_E_Second Edition.indd 6 16.09.13 10:4016.09.13 10:40

Ukraine’s commitment to full employment and decent work is reflected in national legislation the commitment has been longstanding as in 1964, Ukraine ratified the ILO Employment Policy Con-vention, 1964 (No. 122). Current policies and Action Plans approved by the President and the Cabinet of Ministers aim to promote productive labour, and full and freely chosen employment as well as to address the serious challenges faced by the country (see Legal Framework Indicator 2 ‘Government commitment to full employment’).
Similar to many transition economies, employ-ment opportunities in Ukraine diminished during the initial stages of economic reform in the 1990s. The trends in the employment rate for persons aged 15 to 64 reflect the overall better economic performance in the current decade: employment increased from 59.0 per cent in 2000 to 63.4 per cent in 2008 before falling to 61.9 per cent in 2011 as a result of the global economic crisis (see Table 2 ‘Employment Opportunities’). There are however several factors that should be taken into account when assessing this trend. Firstly, the employment rate is still low in comparison with the average for Central and South Eastern Europe and the CIS, and with the rate in developed econ-omies.1 Secondly, employment creation since 2000 has been limited. Between 2000 and 2011, employment growth for the population aged 15 to
1 Using employment data for the age group 15 to 70 years, in com-bination with population estimates for the population aged 15 and above from the SSCU, produces an employment-to-population rate of 50.0 per cent in 2000, increasing to 52.8 per cent in 2008. This may be compared with the average rate in Central and South Eas-tern Europe (non-EU) and the CIS of 52.3 per cent in 2000 for the population aged 15 and above and 54.1 per cent in 2008 (Global Employment Trends, ILO, January 2009). Average employment-to-population rates for the developed economies and the EU are higher in both years. As employment data exclude the employed aged over 70, the rate is slightly biased downward for Ukraine, but this bias is unlikely to change the point that the employment-to-population rate is relatively low.
64 averaged 0.8 per cent per year, suggesting very low labour absorption despite higher economic growth rates. This reflects the legacy of the transi-tion period in the 1990s and consolidation of the Ukrainian market economy. During this time, pol-icy had to balance growth in labour productivity, wages and production costs against competition in the global economy was increasingly opened to global markets. Between 2010 and 2011 some 58,200 jobs were created for persons aged 15 to 70 making a total of 20.3 million employed per-sons, of whom 18.5 million were working age (15 to 64 years).
The unemployment rate for 15 to 64 year olds decreased during the period 2000 to 2008, from 11.8 per cent in 2000 to 6.5 per cent in 2008. The global financial crisis led unemployment to increase to a high of 9.1 per cent in 2009; as the economy has recovered unemployment has sub-sequently declined to 7.9 per cent in 2011 (see Table 2 ‘Employment opportunities’). This fig-ure was lower than the average for the European Union (EU) countries where the unemployment rate was 9.8 per cent in 2011. Overall, the number of unemployed in Ukraine fell by 52,900 persons in 2011 to a total of 1.7 million and the average period of unemployment for the age group 15 to 70 declined from 23 months in 2000 to six months in 2011, while the average period of job search declined from ten months in 2000 to six months in 2011.
Employment growth in Ukraine over the last dec-ade has been sufficient to drive the unemployment rate down, despite being low relative to economic growth. However, migration is also likely to have been a factor driving the fall in unemployment as many new entrants to the labour market, or peo-ple out of work have chosen to look elsewhere to
2 Employmentopportunities
Ukraine_E_Second Edition.indd 7Ukraine_E_Second Edition.indd 7 16.09.13 10:4016.09.13 10:40

Decent Work Country Profile UKRAINE Second Edition8
secure employment. Available data show that dis-couraged workers, who have given up their search for jobs and have left the labour market but stayed in the country, make up a decreasing proportion of the economically inactive population, stand-ing at just one per cent in 2011. Interestingly, the proportion of homemakers (defined as inactive persons fulfilling domestic tasks and engaged in housekeeping while being sponsored by some-body) increased from 11.6 per cent in 2000 to 20.8 per cent in 2011. Some of these persons may have been classified as discouraged workers in previous years.
The youth employment-to-population rate is much lower than for other age groups, in part because many young people are in full-time education: The youth employment-to-population rate stood at 33.9 per cent in 2011, and the share of youth neither in education nor in employment decreased from 21.4 per cent in 2000 to 17.9 per cent in
2011. The education system in Ukraine is well developed and utilized, with gross enrolment rates in both secondary and tertiary education above the regional average in Central and Eastern Europe in recent years. It is unclear that gains in educa-tion are paying off, as youth unemployment rates remain high in comparison with overall unem-ployment rates, at almost 20 per cent in 2011. It is possible that some young people are prolong-ing their time in education to avoid a difficult job search or military service.
Employment-to-population rates only capture the volume of employment in a relative dimension, whereas insights into the quality of employment can be gained by examining status in employ-ment, among other indicators. Wage and salaried workers are more likely to benefit from improve-ments in labour standards, such as employment protection, social security and a voice at work, than own account workers or contributing family
Legal Framework Indicator 2. Government commitment to full employmentLaw, policy or institutions: The Law on the employment of population No. 803-XII, 1991 and the Law on general compulsory State social insurance against unemployment No. 1553-III, 2000 among others, regulate the directions and objectives of employment policy. This policy is stated in the Presidential Decree No. 1073 of 11 July 2005 on the improvement of state regulation in the sphere of employment of the population and labour market in Ukraine. The Cabinet of Ministers Resolution No. 922 of 5 July 2006 approved the Principal directions of the implementation of the state employment policy for the period up to 2009, and the Cabinet of Ministers Resolution No. 831 of 8 September approved the Principal directions of the implementation of the state employment policy for 2010 to 2011.
The Government has recently announced plans to create some 652,000 jobs in 2010 and 683,000 more in 2011. To realize this goal, the MLSP in cooperation with appropriate central executive authorities and the social partners, has developed an action plan: Measures for addressing the employment problems, 2010-2011.
Resolutions are implemented through plans of action (annual or biannual) approved by the Cabinet of Ministers Order, and by regional programmes of employment of the employment of the population. Information on the fulfilment of the plans of action is provided to the MLSP and, subsequently, to the Cabinet of Ministers, on a quarterly basis by local bodies.
Evidence of implementation effectiveness: The CEACR pointed out that the employment rate was higher in rural areas than in cities where most people live. The CEACR also emphasized that employment among people aged 15 to 34 stood at 36.7 per cent in 2011 while the unemployment rate for older workers aged 35 to 70 was 63.3 per cent. The CEACR has asked the Government to provide information on measures to create jobs in regions depressed due to large scale lay-offs in mines. It has also asked for information on participation of the social partners in the formulation and imple-mentation of measures under Convention No. 122; and for the results of PES placement and training initiatives aimed at returning employees to labour market.
Ratification of ILO Conventions: The Employment Policy Convention, 1964 (No. 122) was ratified in 1968.
Sources:1. Committee of Experts’ comments on Convention No.122, Government reports on Convention No. 122.2. NATLEX database (http://www.ilo.org/dyn/natlex/natlex_browse.country?p_lang=en&p_country=UKR
Ukraine_E_Second Edition.indd 8Ukraine_E_Second Edition.indd 8 16.09.13 10:4016.09.13 10:40

92. Employment opportunities
Table 2. Employment opportunities
1998 1999 2000 2001 2002 2003 2004 2005 2006 2007 2008 2009 2010 2011
Employment rate, 15 to 70 years, in %1 62.8** 55.0 55.8 55.4 56.0 56.2 56.7* 57.7 57.9 58.7 59.3 57.7 58.5 59.2
Male 64.9** 59.6 60.5 59.9 60.1 60.3 60.9* 62.8 63.5 64.3 65.2 62.1 63.1 64.4
Female 60.8** 50.9 51.6 51.5 52.2 52.6 52.9* 53.1 53.0 53.7 54.0 53.9 54.4 54.5
Employment rate, 15 to 64 years, in %1 _ 58.6 59.0 58.6 59.1 59.7 60.4* 61.5 62.1 62.9 63.4 61.0 61.5 61.9
Male _ 62.9 63.3 62.5 62.9 63.2 64.1* 66.1 67.1 67.9 68.6 64.8 65.6 66.7
Female _ 54.9 55.1 55.0 55.7 56.5 56.9* 57.3 57.5 58.3 58.5 57.6 57.8 57.5
Unemployment rate, 15 to 70 years, in %1 11.3** 11.6 11.6 10.9 9.6 9.1 8.6* 7.2 6.8 6.4 6.4 8.8 8.1 7.9
Male 11.9** 11.8 11.6 11.0 9.8 9.4 8.9* 7.5 7.0 6.7 6.6 10.3 9.3 8.8
Female 10.8** 11.3 11.6 10.8 9.5 8.7 8.3* 6.8 6.6 6.0 6.1 7.3 6.8 6.8
Unemployment rate, 15 to 64 years, in %1 _ 11.7 11.8 11.1 9.8 9.2 8.8* 7.4 7.0 6.5 6.5 9.1 8.3 8.0
Male _ 12.0 11.8 11.2 10.0 9.6 9.0* 7.7 7.2 6.8 6.8 10.5 9.5 8.9
Female _ 11.5 11.8 11.0 9.6 8.9 8.5* 7.0 6.8 6.2 6.3 7.5 7.0 7.0
Youth not in education and not in employment, 15 to 24 years, in %1 _ 23.8 21.4 20.4 18.2 16.6 18.0* 17.1 16.2 15.8 16.0 18.7 17.6 17.9
Male _ 20.7 18.3 18.1 16.0 13.8 16.3* 14.3 12.8 12.9 12.5 16.8 15.2 14.8
Female _ 27.0 24.6 22.7 20.5 19.4 19.8* 20.1 19.6 18.8 19.7 20.8 20.2 21.1
Informal employment (national definition), in %1, 2 _ 13.6 14.8 16.4 17.3 17.2 19.4* 21.5 22.3 22.3 21.8 22.1 22.9 23.1
Male _ 13.3 14.2 16.0 16.9 16.9 20.2* 21.2 22.2 22.3 22.2 23.1 24.1 24.1
Female _ 13.9 15.4 16.8 17.8 17.4 18.6* 21.7 22.4 22.3 21.3 21.1 21.7 22.2
Notes:1 Data for the years 1999-2003 were revised according to the methodology used from 2004 onwards and the demographic structure of the
population as obtained from the All-Ukrainian Census of 2001. The said information for 1998 was not recalculated.2 According to the national methodology, the informal sector of economy includes all persons employed in unregistered enterprises, which by their
size (in terms of total number employed) belong to the household sector. Informal sector enterprises are considered those which meet the following criteria: market orientation; limited number of employees; lack of state
registration of business activities. Given the national distribution of informal employment relationships, criteria for the definition of the number of employed in this sector are
expanded by including those who work under an oral agreement with an employer in the formal sector, i.e. without a formal employment contract which provides the minimum social security entitlements.
* Sample surveys on population activity in Ukraine were held on a quarterly basis between 1999 and 2003 and on a monthly basis since 2004.** 1998 data not adjusted according to the census.Source: SSCU, based on the sample population (household) survey on population activity in Ukraine.
Ukraine_E_Second Edition.indd 9Ukraine_E_Second Edition.indd 9 16.09.13 10:4016.09.13 10:40

Decent Work Country Profile UKRAINE Second Edition10
Legal Framework Indicator 3. Unemployment insuranceLaw, policy or institutions: The unemployment insurance system is governed by the Law on the employment of popula-tion No. 803-XII, 1991, as amended, the Law on general compulsory State social insurance against unemployment 2000 as amended, and the Law on the rates of contributions to some types of general compulsory State social insur-ance No. 2213-III, 2001 as amended. General policy coordination is provided by the MLSP. The PES and its local offices administer the programme.
Qualifying conditions: Insured persons must have worked, on a full- or part-time basis, for not less than 26 calendar weeks over the 12 months preceding the beginning of their unemployment to be entitled to benefits. The insured must be registered at an employment office and be able and willing to work. The benefit may be reduced, suspended, or terminated if the worker is discharged for violating work rules, leaving employment without good cause, violating condi-tions for job placement or vocational training, or filing a fraudulent claim. The scope of insured persons was recently expanded to include working pensioners, persons employed on civil contracts, military personnel, foreigners and state-less persons residing in Ukraine (Law on amending some laws of Ukraine to reduce the global financial crisis’ impact on the employment of population No. 799-VI, 2008); however, criteria to justify the employment of foreigners have been restricted.
Benefits (level and duration): Unemployment benefit: with up to two years of covered employment, the benefit is based on 50 per cent of average earnings; between two and six years on 55 per cent; between six and ten years on 60 per cent; and over ten years on 70 per cent. For the first 90 calendar days, 100 per cent of the benefit is paid; 80 per cent for the next 90 calendar days and 70 per cent thereafter. Benefits are paid for up to 360 days in a two year period. For insured persons within two years of retirement, benefits are paid for up to 720 calendar days. The minimum benefit is equal to 23 per cent of the minimum subsistence level and is established annually by the FGCSSIU board, subject to the Fund’s real capability. The maximum benefit is equal to the regional average wage in the previous month. Benefits are paid from the eighth day following registration with the employment service; persons who have left their place of work of their own volition without compelling reasons start receiving benefits 91 days after registration.
Unemployment assistance: for unemployed persons who have exhausted their entitlement to unemployment benefits, when the monthly average income for each family member does not exceed the established legal minimum.
Dependent’s supplement: paid after reception of unemployment benefits for 360 days and unemployment assistance for 180 days. Partial unemployment benefits have been introduced as a temporary measure for workers of enterprises experiencing stoppages (Law No. 799-VI of 25 December 2008).
Financing: Coverage is compulsory for employees (contributions from an insured person amount to 0.6 per cent of earn-ings and from employers to 1.6 per cent of payroll; central and local governments pay subsidies as needed). Coverage and contributions are voluntary for self-employed persons (2.2 per cent); there are special provisions for victims of the Chernobyl catastrophe. Persons under civil contracts contribute 0.6 per cent of their income.
Evidence of implementation effectiveness: No information located by the ILO.
Coverage of workers in law: Compulsory coverage for employees. Voluntary coverage for self-employed persons. Special provisions for victims of the Chernobyl accident.
Coverage of workers in practice: There were 449,700 registered unemployed as of 1 December 2010, of whom 321,500 received unemployment benefits.
Ratification of ILO Conventions: Neither the Social Security (Minimum Standards) Convention, 1952 (No. 102), nor the Employment Promotion and Protection against Unemployment Convention, 1988 (No. 168) have been ratified.
Sources:1. Government report to the CEACR on the application of Convention No. 158 (Termination of Employment).2. NATLEX database (http://www.ilo.org/dyn/natlex/natlex_browse.country?p_lang=en&p_country=UKR).3. ISSA data base, supplemented by Social Security Throughout the World, (Social Security Administration of the United States, September
2008) (http://www.issa.int/aiss/Observatory/Country-Profiles/Regions/Europe/Ukraine).4. SSCU.
Ukraine_E_Second Edition.indd 10Ukraine_E_Second Edition.indd 10 16.09.13 10:4016.09.13 10:40
112. Employment opportunities
workers who are often excluded from such protec-tion. While the total number of workers increased by 1.8 million between 2000 and 2011, the share of wage and salaried workers in total employ-ment has declined from 89.9 per cent in 2000 to 80.7 per cent in 2011. The decline was almost the same for women (9.3 percentage points) as for men (9.1 percentage points), similar to the result-ing shares of wage employment in total male and female employment that are still fairly close (79.9 and 81.5 per cent, respectively).
These trends fall in line with other data on infor-mal employment published by the State Statistics Committee of Ukraine (SSCU). The SSCU defi-nition of informal employment closely resembles the definition adopted by the International Confer-ence of Labour Statisticians in 2003 and includes all persons employed in unregistered enterprises and those who work under an oral agreement with an employer in the formal sector. The propor-tion of workers aged 15 to 70 years in informal employment increased from 14.8 per cent in 2000 to 23.1 per cent in 2011, with a slightly higher share of men employed informally than women. In absolute terms, informal employment increased by some 1.5 million over the same period, to reach 4.5 million in 2011. Initial reforms in social insur-ance, such as a cap on income used to calculate contributions in 1999, were followed by a brief drop in informal sector employment growth rates, however later implementation of pension reform saw the growth rates hit a recent peak in 2004 and 2005 (see Chapter 10 ‘Social security’). In the years that followed growth I informal employ-ment slowed considerably and even registered a contraction of 0.5 percentage points in 2008. The onset of the financial crisis caused informal sector
employment to rise again with the largest increase recorded in 2010, of 0.8 percentage points. This increase broadly accounts for the growth of the overall employment rate growth over that period, as jobs in all other sectors fell by 1.6 million.
Following the dramatic economic transition in the 1990s, Ukraine experienced a period of labour market stabilization in the 2000s. Employment opportunities expanded, and labour market indi-cators such as the employment-to-population rate and the unemployment rate improved. Neverthe-less, high economic growth rates during much of the decade have not been matched by employment generation, and at least part of the improvement in labour markets seems due to outward migration. Furthermore, much of the employment growth that took place was in vulnerable or informal employment.
Ukraine continues to face challenges in employ-ment creation and working conditions for those who are currently employed. These challenges have been exacerbated by the global economic crisis which hit Ukraine particularly hard. Ukraine is dependent on one leading export commod-ity, namely metals, for which prices and demand slumped deeply in world markets. Globally, there are signs of recovery, but it seems too early to establish whether and to what extent a turnaround has been achieved that would benefit exports. Accordingly, economic and labour market poli-cies in Ukraine continue to focus on mitigating the impact of the economic crisis. Therefore, it is essential to continue to monitor the effect of the crisis and policy responses on employment and labour markets, particularly the implications of changes to income taxation and social insurance.
Ukraine_E_Second Edition.indd 11Ukraine_E_Second Edition.indd 11 16.09.13 10:4016.09.13 10:40

Ukraine_E_Second Edition.indd 12Ukraine_E_Second Edition.indd 12 16.09.13 10:4016.09.13 10:40

Wage developments throughout the early transi-tion period of the 1990s were characterized by an extraordinary fall in real wages, mainly due to hyperinflation and a restrictive wages and incomes policy.1 Non-payment and delays in the payment of wages were also widespread, further eroding living standards of ordinary workers. Since 2000 there has been a rebound of wages that partly reflects the depth of the previous decline. Real wage increase has been impres-sive: from 1999, when average wages had fallen to 228.2 Hryvnias (UAH), they grew to 849.2 UAH in 2011 (in constant 2000 UAH: see Table 3 ‘Adequate earnings and productive work’). This is equivalent to an annual compound growth rate of about 12 per cent. According to the World Bank, the rise in wages was driven by improved labour productivity, and “real wages rose without raising the unit costs of production and without harm-ing the competitiveness of Ukrainian goods and services in world trade”.2 Alongside the real wage increases, the wage share in GDP also recovered and reached 49.9 per cent in 2010, the highest for the last twelve years. However in 2011 the wage share declined by 2.2 per cent to reach 47.7 per cent (see Chapter 1 ‘Economic and social context for decent work’).
The minimum wage has progressively increased over the last decade, both in nominal and real terms. While this helped wage earners at the bot-tom of the wage scale, the increase in minimum wages has not kept pace with overall wage devel-opments and the ratio of minimum wages as a per-centage of average wages has declined over the last twelve years, from 43.5 per cent in 2000 to
1 ILO-CEET: The Ukrainian challenge: Reforming labour market and social policy (Central European University Press, 1995).
2 World Bank: Ukraine: Poverty Update, Report No. 39887-UA (Washington, D.C., June 2007), p. 2.
36.6 per cent in 2011 (see Table 3 ‘Adequate earn-ings and productive work’). In 2011, the minimum wage was raised by law from UAH 941 to UAH 1,004 which was equal to the defined subsistence minimum for an able-bodied person. However, the minimum wage in Ukraine remained significantly lower than in comparable EU member states and the standard set in the European Social Charter, which stipulates that minimum wages should not be lower than 60 per cent of the average wage within the country.
At the same time, the on-going problem of wage arrears, remains unsolved. Over the 2000s, the arrears decreased annually due to strong inter-ventions by public authorities; from UAH 6.4 bil-lion in the early 1999s to UAH 669 million in early 2008. However, between 2008 and 2010, the wage arrears almost doubled to reach UAH 1.2 billion as of 1 January 2011 due to the unfold-ing global financial crisis. Efforts to contain the problem have been successful and by early 2012, wage arrears had again fallen to UAH 977 mil-lion.3 Wage arrears do not only affect bankrupt or inactive enterprises; some 65 per cent of wage arrears in 2009 were found in economically active enterprises, up only slightly from 2008 (64 per cent).
Wage increases, combined with increases in social transfers (notably pensions), had a positive effect on poverty reduction. Using a poverty line based on minimum needs for food and non-food goods and services,4 the World Bank estimates that the poverty headcount ratio fell from 31.7 per cent in 2001 to 7.9 per cent in 2005. However, the poverty
3 Див. Держкомстат, таблиця «Заборгованість по зарплаті по регіонах у 2009 р., у 2012 р.».
4 World Bank. Op.cit
3 Adequate earningsand productive work
Ukraine_E_Second Edition.indd 13Ukraine_E_Second Edition.indd 13 16.09.13 10:4016.09.13 10:40

Decent Work Country Profile UKRAINE Second Edition14
Table 3. Adequate earnings and productive work
1998 1999 2000 2001 2002 2003 2004 2005 2006 2007 2008 2009 2010 2011
Working poor (relative poverty line)1 _ 24.1 21.6 22.6 22.0 21.1 21.6 22.3 27.2 21.7 21.1 20.6 19.7 19.7
Poverty level according to the national relative rate1 _ 27.8 26.4 27.2 27.2 26.6 27.3 27.1 28.1 27.3 27.0 26.4 24.1 24.3
Poverty headcount rate, in % (absolute poverty line)2 _ _ _ 31.7 25.5 19.5 14.0 7.9 _ _ _ _ _
Poverty level according to equivalent spending below the poverty line specified by the UN for Central and Eastern Europe9 _ 14 11.9 11 3.0 4.0 2.0 1.3/9 9.3 6.6 3.8 3.5 2.5 _
% of population whose per capita cumulative monthly income is below the subsistence minimum3
Million people _ _ 39.2 39.9 39.8 35.2 30.3 25.3 22.5 12.3 7.2 6.9 9.7
% of entire population _ _ 80.2 82.7 83.3 76.2 65.6 55.3 49.7 27.2 16.1 15.5 21.8 24.3
Average monthly wage4
In current UAH 153 178 230 311 376 462 590 806 1041 1351 1806 1906 2239 2633
In constant 2000 UAH 240.6 228.2 230.0 277.7 333.0 389.0 455.7 548.5 649.3 747.0 797.6 726.3 779.9 849.2
Average monthly wage growth rates in constant 2000 prices, in %5 -3.2 -5.2 0.8 20.7 19.9 16.8 17.1 20.4 18.4 15.0 6.8 -8.9 7.4 8.9
Real wage indices6 -3.8 -8.9 -0.9 19.3 18.2 15.2 23.8 20.3 18.3 12.5 6.3 -9.2 10.2 8.7
Minimum monthly wage7
In current UAH 50 74 96 118 153 187 216 300 365 430 533 643 888 963
In constant 2000 UAH 78.6 94.9 96 105.4 135.7 157.6 166.9 204.2 227.8 237.8 235.5 245 309 311
Minimum wage in % of average wage 32.6 41.7 43.5 37.9 40.7 40.5 36.6 37.3 35.0 31.8 29.5 33.7 39.7 36.6
Ukraine_E_Second Edition.indd 14Ukraine_E_Second Edition.indd 14 16.09.13 10:4016.09.13 10:40

153. Adequate earnings and productive work
line used for this purpose was extremely low, at UAH 1,813 per person per year. This is equiva-lent to only UAH 151 per month, and much lower than the subsistence minimum set by the Parlia-ment. Using a higher poverty line obviously raises poverty rates, although poverty reduction has still been significant. Using a national poverty rate (75 per cent of median cumulative spending per adult) the level of poverty has declined over the last six years from 28.1 per cent in 2006 to 24.3 per cent in 2011. As this poverty line is rela-tive, it has raised significantly over the period, from UAH 430 in 2006 to UAH 1,062 in 2011. The SSCU has recorded significant improvements
in the proportion of the population living below the subsistence minimum, falling from a massive 80 per cent in 2002 to 14.6 per cent in 2011.5
Nevertheless the situation remained difficult before the current economic crisis which served to exacerbate existing problems. Despite progres-sive increases, minimum wages remained below the subsistence minimum and were insufficient to guarantee workers and their families adequate liv-
5 Between 2002 and 2006, the household ‘cumulative spending’ was used as a differentiation criterion, and since 2007 calculations are based on household income.
1998 1999 2000 2001 2002 2003 2004 2005 2006 2007 2008 2009 2010 2011
Minimum wage in % of subsistence minimum7 _ _ 34.8 35.6 41.8 51.1 57.1 66.2 73.7 77.7 82.0 94.4 100.0 100.0
Wage arrears, beginning of the year8
In current billions of UAH 5.166 6.519 6.401 4.928 2.657 2.548 2.232 1.111 0.960 0.806 0.669 1.189 1.473 1.218
In constant billions of UAH as of the end of 2000 9.297 9.777 8.053 4.928 2.503 2.415 1.955 0.867 0.679 0.511 0.364 0.528 0.583 0.442
Low pay rate (below 2/3 of median of hourly earnings)* 26.2 26.7 28.2 26.6 28.5 28.4 26.5 29.5 29.2 28.9 27.5 22.3
Notes:1 World Bank estimate, based on a relative poverty line (75 per cent of median household consumption expenditure per adult). No disaggregation
by sex is available.2 World Bank estimate, based on an absolute poverty line of UAH 1,813 per person per year, in 2003 prices.3 SSCU, population with average cumulative per capita income below the subsistence minimum. In 2000-2006, average cumulative per capita
spending was used as the differentiation criterion. Data for 2000, 2004 and 2006-2008 refer to the fourth quarter.4 Wage data – SSCU; CPI data – IMF, World Economic Outlook, October 2010.5 Calculated as per cent growth on the year-on-year basis (SSCU).6 Calculated according to the methodology approved by the SSCU Order No. 219 of 7 June 2002. The real wage growth rates are calculated year-
on-year and adjusted to corresponding consumer price indices.7 MLSP database (information on minimum wage rates beginning from October 1991, according to statutory decisions and actual implementation).8 SSCU, tables ‘Wage arrears by region’ and ‘Wage arrears by region, 2009’; period-end CPI data – IMF, World Economic Outlook, April 2009. Since
wage arrears data refer to 1 January, the CPI value at 31 December of the previous year was used to convert current into constant hryvnias.9 UAH equivalent (1999-2005 – US$4.3; 2005-2009 - US$5) at PPP calculated by the World Bank.* Statistics by men and women not available.** June 2010.Sources:SSCU, based on IDSS data; IMF, World Economic Outlook, April 2009; World Bank, Ukraine: Poverty Update, Report No. 39887-UA.
Ukraine_E_Second Edition.indd 15Ukraine_E_Second Edition.indd 15 16.09.13 10:4016.09.13 10:40

Decent Work Country Profile UKRAINE Second Edition16
ing standards, explaining persistently high levels of working poverty. The economic crisis of 2008 to 2009 aggravated the situation (see Chapter 1 ‘Economic and social context for decent work’). In 2008, for the first time in seven years, the mini-mum wage did not increase in line or above the rate of inflation, and actually declined by one per cent in real terms. As a result, minimum wages fell further to 29.5 per cent of the average wage and just 80 per cent of the value of the poverty line. Although the minimum wage was increased in under the 2009 State Budget (to UAH 625 from 1 April onwards, and UAH 630 from 1 July onwards), that resulted in a real adjustment of just UAH 7.2, or 2.9 per cent to its 2007 level. In 2010, 9.7 million people had per capita aggre-gate income below the subsistence minimum. Calculations by the Institute for Demography and Social Studies, National Academy of Sciences, Ukraine (IDSS) show that the share of the work-ing poor, according the relative poverty line used in Ukraine, remained stagnant at 21to 22 per cent throughout the 2000s, rising to a recent high of 23.5 per cent in the wake of the economic crisis, before falling to 19.7 per cent in 2011. Income inequality between the richest and poorest groups also remains high: the P90/P10 ratio was 6.4 in 2000, 7.1 in 2006, and 4.9 in 2011.6
Average wages continued to rise in the first half of 2008, but stagnated in nominal terms from July 2008 onwards. Compared to the previous year, real wages rose only modestly in 2008 (6.8 per cent) and fell by 10.1 per cent in the first half of 2009.7 The decline was particularly abrupt for public administration, where average nominal wages fell by almost one third between the last quarter of 2008 and the first quarter of 2009 (in line with the general objective to reduce the public sector deficit).8 At the same time, rapidly grow-ing numbers of workers were subject to income cuts because of administrative leave or imposition of shorter working hours (see Chapter 4 ‘Decent working time’ and Chapter 7 ‘Stability and secu-rity of work’). In some sectors however, the earlier trend of increasing wages continued, although at a
6 SSCU: http://www.ukrstat.gov.ua/ (accessed 11 Nov 2012).7 See SSCU, Table ‘Real wages by region, 2009’ (Kyiv, 2010). 8 See SSCU, Table ‘Average wages, by types of economic activity
(monthly information), 2008’ (Kyiv, 2009).
slower rate. The average monthly nominal wage of a staff member of enterprises, institutions or organizations rose by 5.5 per cent in 2009 the low-est recorded growth rate since statistical collec-tion of this indicator started in 1992. Nonetheless, this is significantly higher than the 8.9 per cent contraction in average monthly wage growth.
At the same time, the growth of hourly wages was almost two times higher than that of average monthly wages during the crisis. The growth rates of average monthly nominal wage were affected by increases in involuntary part-time employment and the declining efficiency of the use of work-ing time 2009. For example, the full-time employ-ment rate for all employees decreased from 98.2 per cent in 2008 to 94.7 per cent in 2009, and for industry it decreased from 94.7 per cent to 89.4 per cent. Similarly, the number of workers who shifted to shorter hours for economic reasons increased between 2008 and 2009: by 71.1 per cent in the entire economy, and by 50.4 per cent in industry. Furthermore, there was an increase by almost a 50 per cent in the number of workers who were sent on leave without pay. During 2009, each worker worked for 1,599 hours on average, rep-resenting 83.4 per cent of the working time fund established at enterprises, against 1,687 hours and 86.8 per cent in 2008.
As Ukraine emerged from the crisis, underem-ployment has reduced: full-time employment rates have recovered, reaching 97.8 per cent in 2011for the economy as a whole and 94.8 per cent for industry, and the number of employees in part-time employment dropped by 557,900 to 908,900. The number of people on administra-tive leave without pay almost halved from 2010 to 2011, to reach 189,500, or 1.8 per cent of the workforce. Wage growth resumed, while remain-ing depressed compared to pre-crisis years, and by 2011 the average monthly nominal wage was UAH 2,633. The growth rates varied from nine per cent in health care and social assistance to 28.7 per cent in forestry and related services. Among industrial activities growth rates ranged from 11.9 per cent in the manufacture of coke and refined petroleum products to 26.2 per cent in coal mining and lignite and peat extraction, as well as in the manufacture of other non-metallic mineral products.
Ukraine_E_Second Edition.indd 16Ukraine_E_Second Edition.indd 16 16.09.13 10:4116.09.13 10:41

173. Adequate earnings and productive work
Differences in pay between sectors remain signifi-cant. Those with the highest average remuneration were in sectors including air transport, financial institutions and mining and extractive industries, with wage rates some 1.5 to 3.3 times higher than the average. At the same time, sectors with lower than average wages include education (21 per cent lower than average) and health care (33 per cent lower) despite the social important of these sec-tors. Other low paid industries include agricul-ture, hotels and restaurants and garment manufac-turing.
Gender wage gaps remain persistent: the dispar-ity deepened after 1998, falling from a wage ratio of 74.2 per cent in 1998 to just 68.6 per cent in 2004. Since then the ratio has increased each year to 74.9 per cent in 2011. In 2011, the greatest gender wage gap was in the extractive industry
(54 per cent), the postal and communications services (40.6 per cent) and in enterprises pro-viding communal and personal services such as culture and sport, recreation and entertainment (36.6 per cent).
As Ukraine emerges from the global financial and economic crisis, wage policy responses are still required from national authorities, given the challenges that arose from the crisis and their on-going effects. It remains essential to discuss cur-rent policy orientations, notably from the memo-randum agreement with the IMF, to analyse their impact on wages, particularly in the public sec-tor, and on minimum wage earners. The overall impact of wages on enterprises’ operations, and on their capacity to pay wages in contexts of restrictive credit policy should also be analysed. While labour costs and wage developments do not
Legal Framework Indicator 4. Statutory minimum wageLaw, policy or institutions: Relevant legislation includes the Wages Act No. 108/95-BP, 1995 and the Law on the minimum subsistence level No. 966-XIV, 1999 as amended. According to the Wages Act, the minimum wage level is set once a year by the Parliament on the recommendation of the Cabinet of Ministers. The decision is based on state budget capability, consultations with representatives of national trade union associations and employers’ organizations, and may not be lower than the subsistence minimum. The minimum wage for workers in particular sectors or enter-prises can be regulated by collective agreements but cannot be lower than minimum subsistence level. If an enterprise is facing financial difficulties, the minimum wage can be fixed by collective agreement at a level lower than the national minimum wage for a period not exceeding six months. Information on minimum wage rates is published in official jour-nals and the media. Labour inspectors and experts from the MLSP monitor compliance with minimum wage require-ments. Between 2007 and 2010, the Government tried to object to collective bargaining on minimum wage setting for workers funded through the state budget, referring to changes in existing legislation.
Minimum wage levels: The Law on the state budget normally provides for the gradual increase of the minimum wage during the year. For example, the minimum wage rate was UAH 869 per month in January 2010, UAH 1,073 in January 2012, and is to be increased to UAH 1,134 in December 2012.
Coverage of workers in law: No exclusions noted; the law covers all workers engaged in a labour relationship on the basis of a labour contract with enterprises, establishments, and organizations with all forms of ownership and management, as well as with individual citizens.
Coverage of workers in practice: Percentage not located by the ILO.
Evidence of implementation effectiveness: No information located by the ILO.
Ratification of ILO Conventions: The Minimum Wage Fixing Convention, 1970 (No. 131) was ratified in 2006.
Sources:1. NATLEX Database (http://www.ilo.org/dyn/natlex/natlex_browse.country?p_lang=en&p_country=UKR) and National legislation
(http://portal.rada.gov.ua/control/en/index).2. ILO TRAVAIL database, minimum wages
(http://www.ilo.org/dyn/travail/travmain.sectionReport1?p_lang=en&p_countries=UA&p_sc_id=1&p_year=2009&p_structure=1).3. Government report to the CEACR on the application of Convention No. 131 and CEACR comments
(http://webfusion.ilo.org/intranet/db/standards/normes/appl/appl-displaycomment.cfm?hdroff=1&ctry=0600&year=2009&type=R&conv=C131&lang=EN).
Ukraine_E_Second Edition.indd 17Ukraine_E_Second Edition.indd 17 16.09.13 10:4116.09.13 10:41
Decent Work Country Profile UKRAINE Second Edition18
seem to have been significant causes of the reces-sion, crisis response has imposed a heavy burden on wages in the public sector, pensions and mini-mum wages.
Maintaining workers’ purchasing power can pos-itively impact on economic recovery and wage policy could be improved by strengthening social dialogue. At the same time, it is urgent to pro-tect those most vulnerable to the impact of the crisis, i.e. those at the bottom of the wage scale. Increases in the minimum wage and industry
benchmarks on minimum payment for different skills categories, could be tools to achieve this objective and collective bargaining and tripar-tite dialogue could be employed to reach a con-sensus on these issues. The problems of wage arrears also need to be properly addressed, with a clear identification of the causes of the phe-nomenon and a list of consequent policy recom-mendations. Finally, wage policy should be seen in a more general context, in relationship with labour market developments, and taxation policy reforms.
Ukraine_E_Second Edition.indd 18Ukraine_E_Second Edition.indd 18 16.09.13 10:4116.09.13 10:41

Adequate working time is a major concern for workers, and its regulation has historically been an important aspect in improving overall work-ing conditions. Working hours was the subject of the first international convention adopted by the member states of the ILO in the Hours of Work (Industry) Convention, 1919 (No. 1), which estab-lished the general limit of six working days and eight hours per day. Although Ukraine has not rat-ified this convention, legislation has been enacted to regulate working hours (see Legal Framework Indicator 5 ‘Maximum hours of work’). This sec-tion reviews the situation in Ukraine with respect to excessive hours of work and employees who are involuntarily working reduced hours. At the same time, decent regulation of working time provides for the possibility of more flexible work schedules and free time for family responsibilities, educa-tion or secondary employment opportunities as well as the option to work short hours if the employee wishes.
The statutory duration of the working week in Ukraine is 40 hours. Data collected by the SSCU shows that between 1999 and 2003 a relatively stable share of some nine per cent of employed persons worked long hours (more than 40 hours per week). The proportion increased to some 13 per cent in 2004 and has since fallen to 11.3 per cent in 2011. Since 2000, consistently more men (13.8 per cent) worked long hours than women (8.6 per cent). The ratio of persons work-ing excessive hours (more than 48 hours), showed a similar trend, remaining stable at around four per cent until 2003, reaching a peak in 2004 and since declining to 3.7 per cent in 2011(see Table 4 ‘Decent working time’).
When disaggregated by sex, the data reveal con-sistent gender differences: over the whole period,
men were about twice as likely as women to work excessive hours. Further differentiation by age reveals that men aged 40 to 49 constitute the larg-est group of persons working excessive hours, fol-lowed by men of the 35 to 39 age group. At the same time, women aged 40 to 59 are most likely to work excessive hours.
Looking at status in employment, the large major-ity of people working excessive hours were employees (84.7 per cent in 2011), followed by own-account workers, excluding persons work-ing privately in agriculture (11.1 per cent). A small number of economic activities account for the majority of workers engaged in excessive hours. In 2011, these activities included whole-sale and retail trade, repair of motor vehicles, personal goods and household appliances; hotels and restaurants (306,000 workers), followed by construction (132,200 workers) and agriculture (81,400 workers). Between 1999 and 2011, the number of workers in construction who worked excessive hours almost doubled, and there was also a substantial increase in transport and com-munications. The most important reason for work-ing excessive hours was the desire to increase earnings.
Whereas some people work in excess of the legal maximum, others face a lack of work, or under-employment. In Ukraine, information is collected from enterprises on workers who are in a situa-tion of involuntary underemployment, i.e. they are available to work full time, but work part time at the initiative of the employer. Between 1995 and 2009, there have been two particularly large spikes in underemployment. The first was due to the severe problems of the Ukrainian economy that culminated in the late 1990s, and the second more recently to the current financial and eco-
4 Decent working time
Ukraine_E_Second Edition.indd 19Ukraine_E_Second Edition.indd 19 16.09.13 10:4116.09.13 10:41

Decent Work Country Profile UKRAINE Second Edition20
nomic crisis (see Chapter 1 ‘Social and economic context for decent work’).
Excluding those working at statistically small enterprises and for individual entrepreneurs, the number of underemployed workers tripled between 1995 and 1997 and continued to grow until 1999 when it reached 17.6 per cent. This percentage started to fall in 2000 and reached its historically lowest level of 4.4 per cent in 2007. However, in 2008, it shot up to 10.6 per cent and rose further to 19.4 per cent in 2009. In 2009, the number of workers shifted to short hours for economic reasons increased by 71.1 per cent for the entire economy on and by 50.4 per cent for industry. Each worker worked an average of 1,599 hours compared to 1,687 hours in 2008. Every fifth employee in Ukraine, over 2 million people, worked fewer hours than he or she would have liked to. Core sectors where the number of underemployed workers increased considerably included industry (increase of 331,400), transport and communications (171,100), trade (99,200), and construction (64,900). In the same period, the number of workers granted unpaid leave for a period of work termination, such as factory clo-sure, increased by more than half. The greatest increase in the number of those on unpaid leave took place in manufacturing, construction, educa-tion and trade.
Labour market employment indicators are gradu-ally stabilizing, and labour demand started to expand late in 2009. Consequently, the number of workers in involuntary part-time employment began to drop again: to a total of 13.6 per cent in 2010, and 8.6 per cent in 2011. In 2011 the number of employees who transferred to part-time work for economic reasons decreased by 557,900 peo-ple, including a fall of 227,600 in industry. The following economic activities also saw a reduction of involuntary part-time workers: transport and communication (by 76,600), trade and car repair (by 75,500 persons) and construction (by 65,900). The number of employees on leave without pay fell by almost half, with the sharpest declines in industry, construction and transportation.
Overall, progress in decent working time has been mixed. Between 2004 and 2011, some progress was made in reducing the share of per-sons engaged in excessive hours of work. Some of the sectors which employ the highest number of persons working excessive hours have made greater progress than others, notably, the whole-sale and retail trade, repair of motor vehicles, personal goods and household appliances, hotels and restaurants, and construction have reduced the proportion of workers engaged in excessive hours, while excessive hours remain widespread in construction. This phenomenon is also linked
Table 4. Decent working time
1998 1999 2000 2001 2002 2003 2004 2005 2006 2007 2008 .2009 2010 2011
Excessive hours (more than 48 hours per week)1 _ 4.0 3.5 3.9 3.7 4.1 6.9* 6.3 6.0 5.7 5.7 4.1 3.7 3.7
Male _ 5.3 4.4 4.9 4.8 5.4 8.6* 8.4 8.2 8.0 7.9 5.4 5.1 5.0
Female _ 2.8 2.5 2.8 2.6 2.9 5.2* 4.0 3.6 3.2 3.2 2.7 2.3 2.3
Employees on short hours, in % of registered employees2 17.5 17.6 13.3 13.3 12.4 11.3 8.8 7.4 5.4 4.4 10.6 19.4 13.6 8.6
Notes:1 Data for the years 1999-2003 were revised according to the demographic structure of the population as obtained from the All-Ukrainian Census
of 2001. This information for 1998 was not recalculated.2 Workers who were in a situation of involuntary underemployment (were available to work full time, but worked short hours at the initiative of the
employer). Information about “involuntary underemployment” was obtained from the enterprises.* Sample surveys on population activity in Ukraine were held on a quarterly basis between 1999 and 2003 and on a monthly basis since 2004.Source: SSCU, based on the Household Survey on Population Activity in Ukraine and the Enterprise Survey.
Ukraine_E_Second Edition.indd 20Ukraine_E_Second Edition.indd 20 16.09.13 10:4116.09.13 10:41

214. Decent working time
to falling incomes and rising debt among many families negatively affected by the financial cri-sis. Regarding underemployment, substantial progress was made in reducing its occurrence between 1995 and 2007; however the global financial crisis reversed these positive develop-ments. As economic recovery kicked off, under-
employment fell again over the course of 2010 and 2011. To summarize, in spite of general progress made in this dimension of decent work, Ukraine continued efforts are needed to tackle the root causes of excessive hours as well as involuntary part-time employment and the prac-tice of unpaid leave.
Legal Framework Indicator 5. Maximum hours of workLaw, policy or institutions: The Labour Code 1971, as amended, regulates working hours in Ukraine. A new Labour Code is currently being drafted.
Number of hours allowed: The normal duration of working time cannot exceed 40 hours a week. Shorter hours are estab-lished for younger workers (e.g. working time may not be greater than 36 hours per week for workers aged between 16 and 18 years. This is halved if the worker is studying). Enterprises can establish a shorter working week or day through a collective agreement. Increasing working time by agreement may not exceed four hours per 48 hours of work, or 120 hours per year.
Evidence of implementation effectiveness: No information located by the ILO.
Coverage of workers in law: The Labour Code 1971 applies to workers in all enterprises regardless of property pattern, type of activity or sector of the economy. The Labour Code also applies to persons employed by other persons under an employment agreement. Labour relations in cooperatives, collective agricultural enterprises, farms, and enterprises with foreign investments are governed by special legal acts.
Coverage of workers in practice: No information located by the ILO.
Ratification of ILO Conventions: The Forty-Hour Week Convention, 1935 (No. 47) was ratified in 1956; the Weekly Rest (Industry) Convention, 1921 (No. 14) and the Weekly Rest (Commerce and Offices) Convention, 1957 (No. 106) were both ratified in 1968. The Hours of Work (Industry) Convention, 1919 (No. 1) and Hours of Work (Commerce and Offices), 1930 (No. 30) have not been ratified.
Source:1. National legislation in NATLEX (http://www.ilo.org/dyn/natlex/natlex_browse.country?p_lang=en&p_country=UKR).
Legal Framework Indicator 6. Paid annual leaveLaw, policy or institutions: The Labour Code 1971, as amended and the Act on Leave 1996 provide for annual leave.
Leave duration: In addition to national holidays, workers are entitled to a minimum of 24 calendar days of paid leave (31 days for workers under 18 years of age). Some categories of workers are entitled to a longer duration of paid annual leave (workers in the mining and extractive industry, forestry workers, managers in educational institutions and persons with disabilities).
Evidence of implementation effectiveness: No information located by the ILO.
Coverage of workers in law: The Labour Code 1971 applies to workers in all enterprises regardless of property pattern, type of activity or sector of the economy. The Labour Code also applies to persons employed by other persons under an employment agreement, foreigners and stateless persons working in Ukraine.
Coverage in practice: No information located by the ILO.
Ratification of ILO Conventions: the Holidays with Pay Convention (Revised), 1970 (No. 132) was ratified in 2001.
Source:1. National legislation in NATLEX (http://www.ilo.org/dyn/natlex/natlex_browse.country?p_lang=en&p_country=UKR).
Ukraine_E_Second Edition.indd 21Ukraine_E_Second Edition.indd 21 16.09.13 10:4116.09.13 10:41

Ukraine_E_Second Edition.indd 22Ukraine_E_Second Edition.indd 22 16.09.13 10:4116.09.13 10:41

Enabling workers to combine work with family responsibilities and aspirations for their personal life is an important element of the Decent Work Agenda, and the Ukrainian government is working towards fully implementing national legislation that was adopted with this aim. Ukraine has ratified the Maternity Protection Convention (Revised), 1952 (No. 103) and the Workers with Family Responsi-bilities Convention, 1981 (No. 156), but not the new Maternity Protection Convention, 2000 (No. 183) (see Legal Framework Indicator 7 ‘Maternity leave’ and Legal Framework Indicator 8 ‘Parental leave’). In a Direct Request, the CEACR noted that a draft state programme on the promotion of gender equal-ity in Ukrainian society for 2006 to 2010 had been prepared which provides for measures aiming at creating equal conditions for men and women to combine work and family responsibilities. This will also be promoted to a considerable extent by the adoption of the new Labour Code by the Parliament.
Over the last twelve years, the relative number of workers on leave to care for a child until attain-ment of statutory age amounted to 3.4 per cent of employees. While the proportion of workers on leave for childcare has gradually increased over the last decade, the number continues to drop: in 2010 the number of workers on leave for child care at 462,700, was 21 per cent below that in 1998, and was a further decrease in 2011 brought the number to 448,200.
The current challenges become apparent from a survey on decent work conducted by the SSCU in 2003. Approximately 60.3 per cent of women and 63.5 per cent men of working age stated that it was easy or relatively easy for them to combine work with family life. However, many respondents (almost 28 per cent of women and over 24 per cent of men) said that it was relatively difficult, and
approximately ten per cent said that it was quite difficult or impossible for them to do so. For par-ents of pre-school age children, the task is signifi-cantly more difficult. Among them, about half of all respondents stated that it was relatively difficult, difficult or impossible to combine work with fam-ily responsibilities. The proportion is higher among women, who traditionally bear the majority of fam-ily responsibilities. Perceptions on the difficulty of combining work and family responsibilities vary depending on the age of workers. The larg-est share of optimistic responses (“easy” and “rela-tively easy”) belonged to the youngest age groups. While older respondents, with growing work-place demands, tended to view the combination of employment with family duties as more difficult. The most difficult phase is generally between the age 25 and 40 years: when children grow up and become more independent, combining work and family life generally becomes easier again.
In families with small children, the law guaran-tees work security until the child reaches a three years of age (six years if the child needs special care). This means one parent can remain at home and later return to their employment. Women overwhelmingly make use of this leave. However, many women work fulltime in addition to their care responsibilities. Research shows that work-ing mothers with children of pre-school age do not have shorter working hours than women without children, and that some 14 per cent of them actu-ally work long hours i.e., more than the 40 hours per week stipulated by national legislation (see also Chapter 4 ‘Decent hours’ and Legal Frame-work Indicator 5 ‘Maximum hours of work’).1 The
1 Data refer to 2003, see SSCU: An excerpt from a concise review of results of a population survey held by state statistics bodies in September 2009 concerning subjective assessment of some aspects of working life in the decent work context.
5 Combining work, family and personal life
Ukraine_E_Second Edition.indd 23Ukraine_E_Second Edition.indd 23 16.09.13 10:4116.09.13 10:41

Decent Work Country Profile UKRAINE Second Edition24
Labour Code stipulates that the decision to offer part-time work to parents with children aged under 14 years and those with older disabled children can be made by the employer. Part-time workers are paid based on the time worked (i.e. they have a reduced take-home pay), but they maintain all the benefits and rights of regular full-time employees.
The proportion of female workers on maternity leave fell from 0.9 per cent of female employees in 1998 to 0.6 per cent in 2000, and has remained stable since. However, the number of women on maternity leave has steadily declined: from 134,800 in 1998 to 62,400 in 2010. These num-bers increased by 1.3 per cent in 2007 and 9.2 per cent in 2008 following the implementation of gov-
ernmental measures since early 2005 to support families and encourage fertility. However, that trend was reversed during the financial and eco-nomic crisis that shook the confidence of young families and the position of young female workers in the labour market.
By international standards, Ukrainian legislation provides strong maternity leave rights. On present-ing a medical certificate, women are granted paid maternity leave with a total duration of 18 weeks. This is in line with the Maternity Protection Rec-ommendation, 2000 (No. 191), although Ukraine has not signed it (see also Legal Framework Indi-cator 7 ‘Maternity leave’). Women have the right to return to the same job after their maternity
Legal Framework Indicator 7. Maternity leaveLaw, policy or institutions: Relevant legislation includes the Labour Code 1971, as amended, the Law on the state assistance to families with children 1992, the Act on Leave 1996, and the Law on the general compulsory State social insurance against temporary loss of working capacity and expenses due to birth and burial 2001. The MLSP, Ministry of Finance and the FSITLWC provide general oversight of the programme for cash benefits. The Ministry of Health and health departments of local governments provide general oversight and coordinate medical benefits.
Benefits (level and duration): Women employees are entitled to a paid maternity leave of 126 days (70 days before and 56 days after expected date of childbirth, or 70 days after in cases of complicated or multiple births) with a cash benefit amounting to 100 per cent of their average monthly earnings. For women on leave for education and training, the allow-ance is equal to 100 per cent of the stipend; women who have been registered as unemployed for at least ten months receive 100 per cent of minimum wage; spouses of members of the armed forces receive 100 per cent of earnings of the spouse. Non-working women and women who are not insured under the State social insurance system receive cash benefits from the social protection authorities at a rate of 25 per cent of the subsistence minimum.
Financing: Cash benefits (both sickness and maternity benefits): contributions from insured persons (0.25 per cent to 0.5 per cent of earnings) and from employers (2.5 per cent of payroll). Self-employed: three per cent of declared income. Allocations from the state budget for health care increased to 7.4 per cent of the total social expenditure in 2007.
Evidence of implementation effectiveness: In its report to the CEACR on Convention No. 156 the Government stated that many young women give up their social benefits in order to keep working.
Coverage of workers in the law: employed women, including women on leave to pursue education or training, women unemployed as a result of enterprise liquidation, registered unemployed women and wives of military personnel.
Coverage of workers in practice: cash benefits: employed women, including women on leave to pursue education or training; unemployed women as a result of enterprise liquidation; registered unemployed women; and wives of military personnel; sickness benefits: all persons living in Ukraine.
Ratification of ILO Conventions: The Maternity Protection Convention (Revised), 1952 (No. 103) was ratified in 1956.
The Social Security (Minimum Standards) Convention, 1952, (No. 102), and The Maternity Protection Convention, 2000 (No.183) have not been ratified.
Sources:1. ISSA data base, supplemented by Social Security Throughout the World, (Social Security Administration of the United States, September
2008) (http://www.issa.int/aiss/Observatory/Country-Profiles/Regions/Europe/Ukraine).2. The Government’s Report to the Committee of Experts on Convention No. 103.3. NATLEX database (http://www.ilo.org/dyn/natlex/natlex_browse.country?p_lang=en&p_country=UKR).
Ukraine_E_Second Edition.indd 24Ukraine_E_Second Edition.indd 24 16.09.13 10:4116.09.13 10:41

255. Combining work, family and personal life
leave. There is also guaranteed parental leave for both parents, which entitles parents to take leave care for a child under the age of three, and receive benefit from the state budget funds. The employer can decide to give a longer leave with or without pay. Parental leave can also be taken by grand-parents or other relatives who are taking care of the child (see also Legal Framework Indicator 8 ‘Parental leave’).
The Ukrainian government devotes substantial and increasing funds to maternity benefits, with disbursements paid from the state budget and the FSITLWC. Payment of maternity benefits to insured persons within the system of social insur-ance increased from 9.2 per cent (UAH 307.3 mil-lion) of the State Social Insurance Fund’s total expenditure in 2004 to 23.4 per cent in 2011 (UAH 1.8 billion). The budget expenditure in 2009 for maternity benefits to uninsured women within this system amounted to UAH 205 million, which was 2.5 times greater than in 2004 (UAH 82.8 million).
Women are entitled to maternity benefits, irre-spective of whether they are covered by existing state social insurance. For female military per-sonnel, benefits are paid in the amount of 100 per cent of cash allowance paid to the woman at her principal place of employment (service). Mater-nity leave benefits are paid to working women for 126 days at a rate equal to 100 per cent of previous earnings (for details see Legal Framework Indi-cator 7 ‘Maternity leave’). The payment is made by the employer when the employee provides all the necessary documents, and the employer is subsequently reimbursed by the FSITLWC (con-cerning insured persons). However, employers experience difficulties in following the rules and regulations and thus in making payments within the stipulated time frame. Employers often expe-rience a long delay before being reimbursed by the FSITLWC leading to delays in the payment of benefits to employees. Moreover, penalties for delays in payment are not prescribed for in the legislation.
Legal Framework Indicator 8. Parental leaveLaw, policy or institutions: Relevant legislation includes the Labour Code 1971, as amended and the Law on ensuring equal rights and opportunities of women and men 2006. According to the Government’s report on the implementa-tion of Convention No. 156, a draft State programme on promotion of gender equality in Ukrainian society for 2006 to 2010 had been developed, which includes measures to provide equal opportunities for women and men to combine occupational and family responsibilities.
Benefits (level and duration): According to the 2006 Equal Rights Law, an employer is required to provide men and women with the possibility of combining work and family responsibilities. Any relative of the child is entitled to take child care leave until the child reaches three years of age (or six years on presentation of a medical certificate) and has the right to benefits amounting to the difference between 100 per cent of the subsistence minimum specified for able-bodied persons (UAH 1,073 since 1 January 2012) and the family’s average monthly gross per capita income for the preceding six months, but cannot be less than a guaranteed minimum of UAH 130. A person on parental leave may work part-time or at home. In case of child adoption, one of the parents who adopted a child above three years of age is granted a one-time paid leave for 56 calendar days (70 calendar days for adoption of two or more children).
Evidence of implementation effectiveness: No information located by the ILO.
Coverage of workers in law: The Labour Code 1971 applies to workers in all enterprises regardless of property pattern, the type of activity or the sector of economy. The Labour Code also applies to persons employed by other persons under an employment agreement.
Coverage of workers in practice: No percentage located by the ILO.
Ratification of ILO Conventions: The Workers with Family Responsibilities Convention, 1981 (No. 156) ratified in 2000.
Sources:1. National legislation (see NATLEX database) (http://www.ilo.org/dyn/natlex/natlex_browse.country?p_lang=en&p_country=UKR);2. he Government’s report to the Committee of Experts and the Committee’s comments on the Convention No. 156
(http://webfusion.ilo.org/public/db/standards/normes/appl/appl-displaycomment.cfm?hdroff=1&ctry=0600&year=2007&type=O&conv=C156&lang=EN and http://webfusion.ilo.org/public/db/standards/normes/appl/appl-displaycomment.cfm?hdroff=1&ctry=0600&year=2007&type=R&conv=C156&lang=EN).
Ukraine_E_Second Edition.indd 25Ukraine_E_Second Edition.indd 25 16.09.13 10:4116.09.13 10:41
Decent Work Country Profile UKRAINE Second Edition26
In addition, labour and social security authori-ties pay maternity benefits to: women dismissed because of the liquidation of an enterprise, insti-tution and organization (100 per cent of aver-age monthly income); women registered with an employment centre as unemployed (100 per cent of the minimum unemployment benefit rate); postgraduates, doctoral students, resident medical practitioners, students of higher educational insti-tutions of accreditation levels I-IV and vocational education institutions (100 per cent of monthly scholarship); and non-working women (25 per cent of the subsistence minimum).
Providing child care is another crucial factor to allow working parents, particularly women, to combine work and care responsibilities. In 2004, the CEACR had expressed concern over the dete-riorating situation of community child care and family services and facilities in Ukraine, espe-cially in rural areas, and drew attention to the negative impact on the employment situation of workers, particularly women, with family respon-sibilities. More recently, the Committee noted that 9,299 pre-school institutions were available in rural areas, compared to 6,679 in urban areas, and that coverage of pre-school education had improved in recent years. The share of children enrolled in pre-school education increased from 39 per cent of all pre-school children in 1999 to 55 per cent in 2011 (see Table 5 ‘Combining work, family and personal life’). Attendance is higher in urban areas, as according to the SSCU, rural areas are still not fully covered by pre-school day-care services and record a low attendance rate of just 35 per cent.
The difficulties in combining work and fam-ily responsibilities are a major and increasingly important reason for workers to remain outside the labour force. Data from the SSCU show that the share of the inactive population who do not seek employment due to family responsibilities (such as taking care of children and other family members) increased sharply from 6.2 per cent in 1999 to 19.2 per cent in 2011 (see Table 5 ‘Com-bining work family and personal life’). The data confirm that women’s labour market participation suffers most: the proportion of women that were economically inactive due to family responsibili-
ties rose from 9.3 per cent in 1999 to 25.6 per cent in 2011, compared to 1.6 per cent of men in 1999 and nine per cent in 2011. The total size of this group increased from 852,300 in 1999 (765,900 women and 86,400 men) to 2,351,900 in 2011 (1,924,400 women and 427,800 men), again highlighting the large gender disparity.
The growth of family benefits, which are linked to the minimum wage has contributed to the ris-ing number of people who are economically inac-tive for family reasons. The first component of the family benefit is the state birth allowance that is paid by the government in order to overcome a demographic crisis and provide proper condi-tions for the healthy development of the child. The birth allowance was introduced in 2005 and in that year, total expenditure for family benefits was UAH 1.53 billion and was some seven times greater than expenditure in 2004 (UAH 225.7 mil-lion). Spending on family benefits has continued to grow annually and in 2009 it amounted to UAH 8.4 billion.2 The birth allowance is paid to one of the parents or caretakers of the child regardless of whether they continue to work, in the amount of UAH 12,240 for the first child, UAH 25,000 for the second child, and UAH 50,000 for the third and any subsequent children. The allowance is paid through an initial lump sum at the birth of the child: UAH 4,800 for the first child, UAH 4,840 for the second child, and UAH 5,000 for the third. The rest of the allowance is paid in instal-ments: UAH 620 per month over the following 12 months for the first child; UAH 840 per month over 24 months for the second child, and UAH 1,250 per month over 36 months for the third and subsequent children.3 A more recent resolution has changed the calculation of the birth allowance for all children born after 31 December 2011, to the effect that the parents or caregivers receive an allowance worth thirty times the minimum monthly subsistence rate for the first child; sixty
2 Prior to 2007, financing was provided from the FSITLWC and State Budget funds. Since 2007, this expenditure has been com-pletely financed from the State Budget via the labour and social protection authorities.
3 The procedure of assignment and payment of state assistance to families with children was approved by the Cabinet of Ministers Resolution No. 1751; for children born after 31 December 2007 see also the Cabinet of Ministers Resolution No. 57 of 22 Febru-ary 2008.
Ukraine_E_Second Edition.indd 26Ukraine_E_Second Edition.indd 26 16.09.13 10:4116.09.13 10:41

275. Combining work, family and personal life
times for the second child and 120 times for the third and every subsequent child.
The second component of the family benefit con-sists of parental leave benefits that are granted for
three years if one of the parents decides to give up work in order to take care of a child or works on a part-time basis. The benefit is equal to the difference between 100 per cent of the subsist-ence minimum specified for able-bodied persons
Table 5. Combining work, family and personal life
1998 1999 2000 2001 2002 2003 2004 2005 2006 2007 2008 2009 2010 2011
Relative number of workers on leave to care for a child until attainment of a statutory age, in % of the registered number of employees 4.0 3.6 3.2 2.9 3.0 3.0 3.1 3.2 3.3 3.4 3.7 4.2 4.2 4.2
Relative number of women on maternity leave, in % of the registered number of employees 0.9 0.7 0.6 0.6 0.6 0.6 0.6 0.5 0.5 0.5 0.6 0.5 0.5 0.6
Share of economically inactive population (due to performing household (family) duties, care for children, sick and other family members), in %1 _ 6.2 8.2 10.8 10.8 10.6 11.2* 13.3 14.5 14.9 15.7 16.4 17.4 19.2
Men _ 1.6 2.3 4.7 5.2 5.4 3.9* 3.6 5.6 6.2 6.2 7.1 8.0 9.0
Women _ 9.3 12.3 15.1 14.8 14.2 16.2* 19.7 20.3 20.5 21.7 22.5 23.6 25.6
Preschool education enrolment rate, in %2 38 39 40 41 48 49 50 51 53 54 54 53 53 55
Total fertility rate (per 1 woman) 1.2 1.1 1.1 1.1 1.1 1.2 1.2 1.2 1.3 1.3 1.5 1.5 1.4 _
Notes:1 Data for the years 1999-2003 were revised according to the demographic structure of the population as obtained from the All-Ukrainian Census
of 2001. Sample surveys on population activity in Ukraine were held on a quarterly basis between 1999 and 2003 and on the monthly basis since 2004.
2 This indicator is calculated as the ratio of the total number of children in preschool facilities to the total number of children aged one to six (net of children in the first forms organized in schools).
* Series break due to shift from quarterly to monthly surveys.Source: SSCU, based on household surveys on population activity in Ukraine and enterprise survey.
Ukraine_E_Second Edition.indd 27Ukraine_E_Second Edition.indd 27 16.09.13 10:4116.09.13 10:41

Decent Work Country Profile UKRAINE Second Edition28
(UAH 1,073 since 1 January 2012) and the fam-ily’s average monthly gross per capita income for the preceding six months, but cannot be less than a guaranteed minimum of UAH 130. Total expenditure for this type of benefit increased from UAH 728.5 million in 2004 to UAH 2.5 billion in 2009, or 3.4 times.
The third component consists of benefits granted by the Government for every child according to the status of their parents, including whether they are: single mothers, widows, widowers, caretak-ers, low-income or part of a large family. Total expenditure for these benefits increased from UAH 1.2 billion in 2004 to UAH 3 billion in 2009 (see Legal Framework Indicator 8 ‘Parental leave’).
While the cash benefits have improved conditions for families, the structure of benefits has raised concerns that it encourages parents to remain out-side the labour market and may increase discrimi-nation against women, rather than providing con-ditions for combining work and family respon-sibilities. It is largely women who have taken up parental leave entitlements, which restricts their competitiveness in the labour market. Women’s marginalization in the labour market takes the form of employment in low-paid work that does not match a woman’s education, qualifications or career ambitions, and does not provide proper social security or employment guarantees (see also Chapter 8 ‘Equal opportunities and treatment in employment’). Women in low-paid work change their employment frequently, do not receive wages for extended periods, and commonly are the only
income earner in the household. Many of them consider their work undesirable and see it as a short-term solution, despite the fact that they stay in these types of jobs for long periods of time, while their skills are decreasing.4
In sum, the Ukrainian Government has made a substantial investment in order to improve the conditions for workers with family responsi-bilities and increased expenditure on maternity benefits, social child allowances and parental leave benefits. The CEACR recently encouraged the Government to promote further social dia-logue on these issues, and to provide informa-tion on any developments or outcomes, includ-ing on any steps to ensure that measures aimed at enabling workers to reconcile work and family obligations are available to and used by men and women.5 While the legal protection of working parents is strong, this at times creates disincen-tives for employers to employ young women and discourages parents with small children from re-entering the labour force. Improvements in social care provisions, including for children under the age of three years, could also be a useful strat-egy to increase the employment rate of women, promote positive gender equality outcomes, and to increase fertility. Despite the Government’s investment into family benefits, the fertility rate in Ukraine is below the 1991 level when independ-ence was gained, and below replacement level at 1.4 in 2010.6 Meeting implementation challenges will be essential to allow parents to combine work and family responsibilities, as well as to counter Ukraine’s demographic crisis of low fertility and ageing population.
4 See also Ministry of Ukraine for Family, Youth and Sport: Women at the labour market and the ways to solve their problems, 1998; and E. Libanova, O.Makarova: Women›s access to labor market, p. 42
5 CEACR: Individual Direct Request concerning Workers with Family Responsibilities Convention, 1981 (No. 156) Ukraine (ratification: 2000) Submitted: 2008.
6 SSCU: http://www.ukrstat.gov.ua/ (accessed 11 Nov 2012).
Ukraine_E_Second Edition.indd 28Ukraine_E_Second Edition.indd 28 16.09.13 10:4116.09.13 10:41

The transition to a market economy in Ukraine led to the collapse of the old state-run social institutions that formerly provided aid to families with children. As a result, families were no longer able to maintain living standards at a level to meet their children’s basic daily needs, such as food and clothing. Accord-ing to Child Labour in Ukraine in 1999,1 3.8 per cent of children aged five to 17 years were engaged in economic activity in Ukraine, with the prevalence of economic work higher among boys (4.9 per cent) than among girls (2.7 per cent) and in rural areas (5.2 per cent) than urban areas (3.2 per cent). Economically active children aged 15 to 17 were employed mainly in the agricultural (46 per cent), trade (26 per cent) and service (19 per cent) sectors. The overall school attendance rate among children was 86.4 per cent, with almost no variation between boys (86.2 per cent) and girls (86.6 per cent). Seri-ous concern was caused by the long duration of chil-dren’s working days. Almost six per cent of working children aged 13 to 14 years worked over 40 hours per week, whereas two per cent of boys and girls aged 15 to 17 years worked more than 56 hours per week. The report concluded that the level of child employment was inversely related to the level of family well-being, and that the main reason children entered employment was a lack of material well-being in the household. The likelihood of a child entering employment was also found to increase with the number of children in the household.
According to the results of a rapid assessment car-ried out by the ILO’s International Programme on the Elimination of Child Labour (IPEC) in 2006, the Worst Forms of Child Labour in Ukraine are common in agriculture, street trade, informal coal
1. ILO, SSCU: Child Labour in Ukraine 1999, Statistical Bulletin, Kyiv 2001. See also ILO: Ukraine Child Labour Data Country Brief, Geneva http://www.ilo.org/ipecinfo/product/download.do?type=document&id=7806 (accessed 11 Nov 2012)
mines, the entertainment industry (work in bars and night clubs), the sex industry (prostitution and pornography), and other illegal activities. Over the nine years that the ILO-IPEC operated in Ukraine, considerable efforts were put into training key stakeholders on the elimination of child labour, including educators, psychologists, social workers, civil servants of various levels and journalists.
A growing number of legal measures have been taken to address the issue of child labour. Ukraine ratified the Minimum Age Convention, 1973 (No. 138) in 1979, and the Worst Forms of Child Labour Conven-tion, 1999 (No. 182) in 2000. The minimum age for employment is set at 16 years and national legislation forbids the employment of children under 18 years from engaging in any type of employment or work which, by its nature or the circumstances in which it is carried out, is likely to jeopardize their health, safety or morals. However in some circumstances, individ-uals under 18 years are allowed to perform certain types of hazardous work for training purposes. The inadequacy of the existing provisions regulating the instruction and monitoring of minor trainees before and during training was pointed out in a report by the CEACR (see Legal Framework Indicator 8 ‘Child labour’). In practice, the number of young people under 16 involved in hazardous work has increased, particularly in the informal sector where control of the use of child labour remains an issue.2
Ukraine is a point of origin for the international trafficking of men, women and children to Rus-sia, Turkey, the Middle East and Western and Central Europe, particularly Poland and the Czech Republic, as well as a transit country for the traf-ficking of individuals from Central Asia, Russia
2. ILO: Committee of Experts on the Application of Conventions and Recommendations, Conclusion on ILO Convention No. 138, Ukraine, 2008.
6 Work that should be abolished
Ukraine_E_Second Edition.indd 29Ukraine_E_Second Edition.indd 29 16.09.13 10:4116.09.13 10:41

Decent Work Country Profile UKRAINE Second Edition30
and Moldova to Turkey and the United Arab Emir-ates.3 According to the results of a recent Inter-national Organization for Migration study, some 100,000 Ukrainian citizens have become vic-tims of human trafficking since 1991, mainly for labour exploitation. Large-scale child prostitution and trafficking in children remain a serious prob-lem in Ukraine. Children are recruited for cross-border human trafficking mainly through friends and acquaintances, and for internal trafficking through the family members, often parents of the victims.4 The majority of children who are traf-ficked are aged between 13 and 18 years. Girls are more likely to be sexually exploited, whereas boys
3. US Department of State: 2007 U.S. Human Rights Practices Country Report on Ukraine (2007), 2008.
4. UN: Report of the UN Special Rapporteur on Child Trafficking, Child Prostitution and Child Pornography, January 2007.
are reported to be used as cheap labour in illegally operated mines, in construction and agriculture, or to peddle drugs.5
The public education system in Ukraine suffers from chronic underfunding and children dropping out of schooling early is an on-going problem among children from poor families.6 The net sec-ondary enrolment rate declined from 90.7 per cent in 2000 to 85.0 per cent in 2008 (see also Chap-ter 1 ‘Economic and social context for decent work’). Although at the same time, there has been an increase in the number of students in tertiary
5. ILO: Report of the Committee of Experts on the Application of Conventions and Recommendations, Observation, CEACR 2007 / 78th session.
6. US Department of State: 2008 Country Report on Human Rights Practices, Ukraine, 2009.
Legal Framework Indicator 9. Child labourLaw, policy or institutions: The minimum age for employment is 16 years under the Labour Code 1971, as amended. Light work, with parental consent, is authorized for students in general vocational and technical scientific institutions or specialized secondary educational institutions from 14 years of age. Exploitation of children who are under the legally employable age is a criminal offence under the Criminal Code 2001.
Under the legislation, however, children aged 15 years and above may exceptionally be authorized to work with the consent of their parents or guardians. This issue has been raised for many years by the CEACR and was also discussed by the Conference Committee on the Application of Standards in 2004. Furthermore, the CEACR noted that legislation seems to allow children between the ages of 14 and 16 years who are enrolled in vocational institutions to perform certain types of hazardous works under specific conditions. The CEACR noted that the legislation does not stipulate a minimum age for admission to training and does not adequately protect trainees who are performing hazardous work. It has requested that the Government ensure that children who participate in vocational training programmes or appren-ticeships be allowed to do hazardous works only from the age of 16 years, in conformity with Convention No. 138. The draft Labour Code is reported to comply with ILO standards and includes an article on prohibition of the worst forms of child labour.
Evidence of implementation effectiveness: In its report to the CEACR, the Government stressed the difficulty in accessing workplaces and applying administrative sanctions in the informal sector. The Government also reported that, as a result of inspections carried out in 2008 in 660 enterprises, violations of child labour legislation were identified concerning 2,237 minors. Of these, 66 of the working children were under the age of 14 years, and 64 were engaged in agricultural work. Other violations were committed concerning record-keeping of young persons’ information by employers, children working under severe and harmful working conditions, and long working hours. Some 453 orders and directives were issued by labour inspectors against employers for violations of the provisions of child labour, and 351 notices were issued to the court to bring employers to administrative responsibility. The CEACR noted that state bodies are currently assisting children under the minimum age in their search for employment. ILO assistance has been provided, and under a programme that ended in 2006, a number of children were freed from child labour or prevented from entering it, and the Child Labour Monitoring System has been established.
Ratification of ILO Conventions: The Minimum Age Convention, 1973 (No. 138) was ratified in 1979, and the Worst Forms of Child Labour Convention, 1999 (No. 182) was ratified in 2000.
Notes:1. Children aged five to 17 years. Results from the National Child Labour Survey (ILO/SIMPOC, 1999).Source: National Child Labour Survey, 1999.
Ukraine_E_Second Edition.indd 30Ukraine_E_Second Edition.indd 30 16.09.13 10:4116.09.13 10:41

316. Work that should be abolished
education from 1.9 million in 2001 to 2.6 million in 2010, partly due to the establishment of private higher educational institutions.7 The share of the 9th form graduates who continue studies to com-plete general secondary education increases every year (from 97.7 per cent in 2000 to 99.1 per cent in 2009). In 2009, 61.2 per cent of the graduates passed to general educational institutions, 3.4 per cent went to evening schools, 17.6 per cent to vocational education institutions, and 16.9 per cent entered higher educational institutions.8
At the national level, since 2005, the State Depart-ment for the Supervision over Labour Legislation Observance, Ministry of Labour and Social Policy (the Derzhnahliadpratsi) has been involved in the
7. UNICEF: Transmonee database Indicator 7.18 “Number of stu-dents enrolled in tertiary education (ISCED 5)”, http://www.unicef-irc.org/databases/transmonee/ (accessed 11 Nov 2012).
8. SSCU: http://www.ukrstat.gov.ua/ (accessed 11 Nov 2012).
implementation of the ILO-IPEC project: Institutional development of labour inspection through participa-tion in a system of child labour monitoring in two pilot regions, Donetsk and Kherson. Within the framework of this project, a series of extra-curricular activities were organized for targeted children based on the ILO-IPEC SCREAM methodology: Supporting chil-dren’s rights through education, arts and media, and a number of other informal education methodologies and programmes, such as peer-to-peer teaching, step-by-step education, critical thinking and economic education, were introduced in order to improve the standard of education provided to children.
Furthermore, a number of government programmes have been implemented to address the situation of particularly vulnerable children, including street children. These include: the State programme to combat child homelessness and neglect (2006-2010), the 2006 concept programme on reforming
Legal Framework Indicator 10. Forced labourLaw, policy or institutions: The Constitution of Ukraine contains provisions prohibiting the use of forced labour (article 43). Trafficking is considered a criminal offence under the Criminal Code 2001 and is punishable by imprisonment of three to eight years; if trafficking involves children, the penalty is five to 12 years of imprisonment. Various measures have been adopted by Ukraine to prevent and combat trafficking; a National Plan of Action (2007-2010) to combat human trafficking was adopted in March 2007.
Evidence of implementation effectiveness: The Government reported that it completed 82 criminal investigations and arrested 56 people on trafficking charges in 2007. The Interior Ministry reported that the number of prosecutions for labour trafficking increased from three in 2006 to 23 in 2007. The ILO has noted that human resources to combat traf-ficking have been strengthened considerably, and specialist training has also been provided for members of the judici-ary. By 2008, 30 anti-trafficking officers were employed by the Anti-Trafficking Department in the Ministry of Internal Affairs, with similar units existing at the oblast and precinct levels, creating a total of over 600 anti-trafficking officers in all. Specialist training on human trafficking is also provided for members of the security services, and for judges as part of their standard training programme. However, both the ILO (through IPEC and the CEACR) and the United Nations Committee on the Rights of the Child have expressed concern over information that Ukraine is not only a source country of trafficking victims but also an important transit route from other countries in the region.
In its comments concerning the application of Convention No. 105 (2007 and 2009 Direct Requests), the CEACR has expressed concern about various provisions on offences concerning the expression of political views, participation in strikes and labour discipline that may result in sentences involving labour; it is awaiting further explanations from the Government.
Ratification of ILO Conventions: The Forced Labour Convention, 1930 (No. 29), was ratified in 1956; the Abolition of Forced Labour Convention, 1957 (No. 105), was ratified in 2000; the Worst Forms of Child Labour Convention 1999, (No. 182), was ratified in 2000.
Sources:1. CEACR observations and direct requests on Conventions No. 29, No. 105, and No. 182;2. J. Kane: Child trafficking – the people involved: A synthesis of findings from Albania, Republic of Moldova, Romania and Ukraine
(Geneva, ILO/IPEC, 2005);3. ILO: The cost of coercion - Global Report under the follow-up to the ILO Declaration on Fundamental Principles and Rights at Work,
Report IB, International Labour Conference, 98th Session, Geneva, 2009.
Ukraine_E_Second Edition.indd 31Ukraine_E_Second Edition.indd 31 16.09.13 10:4116.09.13 10:41

Decent Work Country Profile UKRAINE Second Edition32
the boarding system for child-orphans and chil-dren deprived of parental care and the National action plan to implement the convention on the rights of the child (2006-2016). As a result of these and other government initiatives, children have received social and psychological rehabili-tation through placement in orphanages and have been re-enrolled in school. In addition, a system of social family monitoring was introduced in 2005 that aims to help families in difficult situations and prevent children from being placed in state care.9
According to the Government, inspections carried out by the Derzhnahliadpratsi in 2005 and 2006 identified 335 violations of legislation with respect to overtime or night employment of minors, a total of 995 orders were issued to stop these violations and 68 employers were subjected to administrative penalties. In 2010, 150 such violations were identi-fied, 274 orders were issued and 199 administrative penalties were applied. In addition, 40 cases relat-ing to the illegal child labour were documented. During the same period, 175 minors who were victims of child labour were documented as being involved in criminal activity, drinking alcohol and begging or gambling. Moreover, 2,743 cases relat-ing to crimes committed by adults against children (including organization/operation of an illegal establishment and the production of narcotics/psy-chotropic substances) were reported in 2005.10
Ukraine has had a number of successes in the elimination of child labour in Ukraine. Data pro-
9. Direct Request by the Committee of Experts, 2008.10. Direct Request by the Committee of Experts, 2008.
vided by the Service for Minors indicates that of 7,050 children who did not attend school in 2006, a total of 3,223 (46 per cent) were reintro-duced to school.11 Over the nine years of the ILO-IPEC activities in Ukraine, 5,750 children were withdrawn from the worst forms of child labour or protected from trafficking related situations, through the provision of necessary services such as: vocational guidance and training, out-of-class activities and training, individual tutoring, sum-mer camps, access to medical services and legal advice and provision of school supplies. More than 4,000 parents of working children, children withdrawn from child labour, and children from a risk group were given advice concerning: 1) avail-able job placement opportunities for the parents; 2) retraining courses for the unemployed under the PES; 3) availability of state social assistance to low-income families. They were familiarized with child labour problems and possible conse-quences of early job placement of their children. Additionally, improvements in parent monitoring and inspection aided a reduction in the number of abandoned and homeless children. In Ukraine, 37,200 homeless children were found during 2007, 31,000 during 2008, and 22,700 during 2009.
Specific issues faced by the children of migrant workers need further attention. While children can benefit from the boost to family income derived from remittances, concerns have been raised that distance from parents can lead to higher rates of school absenteeism and a decline in school per-formance and behavioural problems.
11. Direct Request by the Committee of Experts, 2008.
Table 6. Work that should be abolished
1998 1999 2000 2001 2002 2003 2004 2005 2006 2007 2008 2009 2010 2011
Child labour, in % of the total number of children in the corresponding age group1 3.8
Boys 4.9
Girls 2.7
Source:1 Committee of Experts comments and Government reports under Conventions No. 138 and No. 182.
Ukraine_E_Second Edition.indd 32Ukraine_E_Second Edition.indd 32 16.09.13 10:4116.09.13 10:41

Following the transition crisis of the 1990s the labour market situation in Ukraine went through a period of consolidation that lasted until the first half of 2008. In 2009, the onset of the financial and economic crisis jeopardized some of the progress that had been made (see Chapter 1 ‘Eco-nomic and social context for decent work’). Until 2008, employment rates increased moderately for both sexes, albeit remaining low compared to Central and south-eastern Europe, and unemploy-ment declined. However, employment growth was largely dependent on increases in self-employ-ment and informal employment. At the same time, other non-standard forms of employment relating to flexiblization of work remained marginal, such as part-time work or temporary contracts.1
The proportion of self-employed working people more than doubled between 2000 and 2009, rising from 8.3 to 17.1 per cent of total employment. A key cause of this shift was the expansion of sub-sistence farming, due in part to closures of large agricultural farms and a lack of decent jobs in the non-agricultural sector in rural areas. The share of self-employed workers in rural areas rose from 18.2 per cent in 2000 to 40.4 per cent in 2011. Another contributing factor was the growth of self-employment in residential construction, trade, transport and personal services.2 Women are more frequently self-employed than men, which in 2011
1. Article 23(2) of the Labour Code allows the use of fixed-term employment agreements only when labour relations cannot be established for an indefinite term given the nature of the work, its conditions or the worker’s interests, and in other cases provi-ded for by law. According to Article 39(1) of the Labour Code, if labour relations actually continue after expiration of the employ-ment agreement and none of the parties demands their termina-tion, validity of such an agreement is deemed as extended for an indefinite term. Labour agreements that were re-concluded for one or more times, except as provided for by Article 23(2) are deemed as extended for an indefinite term.
2. The European Training Foundation: The Black Sea Labour Market Reports: Ukraine Country Report. January 2009.
accounted for 18.9 per cent of female employment compared to 16.8 per cent for men.
Increasing flexibilization and higher levels of pre-carity in the workplace is further highlighted by the rise of people working in the shadow econ-omy. Over the last decade, informal employment increased significantly, rising from 13.6 per cent in 1999 to 23.1 per cent in 2011 and continues to display strong growth (see Chapter 2 ‘Employ-ment opportunities’). The majority of informal employment (65.4 per cent) is concentrated in agriculture. Other sectors with relatively high shares of informal employment include retail, trade, hotels and restaurants, construction and transport. Non-agricultural informal employment is concentrated mainly in urban areas, where wage employment accounts for 67.1 per cent of total informal employment.
Since the second half of 2008, the labour market situation has deteriorated significantly, with neg-ative effects on the stability and security of work. The global financial and economic crisis aggra-vated the instability of enterprises and led to ris-ing instability for workers, also feeding into an on-going wage arrears problem. Rapid and sig-nificant job losses drove the unemployment rate to 10.3 per cent in the first quarter of 2009. Time-related underemployment also increased signifi-cantly and in 2009, 19.4 per cent of all employees were working reduced hours (some with income subsidies provided by the Government). This sharply reversed an earlier decline in the share of employees working short hours from 17.5 per cent in 1998 to 4.4 per cent in 2007 (see Chapter 4 ‘Decent working time’). A similar reversal is also evident for the share of workers on admin-istrative leave that had fallen from 22.4 per cent in 1998 to 1.1 per cent in 2007 (see Table 7 ‘Sta-
7 Stability and security of work
Ukraine_E_Second Edition.indd 33Ukraine_E_Second Edition.indd 33 16.09.13 10:4116.09.13 10:41

Decent Work Country Profile UKRAINE Second Edition34
bility and security of work). However in 2009, 2.6 per cent of registered working persons were on administrative leave and this increased to 3.4 per cent in 2010, although declined again in 2011 to 1.8 per cent.
In 1999 the ILO measured the strength of employ-ment protection legislation in Ukraine using a methodology developed by the OECD.3 The Employment Protection Legislation Index (EPLI) ranges from zero (fully liberal) to six (fully restrictive EPL). Ukraine’s EPLI was 2.3, indicat-ing a fairly deregulated labour market, which cor-responded to the average figure for the EU can-didate countries (2.4) and the EU Member States (2.5) at the time; although the new EU member states (EU-10) had an even more flexible labour market with an EPLI of 2.1. In the 2000s, the Government and social partners started working to draft a new Labour Code with ILO support. The aim was to adapt labour legislation to the market economy. However, the new Labour Code has not yet been adopted because of differences between
3. See OECD, Employment Outlook 2003, Paris 2003; S. Cazes, and A. Nesporova: Labour markets in transition: Balancing flexibility and security in Central and Eastern Europe. ILO, Geneva, 2003.
trade unions and employers’ organizations on some of its provisions.
The EPLI can be broken down into three compo-nents: indefinite-term employment agreements (contracts), fixed-term employment agreements (contracts), and collective dismissals. The use of the index reveals that the termination of indefi-nite-term employment contracts on the employer’s initiative is more strictly regulated in Ukraine than in the EU-10 (EPLI 3.8 versus 2.6) while regula-tion of fixed-term employment contracts is rather light (EPLI 1.9) but still stricter than in the EU-10 (EPLI 1.2). However, the index reflects no provi-sions at all for collective dismissals in Ukraine, meaning the area is unregulated (EPLI 0 versus 3.4 in EU-10).4 This index demonstrates that there is an inequality with regard to employment security which might create a problem in terms of recruit-ment for regular jobs. In practice, labour legis-lation is often not implemented, which together with the numerous flexible forms of employment points to large pockets of precarity and rather low
4. ILO: Delivering decent work in Europe and Central Asia, Report of the Director-General, 8th European Regional Meeting, Volume I, Part 2, chapter 3.
Table 7. Stability and security of work
1998 1999 2000 2001 2002 2003 2004 2005 2006 2007 2008 2009 2010 2011
Employees on administrative leave during reference period, in % of registered employees1, 2 22.4 22.0 16.1 7.2 5.1 3.2 2.0 1.8 1.2 1.1 1.6 2.6 3.4 1.8
Persons who worked on the basis of civil-law agreement, in % of the total employment3 _ 1.2 1.2 1.6 2.0 1.9 1.8 1.7 1.7 1.6 1.3 1.2 1.2 1.4
Notes:1 Based on enterprise surveys; companies report how many of their registered employees were on administrative leave (in most cases unpaid)
during the reference period. The number of employees on such leave is calculated regardless of the duration and number of distinct periods of administrative leave. For example, if the same employee was on administrative leave twice during the year, it was counted as one incidence.
3 A civil law agreement is a written contract that includes a description of work that the worker has to perform, the deadline for this work, as well as the payment. Unlike a standard employment contract, civil law agreements do not include specific hours of work (as the payment is based on the result and not the process of work), social security benefits, pension contributions, job security or insurance. This indicator is expressed as a percentage of total employment from a sample household survey on population activity.
Source: SSCU, enterprise survey, household survey on population activity in Ukraine.
Ukraine_E_Second Edition.indd 34Ukraine_E_Second Edition.indd 34 16.09.13 10:4116.09.13 10:41

357. Stability and security of work
level of protection of workers against dismissal, with all those working on fixed-term employment agreements (contracts) being first in line.5
Certain additional job security guarantees are provided to workers who are covered by collec-tive agreements. Data for 2011 show the collec-tive agreement coverage of workers in the for-mal sector reached 81.6 per cent (see Chapter 11 ‘Social dialogue, employers’ and workers’ repre-sentation’). However, there is a large difference
5. See J. Rutkowski, S. Scarpetta, and A. Banerji: Enhancing job opportunities: Eastern Europe and the former Soviet Union, World Bank, Washington, DC 2005.
between state enterprises, where well over 80 per cent of workers are covered by collective agree-ments, privatized enterprises where slightly over 60 per cent are covered and private enterprises, where less than ten per cent are covered.6
The flexicurity concept calls for a good balance between labour market flexibility and employment security. Employment security means a shift from security in current jobs to security through higher employability of workers. Higher employability can be promoted through better access to training
6. Ukrainian longitudinal monitoring survey, 2004.
Legal Framework Indicator 11. Termination of employmentLaw, policy or institutions: The Labour Code 1971, as amended, and the Law on the employment of population 1991, as amended regulate termination of employment relations. Specific decrees regulate the termination of employment of temporary and seasonal workers.
Grounds for termination of employment: the Labour Code (sections 40 and 41) lists valid reasons for the employer to terminate employment as: 1) operational necessity (changes in the organization of production and labour: liquidation, reorganization, re-profiling, staff reduction); 2) the worker’s capabilities (unsuitability for the post or work in terms of skills or state of health; temporary incapacity for work lasting more than four months); 3) the worker’s conduct. A worker may be dismissed in cases of consistent failure to fulfil the terms of the employment contract or company regulations, if disciplinary sanctions have been applied previously (for dismissal to take place on these grounds, certain conditions apply: for example, the worker’s actions, or inaction, must be unlawful, the worker must be guilty, or the contraventions must be systematic). A union representative needs to consider the employer’s proposal to dismiss the worker. There are provisions against discrimination on grounds of ‘national origin, social or material status, racial or national affiliation, sex, language, political or religious conviction, occupation, place of residence, or other factors (Labour Code, section 2(1)). There is also special protection for pregnant women or women with children, and trade union members. Workers on probation may be dismissed without the consent of the relevant trade union body if they are not suitable for the work for which they were hired (Labour Code, section 28). Temporary or seasonal contracts may be terminated if a worker fails to come to work because of temporary loss of working capacity for more than two consecutive weeks.
Notice periods: Workers must be personally informed of the termination of their contracts not less than two months before the event when dismissed on grounds of production or substantial labour changes within the organization. A severance allowance of not less than the average monthly remuneration is paid to the worker when laid off. When termi-nations are carried out owing to production or labour changes in an organization, the PES must be informed in writing no less than two months in advance. The information required includes the reasons and timetable for the terminations, and a list of the jobs, specialist posts, qualifications and wages of the persons to be made redundant. Within ten days of the terminations, a list of the actual employees made redundant must be submitted to the Service.
Evidence of implementation effectiveness: No information located by the ILO.
Coverage of the workers in law: The Labour Code 1971 applies to workers in all enterprises regardless of property pattern, the type of activity or the sector of economy. It also applies to persons employed by other persons under an employment agreement.
Coverage of workers in practice: No percentage located by the ILO.
Ratification of ILO Conventions: The Termination of Employment Convention, 1982 (No. 158) was ratified in 1994.
Sources:1. National legislation (see NATLEX database) (http://www.ilo.org/dyn/natlex/natlex_browse.country?p_lang=en&p_country=UKR);2. The Government’s 2006 report on the application of Convention No. 158.
Ukraine_E_Second Edition.indd 35Ukraine_E_Second Edition.indd 35 16.09.13 10:4116.09.13 10:41

Decent Work Country Profile UKRAINE Second Edition36
and skills improvement opportunities, job search assistance, active labour market programmes, income support during job search, and coverage by social insurance and security. However, skills improvement training for staff in Ukraine is con-ducted on average once every 11 years compared to a higher frequency elsewhere in Europe. The efficiency of the PES in placing registered job-seekers in new jobs has improved significantly over the past decade. In 1999, it placed only 18.9 per cent of all registered jobseekers, but that fig-ure rose to 40.3 per cent in 2010 and 41.1 per cent in 2011. However, vacancies reported to the PES by employers are usually of low quality while high quality jobs are often filled through other channels. The registered labour market features a consistently low labour demand. Since the cri-sis outset, the number of actual vacancies in the labour market has dropped from 198,600 in 2008 to 59,300 in early 2012. There are currently eight unemployed job applicants for each vacancy.
At the same time, the duration of unemployment and job searching has declined. The lowest aver-age unemployment duration, six months, was recorded in 2011, for the first time during ten years of observations, whereas the figure in 2000 was 23 months. Similarly, the average period of job search declined from ten months in 2000 to
six months in 2011. An increasing proportion of registered jobseekers take part in active labour market policies. In 2011, 762,700 persons were placed in a job, or 41.1 per cent of those regis-tered with employment services; 9.3 per cent underwent vocational training and 19.6 per cent were engaged in public works. In addition, some 13,000 workers were protected against dismissal through use of FGCSSIU resources to supple-ment wages of employees involuntarily working reduced hours in struggling enterprises. Never-theless, the total expenditure on labour market policies, including operational costs of the PES, remains well below one per cent of GDP and had dropped from 0.72 per cent in 2003 to 0.65 per cent in 2009.
Overall, employment security for Ukrainian work-ers is low, regardless of their status as formal or informal workers, and despite a certain improve-ment in the 2000s. Moreover, gains in employment stability made in recent years were reversed by the economic crisis. Therefore, one can conclude that in Ukraine high labour market flexibility is com-bined with a low level of workers protection exac-erbated by the fact that in practice employers do not regard labour legislation as a significant factor in the hiring and firing of workers as enforcement of labour standards is week.
Ukraine_E_Second Edition.indd 36Ukraine_E_Second Edition.indd 36 16.09.13 10:4116.09.13 10:41

Ukraine has achieved some progress in the legal context with regard to the promotion of gender equality. At the international level, two of the rel-evant fundamental conventions had already been ratified at the time of Ukraine’s independence, namely the Equal Remuneration Convention, 1951 (No. 100) and the Discrimination (Employment and Occupation) Convention, 1958 (No. 111). Ukraine ratified the Workers with Family Respon-sibilities Convention, 1981 (No. 156) in 2000 (see also Legal Framework Indicator 12 ‘Equal oppor-tunity and treatment’ and Legal Framework Indi-cator 13 ‘Equal remuneration of men and women for work of equal value’). Ukraine also ratified the Convention on the Elimination of All Forms of Discrimination against Women (CEDAW) in 1981 and its Optional Protocol in 2003.
At the national level, Ukraine has established the core elements of a legal and institutional frame-work that promotes gender equality and addresses discrimination. In addition to a commitment to equality enshrined in the 1996 Constitution, the Law on ensuring equal rights and opportuni-ties of women and men was adopted in 2005 (in force since 2006), and three State programmes on ensuring gender equality in Ukrainian society were implemented between 2010 and 2012. Addi-tionally, relevant regional programmes have been developed and are being implemented.
In 2009, the CEACR made reference to the Law on ensuring equal rights and opportunities of women and men and urged the Government to take the necessary steps to amend it to give full expression to the principle of equal remuneration for men and women for work of equal value. In the current legislation on labour and labour remuneration, the right to equal remuneration of men and women is linked to skills and working conditions.
While significant legal progress has been made, the implementation of laws and the develop-ment of supporting, appropriate policies are less dynamic. As gender stereotypes persist,1 men and women lack equal opportunities in public and private life and women are more vulnerable to multiple forms of discrimination, both direct and indirect, in the world of work. At the same time, a growing number of women workers take maternity and parental leave, partly due to gener-ous provisions concerning leaves and state social benefits, and potentially compounding existing labour market disparities (see Chapter 5 ‘Combin-ing work, family and personal life’).2
Occupational segregation has stagnated between 1999 and 2011. Using the Index of Dissimilar-ity, which measures occupational segregation on a scale of zero (no segregation) to one (complete segregation). The index value in Ukraine remained stable between 1999 and 2011 at between 0.37 and 0.33 between 1999 and 2011. Although com-parability between countries is limited due to dif-ferences in occupational classifications, this value is relatively low as the index for non-agricultural occupations in European transition countries was 0.59 in 2001 and 0.51 in industrialized countries in 2001.3
In 2011 the employment rate among 15 to 70 year olds was significantly lower for women (54.5 per cent) than for men (64.4 per cent). In comparison, the unemployment rate for women (6.8 per cent)
1. Human Rights Watch: Women’s Work. Discrimination against Women in the Ukrainian Labor Force (New York, 2003).
2. G. Standing and L. Zsoldos: Worker Insecurities in Ukrainian Industry. The 2000 ULFS. (Geneva, ILO, 2001).
3. R. Anker, H. Melkas, A. Korten: Gender Based Occupational Segregation in the 1990s. Declaration WP 16. ILO, Geneva, 2003 p.10. Based on figures from Austria, the Czech Republic, France, Poland, Spain, and the USA.
8 Equal opportunity and treatment in employment
Ukraine_E_Second Edition.indd 37Ukraine_E_Second Edition.indd 37 16.09.13 10:4116.09.13 10:41

Decent Work Country Profile UKRAINE Second Edition38
was lower than that of men (8.8 per cent). In 2011, 50.5 per cent of people taking vocational train-ing to increase their labour market competitive-ness were women and 53.1 per cent of participants in public works programmes were women. More than half of the people (51.2 per cent) registered with the PES in 2011 were women; 37.2 per cent of them were placed in a job with the PES assist-ance, and 14.5 per cent underwent vocational training (up from 7.3 per cent in 2009).
The female share of employment amongst leg-islators, senior officials and managers also stag-nated at around 40 per cent between 1999 and 2011. The female share of employment in these occupations is higher in Ukraine than in other European countries (32.6 per cent for transi-tion countries and 27.6 per cent in industrial-ized European countries in 2000).4 However, the
4. Ibid, p.13. Own calculations. The figures are based on the fol-lowing industrialized countries: Australia, Austria, Canada, Cyp-rus, Denmark, Finland, Germany, Greece, Iceland, Ireland, Italy, Netherlands, New Zealand, Norway, Portugal, Spain, Sweden, Switzerland, United Kingdom. The figures for transition countries are based on the following countries: Czech Republic, Estonia, Hungary, Latvia, Lithuania, Moldova, Poland, Romania, Slovakia, Slovenia and the Russian Federation.
share of workers attributed to these high-status occupations in Ukraine (7.9 per cent in 2009) is unusually large.
The gender pay gap, calculated on the basis of the difference in monthly wages of female and male workers, decreased from 25.8 per cent in 1998 to 22.2 per cent in 2010, although it rose again to 25.1 per cent in 2011. The gender pay gap is much higher in Ukraine than in the EU, where it aver-aged 17.5 per cent in 2007.5 However, the com-parability between the Ukrainian data (that are based on monthly earnings) and those from other countries is limited, since the latter are based on average hourly earnings. The gender gap persists despite the fact that women attain a higher level of education than men: 37 per cent of women hold a degree in higher education compared to 29.2 per cent of men. Further, looking at the presence of women in the most highly paid jobs and the gender wage gap shows there is no clear tendency towards reducing gender income inequalities. More men
5. Eurostat, Gender pay gap in unadjusted form, http://epp.eurostat.ec.europa.eu/portal/page/portal/structural_indicators/indicators/employment.
Legal Framework Indicator 12. Equal opportunity and treatmentLaw, policy or institutions: The Constitution provides for non-discrimination on the grounds of race, colour of skin, politi-cal, religious and other beliefs, sex, ethnic and social origin, property status, place of residence, linguistic and other characteristics (article 24). The Labour Code 1971, as amended, in article 2(1), guarantees equal employment rights for all citizens irrespective of their origin, social or material circumstance, race, nationality, sex, language, political and religious convictions, occupation, place of domicile or any other circumstance. The Law on ensuring equal rights and equal opportunities of women and men came into force in 2006.
Evidence of implementation effectiveness: In its 2008 observation, the CEACR noted comments of the Confederation of Free Trade Unions of Ukraine (CFTUU) alleging widespread discrimination against women, and asked for the Govern-ment’s comments. On a number of occasions the CEACR has sought information from the Government concerning the measures taken or envisaged to ensure and promote equality of opportunity and treatment in employment and occupa-tion on the grounds of race, colour and national extraction, particularly the measures taken in respect of the Crimean Tatars and the Roma. The CEACR noted, in particular, the concluding observations of 17 August 2006 of the United Nations Committee on the Elimination of Racial Discrimination (CERD) in this regard (CERD/C/UKR/CO/18, paragraphs 11, 14 and 15) and the fact that similar issues were raised by the European Commission against Racism and Intoler-ance in its third report on Ukraine (CRI (2008) 4, of 12 February 2008).
Coverage of workers in law: No exclusions noted in the legislation.
Ratification of ILO Conventions: the Equal Remuneration Convention, 1951 (No. 100), was ratified in 1956; the Discrimi-nation (Employment and Occupation) Convention, 1958 (No. 111) was ratified in 1961.
Sources:1. The Government’s report to the Committee of Experts and the Committee’s comments on the Conventions No. 100 and No. 111.2. CEACR observations and direct requests on Conventions No. 100 and No. 111.
Ukraine_E_Second Edition.indd 38Ukraine_E_Second Edition.indd 38 16.09.13 10:4116.09.13 10:41

398. Equal opportunity and treatment in employment
Legal Framework Indicator 13. Equal remuneration of men and women for work of equal valueLaw, policy or institutions: The Constitution of Ukraine, the Labour Code 1971, as amended, the Law on labour remu-neration, and the Law on ensuring equal rights and equal opportunities of women and men 2006 regulate equal remuneration. National action plans are adopted regularly in order to improve the situation of women. Section 17 of the 2006 law requires the employer to ensure equal pay for men and women for work involving equal skills and working conditions. Article 18 provides that collective agreements at the different levels should include provisions which ensure equal rights and opportunities for women and men, and that agreements should envisage the elimination of inequality in the labour remuneration of men and women wherever it exists.
Evidence of implementation effectiveness: the CEACR noted in its 2008 observation that, according to data provided in the Government’s report, women earned around 27 per cent less than men in 2006 and 2007. While noting a reduction of the wage gap in its 2010 observation, the CEACR noted that it was still very high. The CEACR noted in 2010 that the manner in which wages are set is unclear and it asked the Government to take specific measures to promote the use of objective job evaluation methods free from gender bias with a view to promoting and ensuring the establishment of wages and salary scales in accordance with the principle of equal remuneration for men and women for work of equal value. The CEACR also asked the Government in its observation in 2008 to amend the legislation further to give full legislative expression to the principle of equal pay for work of equal value, which is a broader concept than provided for in the current legislation.
Coverage of workers in law: No exclusions noted.
Ratification of ILO Conventions: the Equal Remuneration Convention, 1951 (No. 100) was ratified in 1956; the Discrimi-nation (Employment and Occupation) Convention, 1958 (No. 111) was ratified in 1961.
Sources:1. The Government’s report to the Committee of Experts and the Committee’s comments on the Conventions No. 100 and No. 111.2. CEACR observations and direct requests on Conventions No. 100 and No. 111.
Table 8. Equal opportunity and treatment in employment
1998 1999 2000 2001 2002 2003 2004 2005 2006 2007 2008 2009 2010 2011
Occupational segregation by sex (Index of Dissimilarity)1, 2 – 0.37 0.38 0.37 0.36 0.36 0. 21 0.33* 0.33 0.34 0.35 0.35 0.33 0.33
Female share of employment in ISCO-88 major group 1 (legislators, senior officials and managers)1,3 – 38.6 36.7 37.4 38.5 39.6 43.1 38.2* 38.3 39.4 38.6 41.1 41.2 40.1
Gender wage gap (unweighted), in %4 25.57 27.67 29.00 30.25 30.65 31.34 31.40 29.17 27.22 27.12 24.76 22.83 22.22 25.14
Notes:1 D ata for the years 1999-2003 were revised according to the demographic structure of the population as obtained from the All-Ukrainian Census
of 2001.2 The Index of Dissimilarity is calculated as ID = ½ _|Wi/W – Mi/M|, where Wi stands for female employment in occupation i, W for total female
employment, Mi for male employment in occupation i, and M for total male employment. Based on ISCO-88 sub-major groups (i.e. 2 digit-level). The index ranges from 0 to 1, with 0 meaning no segregation or spatial disparity, and 1 being complete segregation between the two groups.
3 An unusually large share of total employment (ca. 10 per cent) is concentrated in ISCO-88 sub-major group 12 (corporate managers).4 Based on average monthly wages of employees in current UAH from enterprise surveys. The gender wage gap is a measure for the difference
between the wages of female and male workers, expressed in per cent of men’s wages. Positive values mean that women’s wages are lower than those of men.
* Sample surveys on population activity in Ukraine were held on a quarterly basis between 1999 and 2003 and on a monthly basis since 2004.Source: SSCU, enterprise survey, household survey on population activity in Ukraine.
Ukraine_E_Second Edition.indd 39Ukraine_E_Second Edition.indd 39 16.09.13 10:4116.09.13 10:41

Decent Work Country Profile UKRAINE Second Edition40
than women are employed in highly paid jobs, whereas women are more often employed in jobs at the low end of the pay scale, in both public and private sectors.6
6. UNDP: Human Development Report, United Nations: New York and Geneva, 2007.
Overall, Ukraine has made some progress regard-ing laws on equal opportunity and treatment in employment, but the effective implementation of such measures remains a challenge.
Ukraine_E_Second Edition.indd 40Ukraine_E_Second Edition.indd 40 16.09.13 10:4116.09.13 10:41

Occupational accident and disease statistics, as a reflection of occupational safety and health conditions, are important indicators to measure progress towards decent work. They reflect a fun-damental aspect of decent work, namely that work should not be to the detriment of a worker’s health and that his or her life is protected while at work. Data on occupational injuries are essential as they can play a role in planning preventive measures, developing regulations, procedures and safety campaigns, as well as in the safe conduct of work, and prevention of occupational injuries. When measured over a period of time the data can reveal progress or deterioration in occupational safety and health, and thus the effectiveness of preven-tion measures.
Non-fatal injury rates have been decreasing over the past thirteen years in Ukraine, while only gradual progress has been made on fatal occu-pational injuries. The occupational fatality rate started from a very high base (10.2 deaths per 100,000 workers in 1998) and, while decreasing moderately, has shown fluctuations from year to year rather than a consistent improvement (see Table 9 ‘Safe work environment’).1 Problems related to organization of the workplace cause 72.7 per cent of accidents, a further 12.1 per cent of accidents are caused by technical failings and three per cent by psycho-physiological problems. At the same time, the incidence of occupational disease has grown from 1.85 per 10,000 workers in 1998 to 4.8 in 2009.
1. The equivalent figure for a group of Northern European countries is 1.7 per 100,000 workers (2005) and 3.9 per 100,000 workers in a group of central European countries. See ILO, Delivering decent work in Europe and Central Asia, Report of the Director-General, Volume 1, Part 2, 8th European Regional Meeting. Geneva: ILO, 2009, p. 82. E. Libanova, Decent Work Country Report – Ukra-ine, background report for the 8th European Regional Meeting. Geneva, ILO, 2008, p. 37.
According to the SSCU, the proportion of workers functioning in conditions that fail to meet sanitary and hygienic standards has increased over the last decade, from 25.5 per cent in 2002, to 28.9 per cent at present. Every third person works in condi-tions where they are exposed to harmful products in excess of the maximum permitted by law and almost one fifth of working women are employed in harmful and hazardous working conditions.
Workers can be exposed to a combination of several harmful factors, including chemical and physical risks, the impact of which is reinforced by stress and the conduct of physically strenuous work. A national workplace assessment on work-ing conditions is conducted every five years, but the quality and coverage of assessment have been criticized. According to the State Expert Examina-tion of Working Conditions, 23 per cent of indus-trial enterprises were not assessed at all; where assessment did take place, the quality of assess-ment was deemed unsatisfactory in every 18th case. For example the assessment has yet to draw attention to the high exposure of some workers to dangerous substances. Resistance to improve-ments in safety and health conditions on the part of employers has played into the weakness of the national assessment.
Data collection on occupational safety and health issues, particularly on the incidence of fatal acci-dents, has improved since 2000, and a new law has been adopted to provide compensation for occupational accidents and diseases (the Law on general compulsory state social insurance against an occupational accident and disease that caused loss of working capacity). Comparing occupa-tional morbidity found in Ukraine with corre-sponding data from the EU countries shows that these figures are much lower in Ukraine although
9 Safe work environment
Ukraine_E_Second Edition.indd 41Ukraine_E_Second Edition.indd 41 16.09.13 10:4116.09.13 10:41
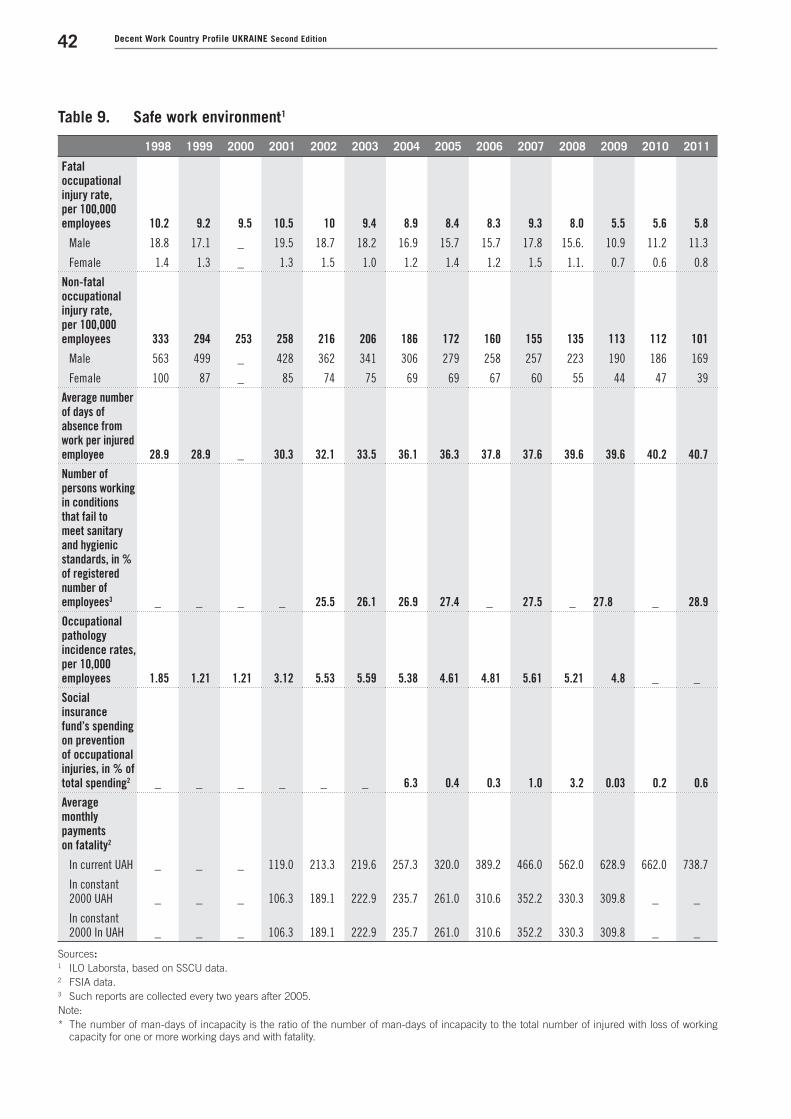
Decent Work Country Profile UKRAINE Second Edition42
Table 9. Safe work environment1
1998 1999 2000 2001 2002 2003 2004 2005 2006 2007 2008 2009 2010 2011
Fatal occupational injury rate, per 100,000 employees 10.2 9.2 9.5 10.5 10 9.4 8.9 8.4 8.3 9.3 8.0 5.5 5.6 5.8
Male 18.8 17.1 _ 19.5 18.7 18.2 16.9 15.7 15.7 17.8 15.6. 10.9 11.2 11.3
Female 1.4 1.3 _ 1.3 1.5 1.0 1.2 1.4 1.2 1.5 1.1. 0.7 0.6 0.8
Non-fatal occupational injury rate, per 100,000 employees 333 294 253 258 216 206 186 172 160 155 135 113 112 101
Male 563 499 _ 428 362 341 306 279 258 257 223 190 186 169
Female 100 87 _ 85 74 75 69 69 67 60 55 44 47 39
Average number of days of absence from work per injured employee 28.9 28.9 _ 30.3 32.1 33.5 36.1 36.3 37.8 37.6 39.6 39.6 40.2 40.7
Number of persons working in conditions that fail to meet sanitary and hygienic standards, in % of registered number of employees3 _ _ _ _ 25.5 26.1 26.9 27.4 _ 27.5 _ 27.8 _ 28.9
Occupational pathology incidence rates, per 10,000 employees 1.85 1.21 1.21 3.12 5.53 5.59 5.38 4.61 4.81 5.61 5.21 4.8 _ _
Social insurance fund’s spending on prevention of occupational injuries, in % of total spending2 _ _ _ _ _ _ 6.3 0.4 0.3 1.0 3.2 0.03 0.2 0.6
Average monthly payments on fatality2
In current UAH _ _ _ 119.0 213.3 219.6 257.3 320.0 389.2 466.0 562.0 628.9 662.0 738.7
In constant 2000 UAH _ _ _ 106.3 189.1 222.9 235.7 261.0 310.6 352.2 330.3 309.8 _ _
In constant 2000 In UAH _ _ _ 106.3 189.1 222.9 235.7 261.0 310.6 352.2 330.3 309.8 _ _
Sources:1 ILO Laborsta, based on SSCU data.2 FSIA data.3 Such reports are collected every two years after 2005.Note:* The number of man-days of incapacity is the ratio of the number of man-days of incapacity to the total number of injured with loss of working
capacity for one or more working days and with fatality.
Ukraine_E_Second Edition.indd 42Ukraine_E_Second Edition.indd 42 16.09.13 10:4116.09.13 10:41

439. Safe work environment
working conditions are considerably worse.2 Offi-cial statistics however, reveal only the tip of the iceberg; many occupational accidents, injuries and diseases go unreported. Long-term observa-tions demonstrate that occupational disease in Ukraine is shaped by the impact of more than 100 harmful products used in manufacturing and industry and is diagnosed in workers in more than 200 occupations.3
An analysis of occupational morbidity by indus-try branch shows different patterns. In agriculture occupational morbidity has declined more than nine-fold since 1991, although declining access to medical services in this sector may mean that less cases are registered. In coal mining, metallurgy and machine-building occupational morbidity has increased. Coal mining, one of the most danger-ous in terms of working conditions, is responsible for 70 to 80 per cent of all occupational morbidity cases in Ukraine. About 2,000 new pneumoconio-sis cases are diagnosed every year, thereby greatly increasing the rate of mortality caused by bronco pulmonary diseases. Moreover, a higher preva-lence of lung cancer and tuberculosis has been found among miners of underground coal mines who suffer from pneumoconiosis.
The number of new malignant neoplasm cases is growing in Ukraine every year. The World Health Organization’s (WHO) International Agency for Research on Cancer emphasizes that environmen-tal factors, everyday life and production cause the development of almost 80 per cent of all malig-nant neoplasms, up to 70 per cent being caused by chemical exposure. According to the WHO find-ings, up to 33 per cent of all potential cancer cases can be prevented by correct and targeted prophy-lactic measures. However, some 875,000 persons (about 15 per cent of the working population) are exposed to chemical substances in Ukraine every year, mostly in the extractive industry (53.3 per cent) and manufacturing industry (15.2 per cent). The main reasons for this situation include large-
2. Стародубов В.І Збереження здоров’я працюючого насе-ления – одне з найважливіших завдань охорони здоров’я // Медицина праці та промисловості. Екологія.-2005.- № 1. – С. 1-18.
3. The Occupational Medicine Institute: Information and analytical materials for the parliamentary hear-ing on industrial safety and labour protection, 2010.
scale violations of occupational safety and health regulations and bad working conditions (53.7 per cent); imperfect production technologies and industrial accidents (32.7 per cent); and missing or defective sanitary equipment (13.6 per cent). There are substantial problems in securing sani-tary supervision for cancer-hazardous work proc-esses and in organizing lifelong medical services for workers employed in such processes. Workers exposed to carcinogenic hazard in production are not registered on the national level, and capabili-ties for the identification of carcinogenic agents are limited.
A major cause of insufficient identification of occupational diseases is a low quality of preven-tive medical examinations, an extremely impor-tant component of preliminary health supervision. Since 1991, the provision of medical services for workers has been decentralized to the territorial level. This means medical services are provided through commissions using district polyclincs. The reforms have led to a reduction in the number of factory health posts from 3,398 in 1991 to just 201 in 2009. At the same time, studies on occu-pational health and pathology have been weak-ened as territorial commissions engage very few skilled occupational pathologists and members often have no professional knowledge of occu-pational health and pathology. Only 30 to 40 per cent of laboratory and clinical diagnostic studies needed are conducted. As a result, occupational diseases often remain undiagnosed until the late phases when a health disorder is irreversible and occupational rehabilitation has become impos-sible. Almost half of occupational diseases are now discovered when a sick person actively seeks medical aid rather than during preventive medical examinations.4
The overall reduction in the rates of occupational injuries and fatalities partly reflects a shift in the employment structure of Ukraine, from employ-ment in high-risk sec tors to employment in serv-ices (see Chapter 1 ‘Economic and social context for decent work’). A large number of coalmines, for example, have been closed down, and the
4. The Occupational Medicine Institute: Information and analytical materials for the parliamentary hearing on industrial safety and labour protection, 2010.
Ukraine_E_Second Edition.indd 43Ukraine_E_Second Edition.indd 43 16.09.13 10:4116.09.13 10:41

Decent Work Country Profile UKRAINE Second Edition44
Legal Framework Indicator 14. Employment injury benefitsLaw, policy or institutions: Ukraine’s social insurance system is governed by: the Law on general compulsory State social insurance against an occupational accident and disease that caused loss of working capacity No. 1105-XIV, 1999, as amended; the Law on the collection and accounting of single social payment of compulsory social insur-ance No. 2464 – VI, 2010; and the Cabinet of Ministers Resolution on the approval of the class definition of profes-sional risk by type of activity No. 237, 2012. The Fundamentals of Legislation of Ukraine on general compulsory state social insurance 1998 provide that a separate law may introduce general compulsory medical insurance but no such law has been passed so far.
Qualifying conditions: There is no minimum qualifying period to become entitled to benefits in case of occupational accident or disease.
Benefits (level and duration):
If an insured event occurs, the FSIA indemnifies the worker against the damage caused, or in the case of death, indem-nifies the persons who were maintained by the worker:
a) Temporary injury benefit: The benefit is equal to 100 per cent of the insured’s earnings and is paid from the first day of incapacity until recovery or until an award for a permanent disability pension is made. Benefits for the first five days of temporary incapacity are paid for by the employer.
b) Lump-sum benefit in case of steady loss of occupational capacity or in case of the victim’s death. In case of a steady loss of occupational capacity as ascertained by the Medical and Social Expert Commission, the Fund makes a lump-sum payment to the victim. The amount is determined on the basis of the victim’s average monthly earnings, for every percent of the victim’s loss of occupational capacity, but cannot be greater than four times the wage (income) on which contributions to the Fund are charged. If the commission investigating the accident ascertains that health detriment had occurred not only through the employer’s fault but also through violation by the victim of regulations on occupational safety, the rate of the lump-sum benefit is reduced pursuant to the commission’s opinion but by no more than 50 per cent. In the event of the death of the victim of an occupational accident or disease, the rate of the lump-sum benefit for their family must be not lower than the victim’s wage for five years and not lower than the victim’s one-year earnings per every dependent as well as per the victim’s child born within ten months after the victim’s death;
c) Monthly cash benefit in case of partial or full loss of working capacity that compensates a relevant part of the victim’s lost earnings (depending on the degree of the victim’s loss of occupational capacity): The amount of the monthly benefit must not be higher than the victim’s average monthly earnings prior to the accident. If, with the monthly insurance benefit, the victim receives a disability pension for the same accident, the sum must not be higher than the victim’s average monthly earnings prior to the health damage.
d) Disability pension due to an occupational accident or occupational disease (assigned by the Pension Fund);
e) Survivor’s pension in connection with the survivor’s death from an occupational accident or occupational disease (assigned by the Pension Fund);
f) Child benefit in case of damage to the foetus due to the woman’s occupational injury or occupational disease during her pregnancy, because of which the child was born with disabilities: Such a child is considered to be insured, according to a medical opinion, and receives an FSIA benefit until 18 years of age or until completion of study but not past the age of 23 years.
The FSIA also organizes burial of the deceased and reimburses the cost of related ceremonial services according to local conditions.
The FSIA is promoting the creation of conditions for the timely provision of skilled first emergency aid to the victim in case of an occupational accident, provision of ambulance care in case the victim needs hospital admission, and the early diagnostics of occupational diseases. It organizes purposeful and efficient treatment of the victim on a contractual basis at health care facilities in order to ensure recovery as soon as possible, and secures a full scope of medical aid as prescribed by the doctor, together with relevant health care services.
Financing: Insurance contributions for social insurance against occupational accidents and diseases are paid by the employer. The contribution rate varies between 0.56 per cent (at enterprises belonging to the first class of occupational risk) and 13.5 per cent (at enterprises belonging to the 67th class of occupational risk).
Ukraine_E_Second Edition.indd 44Ukraine_E_Second Edition.indd 44 16.09.13 10:4116.09.13 10:41

459. Safe work environment
number coal miners fell from 332,200 in 1999 to 221,400 in 2009.5 Nonetheless, fatal injuries per-sist in traditionally high-risk sectors, evidenced by a series of particularly deadly explosions in the coal mining sector in 2000, 2001 and 2007.
Trends in occupational fatality rates suffered by women have shown a similar pattern to those of men, although they are much lower, reflecting the highly segregated labour market and con-centration of women in sectors such as services, agriculture and light industry. Despite the lower fatality rate, occupational safety and health still needs to be improved in female dominated sec-tors. However, efforts to protect women work-ers from occupational safety and health risks focus more on excluding women from danger-ous work,6 side-stepping the issue of making the workplace safe for all workers. It is important that a gender perspective is used when setting priorities and standards, conducting research on occupational safety and health, and in recogni-tion and compensation of occupational accidents and diseases. This would enable policy makers to avoid the trap of focusing almost exclusively on traditionally hazardous sectors where highly visible accidents take place suffered mainly by men.
5. See Ella Libanova, op. cit., p. 37.6. See the List of heavy-duty works and works with harmful and dan-
gerous working conditions where the use of women’s labour is prohibited, approved by the Ministry of Health, Order No. 256 of 1993. See also ILO: National Profile on Occupational Safety and Health in Ukraine, Budapest: ILO, 2010.
Over the last decade, the severity of occupational injuries has significantly increased. This is evi-denced by the average number of days of absence from work per injured worker, which rose from 28.9 days in 1998 to 40.7 days in 2011. The severity of occupational injuries in a country can also be determined by the number of fatal inju-ries. On average, over the last thirteen years one worker has died out of every 21 injured, a ratio that has steadily worsened since 1998, when one worker died for every 33 injuries. In more recent years, fatal injuries peaked at one death in every 17 injuries (2007, 2008 and 2011).7 Again, the high average fatality rate as well as the even higher spikes may due to the importance of coal mining in Ukraine and the particularly danger-ous working conditions of this industry.8 It could also mean that less serious injuries are not being reported, in spite of well-developed mechanisms for reporting and notification of occupational accidents and diseases. The possibility of under-reporting has cast doubt on progress regarding to non-fatal injuries, a point national trade unions have underlined.
7, Calculations based on data reported in Table 9 ‘Safe work envi-ronment’.
8. The majority of occupational accidents take place in the mining sector (13.5 injuries per 1,000 employed), particularly in coal mining (19.5 per 1,000 employed) compared with a rate of 2.9 per 1,000 employed in the processing industries, 5.9 per 1,000 in the tobacco industry and 4.7 per 1,000 in the textile sector, and 2.1 per 1,000 in the agricultural sector. The fatality rates from occupati-onal injuries are 33 per 100,000 workers in the mining sector, 30 per 100,000 in construction and 12 per 100,000 in agriculture. See Ella Libanova, op. cit.
Evi dence of implementation effectiveness: No information located by the ILO.
Coverage of workers in law: The legislation applies to all employees working under employment agreements, except military personnel and militia. Self-employed persons can be covered by voluntary insurance against accidents.
Coverage of workers in practice: No percentage located by the ILO.
Ratification of ILO Conventions: The Social Security (Minimum Standards) Convention, 1952 (No. 102); and the Employ-ment Injury Benefits Convention, 1964 (No. 121) have not been ratified.
Sources:1. ILO: General Survey concerning the Occupational Safety and Health Convention, 1981 (No. 155), the Occupational Safety and Health
Recommendation, 1981 (No. 164), and the Protocol of 2002 to the Occupational Safety and Health Convention, 1981. Report III (IB), International Labour Conference, the 98th session, Geneva, 2009 (http://www.ilo.org/wcmsp5/groups/public/---ed_norm/---relconf/documents/meetingdocument/wcms_103485.pdf).
2. ISSA data base, supplemented by Social Security Throughout the World, (Social Security Administration of the United States, September 2008) (http://www.issa.int/aiss/Observatory/Country-Profiles/Regions/Europe/Ukraine).
3. Information provided by V.V. Ivankevych, Director-General, Institute for Development of Social Insurance and Lending.
Ukraine_E_Second Edition.indd 45Ukraine_E_Second Edition.indd 45 16.09.13 10:4116.09.13 10:41

Decent Work Country Profile UKRAINE Second Edition46
Ukraine has an extensive legislative and regula-tory base governing safety and health at work.9 The main responsibility for inspecting occupa-tional safety and health conditions rests with the State Committee for Industrial Safety, Labour Protection and Mining Supervision. At the same time, FSIA, introduced in 2001, is responsible for promoting safety at work. A large number of other agencies also issue regulations and conduct inspections to enforce them,10 preclud-
9. A full report on the legislation concerning occupational safety and health can be found in the Report of the Government of Ukraine, in accordance with the provisions of Article 19 of the ILO Cons-titution, on non-ratified Conventions and Recommendations, con-cerning the Convention on Occupational Safety and Health and the Working Environment, 1981 (No. 155), submitted in 2008.
10. Other agencies include the Work Safety Inspection Commission (subordinated to the Ministry of Emergencies), the State Sanitary and Epidemiological Inspectorate (Ministry of Health), the State Fire Inspection, and the Work Safety Office of the Trade Unions.
ing any coherence in State activities towards improving occupational safety and health in practice. This is the case in spite of national policy on occupational safety and requirements for coordination of activities and cooperation in the field of occupational safety and health.11 Of particular concern is excessive focus of regu-lations on technical details, rather than broad measures to reduce and prevent occupational injuries and morbidity. For example, Ukraine still relies on a classification of occupations to determine harmful conditions and attestation of
11. Coordination and cooperation is effected through the National Council for People’s Life Safety established pursuant to the Law on Labour Protection and is headed by the Vice Prime Minister of Ukraine. See the “National Profile on Occupational Safety and Health in Ukraine”, ILO, 2010.
Legal Framework Indicator 15. Labour inspectionLaw, policy or institutions. Legislative authority: Decree of the Cabinet of Ministers on the approval of the regulations on the State Department for the supervision over labour legislation observance No. 1771, 2000. The Committee of Experts noted in 2007 (from the Government’s first report on Convention No. 81) that there are three independent labour inspection systems, operating under the control of three different authorities, each responsible for different legislative fields: (i) the Derzhnahliadpratsi, under the authority of the MLSP, which through its territorial bodies supervises the application by enterprises of labour legislation and compulsory social insurance; (ii) the State Department for Industrial Safety, the Protection of Workers and the Supervision of Mines, under the Ministry for Emergency Situations and the Protection of the Population against the Consequences of the Chernobyl Disaster, which through its territorial bodies supervises the application of the legislative provisions relating to the protection of workers; and (iii) the State Depart-ment for Sanitation and Epidemiological Surveillance, under the authority of the Ministry of Health, which is responsible through its territorial bodies for labour inspection in connection with occupational health and safety. The CEACR noted the Government’s intention to create an integrated inspection system which would be responsible for ensuring the appli-cation of the legal provisions relating both to general conditions of work and occupational health and safety.
Evidence of implementation effectiveness: The CEACR noted that an annual inspection report containing the information required on all the issues covered in Convention No. 81, based on cooperation between the various existing inspec-tion systems, should be published and a copy provided to the ILO. The CEACR expressed concern over the lack of training provided to labour inspectors, although it noted that training workshops for inspectors had been held. It noted with concern the information provided the Government that labour inspectors lack transport facilities and equipment to perform their duties. Moreover, only five per cent of the workplaces subject to inspection were inspected in 2008. There is a need for greater resources. Trade unions at enterprises play a leading role in guaranteeing the compliance with occupational safety conditions and the cooperation with the employer.
Coverage of workers in law: the Law on labour protection applies to legal and natural persons who, according to legisla-tion in force, use hired labour as well as to all working persons, except military personnel and militia.
Coverage of workers in practice: No information located by the ILO.
Ratification of ILO Conventions: Labour Inspection Convention, 1947 (No. 81), ratified in 2004, but not its protocol. Labour Inspection (Agriculture) Convention, 1969 (No. 129) ratified in 2004.
Sources:1. Government reports and CEACR comments in 2007 and 2010 on Convention No. 81.2. National legislation listed in NATLEX
http://www.ilo.org/dyn/natlex/natlex_browse.details?p_lang=en&p_country=BRA&p_classification=07.01&p_origin=SUBJECT)
Ukraine_E_Second Edition.indd 46Ukraine_E_Second Edition.indd 46 16.09.13 10:4116.09.13 10:41

479. Safe work environment
workplaces,12 rather than promoting risk assess-ment in all workplaces to determine preventive measures to eliminate harmful and hazardous factors in all workplaces.
The lack of a preventive approach is also reflected in the allocation of expenditures by the FSIA: in 2008, just 0.6 per cent of the Fund’s budget was spent on preventive measures. The resources devoted to pre-vention do not allow the Fund to effectively pursue its preventive tasks, even though these are acknowl-edged as a priority by law. In 2009 and 2010, the Fund’s spending on prevention activities was frozen due to a deficit in receipts from coal mining enter-prises of some UAH 700 million. In effect, the Fund serves mainly as a payment processing institution for the payment of compensation and benefits to the victims of occupational accidents and diseases according to the degree of lost working capacity, as well as to families of persons who died as a result of an occupational accident or disease.13
In summary, reported occupational injury rates in Ukraine have halved since 1998. However, this may be due more to closures of hazardous workplaces, especially of coal mines, than to any significant improvement occupational safety and health measures. The occupational fatality rate, on the other hand, has maintained its high level, and even increased in 2007, for both men and women. The severity of occupational injuries, already extremely high in relation to other countries, has also increased substantially, as indicated by the average number of days of absence from work per injured worker and the number of deaths in rela-tion to occupational injuries. Ukraine has thus not made substantial progress towards safe work over the past thirteen years.
To achieve greater progress in ensuring safe work-ing conditions and minimizing occupational injury and morbidity rates, measures should be taken to
12. Ministry of Health Order on the hygienic classification of work types based on harmful and hazardous occupational factors and work stress No. 528, 2001.
13. L. Handrich and O. Betliy: Reforming the work accident insurance in Ukraine: Introducing economic incentives and private sector competition, Institute for Economic Research and Policy Consul-ting in Ukraine, German Advisory Group on Economic Reform, http://pdc.ceu.hu/archive/00003438/01/v20_en.pdf (accessed 11 Nov 2012).
prepare a special governmental programme for a medium-term period of four to five years that would provide for:
● creating conditions for the coordination of actions and appropriate financial resources of all state structures, trade unions and employers’ organizations in this field;
● developing an occupational safety culture, first of all concerning assurances for each worker of his or her own safety at the work-place;
● placing a legal limit on the length of time workers can be employed in unsafe and harmful working conditions in line with sci-entific evidence on health risks (in order to prevent occupational diseases);
● demonstrating the economic benefits to employers of ensuring safety and health at the workplace, conducting timely workplace assessment and periodic medical examina-tions of workers;
● reforming the legislation on labour protec-tion and on social insurance against occupa-tional accidents and diseases in order to con-centrate the expenditure on labour protection and insurance against occupational accidents and diseases, and on preventive measures of safe work, social security and protection of people’s life and health in the course of their work activities;
● drafting a new wording of the Law on gen-eral compulsory State social insurance against an occupational accident and disease that caused loss of working capacity;
● shifting the FSIA’s functions of financial pro-vision and assignment of disability pensions and survivor’s pensions in connection with the survivor’s death from an occupational accident or disease to the Pension Fund according to uniform rules of general com-pulsory state pension insurance.
Ukraine_E_Second Edition.indd 47Ukraine_E_Second Edition.indd 47 16.09.13 10:4116.09.13 10:41

Ukraine_E_Second Edition.indd 48Ukraine_E_Second Edition.indd 48 16.09.13 10:4116.09.13 10:41

Ukraine’s social security system covers the nine main branches of social security listed in the Social Security (Minimum Standards) Conven-tion, 1952 (No. 102), though the country has not ratified the convention.1 The nine branches are medical care, benefits for temporary incapacity for work, unemployment benefits, old-age ben-efits, occupational accident or disease benefits, family and maternity benefits, disability ben-efits and survivors’ benefits. Special provisions exist for victims of the Chernobyl nuclear power plant accident and veterans of the Second World War.2
From a low base of 13.6 per cent of total budget expenditure in 1998, state social security expend-iture increased to 27.6 per cent in 2010, before falling to 25 per cent in 2011. This level is higher than in some other Central European countries, but below the EU average.3 The increase was to a great extent due to a growing total expenditure on pension provision and the introduction of general compulsory state social insurance systems in the first five years of the new millennium.
Health care provision in Ukraine is in the form of a universal public system, financed by the Gov-ernment. Health care expenditure has fluctuated at around three to four per cent of GDP over the last decade.4 Households pay for medicine and pay voluntary contributions for health coverage. In 2006, only every third household in the country
1. The Government of Ukraine is considering ratification of Conven-tion No. 102 and the European Code of Social Security.
2. See ISSA database at http://www.issa.int/aiss/Observatory/Coun-try-Profiles/Regions/Europe/Ukraine
3. See Eurostat, figures for 2006 available at: http://epp.euros-tat.ec.europa.eu/cache/ITY_PUBLIC/3-02062009-BP/EN/3-02062009-BP-EN.PDF
4. Unless stated otherwise, all data are from the SSCU http://www.ukrstat.gov.ua/
spent money on medical services,5 this increased to 45.8 per cent of households in 2011. Thus, almost every second household, spent money on medical services, including outpatient, dental and hospital services.
As Ukraine has an ageing population, spending on old-age pensions is expected to rise. The share of the population above pensionable age (55 years for women and 60 for men), rose from 21.5 per cent at independence in 1991, to 24.7 per cent in 2011. By 2020, it is expected to reach 28.4 per cent.6 The share of the population above the pensionable age who received a pension increased from 89.4 per cent in 1999 to 94.4 per cent in 2009 (see Table 10 ‘Social security’). While pension coverage is almost universal, there are still people above pen-sionable age who are not fully covered and among those who are covered, many are socially vulner-able as the benefit they receive is low. The ratio of average pensions to average wages has fluctuated considerably over the past twelve years. Start-ing at 39.5 per cent of the average wage in 1998, the ratio reached a low of 36.4 per cent in 2000. Thereafter, the value of pensions has risen relative to wages, and amounted to 52.4 per cent in 2009, and 46.5 per cent in 2011.7
Without supplementary income from employ-ment or savings, pensioners have incomes that are far below those of employed persons.8 The IDSS reports that 58.2 per cent of households that consist only of pensioners were spending more than 60 per cent of their income on food in 2011.
5. E. Libanova, Poverty of population in Ukraine, monograph IDSS, 2008.
6. See LABORSTA database, http://laborsta.ilo.org/STP/guest7. Calculated on the basis of SSCU data.8. Private pension institutions are not common in Ukraine, and only
497,100 people (2.24 per cent of the employed population) have a private pension plan.
10 Social security
Ukraine_E_Second Edition.indd 49Ukraine_E_Second Edition.indd 49 16.09.13 10:4116.09.13 10:41

Decent Work Country Profile UKRAINE Second Edition50
Single women pensioners are particularly vul-nerable as in their working life, they were more likely to work in lower paid sectors with salaries some 20 to 30 per cent lower than those of men. As a result, a larger share of women receive the minimum pension, which is rarely above than the subsistence minimum. At present, women’s pen-sions are on average one third lower than those of men.9 Women currently have a life expectancy of
9. E. Libanova (IDSS): Official presentation at the roundtable held by the UN Population Fund, July 3rd, 2009.
30 years at age 60 compared to 15 years for men, and at the same time, women more often remain widowed (more than half of women aged 60 years and over are widows) contributing further to old-age poverty among women.
A 2011 law on measures to ensure the legislative reform of the pension system has increased the contribution threshold to qualify for the minimum old-age pensions by ten years. It has also increased the retirement age for women to 60 years and for men to 62 years when appointing special pen-
Table 10. Social security
1998 1999 2000 2001 2002 2003 2004 2005 2006 2007 2008 2009 2010 2011
Share of population above pensionable age benefiting from a pension, in %1 89.6 89.4 89.0 88.8 89.4 90.5 91.2 93.9 93.7 95.4 95.0 94.4 94.1 93.6
Share of working-age population contributing to the Pension Fund2 _ _ 40.9 38.8 46.4 42.9 43.1 43.2 43.6 43.5 54.8 55 _ _
State social security expenditure, in % of GDP 4.1 3.2 3.5 4.1 5.6 4.9 5.6 9.0 7.6 6.7 7.8* 8.6 9.7 8.0
State social security expenditure, in % of total expenditure 13.6 11.9 12.4 15.0 21.0 17.1 18.8 28.1 23.6 21.3 23.7 25.4 27.6 25.0
Health care expenditure, in % of GDP 3.5 2.9 2.9 3.1 3.3 3.6 3.5 3.5 3.6 3.7 3.5 4.0 4.1 3.7
Average pension/average wage3, in % 39.5 38.8 36.4 39.4 36.3 39.43 53.6 50.5 45.9 55.6 49.7 52.4 50.1 46.5
Notes:1 The regular pensionable age is 55 years for women and 60 years for men. No disaggregation by sex is available.2 Data from the ILO Social Security Department http://www.ilo.org/dyn/ilossiadmin/ssiindic.viewMultiIndic?p_lang=en&p_indicator_code=CP-
1a%20OA&p_geoaid=804 This indicator reflects the extent to which the current working-age population is protected in old age. It is calculated as the number of current
affiliates to a social security institution providing benefits in old age as a proportion of the working-age population. This version of the old age demographic protection ratio might slightly overstate the future level of protection if some of the currently affiliated members do not build up sufficient entitlements during working age. Females aged 15 to 54, males aged 15 to 59.
3 The ratio between the average pension rate as of 1 January and the average wage for the preceding year.Source:SSCU; Social Security Department, ILO http://www.ilo.org/dyn/ilossiadmin/ssiindic.viewMultiIndic?p_lang=en&p_indicator_code=CP-1a%20OA&p_geoaid=804
Ukraine_E_Second Edition.indd 50Ukraine_E_Second Edition.indd 50 16.09.13 10:4116.09.13 10:41

5110. Social security
Legal Framework Indicator 16. PensionLaw, policy or institutions: The Law on pension provision No. 1788-XII, 1992, as amended; the Law on general com-pulsory State pension insurance No. 1058-IV, 2003, as amended; the Law on non-State pension provision No. 1058-IV, 2003, as amended; the Law on State social assistance to persons not entitled to pension and to persons with disabilities 2005; the Law on measures to ensure the legislative reform of the pension system No. 3668-VI, 2012, the Law on the collection and accounting of single social payment mandatory state social insurance No. 2464 – VI, 2010. The MLSP is responsible for policy and provides general coordination. The Pension Fund administers pensions. Regional (oblast) and local social protection departments administer the programme.
Qualifying and entitlement conditions: Men aged 60 or women aged 55 to 60 with at least five years of covered employment. The requirements are reduced for those who worked for at least 15 years in difficult or dangerous conditions, for mothers of five or more children or of disabled children, for disabled war veterans, and for some other categories. In all cases, contributions must be paid for the entire period of covered employment or for years spent in full-time higher education, army service, caring for a disabled person, for children younger than age three, or being unemployed and seeking a job. The pension is paid to unemployed workers, who are not more than 1.5 years below retirement age, who meet the requirements for covered employment, and who lost their jobs due to downsizing, reorganization or liquidation of the enterprise where they were employed. The pension ceases if the beneficiary is reemployed before reaching retirement age. Payment of old-age pensions can also be deferred and increased.
Social pension: low-income citizens who are not working and not eligible for an old-age pension can receive a social pension from age 63 according to a means test.
Benefits (level and duration): Pension benefits are calculated according to a formula specified by law, and depend on the value of the wage from which insurance contributions were paid to the Pension Fund and pensionable service. The cost of one pensionable service year is equal to the coefficient of 1.35. The pension is paid monthly. The minimum old-age pension is equal to the minimum subsistence level for a disabled person.
Partial pension. After the Law on State social assistance to persons not entitled to pension and to persons with dis-abilities took effect on 1 January 2005, social pensions were transformed into social assistance. The Law on general compulsory State pension insurance took effect on 1 January 2004, meaning most provisions of the Law on pension provision, No. 1788-XII, 1992, became invalid. Nonetheless, pensions assigned under the Law on pension provision and social pensions, at the pensioner’s wish, continue to be paid by the bodies of the Pension Fund until expiration of their payment period.
Part-time (minimum) pension is paid if the insured has less than 35 years (men) or 30 years (women) of covered employment, and insurance contributions have been paid for that period.
Adjustment of pensions: periodic adjustment for inflation, changes in the average wage and changes to the subsistence minimum for disabled people.
Financing: Contributions from insured workers (two per cent of wage or earnings) and employers’ (33.2 per cent of payroll). Self-employed: voluntary contribution level not less than 33.2 per cent of minimum wage. The Government finances state and social pensions, allowances and increases to pensions, as well as parts of other higher paying pen-sions run by addition schemes. If necessary, subsidies from central and local executive authorities are granted. Con-tributions from insured persons and employers are also used to pay occupational injury benefits and family benefits; contributions from self-employed persons are used to finance family benefits while the Government also contributions to occupational injury benefits.
Coverage of workers in law: All employed Ukrainian citizens, foreigners, and stateless persons employed under employ-ment agreements or under civil-law agreements, as well as self-employed persons. Voluntary coverage is possible. Special provisions for victims of the Chernobyl nuclear power plant accident.
Coverage of workers in practice: No information located by the ILO.
Evidence of implementation effectiveness: No information located by the ILO.
Ratification of ILO Conventions: The Social Security (Minimum Standards) Convention, 1952 (No. 102), and the Invalid-ity, Old-Age and Survivors’ Benefits Convention, 1967 (No. 128) have not been ratified.
Source: ISSA database, supplemented by Social Security Throughout the World (Social Security Administration of the United States, September 2008) (http://www.issa.int/aiss/Observatory/Country-Profiles/Regions/Europe/Ukraine).
Ukraine_E_Second Edition.indd 51Ukraine_E_Second Edition.indd 51 16.09.13 10:4116.09.13 10:41

Decent Work Country Profile UKRAINE Second Edition52
sions, including those for civil servants, depu-ties, judges, prosecutors and scientific workers. Increasing the normal retirement age from the current level of 55 years for women and 60 years for men has been an important issue of debate in Ukraine. According to the Pension Fund’s data,
some 2.9 million pensioners (or 20 per cent of all retirees) were still working in 2011. Most of these received old-age benefits (80 per cent),10 while the
10. According to article 42 of the Law on General Compulsory State Pension Insurance, working retirees still receive their pensions.
Legal Framework Indicator 17. Incapacity to work due to sickness/sick leaveLaw, policy or institutions: Social insurance (cash benefits) is regulated by the Law on the general compulsory State social insurance against temporary loss of working capacity and in connection with expenses caused by burial No. 2213-III, 2001 and the Law on the collection and accounting of single social payment mandatory state social insurance No. 2464 – VI, 2010. The MLSP, Ministry of Finance and the Social Insurance Fund provide general oversight of the cash benefits pro-gramme. The Ministry of Health and health departments of local governments provide general supervision and coordinate medical benefits.
Qualifying and entitlement conditions: Insured persons who have paid insurance contributions for less than six of the last 12 calendar months, are paid benefits for temporary incapacity for work, such as sickness unrelated to occupa-tional disease, maternity and parental leave based on the wage from which insurance contributions were paid, but not higher than the minimal wage. Insured temporary and seasonal workers can be paid sickness benefits for a maximum of 75 days a year; temporary incapacity to work related to child care for children under 14 years can be paid for a maximum of 14 days and for children needing hospitalization, for the entire time a care giver stays in hospital with the child. If an insured person is unable to work due to quarantine applied by government services, benefits are paid for the duration of absence from work.
Benefits (level and duration): Within the general compulsory state social insurance against temporary loss of working capacity and in connection with expenses caused by burial, the following endowment and social service types are provided: benefits for temporary incapacity for work (including care for a sick child); maternity benefits; burial benefits (except for burial of pensioners, unemployed, and pensioners who died in an occupational accident); allowance for health-recovering activities such as: payment for vouchers for health resort and spa treatment of insured persons and their family members, vouchers to children’s health-recovering facilities; maintenance of sanatoriums; provision of social services in extracurricular activities with children including purchase of New Year gifts for children.
Cash benefits: 60 per cent of the insured person’s average gross earnings over the last three months with less than five years of contributions; 80 per cent with five to eight years of contribution; 100 per cent with eight or more years of contribution or for a person injured due to the Chernobyl nuclear power plant accident, a person caring for a child injured due to the Chernobyl nuclear power plant accident, a veteran of WWII, or a surviving spouse of a war veteran or soldier killed in combat. The benefit is equal to 100 per cent of the insured person’s earnings for a working parent caring for a sick family member for up to 14 days per case. Medical services are provided directly to patients by government health facilities. Waiting period: the benefit is paid after a five-day waiting period for a maximum of six months or until certification of permanent disability.
Financing: Cash benefits (for both sickness and maternity): contributions from insured persons (0.5 to 1.0 per cent of earnings) and from employers (1.4 per cent of payroll). Self-employed: three per cent of declared income. Medical benefits: state budget.
Evidence of implementation effectiveness: No information located by the ILO.
Coverage of workers in law: Cash benefits: employed persons, including employees on leave to pursue education or training; those unemployed as a result of enterprise liquidation; registered unemployed persons; and military personnel. Medical benefits: all persons residing in Ukraine. Special provisions for victims of the Chernobyl nuclear power plant accident.
Coverage of workers in practice: No percentage located by the ILO.
Ratification of ILO Conventions: The Social Security (Minimum Standards) Convention, 1952 (No. 102), and the Medical Care and Sickness Benefits Convention, 1969 (No. 130) have not been ratified.
Source: ISSA database, supplemented by Social Security Throughout the World (Social Security Administration of the United States, September 2008) (http://www.issa.int/aiss/Observatory/Country-Profiles/Regions/Europe/Ukraine).
Ukraine_E_Second Edition.indd 52Ukraine_E_Second Edition.indd 52 16.09.13 10:4116.09.13 10:41

5310. Social security
remainder had taken early retirement on privileged terms or due to disability.11 Analysis of employ-ment by age shows that the overall employment rate for persons aged 15 to 64 years in Ukraine is lower than in most European countries, but employment among pensionable-age population is far higher than in other countries. This can be explained both by the low pensionable age and the often inadequate level of pensions.
Another issue of debate is the inter-generational inequality regarding the pension system. The cur-rent generation of pensioners, who financed the old pension system during their working life, receive a pension of much lower purchasing power than was previously the norm. At the same time, the current working generation realizes that if the current pension system is maintained, they may not receive an adequate pension. This has led to an increasing reluctance to finance the pay-as-you-go (distributive) system on the part of insurance con-tribution payers.12
The PES and the executive board of the FGCS-SIU take measures to promote employment (see Chapter 2. ‘Employment Opportunities’). Active labour market policies include the provi-sion of information, consulting and vocational guidance services and training, creation of a vacancy data bank and search for a suitable job, placement in vacancies, placement of non-competitive population groups in reserved jobs, including by assisting the placement organiza-tion and public works. If no suitable job is avail-able, the PES provides cash benefits in line with current legislation. In 2011 some 1.9 million unemployed people made use of PES assistance; 762,700 were placed in jobs at the employment service’s referral; 215,600 underwent vocational training; 364,800 took part in paid public works; 1,744,000 participated in vocational guidance services; and 1,201,500 received unemployment benefits.
11. Україна на шляху до п’ятнадцятої річниці Міжнародної конференції з народонаселення та розвитку: Стан реалізації Україною Програми дій МКНР протягом 1994-2009.
12. See also A. Dobronogov: System Analysis of Social Security in a Transition Economy: the Ukrainian Case, International Institute for Applied System Analysis Report, 1998.
One of the largest shares of insurance payments is related to occupational accidents, directly caused by poor safety and health conditions at the work-place (see Chapter 9 ‘Safe work environment’). In 2009, enterprise contributions for occupa-tional accident and disease insurance varied from 0.56 per cent for enterprises belonging to the first class of professional risk, up to 13.5 per cent for enterprises belonging to the 67th class. The lat-ter class consists mainly of enterprises in eastern Ukraine where a high proportion of employment is in coal mining. Contributions have been amended slightly by a 2010 law on social insurance contri-butions, which introduced a single social tax with employers contributions ranging from of 36.3 per cent to 49.7 per cent of the payroll. The value of occupational accident and illness benefits has increased much faster than that of other benefits and sometimes reaches the level of an average wage. This insurance system has been criticized for a lack of efficiency and for being over gen-erous in practice due to ineffective coordination with other benefit providers. Occupational acci-dent and illness benefits payments continue after a victim starts to receive the old-age pension, and the FGCSSIU reimburses expenditure of the Pen-sion Fund (where the victim was insured on gen-eral terms) for assigned disability pensions and survivors pension related to occupational acci-dents and illnesses. FGCSSIU expenditure in this area grows every year.
In 2009, cash and non-cash social transfers (including pensions) made up 27.1 per cent of household income and thus had significant influ-ence on overall income levels and distribution. While income inequality is primarily a result of wage inequality, the uneven distribution of pen-sion payments greatly contributes to income ine-quality in Ukraine. While some components of the social security system such unemployment and family benefits and state social assistance have a dampening effect on inequality, the overall effect of social transfer payments increases inequality. This is in contrast to other countries, where trans-fer payments tend to reduce income inequality.13
13. Based on calculations using data from E. Libanova. Poverty of population in Ukraine, monograph (IDSS), 2008, p. 135.
Ukraine_E_Second Edition.indd 53Ukraine_E_Second Edition.indd 53 16.09.13 10:4116.09.13 10:41

Decent Work Country Profile UKRAINE Second Edition54
Benefits for temporary incapacity to work are paid by the employer based on a sickness certif-icate. For the first five days of incapacity, pay-ment is directly from the employers’ funds and for subsequent days from the FSITLWC, funded by employer contributions. Expenditure on tem-porary incapacity benefits has increased steeply: from UAH 1.4 billion in 2004 to UAH 4.3 bil-lion in 2011. At the same time, the proportion of such spending in total FSITLWC expenditure has increased from 42.8 per cent in 2004 to 57.4 in 2011.
The share of the working-age population pay-ing insurance contributions to the Pension Fund remains low. It has grown by 14.1 percentage points over the past ten years, from 40.9 per cent
in 2000 to 55 per cent in 2009, as a result of per-sonalization of insurance contributions and a tran-sition to pay-as-you-go insurance principles in the pension scheme (see Table 10 ‘Social security’).
In sum, the social security system in Ukraine has broadly improved over the last twelve years. Particular improvements have been achieved through the implementation of the systems of compulsory state social insurance against unem-ployment, temporary loss of working capacity and in connection with expenses caused by birth and burial, against occupational accidents and illnesses, and pension insurance. However, the system still suffers from inadequacies and is in need of further improvements. This is particu-larly notable regarding old-age pension system
Legal Framework Indicator 18. Incapacity for work due to invalidityLaw, policy or institutions: The Law on pension provision No. 1788-XII, 1992, as amended; the Law on general com-pulsory State pension insurance No. 1058-IV, 2003, as amended; the Law on non-State pension provision No. 1058-IV, 2003, as amended; the Law on State social assistance to persons not entitled to pension and to persons with disabilities, 2005. The MLSP is responsible for policy and provides general coordination. The Pension Fund administers pensions. Regional (oblast) and local social protection departments administer the programme.
Qualifying conditions: Total disability (incapacity for any work): paid for a Group I disability (requiring constant attend-ance) or a Group II disability (not requiring constant attendance). Partial pension for total disability: paid if the insured has less than 25 years (men) or 20 years (women) of covered employment. If the insured has insufficient years of covered employment, the monthly benefit is reduced in proportion to the number of years below the required number of years of coverage. Partial disability: paid for a Group III disability (incapacity for usual work).
Benefits (level and duration): Disability pension: the insured person has a minimum of two to five years of covered employment, depending on age when the disability began. The full disability pension for Group I is equal to 100 per cent of the old-age pension; Group II are entitled to 90 per cent; and Group III to 50 per cent. In case the insured per-son has insufficient years of covered employment, the pension is reduced in proportion to number of years below the required number. Social pension (disability): between 30 and 200 per cent of the minimum old-age pension (equal to the minimum level of subsistence for a disabled person) depending on the assessed degree of disability. Carer’s allow-ance (disability): the monthly allowance is paid to a carer of a Group I disabled child younger than age 16. The carer must not be employed, but may receive an unemployment benefit. Social pension (disability): a means-tested pension is paid to low-income citizens who are not working and not eligible for a disability pension or work injury benefit.
Financing: Same as for old-age and survivors’ pensions, work injury benefits and family allowances.
Evidence of implementation effectiveness: No information located by the ILO.
Coverage of workers in law: All employed Ukrainian citizens, foreigners and stateless persons employed under employ-ment agreements or civil-law agreements, self-employed persons. Voluntary coverage is possible. Special provisions for victims of the Chernobyl nuclear power plant accident.
Coverage of workers in practice: No information located by the ILO.
Ratification of ILO Conventions: The Social Security (Minimum Standards) Convention, 1952 (No. 102), and the Invalid-ity, Old-age and Survivors’ Benefits Convention, 1967 (No. 128) have not been ratified.
Source: ISSA data base, supplemented by Social Security Throughout the World, (Social Security Administration of the United States, September 2008) (http://www.issa.int/aiss/Observatory/Country-Profiles/Regions/Europe/Ukraine).
Ukraine_E_Second Edition.indd 54Ukraine_E_Second Edition.indd 54 16.09.13 10:4116.09.13 10:41

5510. Social security
reform, which should aim to ensure long-term financial sustainability and adequate income lev-els for all pensioners. A plan to introduce man-datory private pensions has been formulated, but implementation has consistently been pushed back. For pension system reform, it is impor-tant to take measures to balance the pay-as-you-go system of general compulsory state pension insurance; revise differentiation in pension rates; introduce a compulsory contribution-based sys-tem of general compulsory state pension insur-ance; and develop the non-state pension system. The other areas of general compulsory state social insurance also need reform in the context of the introduction of a uniform social contribu-tion in 1 January 2011. There is also a need for legislation for and implementation of a system of general compulsory state medical insurance that should be accompanied by health care sys-tem reforms. The health system is funded by the State budget, putting pressure on the tax base, and adding to labour payroll costs. This has the
risk of pushing people into shadow employment as employers are unwilling to finance high social contributions. To strengthen the social security system, people should be paid at least minimum wage from which they can make social insur-ance payments; functions of social insurance funds should be revised, to avoid duplication and exclude non-insurance contributions from the fund budgets. In addition, to minimize the bur-den on the payroll, expand the base of insurance contributions and reduce the size of the shadow economy a number of steps are necessary: 1) A reassessment of insurance contributions made by workers and employers; 2) unification of the base on which insurance contributions are charged for various social insurance types; 3) elimination of preferential tariffs for contributions to general compulsory state pension insurance and insur-ance against occupational accidents and diseases; and 4) elimination of duplication of expenditures from various social insurance systems and the state social security system.
Ukraine_E_Second Edition.indd 55Ukraine_E_Second Edition.indd 55 16.09.13 10:4116.09.13 10:41

Ukraine_E_Second Edition.indd 56Ukraine_E_Second Edition.indd 56 16.09.13 10:4116.09.13 10:41

Ukraine has ratified most international labour conventions related to social dialogue, including the two fundamental conventions: the Freedom of Association and Protection of the Right to Organ-ize Convention, 1948 (No. 87) and the Right to Organize and Collective Bargaining Convention, 1949 (No. 98), as well as the Tripartite Consultation (International Labour Standards) Convention, 1976 (No. 144), an important convention for consultation procedures.1 These ratifications provide a sound legal basis for the strengthening of social dialogue.
After Ukraine gained independence in 1991, the Labour Code from the Soviet era was amended and several other laws were adopted2 to set up a legal framework for the establishment of inde-pendent employers’ and workers’ organizations. The country also adopted the legal framework for social dialogue and labour relations in their bipar-tite and tripartite forms and created supporting institutions, in particular the National Council for Social Partnership which was closed when a new consultative and advisory body on social dialogue was established on the same basis under the Presi-dent of Ukraine: the NTSEC.3 The NTSEC has the following key objectives: promoting alignment of positions taken by social dialogue parties on developing socioeconomic and labour relations,
1. Other issues related to social dialogue are covered by the Employ-ment Policy Convention, 1964 (No. 122) and the Human Resour-ces Development Convention, 1975 (No. 142) also ratified by Ukraine.
2. The Law on collective agreements; the Law on the procedure of settlement of collective labour disputes (conflicts); the Law on trade unions, their rights and guarantees of their activities; and the Law on employers’ organizations.
3. Pursuant to Presidential Decree No. 1871, 2005.
and promoting the conclusion of agreements on the regulation of such relations; as well as devel-oping and submitting to the President of Ukraine, the Parliament and the Cabinet of Ministers, pro-posals on the formulation and implementation of state socioeconomic policy. The NTSEC consists of 22 representatives each from the Cabinet of Ministers, the all-Ukrainian trade union associa-tions, and employers’ organizations. Similar insti-tutions have been established at the regional level to provide coordinated solutions for the problems arising in the socioeconomic field and relating to the rights and interests of workers and employers. At the same time, in 1998, the President of Ukraine established the National Mediation and Concili-ation Service (NMCS) to promote better labour relations, monitor and prevent the emergence of collective labour disputes, and to assist and medi-ate in their timely settlement.4 The competences of the NMCS include: registering the claims filed by workers and collective labour disputes; analysing the claims, identifying and summarizing reasons for collective labour disputes, preparing proposals for their settlement; training mediators and arbi-ters specializing in settlement of collective labour disputes; drafting lists of arbiters and mediators; verifying, as necessary, the mandates of represent-atives of the parties to a collective labour dispute; mediating in collective labour dispute settlement; involving members of Parliament, representatives of public authorities and local governments in the conciliation procedures5.
4. Presidential Decree No. 1258/98 of 17 November 1998 on the establishment of the National Mediation and Conciliation Service.
5. Article 15, Law on the procedure of settlement of collective labour disputes (conflicts).
11Social dialogue, employers’ and workers’ representation
Ukraine_E_Second Edition.indd 57Ukraine_E_Second Edition.indd 57 16.09.13 10:4116.09.13 10:41

Decent Work Country Profile UKRAINE Second Edition58
Generally, the activities of the NMCS positively affect industrial relations and help in both settling and preventing the emergence of collective dis-putes. Due to the negotiation and conciliation pro-cedures initiated by the NMCS between employers and workers and their organizations, the number of strikes decreased from 687 in 1998 to four in 2004. In subsequent years, the number of strikes was at most nine per year (2006). Annual loss caused by strikes between 1998 and 2007 fell from UAH 122.2 million to UAH 0.1 million.6 The number of workers taking part in strikes also dropped sig-nificantly, from 98,700 in 1998 to 100 in 2011 and the working time lost per striking worker fell from 106 hours in 1998 to 15 hours in 2011. However, the working time lost per striking worker spiked sharply in 2008 (465 hours) and 2010 (828 hours) despite fewer workers being engaged in strikes. This shows that collective labour disputes that did occur were protracted and probably aggravated by the financial and economic crisis. Since the aver-age strike duration was more than 100 days, this also suggests, as trade unions argue, that dispute settlement mechanisms lack strength.7
The NMCS registered 224 collective labour dis-putes between 2009 and 2011: 76 in 2009, 64 in 2010 and 84 in 2011. The disputes involved 54,717 workers in 16,752 enterprises. Industrial relations are more stable at the enterprises where collective agreements have been concluded: in col-lectives, conflicts arise less frequently and emerg-ing problems are mostly settled by negotiations.
Under the Law on social dialogue, the NSMC is to register and assess the level of representation pro-vided by employers’ and workers’ organizations at the national, sectoral and territorial levels. In 2011, the NSMC represented two national employ-ers organizations and two national trade unions; at the sectoral level it represented 13 employers organizations and 38 workers associations; and at the territorial level, 36 regional employers’ organizations and 159 regional workers’ organiza-tions. The NSMC has developed and maintained a register of employers’ and workers’ organizations listed on their official website.
6. SSCU cancelled this indicator in 2007.7. FTUU information by letter of 18.01.2011.
The legal and institutional steps taken in the 1990s, though significant, proved insufficient to ensure an effective transformation of the system of labour relations in Ukraine. Social partners faced obstacles in exercising their rights to freedom of association; for instance, in the registration proce-dure, and smaller trade unions have been barred access to negotiations for the General Agreement and other agreements at the production and secto-ral level by stronger trade unions and their asso-ciations. Furthermore legislation limited the exer-cise of the right to strike, as was pointed out by the CEACR. Workers’ representatives also faced problems of anti-union discrimination in certain sectors and enterprises, as reported by the ILO supervisory bodies (see Legal Framework Indi-cator 19 ‘Freedom of association and the right to organize’ and Legal Framework Indicator 20 ‘Col-lective bargaining right’).
Since 2003, when article 16 of the Law on trade unions, their rights and guarantees of their activi-ties was amended, workers organizations have been given legal status through a process involving notification of compliance with the their declared status.8 As of 1 October 2010, the Ministry of Jus-tice had registered 161 all-Ukrainian trade unions and trade union associations and 21 all-Ukrainian associations of employers’ organizations.
According to official statistics, the coverage rate of employees under enterprise-level collec-tive agreements in Ukraine is fairly high, and rose from 68.9 per cent in 1998 to 83.9 per cent in 2009, before falling to 81.6 per cent in 2011. However the number of non-staff workers covered by such agreements is much lower, at 70 per cent and fell from 10.6 million in 1998 to 8.8 million in 2011, compared to coverage of 12.7 million employees.9 According to the Law on collective agreements, collective agreements are concluded on the bilateral basis at the national, sectoral and regional levels whereas enterprise-level collec-tive agreements are concluded at the production unit level. Regional and sectoral agreements are
8. Legalization is performed by the Ministry of Justice and its depart-ments at relevant levels by means of including the trade union on the register of citizens’ associations and issuing a certificate of legalization indicating the trade union’s status.
9. FTUU information by letter of 18.01.2011.
Ukraine_E_Second Edition.indd 58Ukraine_E_Second Edition.indd 58 16.09.13 10:4116.09.13 10:41

5911. Social dialogue, employers’ and workers’ representation
to be registered with the Ministry of Justice. As of 1 October 2010, under the General Agreement for 2008-2009, 27 regional and 92 sectoral agree-ments had been concluded and were being imple-mented. The SSCU reported that as of 31 March 2012, 101,766 enterprise-level collective agree-ments had been concluded and registered, an increase of 2,000 since 2010.10
This trend was observed despite a decline in trade unions influence over the same period (see Table 11 ‘Social dialogue, employers’ and work-ers’ representation’). The number of trade union members in Ukraine’s largest trade union federa-tion, the Federation of Trade Unions of Ukraine (FTUU), almost halved between 1998 (14.2 mil-
10. This data only applies to workers of large and medium-sized enterprises. Small enterprises do not submit statistical reports on collective agreement regulation.
lion) and 2011 (8.2 million).11 In other words, FTUU membership fell from 75 per cent of all workers in 1998 to 42.1 per cent in 2008 and to just 40.3 per cent in 2011. In late 2009, at the start of negotiations for concluding a new general agreement for 2010-2012, two joint representa-tive bodies of trade unions were established on the trade union side, which united for collective bargaining: the Joint Representative Body of All-Ukrainian Trade Unions and Trade Union Associ-ations (JRB(t)) and the National Joint Representa-tive Body of All-Ukrainian Trade Unions and Trade Union Associations with 10.1 and 4.1 mil-lion members, respectively.12 In September 2012
11. This number includes 1.3 million student members of mem-ber organization trade unions, and 663,500 retired trade union members. Data on other national trade union associations are not available.
12. Existing legislation and trade union statutes do not rule out the possibility of double membership.
Legal Framework Indicator 19. Freedom of association and the right to organizeLaw, policy or institutions: The right to join and form organizations is established in article 36 of the Constitution of Ukraine, which also provides that no one may be forced to join any association of citizens. Other relevant legal acts in force include the Labour Code 1971, the Law on citizens’ associations, the Law on trade unions, their rights and guar-antees of their activities, and the Law on employers’ organizations. The right to strike is guaranteed under article 44 of the Constitution and under the Law on trade unions.
Evidence of implementation effectiveness: The CEACR has commented for some years, amongst other issues, on sec-tion 31 of the Law on employers’ organizations, according to which the bodies of the State authority shall exercise control over economic activities of employers’ organizations and their associations; the CEACR asks for this section 31 to be repealed. It has asked for the amendment of section 19 of the Act on procedure for the settlement of col-lective labour disputes which provides that a decision to call a strike has to be supported by a majority of the workers or two-thirds of the delegates of a conference. The Committee recalled that if the national legislation requires a vote to be held, it should ensure that account is taken only of the votes cast and that the majority is fixed at a reasonable level. Comments were made in 2006 by the International Confederation of Free Trade Unions (now, International Trade Union Confederation – ITUC) on the issue of trade union registration, restrictions on the right to strike, interference in trade union activities and harassment of trade unionists. Most of these concerns were dealt with by the ILO’s Commit-tee on Freedom of Association which noted with interest the information provided by the Government on the outcome of investigations into the cases of alleged violations of trade union rights and considered that no further examination was needed (see 350th Report).
Coverage of workers and employers in law: according to the Law on trade unions, all employees and self-employed persons may join trade unions. Judges are excluded.
Coverage of workers and employers in practice: No information located by the ILO.
Ratification of ILO Conventions: The Freedom of Association and Protection of the Right to Organize Convention, 1948 (No. 87), and the Right to Organize and Collective Bargaining Convention, 1949 (No. 98), were both ratified in 1956.
Sources:1. National legislation listed in NATLEX (http://www.ilo.org/dyn/natlex/natlex_browse.country?p_lang=en&p_country=UKR);2. Comments of the CEACR on the application of Convention No. 87 at:
http://webfusion.ilo.org/public/db/standards/normes/appl/index.cfm?lang=EN.3. Committee on Freedom of Association, Report No. 350 (Vol. XCI, 2008, Series B, No. 2), Case No. 2388, Para. 211-214.
Ukraine_E_Second Edition.indd 59Ukraine_E_Second Edition.indd 59 16.09.13 10:4116.09.13 10:41

Decent Work Country Profile UKRAINE Second Edition60
five nationwide trade unions: the FTUU (8.5 mil-lion members), the Transport Federation of Trade Unions of Ukraine (735,000 members), CFTUU (182,000 members), Unity (154,000 members) and the Independent Association of Ukrainian Unions (204,000 members) signed an agreement on the formation of the new JRB(t).
On the employers’ side, the Federation of Employ-ers of Ukraine declared 27,300 members in 2008 (or 6.8 per cent of registered enterprises), com-pared to 7,900 in 2004 (or 2.4 per cent of regis-tered enterprises). Data from other employers’ federations are not available. Judicial disputes among employers’ organizations concerning their representation in the management of general com-pulsory state social insurance, which took place between 2008 and 2009, forced the employers’ organizations to merge, forming the Joint Rep-resentative Body of the Employers’ Party on the national level (JRB(e)), which is now the highest representative body of all-Ukrainian associations of employers’ organizations.13
13. At present, JRB(e) activities cover all the all-Ukrainian associa-tions of employers’ organizations created on territorial or sectoral grounds legalized by the Ministry of Justice.
Members of the JRB(e) include employers’ organ-izations in all 27 administrative-territorial units,14 as well as in most economic activities: transport and communications, utility services, agriculture, hotels and restaurants, culture, sports, recreation and entertainment, textile production, metallurgy, machine-building and metal-working activities, health care, medical and microbiological indus-tries, mining activities including coal mining, the glass industry, construction, design and architec-ture, and the chemical industry. These enterprises employ some 8.5 million people.
Amongst its activities, the JRB(e) represents the interests of business associations and entrepre-neurs. Members include: the Ukrainian National Committee of the International Chamber of Com-merce, the Union of Tax Advisors of Ukraine, the Ukrainian Agrarian Confederation, the Ukrain-ian Union of Industrialists and Entrepreneurs, the Union of Entrepreneurs of Small, Medium-Size and Privatized Enterprises of Ukraine, the Asso-ciation of Enterprises of Agricultural Machinery Manufacturers and Repairing Entities of Ukraine,
14. Specified by article 133(2) of the Constitution of Ukraine.
Legal Framework Indicator 20. Collective bargaining rightLaw, policy or institutions: The right to form and join organizations is provided by article 36 of the Constitution of Ukraine which also provides that no one may be forced to join an association of citizens or be restricted in his right to belong or not to belong to political parties or public organizations. Other relevant laws in force include the Labour Code 1971, the Law on citizens’ associations, the Law on trade unions, their rights and guarantees of their activities, and the Law on employers’ organizations. The right to strike is guaranteed by the Constitution of Ukraine, the Law on the procedure of settlement of collective labour disputes (conflicts) and the Law on trade unions.
Evidence of implementation effectiveness: The CEACR is waiting for Government replies to 2008 comments submitted by the Independent Trade Union of Miners of the Krasnodon coalmine, the CFTUU and the ITUC on new cases of anti-union discrimination and interference, as well as violation of the right to bargain collectively in the public and private sectors. It has noted the ITUC’s statement that some of the incidents of trade union discrimination have been effectively addressed by the courts and that the Government has been making efforts to resolve the complaints reported to the Committee on Freedom of Association.
Coverage of workers and employers in law: no exclusions other than as noted in the description on freedom of associa-tion.
Coverage of workers and employers in practice: No information located by the ILO.
Ratification of ILO Conventions: The Freedom of Association and Protection of the Right to Organize Convention, 1948 (No. 87), and the Right to Organize and Collective Bargaining Convention, 1949 (No. 98), were both ratified in 1956.
Sources:1. National legislation listed in NATLEX (http://www.ilo.org/dyn/natlex/natlex_browse.country?p_lang=en&p_country=UKR);2. Comments of the CEACR (http://webfusion.ilo.org/public/db/standards/normes/appl/index.cfm?lang=EN).
Ukraine_E_Second Edition.indd 60Ukraine_E_Second Edition.indd 60 16.09.13 10:4116.09.13 10:41
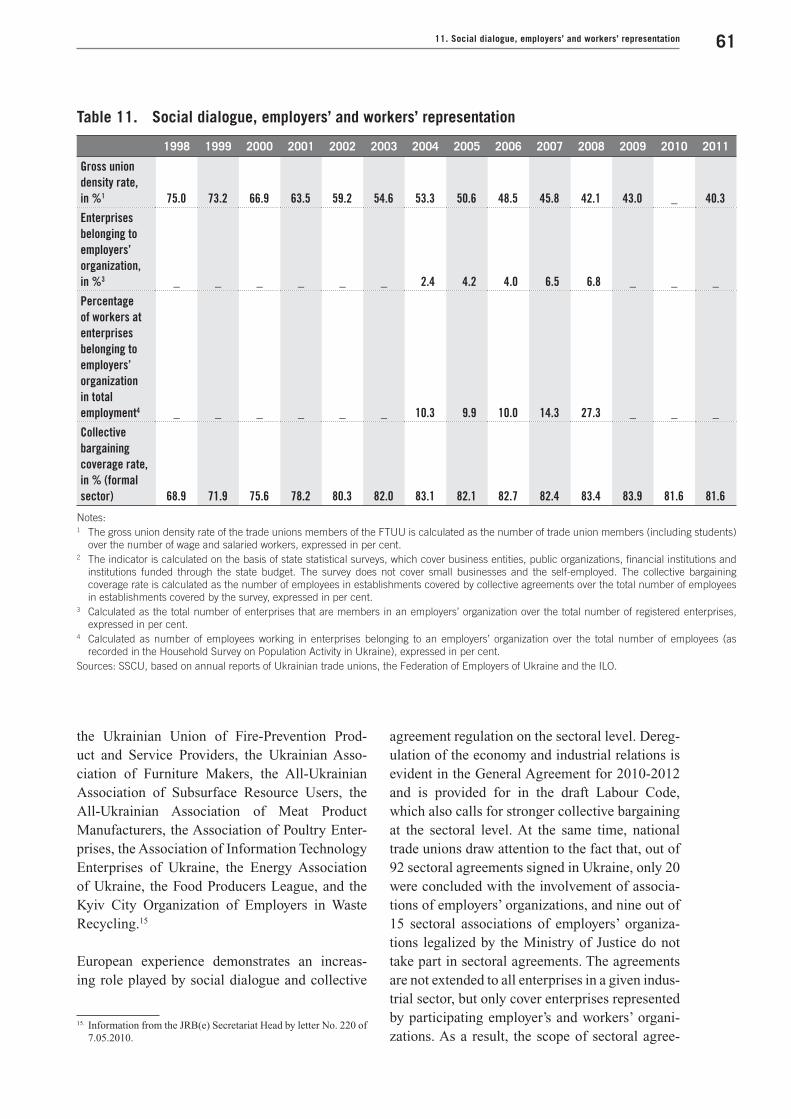
6111. Social dialogue, employers’ and workers’ representation
the Ukrainian Union of Fire-Prevention Prod-uct and Service Providers, the Ukrainian Asso-ciation of Furniture Makers, the All-Ukrainian Association of Subsurface Resource Users, the All-Ukrainian Association of Meat Product Manufacturers, the Association of Poultry Enter-prises, the Association of Information Technology Enterprises of Ukraine, the Energy Association of Ukraine, the Food Producers League, and the Kyiv City Organization of Employers in Waste Recycling.15
European experience demonstrates an increas-ing role played by social dialogue and collective
15. Information from the JRB(e) Secretariat Head by letter No. 220 of 7.05.2010.
agreement regulation on the sectoral level. Dereg-ulation of the economy and industrial relations is evident in the General Agreement for 2010-2012 and is provided for in the draft Labour Code, which also calls for stronger collective bargaining at the sectoral level. At the same time, national trade unions draw attention to the fact that, out of 92 sectoral agreements signed in Ukraine, only 20 were concluded with the involvement of associa-tions of employers’ organizations, and nine out of 15 sectoral associations of employers’ organiza-tions legalized by the Ministry of Justice do not take part in sectoral agreements. The agreements are not extended to all enterprises in a given indus-trial sector, but only cover enterprises represented by participating employer’s and workers’ organi-zations. As a result, the scope of sectoral agree-
Table 11. Social dialogue, employers’ and workers’ representation
1998 1999 2000 2001 2002 2003 2004 2005 2006 2007 2008 2009 2010 2011
Gross union density rate, in %1 75.0 73.2 66.9 63.5 59.2 54.6 53.3 50.6 48.5 45.8 42.1 43.0 _ 40.3
Enterprises belonging to employers’ organization, in %3 _ _ _ _ _ _ 2.4 4.2 4.0 6.5 6.8 _ _ _
Percentage of workers at enterprises belonging to employers’ organization in total employment4 _ _ _ _ _ _ 10.3 9.9 10.0 14.3 27.3 _ _ _
Collective bargaining coverage rate, in % (formal sector) 68.9 71.9 75.6 78.2 80.3 82.0 83.1 82.1 82.7 82.4 83.4 83.9 81.6 81.6
Notes:1 The gross union density rate of the trade unions members of the FTUU is calculated as the number of trade union members (including students)
over the number of wage and salaried workers, expressed in per cent.2 The indicator is calculated on the basis of state statistical surveys, which cover business entities, public organizations, financial institutions and
institutions funded through the state budget. The survey does not cover small businesses and the self-employed. The collective bargaining coverage rate is calculated as the number of employees in establishments covered by collective agreements over the total number of employees in establishments covered by the survey, expressed in per cent.
3 Calculated as the total number of enterprises that are members in an employers’ organization over the total number of registered enterprises, expressed in per cent.
4 Calculated as number of employees working in enterprises belonging to an employers’ organization over the total number of employees (as recorded in the Household Survey on Population Activity in Ukraine), expressed in per cent.
Sources: SSCU, based on annual reports of Ukrainian trade unions, the Federation of Employers of Ukraine and the ILO.
Ukraine_E_Second Edition.indd 61Ukraine_E_Second Edition.indd 61 16.09.13 10:4116.09.13 10:41

Decent Work Country Profile UKRAINE Second Edition62
ments is considerably narrowed, and employers who are not members of relevant associations and organizations refuse to apply the guarantees established by such agreements.16
At the beginning of the new millennium, the Gov-ernment engaged in a new wave of reforms of the legal and institutional framework of social dia-logue and labour relations. In 2002 it initiated the formulation of a new Labour Code. This process is however still underway as since late 2003, the social partners have been unable to reach a com-promise on several provisions of the draft Labour Code. For the same reasons, a draft Law on social dialogue, initiated in 2006 with the aim of creat-ing the basis for an effective tripartite social dia-logue at national, sectoral and territorial level, was delayed for a number of years before being adopted in 2011.
Prior to the adoption of the Law on social dia-logue, national tripartite social dialogue was con-ducted on the basis of the Presidential Decree on the development of social dialogue in Ukraine No. 1871 of 29 December 2005 as amended in 2008 and 2010. This regulation established the NTSEC as a consultative and advisory body to the Presi-dent of Ukraine as well as similar tripartite institu-tions at the regional level. There are 27 Regional Social and Economic Councils (RSEC): 24 in
16. FTUU information by letter of 18.01.2011.
oblasts, two in Kyiv and Sevastopol, and one republican council, in the Autonomous Repub-lic of Crimea. The RSEC function autonomously while maintaining relations with the NTSEC. They are all operational but their effectiveness varies from one region to another and they all face the problem of a lack of resources. The NTSEC has also been facing difficulties as a result of reform to the legislative framework governing its activities, meaning that most of its work was irregular in 2006 and 2007. Since 2008, however the NTSEC has been able to work more sustaina-bly. Appreciable steps have been made to develop the NTSEC’s international relations and in June 2008, the General Assembly of the International Association of Economic and Social Councils and Similar Institutions’ admitted the NTSEC as a full member (see Legal Framework Indicator 21 ‘Tri-partite consultations’). The NTSEC and RSECs brought their activities into conformity with the Law on social dialogue in early 2011.
In April 2008, the Government and social partners concluded the General Agreement between the Cabinet of Ministers, the All-Ukrainian associa-tions of employers’ and entrepreneurs’ organiza-tions and the All-Ukrainian trade unions and trade union associations for 2008-2009. However, the implementation of this agreement rapidly faced problems due to the initiation of a collective labour dispute by the FTUU in 2009 with the Cabinet of Ministers. The dispute concerned non-compliance
Legal Framework Indicator 21. Tripartite consultationsLaw, policy or institutions: Relevant laws include the Law on social dialogue No. 2862-VI, 2010 and the Law on collec-tive agreements. Article 5 of the NTSEC Regulations provides that the NTSEC shall ensure the elaboration and discus-sion of Ukraine’s annual reports to the ILO (Government of Ukraine report on the application of Convention No. 144).
Evidence of implementation effectiveness: The Government reports consultations in the NTEC resulting in recommen-dations for the ratification of several Conventions. The Government has also communicated to the CEACR the General Agreement for 2008-2009, signed on 15 April 2008, between the Cabinet of Ministers, the All-Ukrainian associations of the employers’ organizations and entrepreneurs and the All-Ukrainian trade unions and trade union federations. The NTSEC however faces problems in its work because of a lack of cooperation between employers’ organizations and trade unions as well as limited resources provided by public authorities.
Ratification of ILO Conventions: The Tripartite Consultation (International Labour Standards) Convention, 1976 (No. 144) was ratified in 1994.
Sources:1. Government reports on Convention No. 144;CEACR 2008 comments (http://webfusion.ilo.org/public/db/standards/normes/appl/index.cfm?lang=EN).
Ukraine_E_Second Edition.indd 62Ukraine_E_Second Edition.indd 62 16.09.13 10:4116.09.13 10:41

6311. Social dialogue, employers’ and workers’ representation
with the General Agreement provisions and fail-ure to secure workers’ rights during the crisis and was considered by a Conciliation Commission and labour arbitration. The General Agreement on regulation of basic principles and standards of the implementation of socioeconomic policy and labour relations in Ukraine for 2010-2012 was signed on 9 November 2010. In the second half of 2012 consultations between employers, trade unions and the government were initiated to form a new draft of the agreement for the next term.
When the economic crisis began to affect Ukraine in autumn 2008, there was thus no established practice of functioning social dialogue to address its social and economic consequences on work-ers and their families on the one hand, and on employers on the other. However, in collabora-tion with the ILO, the Government and social partners started to engage in January 2009 on how to address the crisis. The Minister of Labour and Social Policy initiated a series of consulta-tions with social partners on the strategy needed to address the economic crisis and the Prime Minister invited them to attend meetings of the Cabinet of Ministers during which an anti-crisis programme was discussed. The social partners prepared their own proposals of measures to address the consequences of the economic crisis on employers, workers and their families and sub-mitted them to the Government. These tripartite consultations led to a consensus and the adoption of an action plan. At the same time, the social part-ners and on-going social dialogue remain critical of the implementation of Government anti-crisis measures. The Government approved, with Order No. 285-p of 18 March 2009, an action plan for the organization of social dialogue in Ukraine, under which social partners are given a role as members of the collegiums of ministries, central and local executive authorities, and public coun-cils established under them. In addition, the order provided for the establishment of tripartite work-ing groups which are now active in a number of thematic areas. At present, social partners are acting in line with the proposals in the National Trade Union Report to the President of Ukraine, Viktor Yanukovych: Labour in Ukraine: Need for qualitative changes for public efficiency and decent life.
From a decent work perspective, social dialogue in Ukraine remained underdeveloped both in its bipartite and tripartite forms. The on-going delays in adopting the draft Labour Code prevent the industrial relations system from functioning on a sound legal and institutional basis. Despite the recent adoption of the Law on social dialogue, several problems remain unsolved, including legal obstacles to the exercise of freedom of association rights. The promotion of collective bargaining in the expanding private sector also remains a prior-ity. As a result, this decent work deficit remains one of the most burning issues for the Ukrain-ian society, particularly in the wake of the global financial and economic crisis.
Social partners, public authorities, and the Parlia-ment must meet the challenge of finding ground for compromise to amend the draft Labour Code and enable its adoption and entry into force. This would create an enabling framework for improved social dialogue and collective bargaining. A par-ticularly useful article in the draft document pro-vides for the dissemination of general and sectoral agreements to entities that are not signatories of such agreements; as union membership is declin-ing in the private sector this clause would have a strong positive effect on social relations. The adoption of the Law on social dialogue was a step forward in this respect as it provides a compro-mise on the critically important question on the representation capacity of all-Ukrainian trade union associations.
For the first time in Ukraine’s history, the Gov-ernment held active consultations with the social partners on the agreement of the 2010 State Budget indicators. The consultations took place within the NTSEC framework. At the NTSEC plenary meetings in 2010, the social partners dis-cussed a range of issues including the reform of Ukraine’s tax system, protection of the domestic market, competitiveness of domestic goods manu-facturers, and key aspects of the draft 2011State Budget. The following practice was successfully repeated for the State Budgets of 2012 and 2013.
Another law which needs reform is the Law on employers’ organizations. It is equally important that the National Conciliation and Mediation
Ukraine_E_Second Edition.indd 63Ukraine_E_Second Edition.indd 63 16.09.13 10:4116.09.13 10:41

Decent Work Country Profile UKRAINE Second Edition64
Service be provided with the necessary resources to enable it to function effectively and to provide effective support to workers, employers and their organizations in their bipartite relations and nego-tiations. Cooperation among the different employ-ers’ and workers’ organizations would enable them to form more cohesive arguments and strengthen their positions. A promising advance was the cre-ation of the JRB(e) as the highest representative body of all-Ukrainian associations of employers’ organizations by three employers’ organizations17 in 2009. The JRB(e) aims to represent the inter-
17. The All-Ukrainian Association of Employers, the Confederation of Employers of Ukraine and the Federation of Employers of Ukraine.
ests of its member organizations at the national level and formulate a common stance on the for-mulation and realization of Ukraine’s social and economic policy. A similar body exists on the trade unions’ side to improve cooperation among workers’ organizations. Finally, the Government could improve social dialogue by reaching out in a more systematic way to social partners, by lis-tening to them and taking into consideration their opinions and suggestions, and by increasing the resources of the NTSEC and RSEC to secure their better functioning.
Ukraine_E_Second Edition.indd 64Ukraine_E_Second Edition.indd 64 16.09.13 10:4116.09.13 10:41

Ukraine_E_Second Edition.indd 65Ukraine_E_Second Edition.indd 65 16.09.13 10:4116.09.13 10:41

Ukraine_E_Second Edition.indd 66Ukraine_E_Second Edition.indd 66 16.09.13 10:4116.09.13 10:41

Decent WorkCountry Profile
UKRAINESecond Edition
ISBN 978-92-2-127900-6
Published by the International Labour Office (ILO)with financial assistance from the European Union under the ILO/EC Project “Monitoring and Assessing Progress on Decent Work” (MAP).
Ukraine_Cover_E_Second Edition.indd 1Ukraine_Cover_E_Second Edition.indd 1 16.09.13 10:3516.09.13 10:35