turkey grain and feed update - apedaagriexchange.apeda.gov.in/marketreport/reports/turkey grain...
TRANSCRIPT
THIS REPORT CONTAINS ASSESSMENTS OF COMMODITY AND TRADE ISSUES MADE BY
USDA STAFF AND NOT NECESSARILY STATEMENTS OF OFFICIAL U.S. GOVERNMENT
POLICY
Required Report - public distribution
Date: 8/4/2010
Turkey
Grain and Feed Update
Grain and Feed Update
Approved By:
Rachel Nelson, Agricultural Attaché, U.S. Embassy
Prepared By:
Samet Serttas, Agricultural Specialist
Report Highlights:
The Turkish MY 2010 wheat production forecast has been revised to 17 MMT from 18.5 MMT. MY
2010 paddy rice production is forecasted at 750,000 MT and lentil production is forecasted at 510,000
MT. MY2010 corn imports are expected to reach 450,000 MT and exports are forecasted to reach
350,000 MT.
Post:
Ankara
Commodities:
Wheat
Barley
Corn
Rice, Milled
Executive Summary:
Turkey’s wheat harvest is almost finished except in the high altitude areas. Due to low yields in the
Cukurova and Amik regions; yellow rust problems in the South East; and heavy rainfall problems in
Central Anatolia and the Thrace region, post revised its wheat production forecast to 17 MMT from
18.5 MMT for MY 2010. Turkey is expected to import a total of 3 MMT of wheat in MY 2010.
First and second crop corn planting has finished in Turkey. The first harvest will start on August 15
and if weather conditions are favorable, corn production is forecasted to reach 4 MMT in MY
2010. MY2010 corn imports are expected to reach 450,000 MT and exports are forecasted to reach
350,000 MT.
Paddy rice production is forecasted at 750,000 MT for MY 2010 and lentil production is forecasted at
510,000 MT.
PRODUCTION
Wheat
Rainfall in 2009 was higher than in 2008 across most of the country. Average rainfall in Turkey from
October 2009 through June 2010 was 692.4 mm. During the same period of the previous year, rainfall
was 599.8 mm.
The areas with the greatest increase in rainfall were the Marmara, East Anatolia and Southeast Anatolia
regions. Heavy rainfall created yield problems in the Cukurova and Hatay regions.
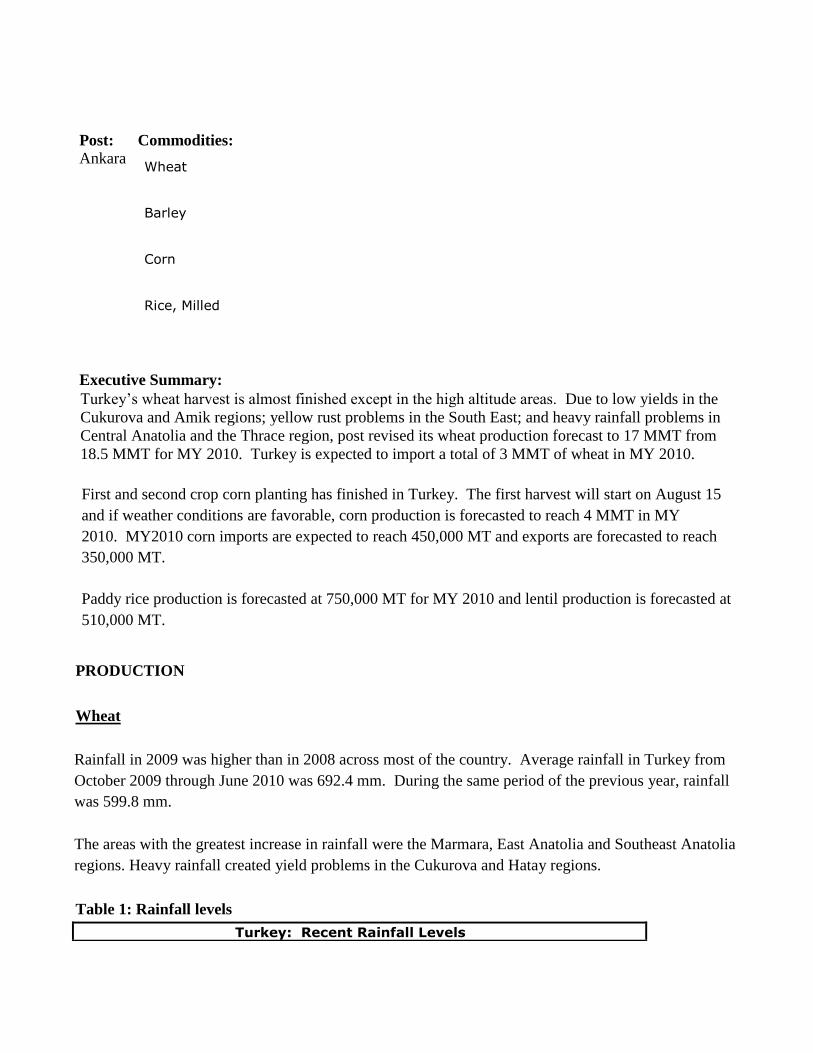
Table 1: Rainfall levels
Turkey: Recent Rainfall Levels
Region Oct 2009- June 2010
(mm) Oct 2008-June 2009
(mm) Normal (mm)
Marmara 798.8 596.9 575.4 Aegean 744.9 738.9 588 Mediterranean 892.7 792.7 733.9 Central Anatolia 433.8 418.7 357.2 Black Sea 767.8 677.2 692.3 East Anatolia 643.9 525.4 542.6 South East Anatolia 544.4 402.0 533.4 Turkey Total 692.4 599.8 576.1
Turkey has seen about 15-20% wheat loss in the MY 2010 harvest except in Ankara and some parts of
the Konya region. These losses were mostly due to yellow rust, particularly in the Southeast, Amik
valley, Aegean region and some parts of Central Anatolia. Heavy rainfall also damaged wheat roots in
the Thrace, Cukurova, and Black sea regions and part of Central Anatolia.
The wheat harvest started on May 10, 2010 in the Cukurova region (Adana, Mersin). For this area,
yields were low in MY 2010 (350-450 MT/da) compared to MY 2009 (550 MT/da). The decrease was
mostly due to heavy rainfall in March and April. Hilly areas showed slightly better yields. In the
Amik valley (Hatay region) heavy rains also caused damage, which is expected to result in losses of at
least 30%. Yellow rust was observed in both the Cukurova and Amik valley in the very early part of
the season, however farmers were able to prevent further damage with chemical treatments (fungicides,
etc.). Damage from the Sunni bug was limited. White wheat is the main variety in the region. It is
popular with high quality flour producers. Due to the high quality of harvested wheat from these
regions, prices increased to 560 TL/MT on July 16, 2010 from 520 TL/MT on May 28, 2010 and 460
TL/MT on May 01, 2010.
In the drier areas and some irrigated land in South East of Turkey, the wheat harvest started on May 15,
2010. Yellow rust was a big problem in these areas due to the lack of chemical sprays and the dry
conditions, especially on the borders of Syria and Iraq. MY 2010 losses were 20-25% in these regions.
Durum wheat in the Karaman region was damaged by strong wind and heavy rainfall in early July
2010, causing both quality and quantity problems.
The Konya region was expecting high yield before harvest in MY 2010. Heavy rainfall, just before and
during harvest time, decreased wheat yield and quality. Yellow rust problem is not observed
predominantly but there were some locations where yellow rust problem observed. Yellow rust
problem observed only in Gerek wheat variety in Konya. Protein content of wheat is low. In MY 2009,
Konya region has high wheat yield but low quality. In MY 2010, yield is low compare to M 2009 but

close to long term average level. In the first forecast Konya region is expected to reach to 3 MMT
record high level of production but late rainfall, increased mouse population, hail damage and yellow
rust problem decreased yield to 2.5 MMT and decreased wheat quality. Protein content of first harvest
was around 13-15% but late rainfall decreased the quality and protein content reduced to 11-12% in
Konya region. Irrigated land yield is 4-6 MT/ha, Dry land yield is 2.5-3.5 MT/ha and the disease or
similar kind of problem occurred area had 1-1.5 MT/ha yield in MY 2010.
Due to yellow rust problem in Samsun region, north central Anatolia, yield is decreased to 2.5 MT/ha
from 4 MT/ha. There is 22,500 ha wheat area in Samsun region. In a normal season production reaches
to 100,000 MT but in MY 2010 it is decreased to 65,000 MT.
Polatli region average yield in non-irrigated land is 3.5 MT/ha. This region is one of the highest quality
wheat producer area. Highest quality products price reached to 670 TL/MT in MY 2010. Polatli region
has approximately 120,000 ha area and wheat products has traditionally high protein content, as
average 13% and less insect damage, below 1%.
Thrace region also have late and excess rainfall. Root damage is very common problem. Yield is
dropped 15-20%.
Durum wheat production in South East Anatolia was not effected by yellow rust. The yield and quality
was close to short term average level. Durum wheat production in South East Anatolia was 1.2 MMT.
Central Anatolia durum wheat area decreased, yield is close to MY 2009 level and quantity is better
than MY 2009 level. Durum wheat production in Central Anatolia is 1.1 MMT. Total durum wheat
production in MY 2010 is 2.7 MMT.
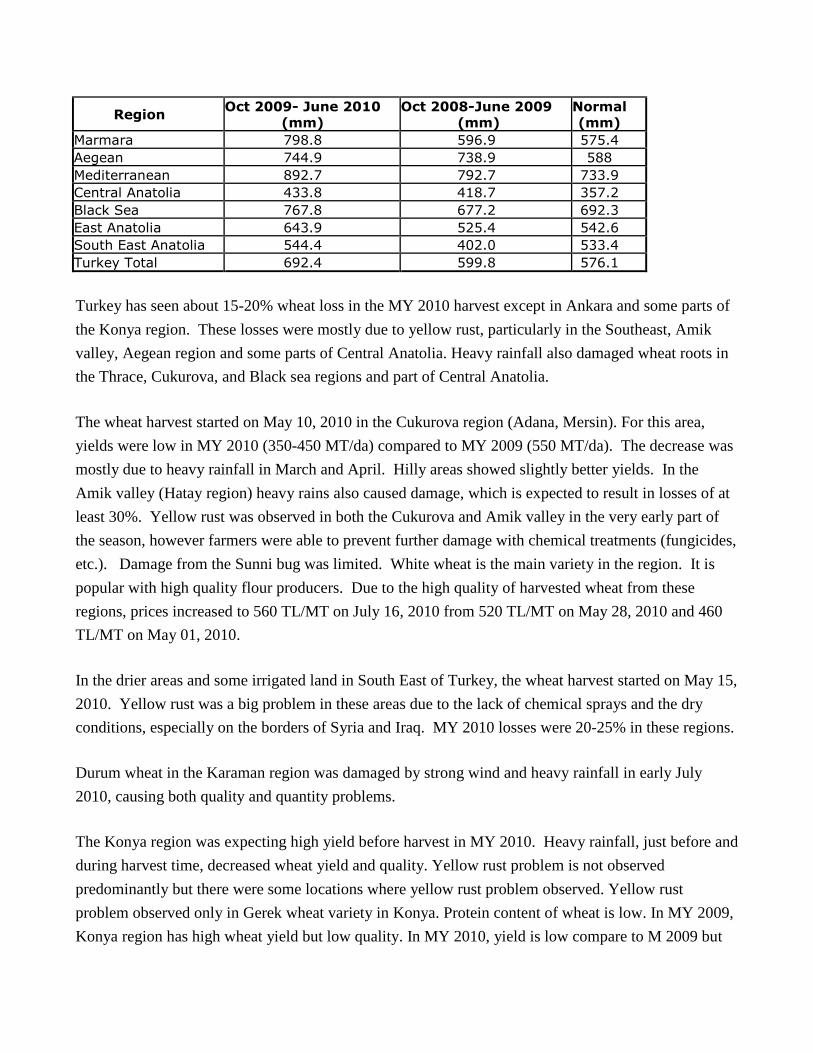
Table 2: Wheat production by region
Turkey: Wheat production in MY 2010
Region MY 2010
average yield
(MT/ha)
Short term
average
yield (MT/ha)
Harvest
time Production
(MT)
Harvested
Area (ha)
Cukurova
region (Adana-
Mersin) 3.5-4.5 4.5-5.5
May 10-
June 10 1,300,000 300,000
Amik region 3 5-5.5 May 25-
June 25 300,000 100,000
GAP region 2 3-3.5 May 15-
June 25 2,000,000 1,000,000
Central
Anatolian
region 2-2.5 1.5-2
June 25-
July 25 6,000,000 3,000,000
Polatli region 2.8-3 3.5 June 15-
July 20 350,000 120,000
Aegean region 2-2.5 3 May 25-
June 25 1,500,000 650,000
Soke region 4.5 4 May 20-
June 10 50,000 8,000
Thrace region 4 4.5-5 June 15-
July15 2,500,000 600,000
Other regions 1.35 1.50 3,000,000 2,222,000
Total 2.12 2.35 17,000,000 8,000,000
Turkey’s wheat harvest is almost finished except in the high altitude areas. Due to low yields in the
Cukurova and Amik regions; yellow rust problems in the South East; and heavy rainfall problems in
Central Anatolia and the Thrace region, post revised its wheat production forecast to 17 MMT from
18.5 MMT for MY 2010
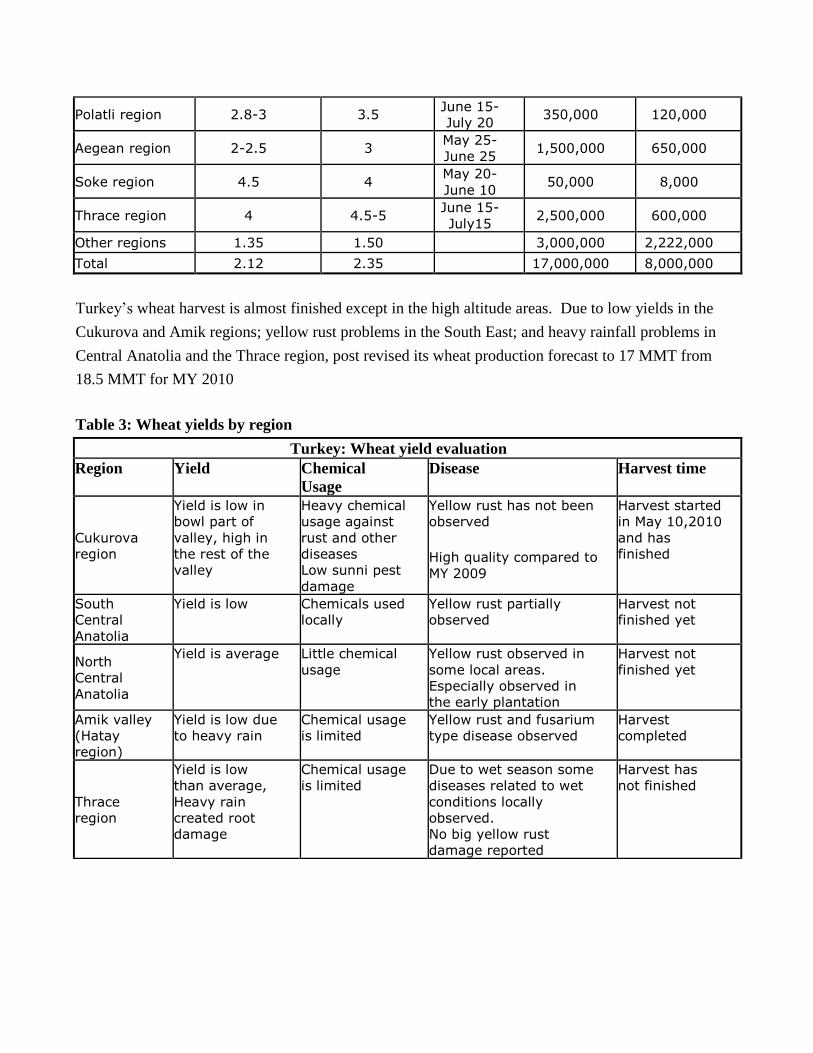
Table 3: Wheat yields by region
Turkey: Wheat yield evaluation
Region Yield Chemical
Usage Disease Harvest time
Cukurova
region
Yield is low in
bowl part of
valley, high in
the rest of the
valley
Heavy chemical
usage against
rust and other
diseases Low sunni pest
damage
Yellow rust has not been
observed High quality compared to
MY 2009
Harvest started
in May 10,2010
and has
finished
South
Central
Anatolia
Yield is low Chemicals used
locally Yellow rust partially
observed Harvest not
finished yet
North
Central
Anatolia
Yield is average Little chemical
usage Yellow rust observed in
some local areas.
Especially observed in
the early plantation
Harvest not
finished yet
Amik valley
(Hatay
region)
Yield is low due
to heavy rain Chemical usage
is limited Yellow rust and fusarium
type disease observed Harvest
completed
Thrace
region
Yield is low
than average,
Heavy rain
created root
damage
Chemical usage
is limited Due to wet season some
diseases related to wet
conditions locally
observed. No big yellow rust
damage reported
Harvest has
not finished

South East
Anatolia
region
Yield is low Chemical usage
was very
limited
Yellow rust observed in
the Syria and Iraq
border. Less in the inner
part of South East
Anatolia (%20-25 lost is
expected)
Harvest
completed
There have been two ways to import wheat under the current import processing regime. The first way
is to show a certain amount of export commitment. For example, processed wheat exporters like flour
mills or pasta factories apply to the Undersecretary of Foreign Trade with commitments to export a
certain amount of their finished product and are granted a license to import a corresponding amount of
duty-free wheat. When these companies fulfill their export commitments their license is closed. The
second way is to export wheat first and then apply for an import license. Every year this program is
temporarily halted during the domestic harvest season (May 1-Septmber 15) in order to protect the
domestic market.
Due to the effects on the domestic wheat market and accusations of cheating under the inward process
licensing system, Agriculture Minister Eker announced changes to the system on June 1, 2010. In MY
2010, under the new system, wheat cannot be imported under this regime until after companies have
already exported their product. This will be in effect until May 1, 2011.
TMO has 1.5 MMT of low and medium quality wheat stocks from MY 2009 and will sell these stocks
to domestic processors at low prices. It is expected that Turkey will import 1 MMT of high quality
wheat. There will be 2 MMT of wheat imports under the inward process regime in MY 2010. Turkey is
expected to import a total of 3 MMT of wheat in MY 2010.
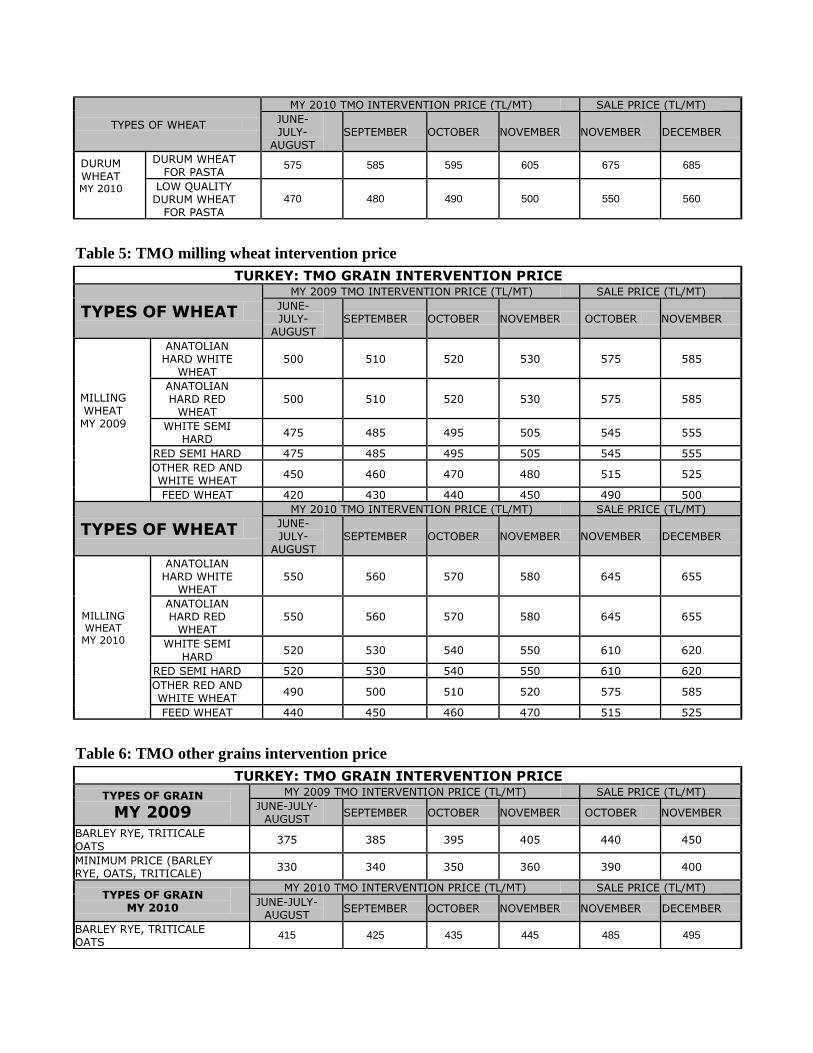
Turkish Grain Board announced hard red wheat intervention price at 550 TL/MT in MY 2010 which
was 500 TL/MT in MY 2009. Wheat premium is increased to 50 TL/MT in MY 2010 from 45 TL/MT
in MY 2009.
Turkish Grain Board is not very active in MY 2010 wheat market unlike MY 2009. Wheat price is high
in the market for this reason farmers prefer to sell it to the traders instead of TMO.
Table 4: TMO durum wheat intervention price
TURKEY: TMO GRAIN INTERVENTION PRICE
TYPES OF WHEAT
MY 2009 TMO INTERVENTION PRICE (TL/MT) SALE PRICE (TL/MT) JUNE-JULY-
AUGUST SEPTEMBER OCTOBER NOVEMBER OCTOBER NOVEMBER
DURUM WHEAT MY 2009
DURUM WHEAT FOR PASTA 525 535 545 555 600 610
LOW QUALITY DURUM WHEAT
FOR PASTA 450 460 470 480 515 525
TYPES OF WHEAT
MY 2010 TMO INTERVENTION PRICE (TL/MT) SALE PRICE (TL/MT) JUNE-JULY-
AUGUST SEPTEMBER OCTOBER NOVEMBER NOVEMBER DECEMBER
DURUM WHEAT MY 2010
DURUM WHEAT FOR PASTA 575 585 595 605 675 685
LOW QUALITY DURUM WHEAT
FOR PASTA 470 480 490 500 550 560
Table 5: TMO milling wheat intervention price
TURKEY: TMO GRAIN INTERVENTION PRICE
TYPES OF WHEAT
MY 2009 TMO INTERVENTION PRICE (TL/MT) SALE PRICE (TL/MT) JUNE-JULY-
AUGUST SEPTEMBER OCTOBER NOVEMBER OCTOBER NOVEMBER
MILLING WHEAT MY 2009
ANATOLIAN HARD WHITE
WHEAT 500 510 520 530 575 585
ANATOLIAN HARD RED
WHEAT 500 510 520 530 575 585
WHITE SEMI HARD 475 485 495 505 545 555
RED SEMI HARD 475 485 495 505 545 555 OTHER RED AND WHITE WHEAT 450 460 470 480 515 525
FEED WHEAT 420 430 440 450 490 500
TYPES OF WHEAT
MY 2010 TMO INTERVENTION PRICE (TL/MT) SALE PRICE (TL/MT) JUNE-JULY-
AUGUST SEPTEMBER OCTOBER NOVEMBER NOVEMBER DECEMBER
MILLING WHEAT MY 2010
ANATOLIAN HARD WHITE
WHEAT 550 560 570 580 645 655
ANATOLIAN HARD RED
WHEAT 550 560 570 580 645 655
WHITE SEMI
HARD 520 530 540 550 610 620
RED SEMI HARD 520 530 540 550 610 620 OTHER RED AND WHITE WHEAT 490 500 510 520 575 585
FEED WHEAT 440 450 460 470 515 525
Table 6: TMO other grains intervention price
TURKEY: TMO GRAIN INTERVENTION PRICE TYPES OF GRAIN
MY 2009
MY 2009 TMO INTERVENTION PRICE (TL/MT) SALE PRICE (TL/MT) JUNE-JULY-
AUGUST SEPTEMBER OCTOBER NOVEMBER OCTOBER NOVEMBER
BARLEY RYE, TRITICALE
OATS 375 385 395 405 440 450
MINIMUM PRICE (BARLEY RYE, OATS, TRITICALE) 330 340 350 360 390 400
TYPES OF GRAIN MY 2010
MY 2010 TMO INTERVENTION PRICE (TL/MT) SALE PRICE (TL/MT) JUNE-JULY-
AUGUST SEPTEMBER OCTOBER NOVEMBER NOVEMBER DECEMBER
BARLEY RYE, TRITICALE OATS 415 425 435 445 485 495
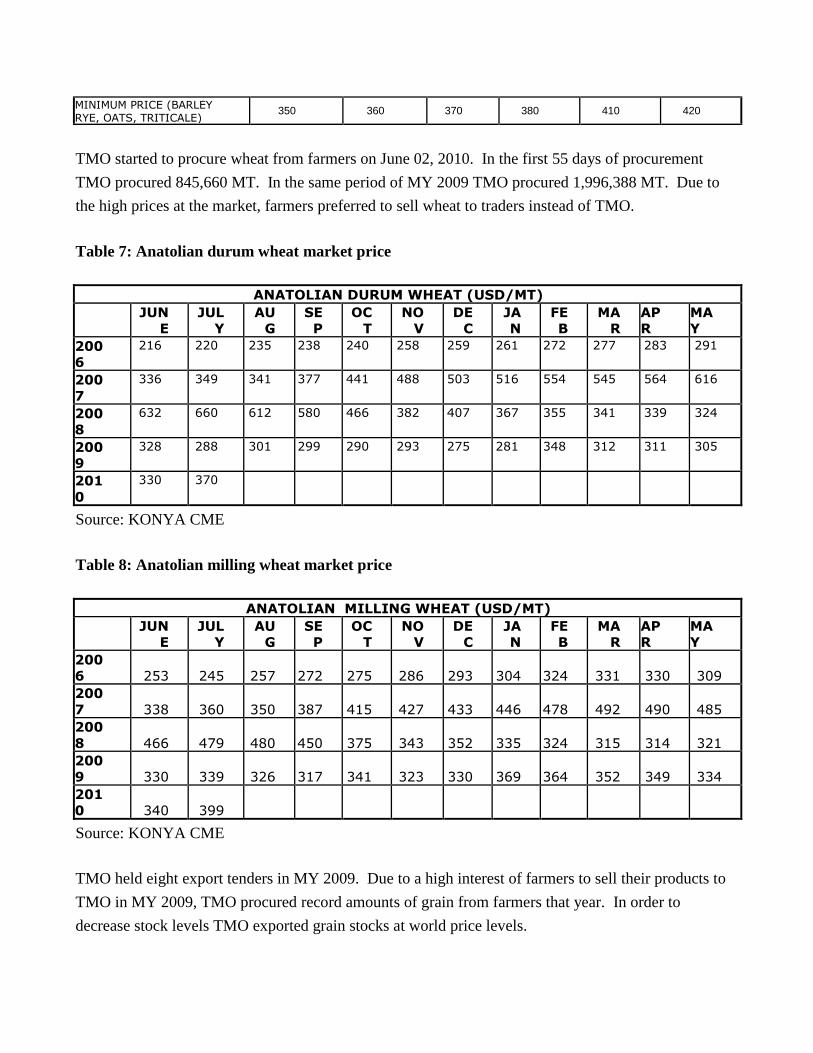
MINIMUM PRICE (BARLEY RYE, OATS, TRITICALE) 350 360 370 380 410 420
TMO started to procure wheat from farmers on June 02, 2010. In the first 55 days of procurement
TMO procured 845,660 MT. In the same period of MY 2009 TMO procured 1,996,388 MT. Due to
the high prices at the market, farmers preferred to sell wheat to traders instead of TMO.
Table 7: Anatolian durum wheat market price
ANATOLIAN DURUM WHEAT (USD/MT)
JUN
E JUL
Y AU
G SE
P OC
T NO
V DE
C JA
N FE
B MA
R AP
R MA
Y 200
6 216 220 235 238 240 258 259 261 272 277 283 291
200
7 336 349 341 377 441 488 503 516 554 545 564 616
200
8 632 660 612 580 466 382 407 367 355 341 339 324
200
9 328 288 301 299 290 293 275 281 348 312 311 305
201
0 330 370
Source: KONYA CME
Table 8: Anatolian milling wheat market price
ANATOLIAN MILLING WHEAT (USD/MT)
JUN
E JUL
Y AU
G SE
P OC
T NO
V DE
C JA
N FE
B MA
R AP
R MA
Y 200
6 253 245 257 272 275 286 293 304 324 331 330 309 200
7 338 360 350 387 415 427 433 446 478 492 490 485 200
8 466 479 480 450 375 343 352 335 324 315 314 321 200
9 330 339 326 317 341 323 330 369 364 352 349 334 201
0 340 399
Source: KONYA CME
TMO held eight export tenders in MY 2009. Due to a high interest of farmers to sell their products to
TMO in MY 2009, TMO procured record amounts of grain from farmers that year. In order to
decrease stock levels TMO exported grain stocks at world price levels.

Table 9: TMO export tender results in MY 2009
TMO export tender results in MY 2009 Products Red Milling Wheat White Milling Wheat Durum Wheat White feed barley
Date of Tender
Quantity (MT)
Average price
($ US/ MT)
Quantity (MT)
Average price
($ US/ MT)
Quantity (MT)
Average price
($ US/ MT)
Quantity (MT)
Average price
($ US/MT)
04.20.2010 20,000 173 50,000 162.83 5,000 215.13 45,000 151.50 03.30.2010 25,000 161.51 25,000 155.38 75,000 185.30 160,000 152.4 02.25.2010 150,000 154.90 - - 150,000 169.53 100,000 148.67 01.21.2010 125,000 161.17 75,000 166.40 50,000 183.97 125,000 146.91 12.17.2009 50,000 167.3 100,000 179.9 50,000 174.5 - - 11.12.2009 100,000 164 75,000 160 25,000 224 100,000 147 10.15.2009 25,000 135 25,000 163 25,000 255 100,000 140 09.10.2009 40,000 147 40,000 155 - - 155,000 124 Total/Average 515,000 155.87 340,000 163.33 375,000 198.66 740,000 143.16
Source: TMO
Corn
First and second crop plantation has finished in Turkey. The first harvest will start on August 15 and if
weather conditions are favorable, total corn production is forecasted to reach 4 MMT in MY 2010.
First crop planting in the Cukurova region, beginning in the end of February and ending in April 2010,
and was one month late due to heavy rainfall. Second crop corn planting ended in June 2010. First
crop plantation area in the region remained the same as MY 2009 but second crop planting area
decreased because farmers in the Karatas and Ceyhan regions planted cotton, sesame seed and soybean
instead of second crop corn. The Cukurova first crop corn harvest will begin around August 15 and
yields are expected to reach 13 MT/ha. No disease was observed in the early part of the season later on
first crop corn saw fusarium type of disease outbreaks. For second crop corn, planting area increased in
the Kozan and Imamoglu areas of the Cukurova region.
In the South East, first crop corn area increased in the Diyarbakir region. Harvesting will start at the end
of August. Plant size and development is very good. Second crop planting area in Sanliurfa decreased
10%, however because of improved farming techniques and high quality seed usage, corn production
from Southeast of Turkey will be the same in MY 2010 as MY 2009.
The Konya region entered as a new area for corn production particularly in irrigated lands. The Sakarya
and Samsun regions saw continued high levels of corn plantation in MY 2010 and corn area increased
in the Aydin region.
Corn yield increases in the past 5 years were significant. First crop corn average yield increased from
7.50 MT/ha in 2004 to 13 MT/ha in MY 2009, mainly due to high quality hybrid seed use. Previously,
first crop corn yields were 1.1 MT-1.4 MT/ha and second crop corn yields were 6.5 MT-9 MT/ha.
The planted and harvested corn area of Turkey seemed to decrease in our report, however this was a
result of adjustments to reflect yield increases, which resulted in us readjusting planted area estimates
downward.
In MY 2011 and my 2012, corn plantation is forecasted to increase dramatically due to large irrigation
projects in the GAP, Konya and Cukurova regions. High government subsidies for cotton production
are the only factor that may bring down expected corn plantation in MY 2011 and MY 2012.
Barley
2009 Barley production is estimated at 6.5 MMT. The barley harvest has almost finished in Turkey,
and production is forecasted at 5.9 MMT in 2010. Central Anatolia has seen a 10% lower yield in MY
2010 compared to MY 2009. Production suffered due to heavy rain in some regions and high
temperatures in others. Overall barley production is slightly lower this year than MY 2009.
Barley production in South East Turkey decreased 10-15% in MY 2010. Rust problems, early freezing
and high temperatures later on damaged yields.
The Gaziantep region saw high yields compared to other parts of Southeast Turkey. The average yield
was around 4MT/ha. The barley harvest in the Kahramanmaras region was also close to the recent
average levels, at 3.5 MT/ha. Sanliurfa, Mardin, and Diyarbakir lost 10% of barley output due to bad
weather conditions and rust problems.
In Central Anatolia, the Yozgat, Corum and Konya region has seen lower yields than in MY 2010
compared to MY 2009. Both yields and quality went down in MY 2010. Both rust and mouse damage
were observed in central Anatolia. Yields in the Konya region were 3 MT-4 MT ha in MY 2009 and
just 2 MT-3 T in MY 2010. The decrease was due to a lack of rain in April and heavy rainfall in June.
Barley production in MY 2009 was higher than the long term average. In MY 2010, Barley production
is lower than MY 2009 but still slightly higher than the long term average level.
The harvest has not yet finished in the Sivas and Kayseri region, but yields are reportedly close to the
long term average.
Rice
Rice planting started in the middle of May 2010 and finished by the end of the same month. The MY
2010 plantation area increased 10% due to favorable weather conditions and increased water levels in
several dams. Paddy rice production is forecasted at 750,000 MT in MY 2010. Milled rice production
is forecasted at 450,000 MT in MY 2010. Rice yield will depend on rainfall at the end of August and
early September. In MY 2009 the Gonen region lost some of its Baldo variety production but in MY
2010 production levels are expected to return to around long term average levels.
The major rice producing provinces are Edirne, Samsun, Balikesir, Canakkale, Corum, Cankiri,
Kastamonu, Sinop and Adana and the most productive region is Thrace, which contains 10-15% of
Turkey’s total rice plantation area. The average yield in Thrace is 8 MT/ha. Harvesting will start at the
end of September.
Rice blast and zinc deficiency problems were observed in Edirne, Tekirdag and Samsun. MARA
banned aerial agricultural chemical spraying in 2004, however because of severe problems the Ministry
allowed spraying in Thrace in July 2010.
Lentils and Pulses
The Turkish MY 2010 lentil harvest finished at the end of June. Lentil production will be higher than
MY 2009 and MY 2008 but lower than MY 2007. The most important factor determining the amount
of lentils harvested is April and May rainfall. Lentil production in MY 2009 is estimated at 280,000
MT. Because of high level of rainfall in April and May, lentil production is forecasted at 510,000 MT
for MY 2010.
Red lentil planting replaced barley planting in the Siverek, Viransehir and Nusaybin regions however
planting of red lentils in the Diyarbakir and Urfa regions did not change in MY 2010 compared to MY
2009. The average yield in the south east region is 1.4 MT/ha.
Although U.S. traders have not made significant inroads into the Turkish market for green lentils, this is
an area of potential for U.S. exporters.
The Chickpea harvest was lower than expected, showing yields 40% lower than MY 2009. Therefore,
this is another area of potential increased sales for U.S. exporters.
TRADE
Wheat
Russia, Kazakhstan, Ukraine and Lithuania are the main high protein wheat suppliers. Turkey usually
blends domestic wheat with high protein imported wheat to produce its wheat flour. In order to compete
in international trade Turkey has an inward process regime. Wheat flour producers can import low and
medium quality wheat for noodle type wheat flour from Russia, Kazakhstan at a very low price such as
170 USD/MT duty free and process it in Turkey.
In May 2010, Russia exported 198,740 MT, Kazakhstan exported 14,448 MT and Spain exported 7,384
MT (durum wheat) of wheat to Turkey. Russia’s share of the Turkish wheat import market is usually

65% to 85%. The total wheat import estimate is 2.92 MMT.
The Turkish Grain Board (TMO) continued to export wheat and barley in February, March, April and
May 2010. Turkey mainly exported wheat to Italy, Egypt, Israel and Tunisia but not to Syria and
Bangladesh in March 2010. Post revised its wheat export estimates to 1.32 MMT. TMO stopped export
tenders in May in order to prepare silos for the new harvest and mainly exported low quality wheat. In
MY 2010, TMO will continue to export low quality wheat.
Table 10: Turkish wheat foreign trade
TURKEY: WHEAT FOREIGN TRADE
MONTH IMPORT MY
2008 (MT)
IMPORT MY
2009 (MT)
EXPORT MY
2008 (MT) EXPORT MY
2009 (MT)
June 224,741 172,901 0 10 July 131,565 95,529 0 29,165 August 251,868 284,780 1,900 13,178 September 375,753 267,215 0 3,243 October 415,633 409,340 4,031 12,277 November 266,728 229,368 2,072 56,400 December 299,517 289,393 1 187,113 January 236,786 187,218 20 92,242 February 346,488 130,891 16 201,902 March 392,171 375,045 61 192,393 April 357,526 252,511 21 326,908 May 307,080 225,663 0 211,029 MY TOTAL 3,605,856 2,919,854 8,122 1,325,862
Turkey imported 125,320 MT of wheat in June, 2010. Its main suppliers were Russia (92,207 MT), and
Kazakhstan (25,727 MT) in June 2010. Turkey exported 109,655 MT of wheat in June 2010. The main
export markets for Turkish wheat were Yemen (30,081 MT), Italy (25,950 MT) and Egypt (20,415 MT)
in June 2010.
Hungary and Lithuania lost most of their shares in the Turkish wheat market and Spain gained a large
portion in May 2010 with exports of durum wheat. Russia and Kazakhstan kept their strong position in
the market in MY 2009.
Table 11: Major wheat supplier of Turkey
Turkey: Quantity of wheat imported
Countries MY 2007 (MT) MY 2008 (MT) MY 2009 (MT)
Russia 886,393 2,003,918 2,181,265
Kazakhstan 1,032,444 219,298 431,906
Ukraine 59,828 154,432 108,802
Hungary 142,248 143,951 18,458
Moldova 446 55,399 40,049
U.S. 45,537 46,821 0
Others 360,875 985,522 139,375
Total 2,527,771 3,609,341 2,919,855
Wheat export to Bangladesh jumped in February, March and April 2010 and reached to 190,135 MT in
the last six months starting from October, 2009. TMO export strategy increased wheat exports in MY
2009. In May, 2010, Major wheat export markets were Egypt (70,780), Italy (52,334 MT) and Israel
(35,400 MT).
Table 12: Major Turkish wheat export markets
Turkey: Quantity of wheat exported
Country MY 2007 (MT) MY 2008 (MT) MY 2009 (MT)
Syria 0 0 325,122 Italy 9,326 0 225,366 Egypt 0 0 145,034 Lebanon 0 0 38,967 Iraq 235 0 1,941 Georgia 0 3,108 0 Switzerland 3 4,424 2 Others 8,717 591 589,428 Total 18,281 8,123 1,325,860
Due to the lack of high quality domestic wheat production and continued demand from Turkish wheat
flour and pasta exporters, Turkey will need to import high quality wheat. The Black Sea wheat import
price increased 20% in MY 2010 and the Russian 14.5% protein wheat price was up 240% and 13.5%
protein wheat price reached $210 in July 2010. Due to the fact that additional GSM-102 credit program
funds were announced early in August, U.S. wheat can be competitive in the Turkish wheat market in
MY 2010.
Wheat Flour
Turkey was able to export wheat flour to the Philippines, Indonesia and other asian countries at a low
price due to low freight costs on ships bringing products to the region. In addition, wheat flour
consumed in Asian countries goes primarily towards noodle production, which can be produced from
cheaper, lower quality flour. Turkey can import low quality wheat from Russia for 130$/MT with no
import duty, and process it into wheat flour for export at 240 US$/MT. For the high quality wheat
demanded by market such as Iraq, Turkey imports 14-15% protein wheat from Russia duty
free, processes it and exports wheat flour for 350 US$/MT .
Indonesia and Philippines filed anti-dumping investigations against Turkish wheat flour exports,
however Turkey negotiated agreements with both countries before the final determinations were made.
In May 2010, wheat flour exports were 153,476 MT. Major export markets were Iraq (64,700 MT in
April 2010 and 72,274 MT in May 2010), Indonesia (27,115 MT in April 2010 and 31,376 MT in May
2010) and Philippines (3,305 MT in April 2010 and 7,922 MT in May 2010)
In June 2010 Turkey exported 164,782 MT of wheat flour. The main markets were Iraq (93,998 MT),
Indonesia (35,519 MT) and the Philippines (4,788 MT).
Table 13: Quantity of Turkish wheat flour exports
Turkey: Quantity of wheat flour exports MONTH MY 2007 (MT) MY 2008 (MT) MY 2009 (MT)
June 75,630 102,002 176,736 July 131,013 107,338 167,952 August 118,713 130,138 140,478 September 92,422 138,073 154,753 October 61,629 151,091 194,313 November 66,435 86,329 126,878 December 95,015 82,984 175,064 January 111,714 91,302 131,747 February 92,919 109,721 145,332 March 75,298 141,706 138,893 April 60,276 186,165 166,304 May 73,775 141,185 153,476 MY TOTAL 1,054,839 1,468,034 1,871,926
*forecast
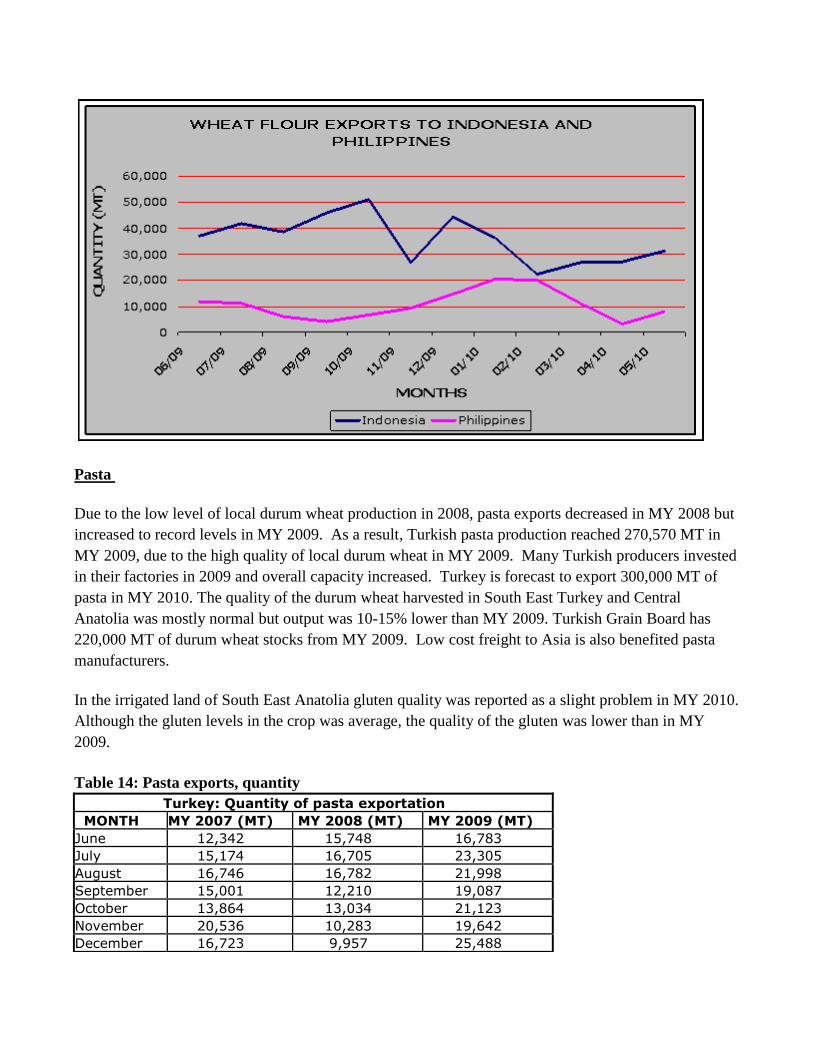
Dumping claims of the Philippines and Indonesia resulted in trade disruptions for Turkish wheat flour
exports to Philippines and Indonesia. Wheat flour exports to Philippines were 20,105 MT in February
2010; 11,113 MT in March 2010; and 3,305 MT in April 2010. After an agreement was reached,
exports started to return to normal and eventually reached to 7,922 MT in May 2010. Indonesia began
instituting antidumping penalties against Turkish flour on November 17, 2008 and a similar pattern was
observed. Wheat flour exports to Indonesia were 51,050 MT in October 2009; 22,492 MT in February
2010; and started to increase again in May, reaching 31,376 MT.
Figure 1: Wheat flour exports to Indonesia and Philippines by Turkey
Pasta
Due to the low level of local durum wheat production in 2008, pasta exports decreased in MY 2008 but
increased to record levels in MY 2009. As a result, Turkish pasta production reached 270,570 MT in
MY 2009, due to the high quality of local durum wheat in MY 2009. Many Turkish producers invested
in their factories in 2009 and overall capacity increased. Turkey is forecast to export 300,000 MT of
pasta in MY 2010. The quality of the durum wheat harvested in South East Turkey and Central
Anatolia was mostly normal but output was 10-15% lower than MY 2009. Turkish Grain Board has
220,000 MT of durum wheat stocks from MY 2009. Low cost freight to Asia is also benefited pasta
manufacturers.
In the irrigated land of South East Anatolia gluten quality was reported as a slight problem in MY 2010.
Although the gluten levels in the crop was average, the quality of the gluten was lower than in MY
2009.
Table 14: Pasta exports, quantity
Turkey: Quantity of pasta exportation MONTH MY 2007 (MT) MY 2008 (MT) MY 2009 (MT)
June 12,342 15,748 16,783 July 15,174 16,705 23,305 August 16,746 16,782 21,998 September 15,001 12,210 19,087 October 13,864 13,034 21,123 November 20,536 10,283 19,642 December 16,723 9,957 25,488
January 15,257 12,180 25,168 February 16,279 10,492 21,377 March 16,602 15,048 26,664 April 14,883 13,196 25,353 May 17,877 15,283 24,582 MY TOTAL 191,285 160,918 270,570
Iraq, Angola, Togo and Benin are the main markets for Turkish pasta exports. Exports to those
countries increase in 2009, most significantly to Togo. The Japanese market is very important to
Turkish pasta producers, not only because of the value of exports but also because they consider this the
most prestigious export market. In June 2010, Turkey exported 21,118 MT of pasta. The main market
for Turkey are Iraq (2,320 MT), Togo (1,766 MT) and Japan (1,663 MT).
Table 15 : Major Turkish pasta export markets
Turkey: Quantity of pasta exported by Turkey
Countries MY 2007 (MT) MY 2008 (MT) MY 2009 (MT) Iraq 16,153 13,437 24,784 Togo 12,838 8,941 21,328 Angola 2,157 7,088 17,000 Benin 11,766 4,370 19,533 Japan 3,598 10,260 14,170 Others 145,061 116,822 173,755 Total 191,429 160,918 270,570
Table 16 : Turkish pasta foreign trade
Turkey: Pasta Foreign Trade Data YEAR IMPORTS (MT) IMPORTS ($) EXPORTS (MT) EXPORTS ($)
MY 2006 1,106 2,830,022 176,808 83,317,095 MY 2007 1,345 3,643,850 191,285 155,178,315 MY 2008 1,520 4,149,741 160,918 149,970,388 MY 2009 1,941 5,107,073 270,570 175,682,310
Semolina
Semolina exports followed the same pattern as pasta exports in MY 2009. Due to the low level of
production in MY 2008, semolina exports dropped to 45,676 in MY 2008 but reached 96,694 MT in
MY 2009.
Table 17: Quantity of semolina exportation
Turkey: Quantity of semolina exportation MONTH MY 2007 (MT) MY 2008 (MT) MY 2009 (MT)
June 3,874 5,788 4,931 July 3,583 7,835 7,368 August 4,139 3,843 6,022
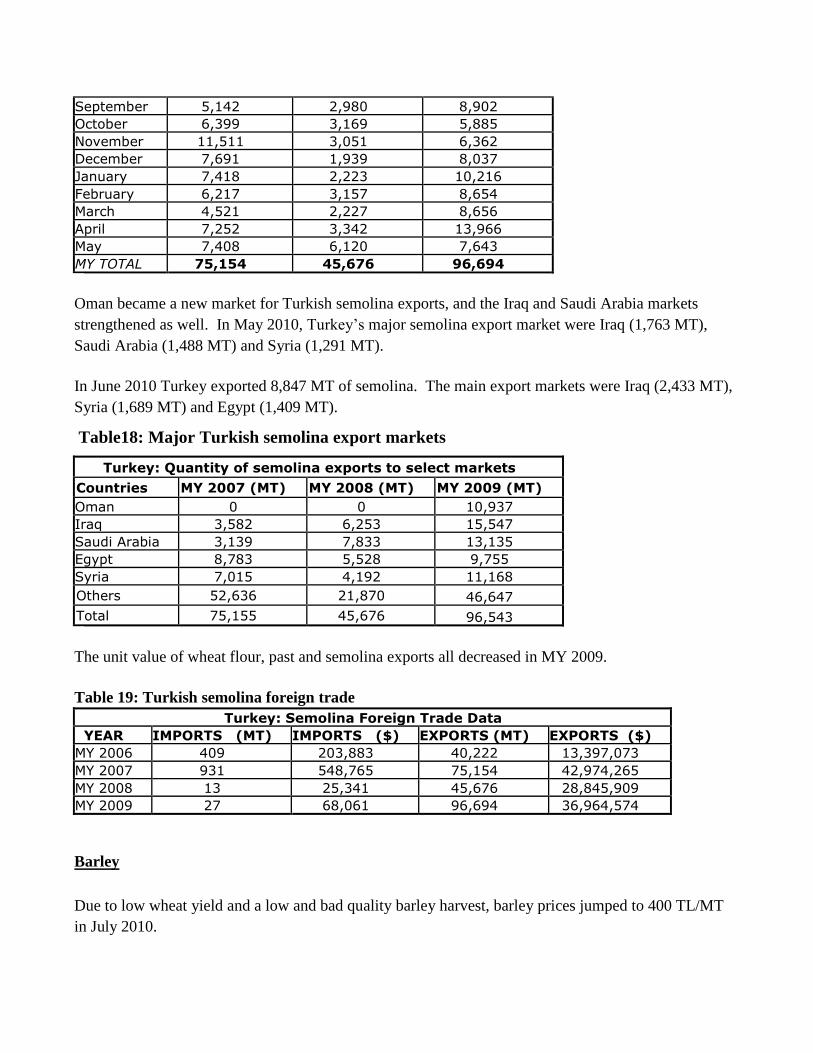
September 5,142 2,980 8,902 October 6,399 3,169 5,885 November 11,511 3,051 6,362 December 7,691 1,939 8,037 January 7,418 2,223 10,216 February 6,217 3,157 8,654 March 4,521 2,227 8,656 April 7,252 3,342 13,966 May 7,408 6,120 7,643 MY TOTAL 75,154 45,676 96,694
Oman became a new market for Turkish semolina exports, and the Iraq and Saudi Arabia markets
strengthened as well. In May 2010, Turkey’s major semolina export market were Iraq (1,763 MT),
Saudi Arabia (1,488 MT) and Syria (1,291 MT).
In June 2010 Turkey exported 8,847 MT of semolina. The main export markets were Iraq (2,433 MT),
Syria (1,689 MT) and Egypt (1,409 MT).
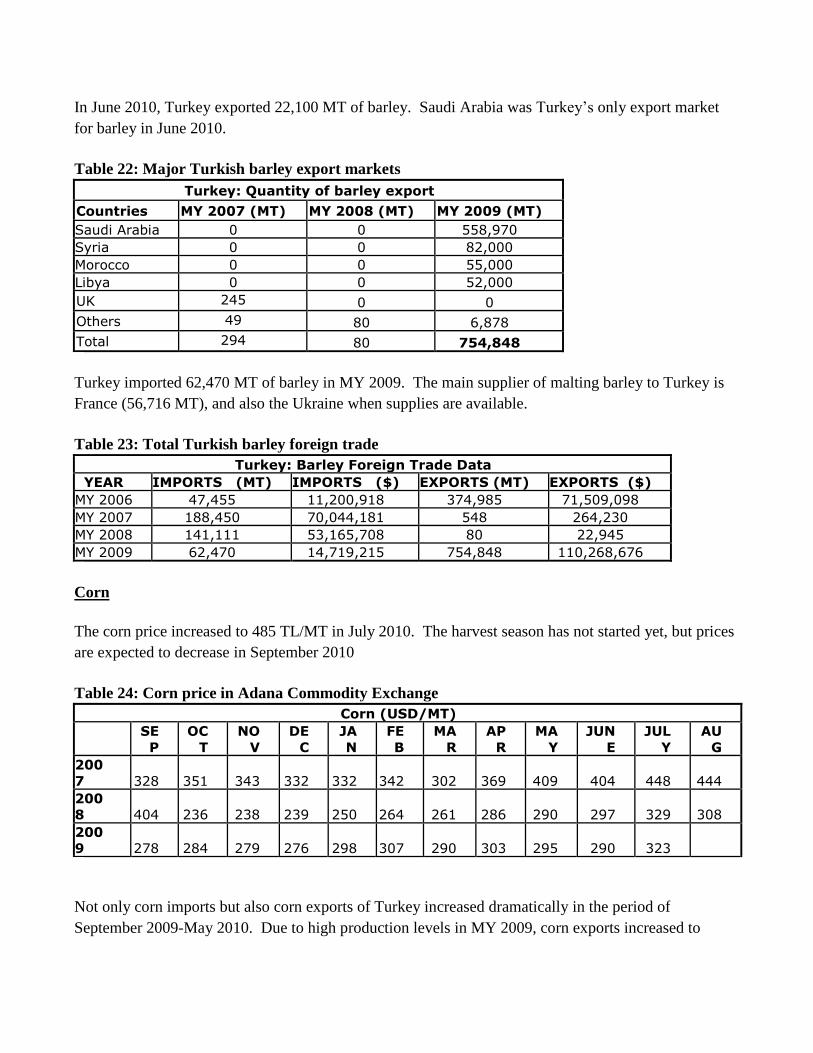
Table18: Major Turkish semolina export markets
Turkey: Quantity of semolina exports to select markets
Countries MY 2007 (MT) MY 2008 (MT) MY 2009 (MT) Oman 0 0 10,937 Iraq 3,582 6,253 15,547 Saudi Arabia 3,139 7,833 13,135 Egypt 8,783 5,528 9,755 Syria 7,015 4,192 11,168 Others 52,636 21,870 46,647 Total 75,155 45,676 96,543
The unit value of wheat flour, past and semolina exports all decreased in MY 2009.
Table 19: Turkish semolina foreign trade
Turkey: Semolina Foreign Trade Data YEAR IMPORTS (MT) IMPORTS ($) EXPORTS (MT) EXPORTS ($)
MY 2006 409 203,883 40,222 13,397,073 MY 2007 931 548,765 75,154 42,974,265 MY 2008 13 25,341 45,676 28,845,909 MY 2009 27 68,061 96,694 36,964,574
Barley
Due to low wheat yield and a low and bad quality barley harvest, barley prices jumped to 400 TL/MT
in July 2010.

Table 20: Barley price in Konya Commodity Exchange
Barley (USD/MT)
JUN
E JUL
Y AU
G SE
P OC
T NO
V DE
C JA
N FE
B MA
R AP
R MA
Y 200
7 287 310 302 342 381 407 410 397 400 369 375 428 200
8 417 427 434 396 327 302 310 301 288 270 268 270 200
9 217 220 225 234 245 230 225 236 236 231 236 229 201
0 232 266
Due to high yields and high stocks at TMO, Turkey exported 754,848 MT of barley in MY
2009. Barley exports will continue in MY 2010 but will be less than MY 2009.
Table 21: Turkish barley trade
TURKEY: BARLEY FOREIGN TRADE
MONTH IMPORT MY
2008 (MT)
IMPORT MY
2009 (MT)
EXPORT MY
2008 (MT) EXPORT MY
2009 (MT)
June 1,018 3,000 0 1,441 July 0 2,765 0 0 August 10,369 0 0 980 September 7,083 4,234 0 0.3 October 38,917 40 0.3 108,930 November 13,052 6,080 0 84,270 December 9,718 14,577 0 105,601 January 33,868 8,002 0 51,700 February 0 0 80 15,783 March 8,134 13,255 0 136,491 April 11,421 10,517 0 128,235 May 7,531 0 0 121,415 MY TOTAL 141,111 62,470 80.3 754,848
*forecast
Turkey traditionally exports barley to Middle Eastern countries. Due to two years of drought, Turkey
didn’t export much barley in MY 2007 and MY 2008. After a bumper crop in MY 2009 led to high
stocks, TMO opened seven tenders for grain exports between October 2009 and April 2010 and
exported 740,000 MT of barley. TMO held the latest grain export tenders on April 20, 2010. The
average price of barley at TMO’s seven tenders was 143.16 $US/MT. Total TMO barley exports
reached 740,000 MT and TMO still has 556,076 MT of barley stocks. Barley exports were negligible
in MY 2007 and MY 2008 reached 754,848 MT in MY 2009. Saudi Arabia (558,970 MT) was the
largest barley export market in MY 2009.
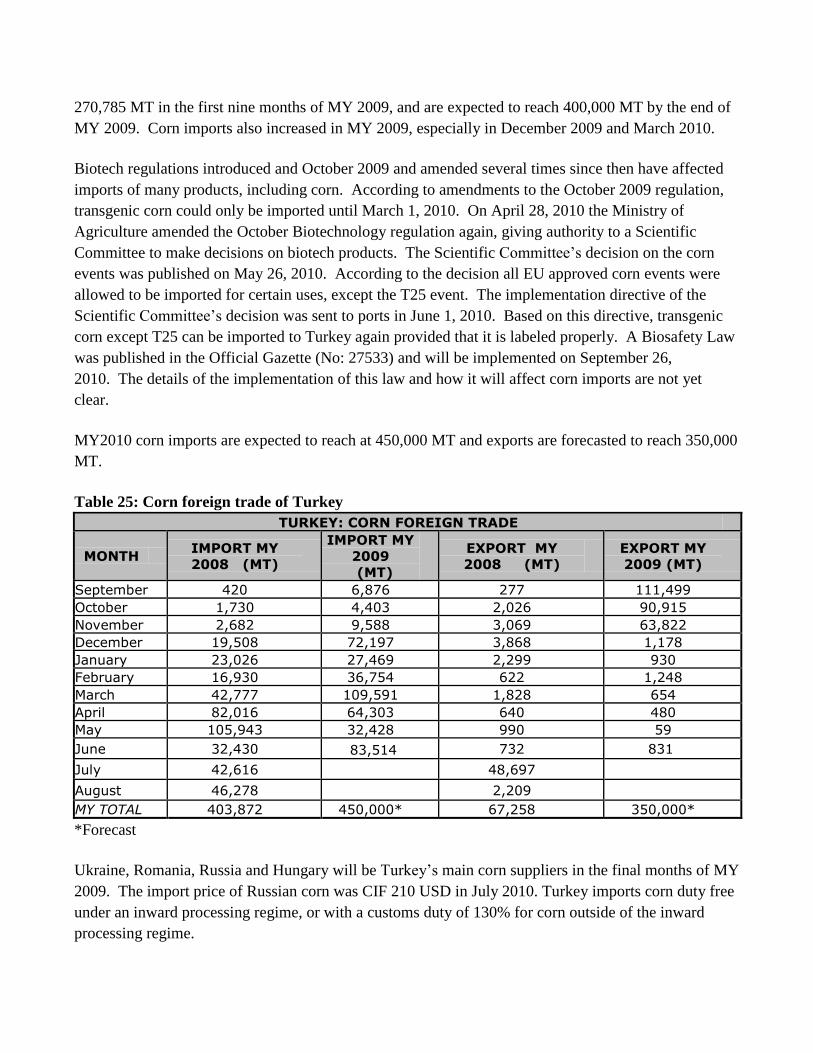
In June 2010, Turkey exported 22,100 MT of barley. Saudi Arabia was Turkey’s only export market
for barley in June 2010.
Table 22: Major Turkish barley export markets
Turkey: Quantity of barley export
Countries MY 2007 (MT) MY 2008 (MT) MY 2009 (MT) Saudi Arabia 0 0 558,970 Syria 0 0 82,000 Morocco 0 0 55,000 Libya 0 0 52,000 UK 245 0 0 Others 49 80 6,878 Total 294 80 754,848
Turkey imported 62,470 MT of barley in MY 2009. The main supplier of malting barley to Turkey is
France (56,716 MT), and also the Ukraine when supplies are available.
Table 23: Total Turkish barley foreign trade
Turkey: Barley Foreign Trade Data YEAR IMPORTS (MT) IMPORTS ($) EXPORTS (MT) EXPORTS ($)
MY 2006 47,455 11,200,918 374,985 71,509,098 MY 2007 188,450 70,044,181 548 264,230 MY 2008 141,111 53,165,708 80 22,945 MY 2009 62,470 14,719,215 754,848 110,268,676
Corn
The corn price increased to 485 TL/MT in July 2010. The harvest season has not started yet, but prices
are expected to decrease in September 2010
Table 24: Corn price in Adana Commodity Exchange
Corn (USD/MT)
SE
P OC
T NO
V DE
C JA
N FE
B MA
R AP
R MA
Y JUN
E JUL
Y AU
G 200
7 328 351 343 332 332 342 302 369 409 404 448 444 200
8 404 236 238 239 250 264 261 286 290 297 329 308 200
9 278 284 279 276 298 307 290 303 295 290 323
Not only corn imports but also corn exports of Turkey increased dramatically in the period of
September 2009-May 2010. Due to high production levels in MY 2009, corn exports increased to
270,785 MT in the first nine months of MY 2009, and are expected to reach 400,000 MT by the end of
MY 2009. Corn imports also increased in MY 2009, especially in December 2009 and March 2010.
Biotech regulations introduced and October 2009 and amended several times since then have affected
imports of many products, including corn. According to amendments to the October 2009 regulation,
transgenic corn could only be imported until March 1, 2010. On April 28, 2010 the Ministry of
Agriculture amended the October Biotechnology regulation again, giving authority to a Scientific
Committee to make decisions on biotech products. The Scientific Committee’s decision on the corn
events was published on May 26, 2010. According to the decision all EU approved corn events were
allowed to be imported for certain uses, except the T25 event. The implementation directive of the
Scientific Committee’s decision was sent to ports in June 1, 2010. Based on this directive, transgenic
corn except T25 can be imported to Turkey again provided that it is labeled properly. A Biosafety Law
was published in the Official Gazette (No: 27533) and will be implemented on September 26,
2010. The details of the implementation of this law and how it will affect corn imports are not yet
clear.
MY2010 corn imports are expected to reach at 450,000 MT and exports are forecasted to reach 350,000
MT.
Table 25: Corn foreign trade of Turkey
TURKEY: CORN FOREIGN TRADE
MONTH IMPORT MY
2008 (MT)
IMPORT MY
2009 (MT)
EXPORT MY
2008 (MT) EXPORT MY
2009 (MT)
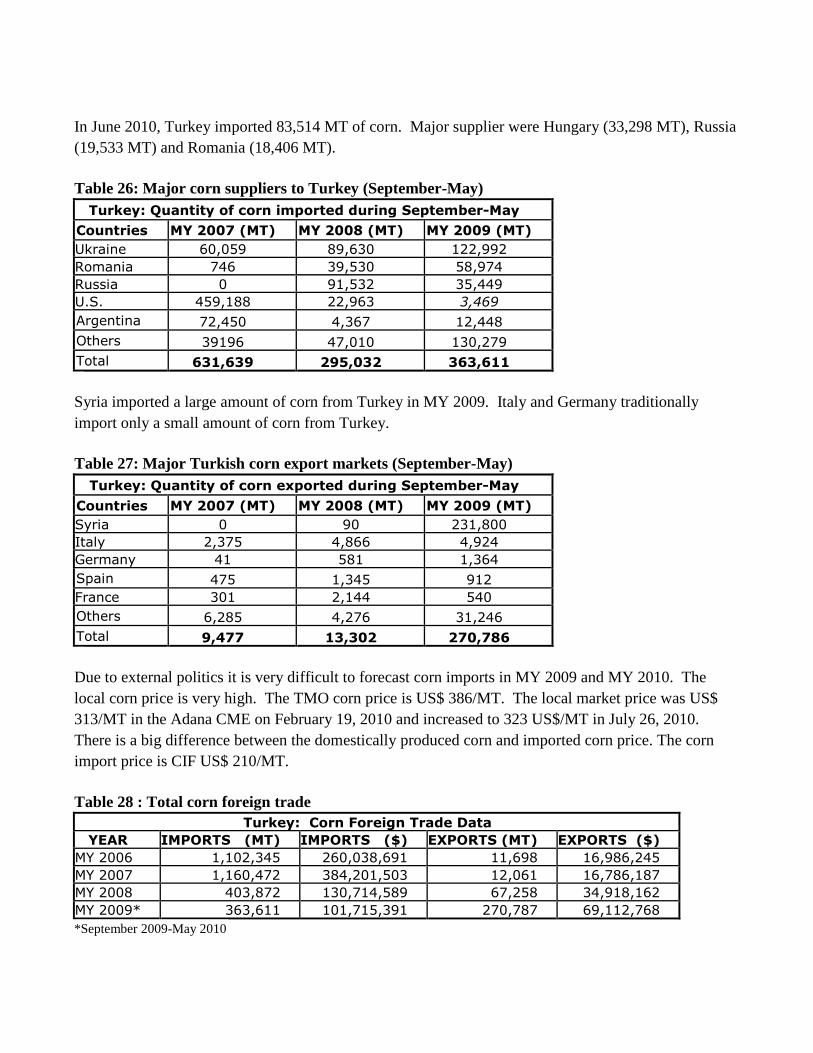
September 420 6,876 277 111,499 October 1,730 4,403 2,026 90,915 November 2,682 9,588 3,069 63,822 December 19,508 72,197 3,868 1,178 January 23,026 27,469 2,299 930 February 16,930 36,754 622 1,248 March 42,777 109,591 1,828 654 April 82,016 64,303 640 480 May 105,943 32,428 990 59 June 32,430 83,514 732 831
July 42,616 48,697
August 46,278 2,209 MY TOTAL 403,872 450,000* 67,258 350,000*
*Forecast
Ukraine, Romania, Russia and Hungary will be Turkey’s main corn suppliers in the final months of MY
2009. The import price of Russian corn was CIF 210 USD in July 2010. Turkey imports corn duty free
under an inward processing regime, or with a customs duty of 130% for corn outside of the inward
processing regime.
In June 2010, Turkey imported 83,514 MT of corn. Major supplier were Hungary (33,298 MT), Russia
(19,533 MT) and Romania (18,406 MT).
Table 26: Major corn suppliers to Turkey (September-May)
Turkey: Quantity of corn imported during September-May
Countries MY 2007 (MT) MY 2008 (MT) MY 2009 (MT) Ukraine 60,059 89,630 122,992 Romania 746 39,530 58,974 Russia 0 91,532 35,449 U.S. 459,188 22,963 3,469 Argentina 72,450 4,367 12,448 Others 39196 47,010 130,279 Total 631,639 295,032 363,611
Syria imported a large amount of corn from Turkey in MY 2009. Italy and Germany traditionally
import only a small amount of corn from Turkey.
Table 27: Major Turkish corn export markets (September-May)
Turkey: Quantity of corn exported during September-May
Countries MY 2007 (MT) MY 2008 (MT) MY 2009 (MT) Syria 0 90 231,800 Italy 2,375 4,866 4,924 Germany 41 581 1,364 Spain 475 1,345 912 France 301 2,144 540 Others 6,285 4,276 31,246 Total 9,477 13,302 270,786
Due to external politics it is very difficult to forecast corn imports in MY 2009 and MY 2010. The
local corn price is very high. The TMO corn price is US$ 386/MT. The local market price was US$
313/MT in the Adana CME on February 19, 2010 and increased to 323 US$/MT in July 26, 2010.
There is a big difference between the domestically produced corn and imported corn price. The corn
import price is CIF US$ 210/MT.
Table 28 : Total corn foreign trade
Turkey: Corn Foreign Trade Data YEAR IMPORTS (MT) IMPORTS ($) EXPORTS (MT) EXPORTS ($)
MY 2006 1,102,345 260,038,691 11,698 16,986,245 MY 2007 1,160,472 384,201,503 12,061 16,786,187 MY 2008 403,872 130,714,589 67,258 34,918,162 MY 2009* 363,611 101,715,391 270,787 69,112,768 *September 2009-May 2010
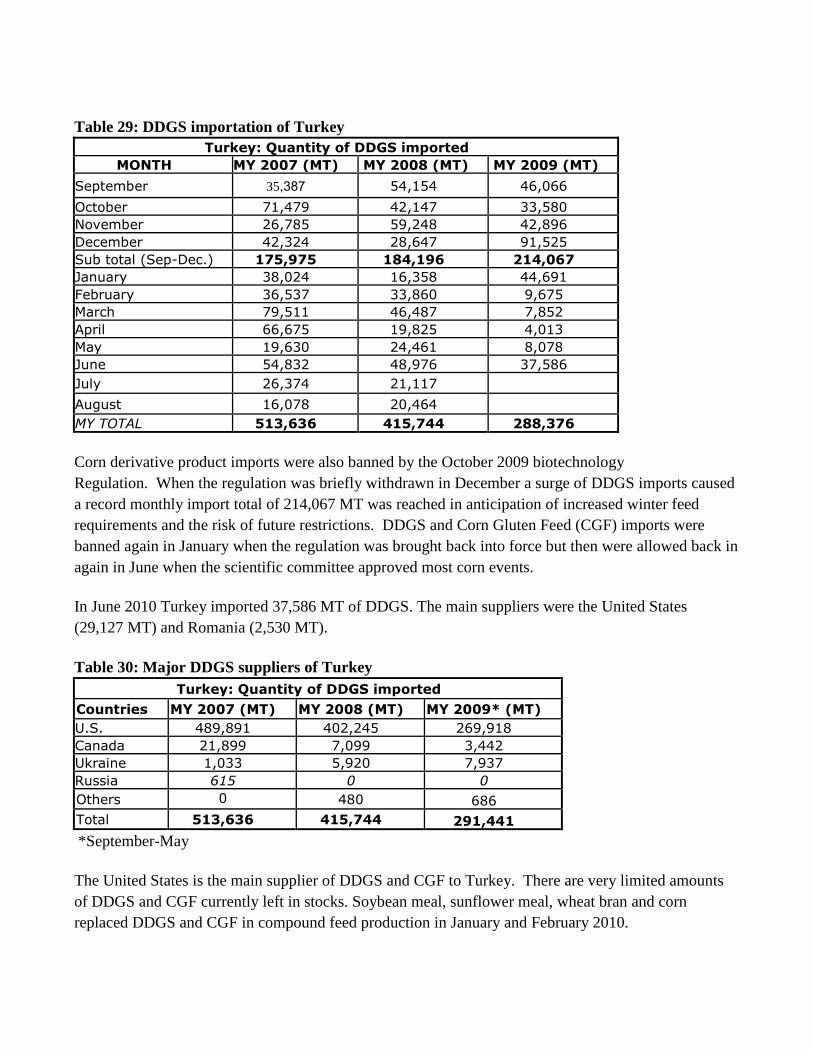
Table 29: DDGS importation of Turkey
Turkey: Quantity of DDGS imported MONTH MY 2007 (MT) MY 2008 (MT) MY 2009 (MT)
September 35,387 54,154 46,066
October 71,479 42,147 33,580 November 26,785 59,248 42,896 December 42,324 28,647 91,525 Sub total (Sep-Dec.) 175,975 184,196 214,067 January 38,024 16,358 44,691 February 36,537 33,860 9,675 March 79,511 46,487 7,852 April 66,675 19,825 4,013 May 19,630 24,461 8,078 June 54,832 48,976 37,586 July 26,374 21,117
August 16,078 20,464 MY TOTAL 513,636 415,744 288,376
Corn derivative product imports were also banned by the October 2009 biotechnology
Regulation. When the regulation was briefly withdrawn in December a surge of DDGS imports caused
a record monthly import total of 214,067 MT was reached in anticipation of increased winter feed
requirements and the risk of future restrictions. DDGS and Corn Gluten Feed (CGF) imports were
banned again in January when the regulation was brought back into force but then were allowed back in
again in June when the scientific committee approved most corn events.
In June 2010 Turkey imported 37,586 MT of DDGS. The main suppliers were the United States
(29,127 MT) and Romania (2,530 MT).
Table 30: Major DDGS suppliers of Turkey
Turkey: Quantity of DDGS imported
Countries MY 2007 (MT) MY 2008 (MT) MY 2009* (MT) U.S. 489,891 402,245 269,918 Canada 21,899 7,099 3,442 Ukraine 1,033 5,920 7,937 Russia 615 0 0 Others 0 480 686 Total 513,636 415,744 291,441
*September-May
The United States is the main supplier of DDGS and CGF to Turkey. There are very limited amounts
of DDGS and CGF currently left in stocks. Soybean meal, sunflower meal, wheat bran and corn
replaced DDGS and CGF in compound feed production in January and February 2010.
Sunflower oil and soybean crushers complain that not only meal but also oil prices have been
negatively affected by DDGS imports. These oilseed crushing companies have put pressure on the
Ministry of Agriculture and Rural Affairs (MARA) to block DDGS importation although it is clear that
Turkey needs to continue importing high protein feed ingredients. This is especially relevant if Turkey
is to bring down high meat prices. Red carcass meat prices jumped from 8 US$/kg in September 2009
to 12 US$/kg in July 2010.
On July 1, 2010 in response to pressure from domestic producer and crushers, MARA sent a new
directive to port ordering them to scrutinize imports of DDGS and run additional tests on all incoming
shipments for items like antibiotic residues. In addition, MARA and the Turkish Standards Institute are
now preparing a voluntary standard for DDGS which will likely become a mandatory standard and
seem to be an additional attempt to restrict DDGS and possibly also CGF imports. The draft is being
circulated for comment and it is expected to come into force soon due to extensive pressure from
oilseed crushers.
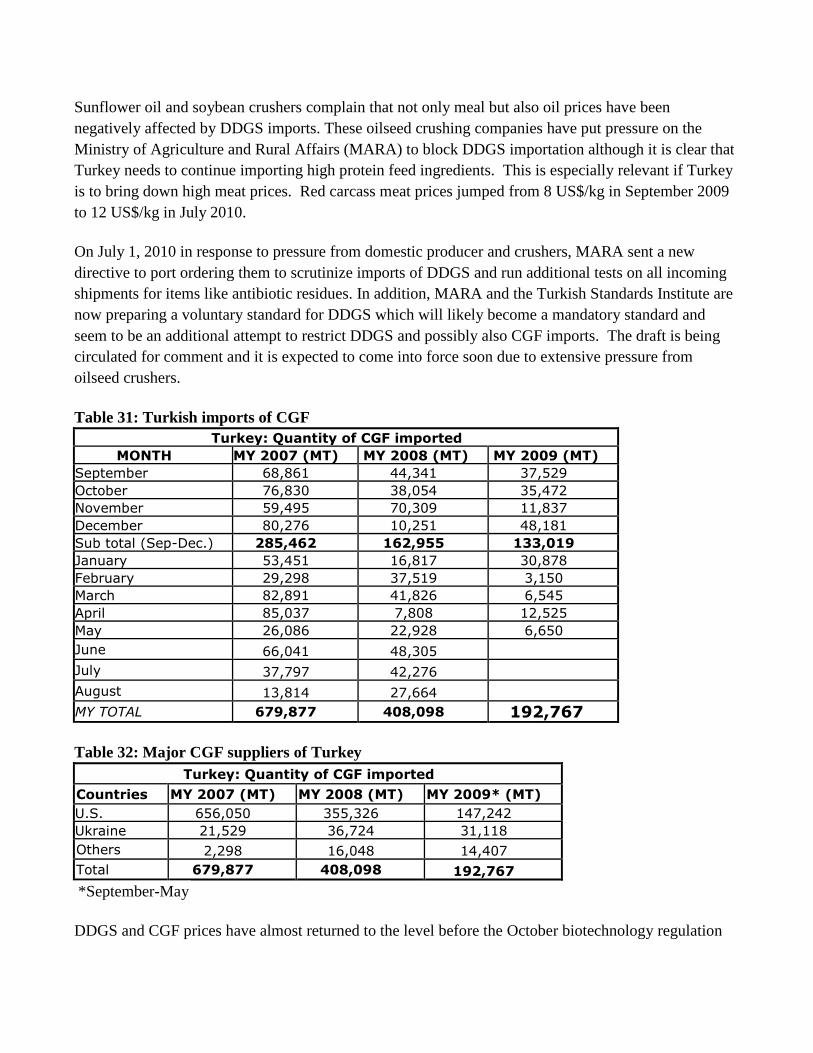
Table 31: Turkish imports of CGF
Turkey: Quantity of CGF imported MONTH MY 2007 (MT) MY 2008 (MT) MY 2009 (MT)
September 68,861 44,341 37,529 October 76,830 38,054 35,472 November 59,495 70,309 11,837 December 80,276 10,251 48,181 Sub total (Sep-Dec.) 285,462 162,955 133,019 January 53,451 16,817 30,878 February 29,298 37,519 3,150 March 82,891 41,826 6,545 April 85,037 7,808 12,525 May 26,086 22,928 6,650 June 66,041 48,305
July 37,797 42,276
August 13,814 27,664
MY TOTAL 679,877 408,098 192,767
Table 32: Major CGF suppliers of Turkey
Turkey: Quantity of CGF imported
Countries MY 2007 (MT) MY 2008 (MT) MY 2009* (MT) U.S. 656,050 355,326 147,242 Ukraine 21,529 36,724 31,118 Others 2,298 16,048 14,407 Total 679,877 408,098 192,767
*September-May
DDGS and CGF prices have almost returned to the level before the October biotechnology regulation
was published. Before the new antibiotic test requirements were put in force, two large importers
cleared almost 100,000 MT of DDGS and CGF. If antibiotic tests will not interfere with imports, the
quantity of DDGS and CGF imports are expected to reach up to 400,000 MT in the following three
months.
In June 2010 Turkey imported 8,614 MT of Corn Gluten Feed. Major suppliers were Ukraine (5,838
MT) and Hungary (1,400 MT).
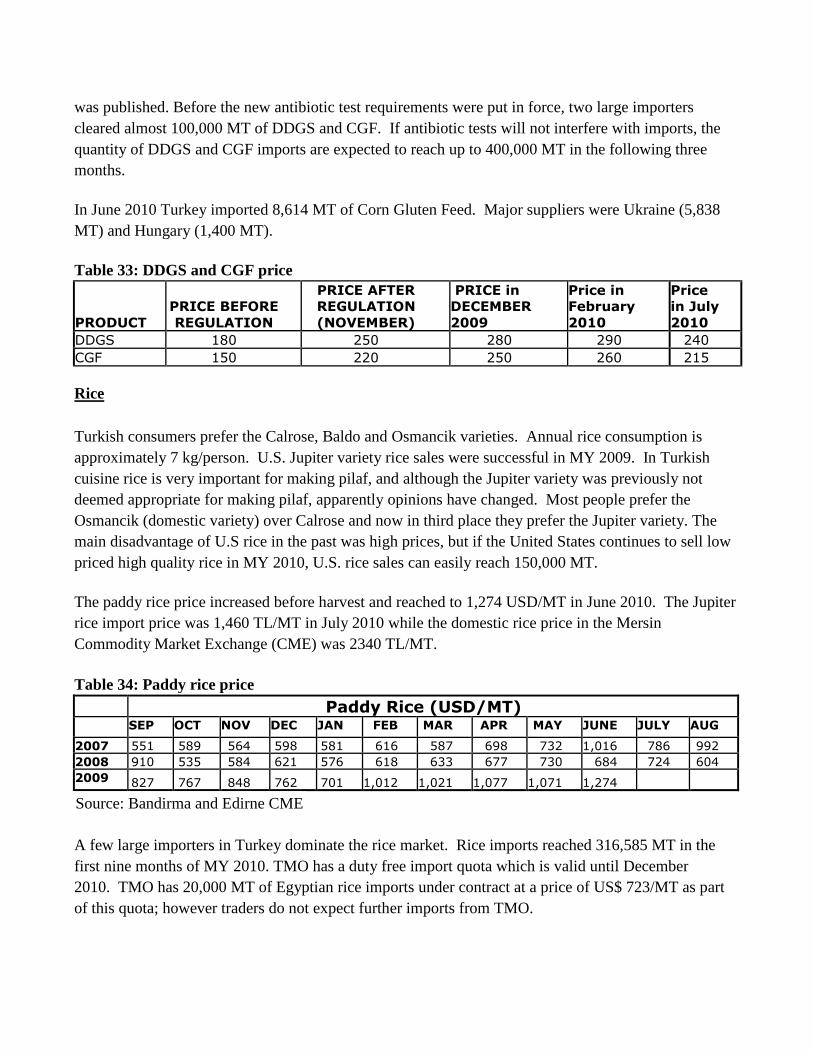
Table 33: DDGS and CGF price
PRODUCT PRICE BEFORE
REGULATION
PRICE AFTER
REGULATION
(NOVEMBER)
PRICE in
DECEMBER
2009
Price in
February
2010
Price
in July
2010 DDGS 180 250 280 290 240 CGF 150 220 250 260 215
Rice
Turkish consumers prefer the Calrose, Baldo and Osmancik varieties. Annual rice consumption is
approximately 7 kg/person. U.S. Jupiter variety rice sales were successful in MY 2009. In Turkish
cuisine rice is very important for making pilaf, and although the Jupiter variety was previously not
deemed appropriate for making pilaf, apparently opinions have changed. Most people prefer the
Osmancik (domestic variety) over Calrose and now in third place they prefer the Jupiter variety. The
main disadvantage of U.S rice in the past was high prices, but if the United States continues to sell low
priced high quality rice in MY 2010, U.S. rice sales can easily reach 150,000 MT.
The paddy rice price increased before harvest and reached to 1,274 USD/MT in June 2010. The Jupiter
rice import price was 1,460 TL/MT in July 2010 while the domestic rice price in the Mersin
Commodity Market Exchange (CME) was 2340 TL/MT.
Table 34: Paddy rice price
Paddy Rice (USD/MT)
SEP OCT NOV DEC JAN FEB MAR APR MAY JUNE JULY AUG
2007 551 589 564 598 581 616 587 698 732 1,016 786 992 2008 910 535 584 621 576 618 633 677 730 684 724 604 2009 827 767 848 762 701 1,012 1,021 1,077 1,071 1,274
Source: Bandirma and Edirne CME
A few large importers in Turkey dominate the rice market. Rice imports reached 316,585 MT in the
first nine months of MY 2010. TMO has a duty free import quota which is valid until December
2010. TMO has 20,000 MT of Egyptian rice imports under contract at a price of US$ 723/MT as part
of this quota; however traders do not expect further imports from TMO.
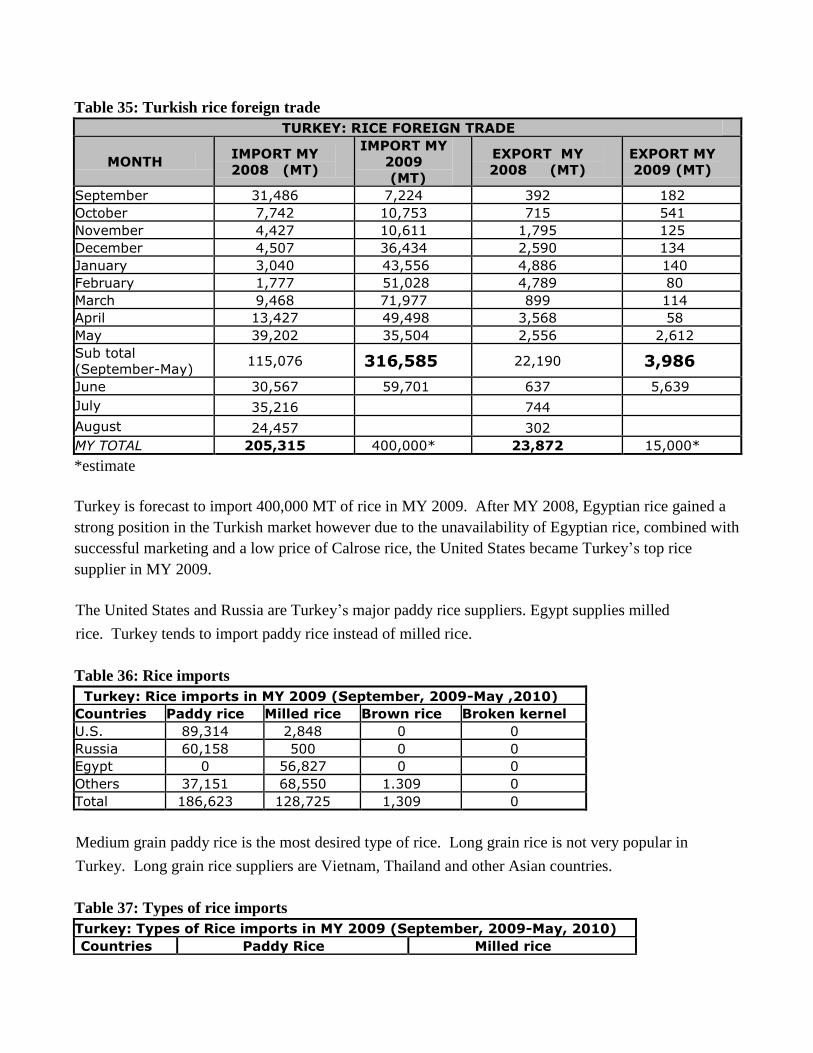
Table 35: Turkish rice foreign trade
TURKEY: RICE FOREIGN TRADE
MONTH IMPORT MY
2008 (MT)
IMPORT MY
2009 (MT)
EXPORT MY
2008 (MT) EXPORT MY
2009 (MT)
September 31,486 7,224 392 182 October 7,742 10,753 715 541 November 4,427 10,611 1,795 125 December 4,507 36,434 2,590 134 January 3,040 43,556 4,886 140 February 1,777 51,028 4,789 80 March 9,468 71,977 899 114 April 13,427 49,498 3,568 58 May 39,202 35,504 2,556 2,612 Sub total
(September-May) 115,076 316,585 22,190 3,986
June 30,567 59,701 637 5,639 July 35,216 744
August 24,457 302 MY TOTAL 205,315 400,000* 23,872 15,000*
*estimate
Turkey is forecast to import 400,000 MT of rice in MY 2009. After MY 2008, Egyptian rice gained a
strong position in the Turkish market however due to the unavailability of Egyptian rice, combined with
successful marketing and a low price of Calrose rice, the United States became Turkey’s top rice
supplier in MY 2009.
The United States and Russia are Turkey’s major paddy rice suppliers. Egypt supplies milled
rice. Turkey tends to import paddy rice instead of milled rice.
Table 36: Rice imports
Turkey: Rice imports in MY 2009 (September, 2009-May ,2010)
Countries Paddy rice Milled rice Brown rice Broken kernel U.S. 89,314 2,848 0 0 Russia 60,158 500 0 0 Egypt 0 56,827 0 0 Others 37,151 68,550 1.309 0 Total 186,623 128,725 1,309 0
Medium grain paddy rice is the most desired type of rice. Long grain rice is not very popular in
Turkey. Long grain rice suppliers are Vietnam, Thailand and other Asian countries.
Table 37: Types of rice imports
Turkey: Types of Rice imports in MY 2009 (September, 2009-May, 2010)
Countries Paddy Rice Milled rice
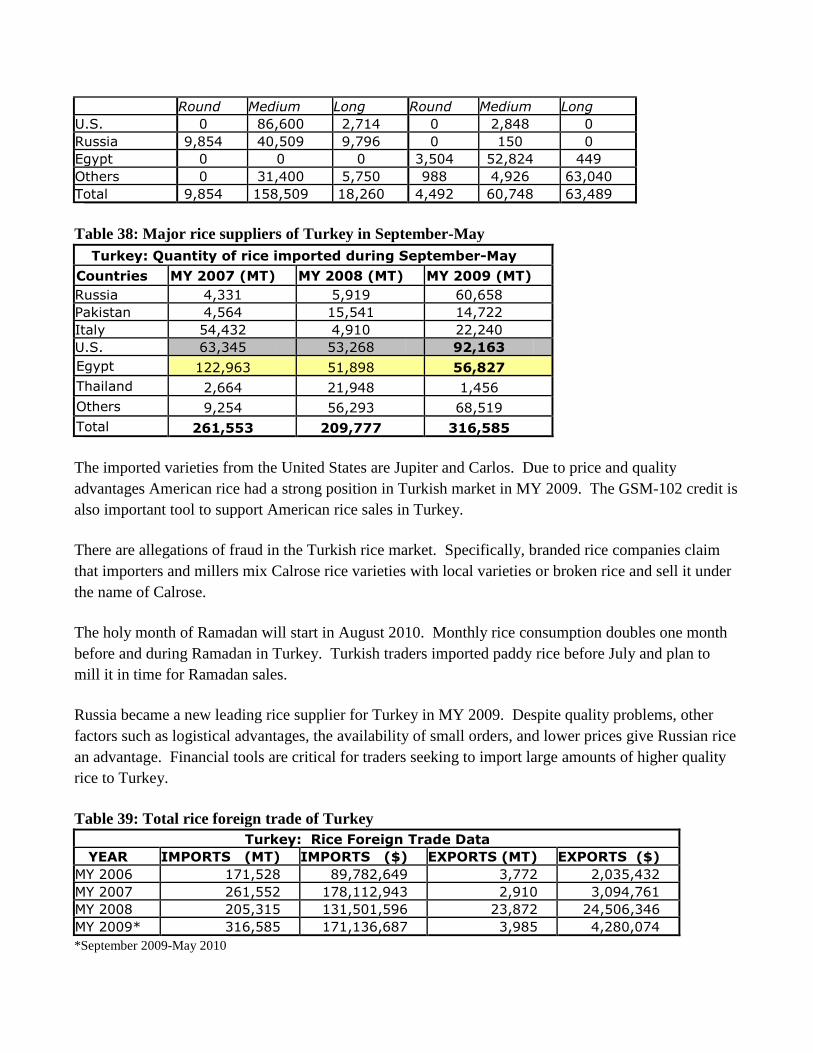
Round Medium Long Round Medium Long U.S. 0 86,600 2,714 0 2,848 0 Russia 9,854 40,509 9,796 0 150 0 Egypt 0 0 0 3,504 52,824 449 Others 0 31,400 5,750 988 4,926 63,040 Total 9,854 158,509 18,260 4,492 60,748 63,489
Table 38: Major rice suppliers of Turkey in September-May
Turkey: Quantity of rice imported during September-May
Countries MY 2007 (MT) MY 2008 (MT) MY 2009 (MT) Russia 4,331 5,919 60,658 Pakistan 4,564 15,541 14,722 Italy 54,432 4,910 22,240 U.S. 63,345 53,268 92,163 Egypt 122,963 51,898 56,827 Thailand 2,664 21,948 1,456 Others 9,254 56,293 68,519 Total 261,553 209,777 316,585
The imported varieties from the United States are Jupiter and Carlos. Due to price and quality
advantages American rice had a strong position in Turkish market in MY 2009. The GSM-102 credit is
also important tool to support American rice sales in Turkey.
There are allegations of fraud in the Turkish rice market. Specifically, branded rice companies claim
that importers and millers mix Calrose rice varieties with local varieties or broken rice and sell it under
the name of Calrose.
The holy month of Ramadan will start in August 2010. Monthly rice consumption doubles one month
before and during Ramadan in Turkey. Turkish traders imported paddy rice before July and plan to
mill it in time for Ramadan sales.
Russia became a new leading rice supplier for Turkey in MY 2009. Despite quality problems, other
factors such as logistical advantages, the availability of small orders, and lower prices give Russian rice
an advantage. Financial tools are critical for traders seeking to import large amounts of higher quality
rice to Turkey.
Table 39: Total rice foreign trade of Turkey
Turkey: Rice Foreign Trade Data YEAR IMPORTS (MT) IMPORTS ($) EXPORTS (MT) EXPORTS ($)
MY 2006 171,528 89,782,649 3,772 2,035,432 MY 2007 261,552 178,112,943 2,910 3,094,761 MY 2008 205,315 131,501,596 23,872 24,506,346 MY 2009* 316,585 171,136,687 3,985 4,280,074 *September 2009-May 2010
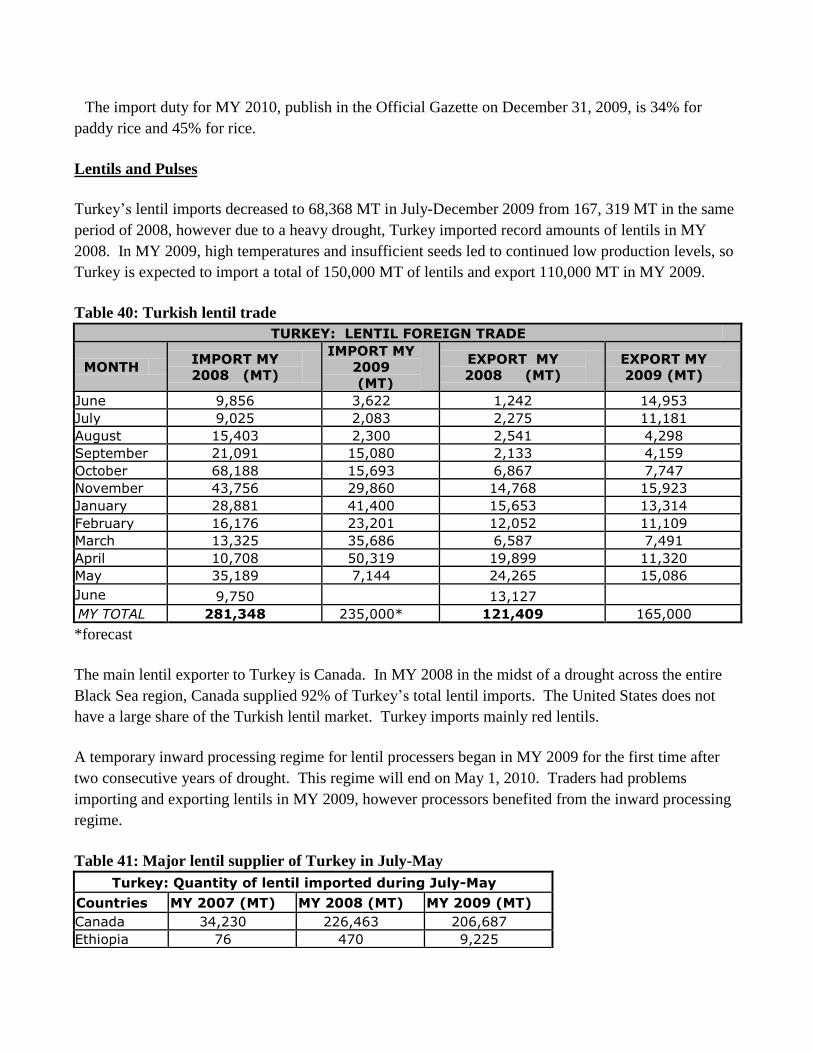
The import duty for MY 2010, publish in the Official Gazette on December 31, 2009, is 34% for
paddy rice and 45% for rice.
Lentils and Pulses
Turkey’s lentil imports decreased to 68,368 MT in July-December 2009 from 167, 319 MT in the same
period of 2008, however due to a heavy drought, Turkey imported record amounts of lentils in MY
2008. In MY 2009, high temperatures and insufficient seeds led to continued low production levels, so
Turkey is expected to import a total of 150,000 MT of lentils and export 110,000 MT in MY 2009.
Table 40: Turkish lentil trade
TURKEY: LENTIL FOREIGN TRADE
MONTH IMPORT MY
2008 (MT)
IMPORT MY
2009 (MT)
EXPORT MY
2008 (MT) EXPORT MY
2009 (MT)
June 9,856 3,622 1,242 14,953 July 9,025 2,083 2,275 11,181 August 15,403 2,300 2,541 4,298 September 21,091 15,080 2,133 4,159 October 68,188 15,693 6,867 7,747 November 43,756 29,860 14,768 15,923 January 28,881 41,400 15,653 13,314 February 16,176 23,201 12,052 11,109 March 13,325 35,686 6,587 7,491 April 10,708 50,319 19,899 11,320 May 35,189 7,144 24,265 15,086 June 9,750 13,127 MY TOTAL 281,348 235,000* 121,409 165,000
*forecast
The main lentil exporter to Turkey is Canada. In MY 2008 in the midst of a drought across the entire
Black Sea region, Canada supplied 92% of Turkey’s total lentil imports. The United States does not
have a large share of the Turkish lentil market. Turkey imports mainly red lentils.
A temporary inward processing regime for lentil processers began in MY 2009 for the first time after
two consecutive years of drought. This regime will end on May 1, 2010. Traders had problems
importing and exporting lentils in MY 2009, however processors benefited from the inward processing
regime.
Table 41: Major lentil supplier of Turkey in July-May
Turkey: Quantity of lentil imported during July-May
Countries MY 2007 (MT) MY 2008 (MT) MY 2009 (MT) Canada 34,230 226,463 206,687 Ethiopia 76 470 9,225
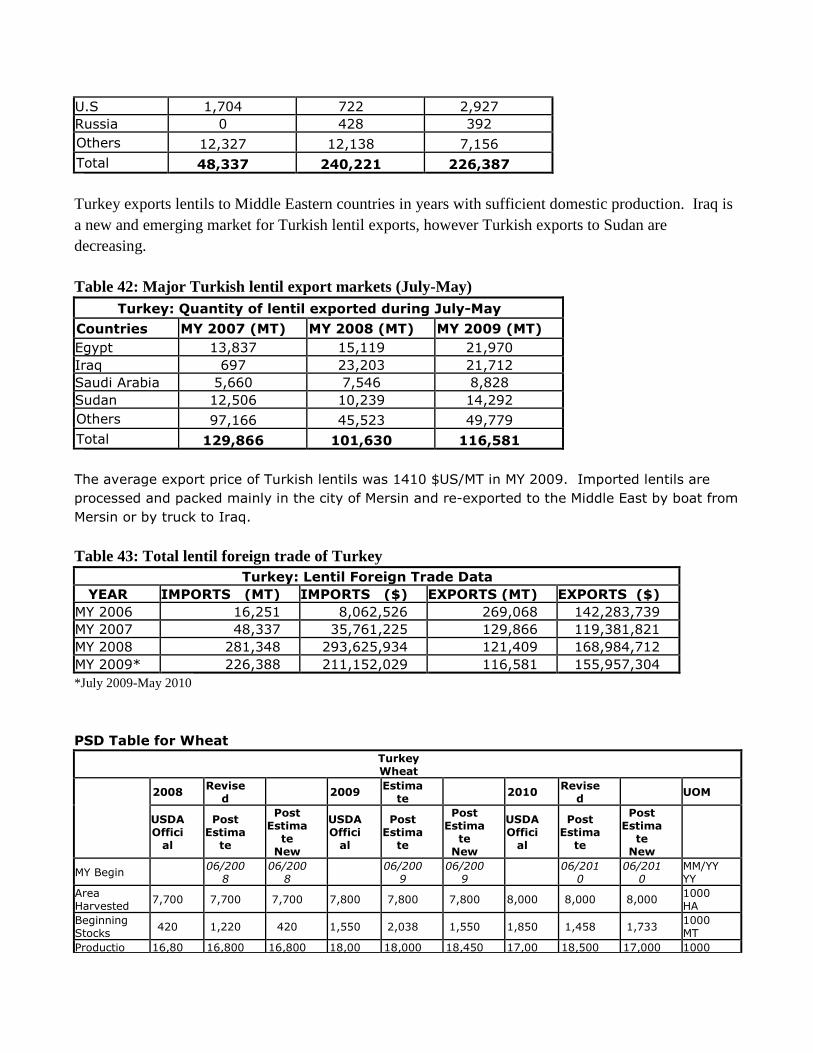
U.S 1,704 722 2,927 Russia 0 428 392 Others 12,327 12,138 7,156 Total 48,337 240,221 226,387
Turkey exports lentils to Middle Eastern countries in years with sufficient domestic production. Iraq is
a new and emerging market for Turkish lentil exports, however Turkish exports to Sudan are
decreasing.
Table 42: Major Turkish lentil export markets (July-May)
Turkey: Quantity of lentil exported during July-May
Countries MY 2007 (MT) MY 2008 (MT) MY 2009 (MT) Egypt 13,837 15,119 21,970 Iraq 697 23,203 21,712 Saudi Arabia 5,660 7,546 8,828 Sudan 12,506 10,239 14,292 Others 97,166 45,523 49,779 Total 129,866 101,630 116,581
The average export price of Turkish lentils was 1410 $US/MT in MY 2009. Imported lentils are
processed and packed mainly in the city of Mersin and re-exported to the Middle East by boat from
Mersin or by truck to Iraq.
Table 43: Total lentil foreign trade of Turkey
Turkey: Lentil Foreign Trade Data YEAR IMPORTS (MT) IMPORTS ($) EXPORTS (MT) EXPORTS ($)
MY 2006 16,251 8,062,526 269,068 142,283,739 MY 2007 48,337 35,761,225 129,866 119,381,821 MY 2008 281,348 293,625,934 121,409 168,984,712 MY 2009* 226,388 211,152,029 116,581 155,957,304 *July 2009-May 2010
PSD Table for Wheat
Turkey Wheat
2008 Revised 2009 Estima
te 2010 Revised UOM
USDA Offici
al
Post Estima
te
Post Estima
te New
USDA Offici
al
Post Estima
te
Post Estima
te New
USDA Offici
al
Post Estima
te
Post Estima
te New
MY Begin 06/200
8 06/200
8 06/200
9 06/200
9 06/201
0 06/201
0 MM/YYYY
Area Harvested 7,700 7,700 7,700 7,800 7,800 7,800 8,000 8,000 8,000 1000
HA Beginning Stocks 420 1,220 420 1,550 2,038 1,550 1,850 1,458 1,733 1000
MT Productio 16,80 16,800 16,800 18,00 18,000 18,450 17,00 18,500 17,000 1000
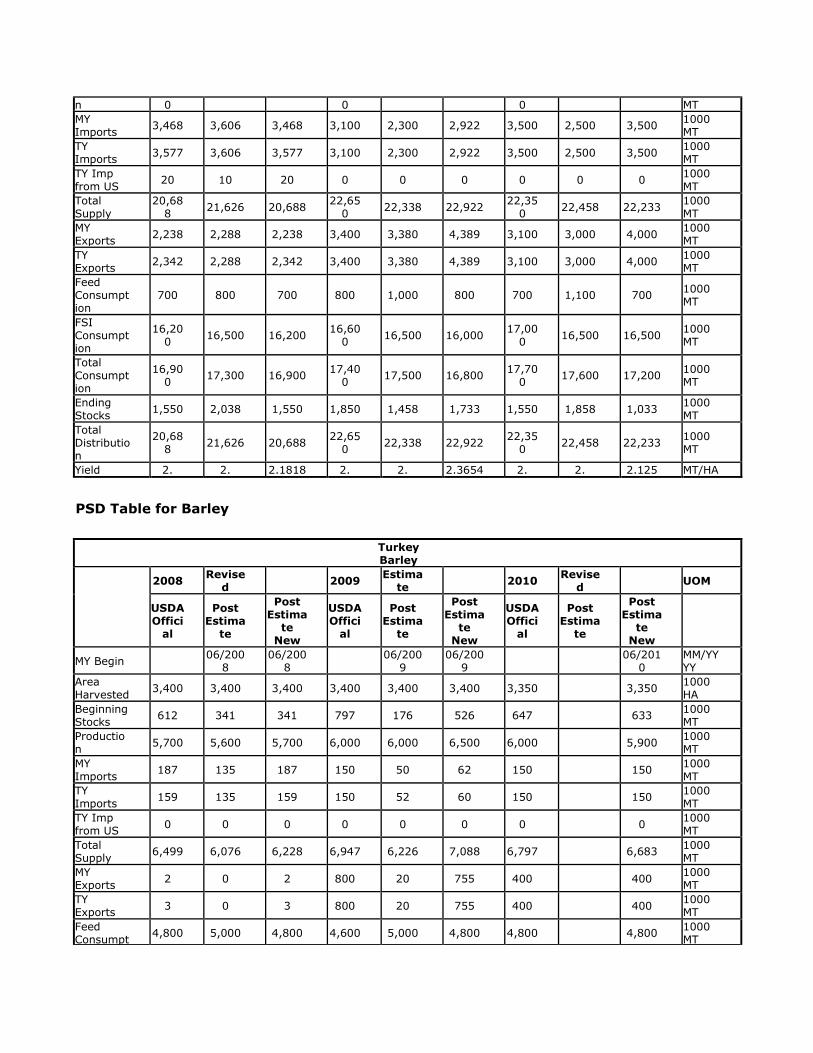
n 0 0 0 MT MY Imports 3,468 3,606 3,468 3,100 2,300 2,922 3,500 2,500 3,500 1000
MT TY Imports 3,577 3,606 3,577 3,100 2,300 2,922 3,500 2,500 3,500 1000
MT TY Imp from US 20 10 20 0 0 0 0 0 0 1000
MT Total Supply
20,688 21,626 20,688 22,65
0 22,338 22,922 22,350 22,458 22,233 1000
MT MY Exports 2,238 2,288 2,238 3,400 3,380 4,389 3,100 3,000 4,000 1000
MT TY Exports 2,342 2,288 2,342 3,400 3,380 4,389 3,100 3,000 4,000 1000
MT Feed Consumption
700 800 700 800 1,000 800 700 1,100 700 1000 MT
FSI Consumption
16,200 16,500 16,200 16,60
0 16,500 16,000 17,000 16,500 16,500 1000
MT
Total Consumption
16,900 17,300 16,900 17,40
0 17,500 16,800 17,700 17,600 17,200 1000
MT
Ending Stocks 1,550 2,038 1,550 1,850 1,458 1,733 1,550 1,858 1,033 1000
MT Total Distribution
20,688 21,626 20,688 22,65
0 22,338 22,922 22,350 22,458 22,233 1000
MT
Yield 2. 2. 2.1818 2. 2. 2.3654 2. 2. 2.125 MT/HA
PSD Table for Barley
Turkey Barley
2008 Revised 2009 Estima
te 2010 Revised UOM
USDA Offici
al
Post Estima
te
Post Estima
te New
USDA Offici
al
Post Estima
te
Post Estima
te New
USDA Offici
al
Post Estima
te
Post Estima
te New
MY Begin 06/200
8 06/200
8 06/200
9 06/200
9 06/201
0 MM/YYYY
Area Harvested 3,400 3,400 3,400 3,400 3,400 3,400 3,350 3,350 1000
HA Beginning Stocks 612 341 341 797 176 526 647 633 1000
MT Production 5,700 5,600 5,700 6,000 6,000 6,500 6,000 5,900 1000
MT MY Imports 187 135 187 150 50 62 150 150 1000
MT TY Imports 159 135 159 150 52 60 150 150 1000
MT TY Imp from US 0 0 0 0 0 0 0 0 1000
MT Total Supply 6,499 6,076 6,228 6,947 6,226 7,088 6,797 6,683 1000
MT MY Exports 2 0 2 800 20 755 400 400 1000
MT TY Exports 3 0 3 800 20 755 400 400 1000
MT Feed Consumpt
4,800 5,000 4,800 4,600 5,000 4,800 4,800 4,800 1000 MT
ion FSI Consumption
900 900 900 900 900 900 900 900 1000 MT
Total Consumption
5,700 5,900 5,700 5,500 5,900 5,700 5,700 5,700 1000 MT
Ending Stocks 797 176 526 647 306 633 697 583 1000
MT Total Distribution
6,499 6,076 6,228 6,947 6,226 7,088 6,797 6,683 1000 MT
Yield 2. 2. 1.6765 2. 2. 1.9118 2. 1.7612 MT/HA
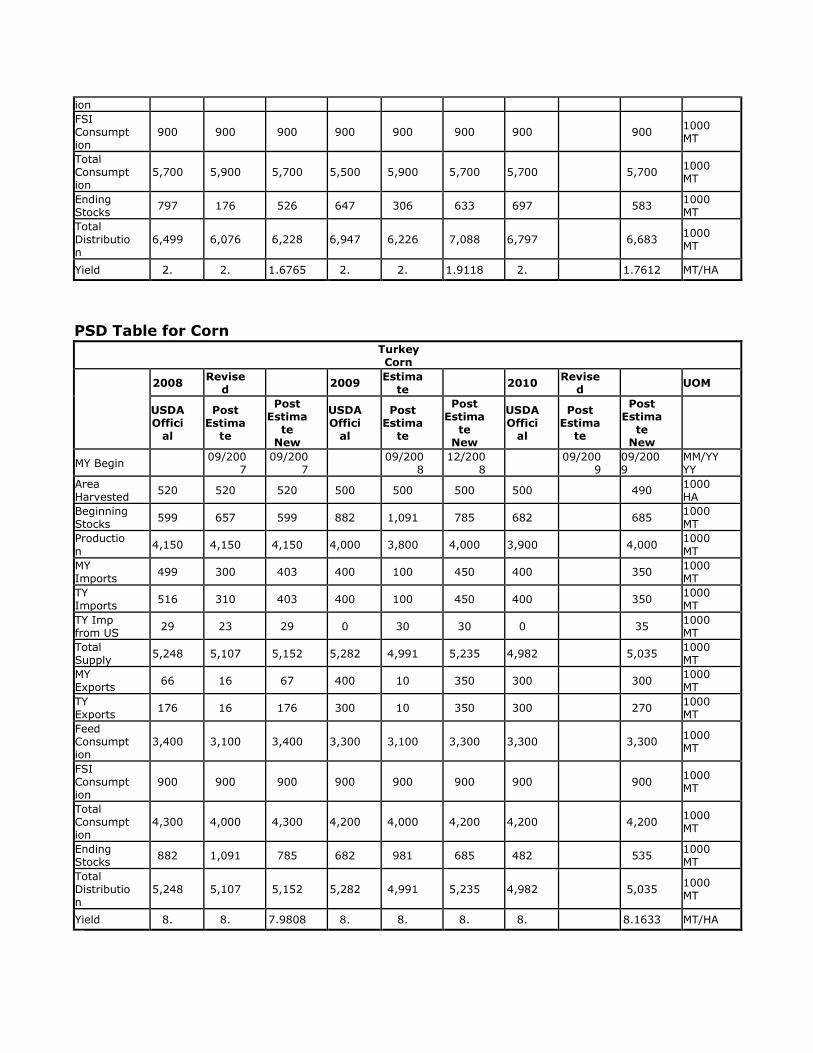
PSD Table for Corn Turkey Corn
2008 Revised 2009 Estima
te 2010 Revised UOM
USDA Offici
al
Post Estima
te
Post Estima
te New
USDA Offici
al
Post Estima
te
Post Estima
te New
USDA Offici
al
Post Estima
te
Post Estima
te New
MY Begin 09/200
7 09/200
7 09/200
8 12/200
8 09/200
9 09/2009
MM/YYYY
Area Harvested 520 520 520 500 500 500 500 490 1000
HA Beginning Stocks 599 657 599 882 1,091 785 682 685 1000
MT Productio
n 4,150 4,150 4,150 4,000 3,800 4,000 3,900 4,000 1000
MT MY Imports 499 300 403 400 100 450 400 350 1000
MT TY Imports 516 310 403 400 100 450 400 350 1000
MT TY Imp from US 29 23 29 0 30 30 0 35 1000
MT Total Supply 5,248 5,107 5,152 5,282 4,991 5,235 4,982 5,035 1000
MT MY Exports 66 16 67 400 10 350 300 300 1000
MT TY Exports 176 16 176 300 10 350 300 270 1000
MT Feed Consumption
3,400 3,100 3,400 3,300 3,100 3,300 3,300 3,300 1000 MT
FSI Consumption
900 900 900 900 900 900 900 900 1000 MT
Total Consumption
4,300 4,000 4,300 4,200 4,000 4,200 4,200 4,200 1000 MT
Ending Stocks 882 1,091 785 682 981 685 482 535 1000
MT Total Distribution
5,248 5,107 5,152 5,282 4,991 5,235 4,982 5,035 1000 MT
Yield 8. 8. 7.9808 8. 8. 8. 8. 8.1633 MT/HA
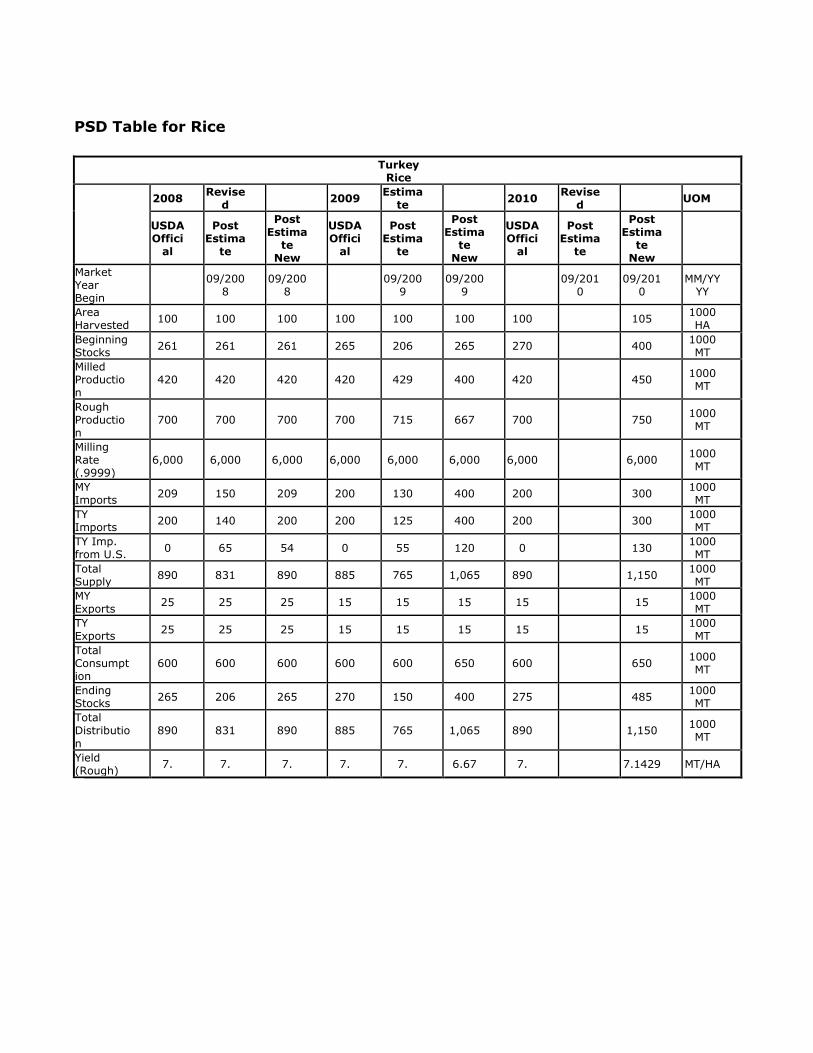
PSD Table for Rice
Turkey
Rice
2008 Revised 2009 Estima
te 2010 Revised UOM
USDA Offici
al
Post Estima
te
Post Estima
te New
USDA Offici
al
Post Estima
te
Post Estima
te New
USDA Offici
al
Post Estima
te
Post Estima
te New
Market Year Begin
09/200
8 09/200
8 09/200
9 09/200
9 09/201
0 09/201
0 MM/YY
YY
Area Harvested 100 100 100 100 100 100 100 105 1000
HA Beginning Stocks 261 261 261 265 206 265 270 400 1000
MT Milled Production
420 420 420 420 429 400 420 450 1000 MT
Rough Production
700 700 700 700 715 667 700 750 1000 MT
Milling Rate (.9999)
6,000 6,000 6,000 6,000 6,000 6,000 6,000 6,000 1000 MT
MY Imports 209 150 209 200 130 400 200 300 1000
MT TY Imports 200 140 200 200 125 400 200 300 1000
MT TY Imp. from U.S. 0 65 54 0 55 120 0 130 1000
MT Total Supply 890 831 890 885 765 1,065 890 1,150 1000
MT MY Exports 25 25 25 15 15 15 15 15 1000
MT TY Exports 25 25 25 15 15 15 15 15 1000
MT Total Consumption
600 600 600 600 600 650 600 650 1000 MT
Ending Stocks 265 206 265 270 150 400 275 485 1000
MT Total Distributio
n 890 831 890 885 765 1,065 890 1,150 1000
MT
Yield (Rough) 7. 7. 7. 7. 7. 6.67 7. 7.1429 MT/HA
