grain sampling and assessment: sampling grain in lorries · grain sampling and assessment: sampling...
TRANSCRIPT

PROJECT REPORT No. 339
GRAIN SAMPLING AND ASSESSMENT: SAMPLING GRAIN
IN LORRIES
MAY 2004 Price: £3.75
1
PROJECT REPORT No. 339
GRAIN SAMPLING AND ASSESSMENT: SAMPLING GRAIN
IN LORRIES
by
J KNIGHT, R WILKIN and J RIVETT
Department of Environmental Science and Technology, Renewable Resources Assessment Group, Imperial College of Science and Technology, Prince Consort Road, London SW7 2BB
This is the final report of a 13-month project that started in May 2003. The work was funded by a grant of £35,606 from HGCA (project 2955).
The Home-Grown Cereals Authority (HGCA) has provided funding for this project but has not conducted the research or written this report. While the authors have worked on the best information available to them, neither HGCA nor the authors shall in any event be liable for any loss, damage or injury howsoever suffered directly or indirectly in relation to the report or the research on which it is based.
Reference herein to trade names and proprietary products without stating that they are protected does not imply that they may be regarded as unprotected and thus free for general use. No endorsement of named products is intended nor is it any criticism implied of other alternative, but unnamed, products.

2
Contents
Abstract ......................................................................................................................................... 3 Programme of work: ...................................................................................................................... 4
i) Overall Aim ............................................................................................................................. 4 ii) Specific Objectives: ................................................................................................................ 4
Constraints on the project.............................................................................................................. 5 Methodology .................................................................................................................................. 5
1. Collection of data relating to current sampling practice.................................................... 5 2. Sample collection ............................................................................................................ 5 2.1. Store 1............................................................................................................................. 5 2.2. Store 2............................................................................................................................. 5 2.3. Store 3............................................................................................................................. 6 2.4. Store 4............................................................................................................................. 6 3. Assessment of samples................................................................................................... 6 4. Estimating the reliability of sampling................................................................................ 7
Results .......................................................................................................................................... 7 1. Collection of data relating to current sampling practice.................................................... 7 2. Observations on the sampling ......................................................................................... 8 2.1. Store 1............................................................................................................................. 8 2.2. Store 2........................................................................................................................... 10 2.3. Store 3........................................................................................................................... 10 2.4. Store 4........................................................................................................................... 10 3. Weights of samples collected. ....................................................................................... 10 4. Analysis of the quality parameters of the grain .............................................................. 10 Estimating the sampling reliability ............................................................................................ 16
Discussion ................................................................................................................................... 19 Inherent variation in grain......................................................................................................... 19 Protocol for lorry sampling........................................................................................................ 21
Recommendations....................................................................................................................... 21 Screenings: .............................................................................................................................. 21 National and International Standards: ...................................................................................... 21 Influence of method of measurement: ...................................................................................... 21
Acknowledgements...................................................................................................................... 21 Annex 1 ....................................................................................................................................... 22 Protocol for collecting samples from lorry-loads of grain:............................................................. 22

3
Abstract The aim of this project was to establish if there are any inherent problems with the sampling of grain for the determination of quality characteristics in lorries at the point of intake and to establish recommendations in the form of a protocol for the sampling of grain under these conditions. Grain was sampled using automated systems (Samplex CS90) and manual spearing to see if the method of sampling influenced the grain quality measurements. A key part of the process was to assess the influence that the number of samples taken from each load had on the likely accuracy of the results. Samples were collected at 4 different locations; on two occasions 10 lorries were sampled and on two occasions 8 lorries were sampled. At three locations CS90 samplers were used and 8 samples were withdrawn from each load and at the other location samples were taken manually with a multi-compartmented spear with 5 samples being taken from each lorry. A comparison of different ways of sample handling was obtained by comparing the individual results from the 8 samples against an analysis of samples withdrawn from a composite sample formed from 8 samples. The latter method reflects more accurately the procedure followed at most stores. Results indicated that there were no statistically significant differences between results from the individual samples or from the composite samples. Monte Carlo simulation of the impacts of using 2, 3, 5 or 8 samples per load revealed that the greater the number of samples used the greater the reliability of the result and the more likely it was to represent the true mean of the load. It was noted that automatic sampling equipment can no longer sample the entire length of a trailer and this could cause problems with obtaining the ideal sample. Manual sampling also had severe limitations due to the lack of safe access for sampling of trailers. A sampling protocol for lorries is presented which emphasises the need for 8 samples to be taken from each load in order to get a good representation of the quality of the entire load.

4
Background This research submission was made at the request of HGCA in response to the Treasury funding secured to undertake a two-year programme to improve and standardise grain sampling and analysis across the UK cereals industry. The first phase of the programme was to develop and validate protocols suitable for collecting samples of grain on UK farms at harvest time and to train farmers in their use. The second part was to examine approaches to the collection of samples during storage and to compare the results obtained, wherever possible, with data collected as the store was filled. During the course of earlier sampling work, there was strong interest expressed in the mechanics and effectiveness of sampling loads of grain in lorries. In addition, some of the work done during storage involved sampling grain as it left the store in lorries. This showed up the limitations of some approaches to lorry sampling and highlighted the need for more information. An assessment of lorry sampling was therefore added as a separate section to the main project and is reported here. Almost all grain is sampled as it is delivered to end users to confirm its quality and to ensure that contractual obligations are met. This sampling takes the form of collecting one or more samples from a lorry-load on arrival. The equipment used and method of sampling varies between end users and there are no data to show if these variations may cause bias in the representativeness of the sample and, therefore, in the results of quality analysis. The key aim of end-user sampling is to ensure that the quality of the grain is suitable for its intended use. Therefore sampling is done before the load is tipped and this limits access to the surface of the load. This access is further constrained by food safety and HSE legislation that prevent the sampler from walking on the load. A limited assessment of the practicalities of sampling lorries was done in 1992 (HGCA Project Report 79) in which the effects of method of sampling, number and position of sample points, the methods of loading lorries were considered. The wheat sampled was low-grade feed material with a low specific weight and a high level of fine material so was not representative of other grades. The results suggested that loading lorries with a front loader or from a hopper had no effect on the distribution of the quality characteristics within a load. Small differences were noted in the mean values for specific weight between automatic sampling using a Samplex CS90 and a manual spear but overall variability of the grain meant that these differences were not significant. There was significant variability in the results obtained at individual points with either method, although this variability was random and not associated with any part of the load. Fine material appeared to be very difficult to measure. At the time this work was undertaken there were no restrictions limiting access to the surface of the grain so that a widely disbursed pattern of sampling points could be used with the manual sampling. The conclusions from this work were that it was extremely unwise to base an assessment of lorry load of grain on a single sample and that more work was needed the confirm the results and to assesses other grades of grain
Programme of work: i) Overall Aim To assess the effectiveness of different approaches to sampling loads of grain in lorries. ii) Specific Objectives: i) To assess if the method of collecting samples influences grain quality measurement. ii) To assess if the number and position of sampling points influences grain quality measurement. iii) To provide guidelines for sampling lorries giving reliable information about grain quality.
5
Constraints on the project This work relied on the goodwill and co-operation of various storekeepers. Sampling had to be done using the facilities that were available at each store and could not unduly disrupt the normal working of the store. Current food safety and HSE legislation limiting the access of samplers to the surface of grain loaded in lorries had to be respected during this work.
Methodology 1. Collection of data relating to current sampling practice. As part of the overall Project, in November 2002 the HGCA circulated a questionnaire to commercial grain stores and end-users of grain requesting information about their methods of analysis and methods of intake sampling. The information that was collected was used to assist with the design of the assessment of lorry sampling. 2. Sample collection
2.1. Store 1
The work was done at a store specialising in the storage of malting barley. Lorries were loaded with malting barley, variety Pearl, of a quality representative of that delivered to central storage from farms. The lorries, all 28 tonne articulated units, were loaded with a front loader fitted with a 2 tonne bucket. Ten loads were sampled over a 2 day period. Sampling was done using the store’s Samplex CS90 automated vacuum sampler. Initially, it had been expected to re-programme the CS90 to take 10 samples/load in a pre-set pattern. However, observation of the method of operation and sampling pattern achieved by the CS90 suggested that there was no advantage in using more than the 8 points provided by one of the standard sampler programmes. During the setting up and initial testing of the CS90, the slide on the sample spear was opened to its maximum to increase the sample size. The system was set to only collect grain during the withdrawal as is recommended by the manufacturer for granular materials. Each of the eight points was sampled three times. On the first occasion, individual samples were held separately. During the second and third samplings, all samples were bulked into single batches. One of these bulk samples was held as a composite sample and the other was used to provide samples of 1, 2 and 3 litres (small medium and large) collected at random with a 1-litre jug. A small sub-sample from each of the individual samples was tested on the spot by store staff for screenings and germinative capacity. Screenings were tested by sieving a 100g sub-sample with a motorised shaker fitted with a 2.25mm mesh screen for 2 minutes. The germinative capacity was tested using the standard tetrazolium test.
2.2. Store 2 Work was done at a commercial store during the normal out-loading of feed wheat. The lorries were loaded from an on-floor bulk using a front-bucket loader and were sampled as they left the store. Normal sampling practice was to collect a single spear sample/load using a manual, multi-compartmented spear of about 1.7m in length. Access to the load was via a small sampling platform that only allowed samples to be taken from less than half the length of the loaded trailer and from only one side of the load.
6
For the purposes of this investigation 5 sample points were used for each load and the lorry was moved forward during the sampling process so that access to the whole length of the load could be obtained. However, it was not practical to turn the lorry round to give access to both sides of the load. Manual sampling meant that there was, inevitably, some variation in the exact location of the sample points between loads. Three spear samples were collected at each point. The first was held as an individual sample, the second bulked to form a composite sample and the third bulked to give a sample from which three random samples (small, medium and large) could be taken without mixing. Ten lorry loads were sampled over a two-day period.
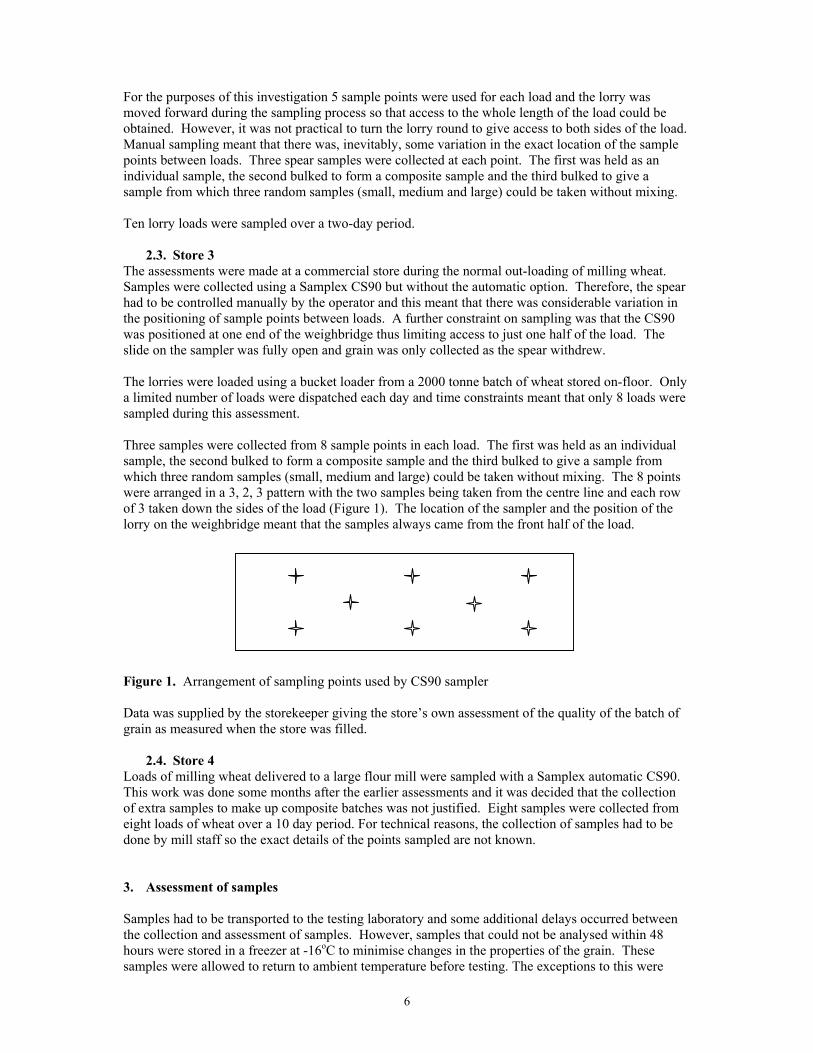
2.3. Store 3 The assessments were made at a commercial store during the normal out-loading of milling wheat. Samples were collected using a Samplex CS90 but without the automatic option. Therefore, the spear had to be controlled manually by the operator and this meant that there was considerable variation in the positioning of sample points between loads. A further constraint on sampling was that the CS90 was positioned at one end of the weighbridge thus limiting access to just one half of the load. The slide on the sampler was fully open and grain was only collected as the spear withdrew. The lorries were loaded using a bucket loader from a 2000 tonne batch of wheat stored on-floor. Only a limited number of loads were dispatched each day and time constraints meant that only 8 loads were sampled during this assessment. Three samples were collected from 8 sample points in each load. The first was held as an individual sample, the second bulked to form a composite sample and the third bulked to give a sample from which three random samples (small, medium and large) could be taken without mixing. The 8 points were arranged in a 3, 2, 3 pattern with the two samples being taken from the centre line and each row of 3 taken down the sides of the load (Figure 1). The location of the sampler and the position of the lorry on the weighbridge meant that the samples always came from the front half of the load.
Figure 1. Arrangement of sampling points used by CS90 sampler Data was supplied by the storekeeper giving the store’s own assessment of the quality of the batch of grain as measured when the store was filled.
2.4. Store 4 Loads of milling wheat delivered to a large flour mill were sampled with a Samplex automatic CS90. This work was done some months after the earlier assessments and it was decided that the collection of extra samples to make up composite batches was not justified. Eight samples were collected from eight loads of wheat over a 10 day period. For technical reasons, the collection of samples had to be done by mill staff so the exact details of the points sampled are not known. 3. Assessment of samples Samples had to be transported to the testing laboratory and some additional delays occurred between the collection and assessment of samples. However, samples that could not be analysed within 48 hours were stored in a freezer at -16oC to minimise changes in the properties of the grain. These samples were allowed to return to ambient temperature before testing. The exceptions to this were
7
samples collected from store 4. These were collected over a 10 day period and a further 4 days elapsed before the samples arrived for testing. During this period the samples were not held under controlled temperature conditions. Individual samples were tested separately, as were the three different sizes of random sample. However, in the case of the medium and large samples, these were divided by coning and quartering to give the correct volume of grain for assessment. The composite samples were also mixed and then divided by coning and quartering. Five sub-samples of the composites were tested from Store1 but only three sub-samples were tested from stores 2 and 3. As a first step in the assessment process, the screenings in each sample were measured by manual sieving. Each sample was weighed and then sieved for 30 seconds using a 2.5mm slotted sieve for wheat or a 2.25mm slotted sieve for barley. The sievings were weighed and the percentage calculated. The weights of the individual samples gave an indication of the variation in the size of sample collected on each occasion. After sieving, the properties of each sample were assessed using a Foss Infratec Grain Analyser 1241 GA-TWM. The machine used official calibrations as provided by the NIR network and measured moisture content, specific weight, protein in the case of wheat, or nitrogen in the case of barley and made an assessment of hardness of wheat. In addition, some of the samples of wheat from stores 2 and 3 were sent to NIAB for assessment of Hagberg Falling Number. Complete sets of individual samples from 5 loads, together with a single composite sample were tested from Store 3. Complete sets of individual samples and a single composite from 4 loads were tested from Store 2. The testing was done using standard methodology and each result was the mean of two determinations. 4. Estimating the reliability of sampling The impact of the number of samples taken on the reliability of the result obtained from those samples was assessed by determining the mean and standard deviation for the results of the 8 samples taken from each lorry. This information was used to define a probability curve for a normal distribution for each of the lorries. A Monte Carlo simulation was then run to sample from either 2, 3, 5 or 8 of these distributions depending on the sampling regime to be simulated. The simulation was run for a total of 100,000 trials. From this result cumulative probability distribution curves were obtained and these were used to estimate the confidence limits for different numbers of samples for a given margin of error. Thus the confidence interval for sampling 2, 3, 5, or 8 times for a known deviation from the mean for the different quality parameters could be produced. The final figure shows the probability of the confidence interval actually covering the mean value.
Results 1. Collection of data relating to current sampling practice As part of the initiative to standardise grain testing a survey of laboratory practice was undertaken and this included a set of questions on the collection of samples from lorry-loads of grain. This provided information from a range of commercial premises receiving, handling or processing grain about current lorry sampling practices. The response showed that there was no common industry-wide approach. The most frequently used equipment was the Samplex CS90 or other unspecified Samplex units (49%) followed by manual sampling (37%). The number of samples collected per load ranged between 1 and 10 and the weight of grain collected varied between 0.4 and 11kg.
8
2. Observations on the sampling
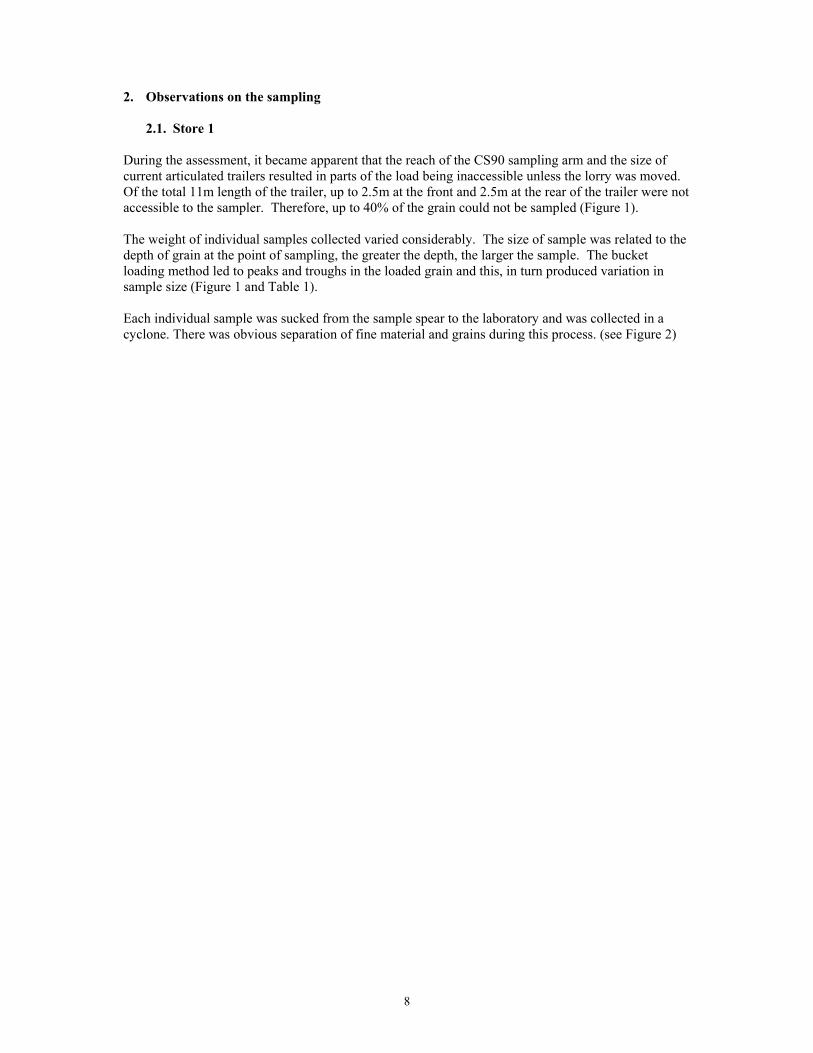
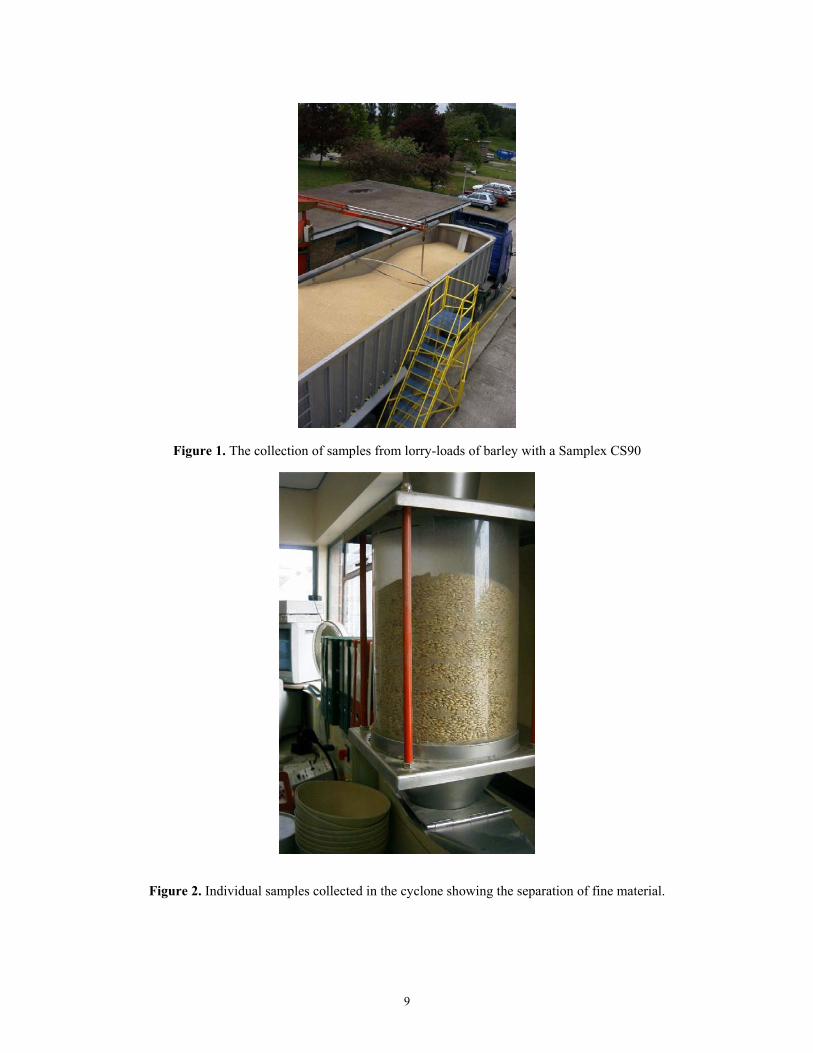
2.1. Store 1 During the assessment, it became apparent that the reach of the CS90 sampling arm and the size of current articulated trailers resulted in parts of the load being inaccessible unless the lorry was moved. Of the total 11m length of the trailer, up to 2.5m at the front and 2.5m at the rear of the trailer were not accessible to the sampler. Therefore, up to 40% of the grain could not be sampled (Figure 1). The weight of individual samples collected varied considerably. The size of sample was related to the depth of grain at the point of sampling, the greater the depth, the larger the sample. The bucket loading method led to peaks and troughs in the loaded grain and this, in turn produced variation in sample size (Figure 1 and Table 1). Each individual sample was sucked from the sample spear to the laboratory and was collected in a cyclone. There was obvious separation of fine material and grains during this process. (see Figure 2)
9
Figure 1. The collection of samples from lorry-loads of barley with a Samplex CS90
Figure 2. Individual samples collected in the cyclone showing the separation of fine material.

10
2.2. Store 2 The collection of samples was limited to one side of the load only and the exact location of the sample points varied between loads because the position of the lorries in relation to the sampling platform varied. The depth of the grain in the trailers varied as at Store 1. However, the grain was always deep enough to permit the manual spear to be inserted to its full depth so there was much less variation in the weight of sample (Table 1). Conversely, the spear was usually not long enough to reach to the bottom of the load. The process of collecting 5 samples/load was time consuming and physically demanding. Moving the lorry to allow access to the whole length of the load could not be considered as a practical approach in most situations.
2.3. Store 3 The manual control of the insertion of the sample probe was imprecise because the probe tended to swing back and forth as it was moved between sample points. The swing was exaggerated by the effects of wind. The position of CS90 meant that only the front half of each load could be sampled. The size of individual samples was related to depth of grain in the trailer and this varied within and between loads.
2.4. Store 4 The Samplex CS90 was situated some distance from the laboratory and, during normal sampling in which 8 samples were collected/load, the samples were accumulated at the CS90 and then conveyed by suction to the laboratory. The bulked samples were then passed through a mixer/divider to produce a working sample for analysis. Therefore, during normal sampling procedures, it was not possible to obtain samples from individual positions within a load. For the purposes of this investigation, 8 loads were sampled so that each of the eight individual samples/load was conveyed to the laboratory and collected before the next sample was taken. This was a time consuming and disruptive process so that it was only possible to sample a single load/day. 3. Weights of samples collected. The weights of the individual samples collected from the loads at each store are summarised in Table 1. The wide variation in the weights of samples both between and within loads found at the two stores where grain was sampled with a CS90 relates to the variation in the depth of grain at different parts of the load. The variation did not occur with the manual spear because, irrespective of the depth of grain, the spear could always be inserted to its full length. 4. Analysis of the quality parameters of the grain The results of the quality analysis done using the Foss Infratec Grain Analyser are given in Tables 2, 3, 4 and 5. The results of assessing the level of fine material (screenings) are also given. For stores 2 and 3 the amount of fine material was established by the project staff using a manual sieve but data for the additional tests done by store staff at Store 1 using a mechanical shaker are also included. The storekeeper at Store 3 provided the project with the results of intake sampling of the store used for filling the loads sampled as part of this project. Obviously, the grain sampled during the project (~ 250 tonnes) represented a very small part of the 4500 tonnes contained in the store. However, values are given in Table 5 allow some comparisons to be made with the results obtained by sampling loads leaving the store after about 10 months storage (Table 4). The intake sampling procedure used at the Store 3 was to collect samples from three points from each load and to mix these samples to give a composite that was used for analysis. The analyses were done using a Foss Infratec that was calibrated to the same standards as applied to the instrument used during the project. A summary of the storekeeper’s analysis results is given in Table 6.
11
Weight in grams
Store Load Max. Min. Mean 1 738.7 476.8 604.2 2 725.4 615.2 670.6 3 808.5 469.1 654.5 4 826.4 425.0 649.4 5 761.9 437.4 604.9 6 721.6 487.3 610.5 7 816.1 510.3 677.0 8 732.6 464.4 625.2 9 737.3 471.1 623.1 10 787.9 424.9 638.7
1. Barley Sampled with automatic CS90
1 480.7 378.2 452.3 2 541.3 418.0 471.2 3 485.5 468.8 478.1 4 479.3 368.6 443.4 5 474.4 406.7 455.1 6 481.4 464.2 476.3 7 457.4 389.0 432.3 8 467.4 410.0 445.4 9 462.6 445.8 451.9
2. Wheat Sampled manually
10 463.8 436.3 450.6
1 1062.5 470.1 824.6 2 790.8 458.9 560.5 3 760.2 760.2 760.2 4 730.9 427.6 538.2 5 846.5 390.8 599.1 6 799.6 466.0 605.3 7 765.5 117.6 487.3
3. Wheat Sampled with non-automatic CS90
8 736.5 490.2 612.3
1 633.9 449.2 525.2 2 673.0 552.3 597.0 3 627.6 483.7 571.0 4 922.8 566.6 642.7 5 611.4 483.3 546.1 6 641.5 571.6 604.0 7 663.0 552.9 606.0
4. Wheat sampled with automatic CS90
8 616.1 59.60 470.1
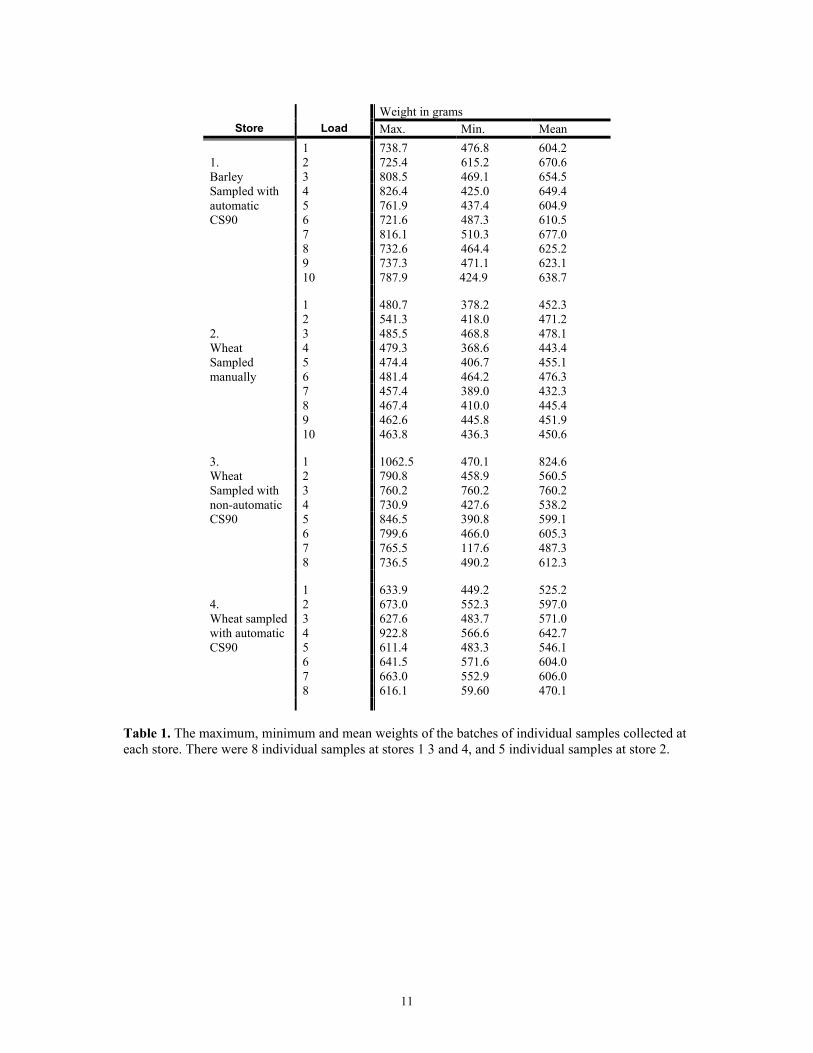
Table 1. The maximum, minimum and mean weights of the batches of individual samples collected at each store. There were 8 individual samples at stores 1 3 and 4, and 5 individual samples at store 2.

12
Nitrogen (% dm) Moisture (%) Specific Wt
kg/hl Fines (%)
Load 1 Store Project Maximum 1.77 14.4 69.1 4.6 2.9 Minimum 1.74 13.8 64.8 3.2 1.7 Mean 1.79 14.0 67.7 3.6 2.4
Load 2 Maximum 1.77 14.4 69.0 3.9 2.6 Minimum 1.72 13.7 68.1 3.1 2.1 Mean 1.78 14.0 68.5 3.6 2.3
Load 3 Maximum 1.75 14.1 69.5 4.3 3.2 Minimum 1.72 13.8 67.9 2.9 1.6 Mean 1.77 13.9 68.8 3.6 2.2 Load 4 Maximum 1.76 14.3 70.0 3.6 2.8 Minimum 1.75 13.8 68.4 2.9 1.7 Mean 1.78 14.0 69.1 3.4 2.0
Load 5 Maximum 1.76 14.3 69.7 5.2 2.9 Minimum 1.72 13.8 68.2 3.3 1.9 Mean 1.79 14.1 69.2 4.2 2.4
Load 6 Maximum 1.75 14.1 69.1 5.6 3.3 Minimum 1.72 13.8 68.3 4.3 2.0 Mean 1.78 14.0 68.7 4.8 2.7
Load 7 Maximum 1.75 14.3 69.2 6.4 2.9 Minimum 1.74 14.0 68.5 4.2 1.9 Mean 1.77 14.2 68.7 5.1 2.3
Load 8 Maximum 1.76 15.0 69.5 5.5 3.4 Minimum 1.75 13.7 68.5 3.4 2.1 Mean 1.78 14.2 68.9 4.4 2.6
Load 9 Maximum 1.76 14.1 69.4 4.4 3.4 Minimum 1.72 13.8 68.5 3.7 2.0 Mean 1.78 14.0 68.9 4.0 2.6
Load 10 Maximum 1.74 14.5 69.0 5.4 3.5 Minimum 1.60 13.8 68.0 3.0 1.9 Mean 1.78 14.1 68.6 4.5 2.5
Table 2. Maximum, minimum and mean values for the analysis of the eight individual barley samples collected at Store 1.
13
Protein (%dm) Moisture (%) Hardness
Specific Wt kg/hl Fines %
Load 1 Maximum 11.2 13.7 41.4 76.3 2.9 Minimum 10.8 13.4 37.1 72.9 1.8 Mean 11.0 13.5 39.0 75.1 2.4
Load 2 Maximum 11.2 14.7 40.5 75.0 2.2 Minimum 10.9 13.8 34.1 72.1 1.7 Mean 11.0 14.2 38.0 73.9 1.9
Load 3 Maximum 11.1 13.9 43.0 76.3 2.4 Minimum 10.7 13.7 35.6 75.2 1.9 Mean 10.9 13.7 38.0 75.7 2.2
Load 4 Maximum 11.3 14.1 37.9 74.9 2.1 Minimum 10.7 13.8 31.6 73.7 1.7 Mean 11.0 13.9 35.4 74.4 1.8
Load 5 Maximum 11.1 14.2 38.4 75.5 2.1 Minimum 10.6 13.5 34.3 73.3 1.6 Mean 10.9 13.9 36.8 74.8 1.9
Load 6 Maximum 11.2 14.0 35.6 76.3 2.9 Minimum 10.8 13.3 28.7 74.8 2.0 Mean 11.0 13.6 33.0 75.8 2.4
Load 7 Maximum 11.1 14.9 36.5 75.2 2.5 Minimum 10.5 14.3 29.3 74.4 1.7 Mean 10.8 14.6 32.4 74.9 2.1
Load 8 Maximum 10.6 14.5 31.7 75.4 2.2 Minimum 10.2 14.3 24.1 74.5 1.8 Mean 10.4 14.4 28.6 75.0 2.0
Load 9 Maximum 11.0 14.8 37.2 75.6 2.3 Minimum 9.9 14.5 16.5 73.8 1.9 Mean 10.6 14.7 29.2 74.6 2.1
Load 10 Maximum 11.6 15.7 40.5 75.5 2.1 Minimum 10.9 14.6 16.6 73.5 1.4 Mean 11.2 15.0 33.7 74.8 1.8
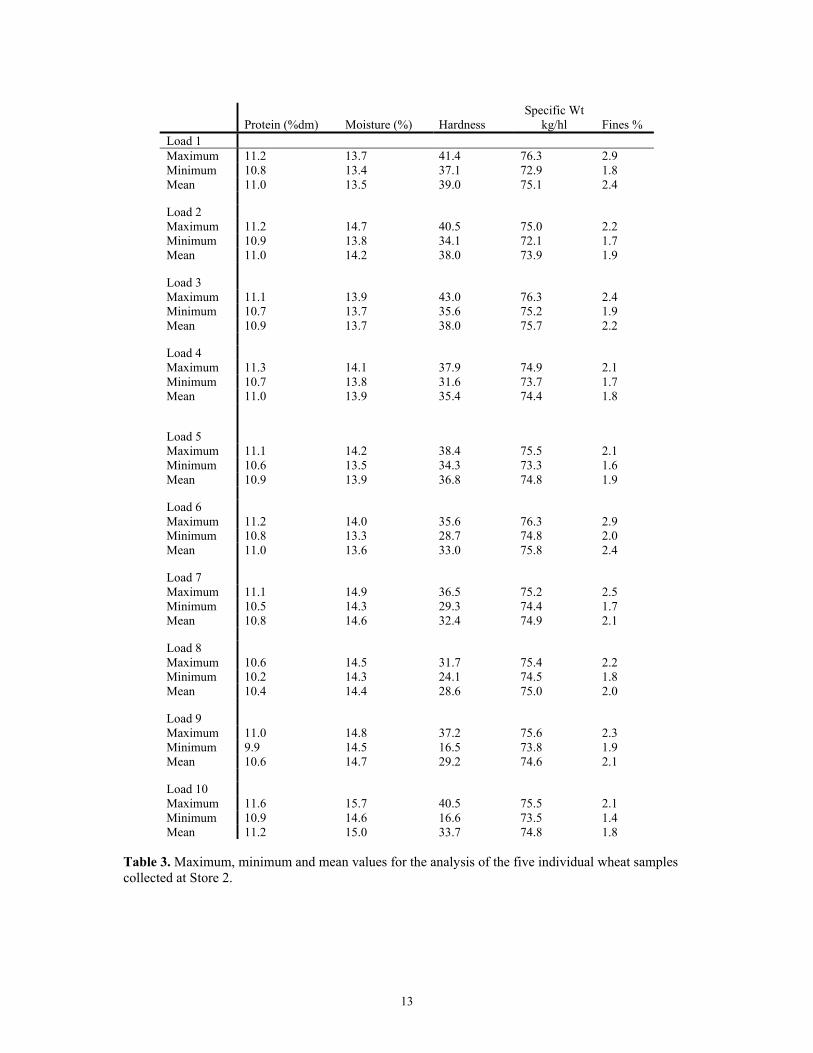
Table 3. Maximum, minimum and mean values for the analysis of the five individual wheat samples collected at Store 2.

14
Protein (% dm) Moisture (%) Hardness
Specific Wt, kg/hl Fines (%)
Load 1 Maximum 14.0 14.3 62.7 82.6 1.4 Minimum 13.7 14.1 55.9 82.0 0.5 Mean 13.9 14.1 58.5 82.4 0.8
Load 2 Maximum 14.0 14.1 59.5 82.5 1.3 Minimum 13.8 14.0 55.9 81.8 1.1 Mean 13.9 14.0 57.8 82.1 1.2
Load 3 Maximum 14.2 14.0 58.4 82.6 1.4 Minimum 13.7 13.9 53.1 81.4 1.0 Mean 13.9 14.0 55.7 82.2 1.2
Load 4 Maximum 14.1 14.0 59.5 82.9 1.2 Minimum 13.8 13.9 54.7 82.4 0.9 Mean 14.0 14.0 57.5 82.7 1.0
Load 5 Maximum 14.3 14.1 77.3 83.2 1.2 Minimum 14.0 13.8 53.8 82.8 0.6 Mean 14.1 13.9 61.2 83.0 1.0
Load 6 Maximum 14.1 14.1 59.5 83.0 1.2 Minimum 13.8 13.9 55.8 82.2 0.7 Mean 13.9 14.0 57.3 82.7 0.8
Load 7 Maximum 13.9 14.1 58.7 82.8 1.2 Minimum 13.7 14.0 56.5 82.0 0.8 Mean 13.8 14.0 57.4 82.4 0.9
Load 8 Maximum 13.9 14.0 58.9 82.9 1.3 Minimum 13.8 13.9 53.7 81.8 0.9 Mean 13.9 14.0 57.2 82.5 1.2
Table 4. Maximum, minimum and mean values for the analysis of the eight individual wheat samples collected at Store 3.
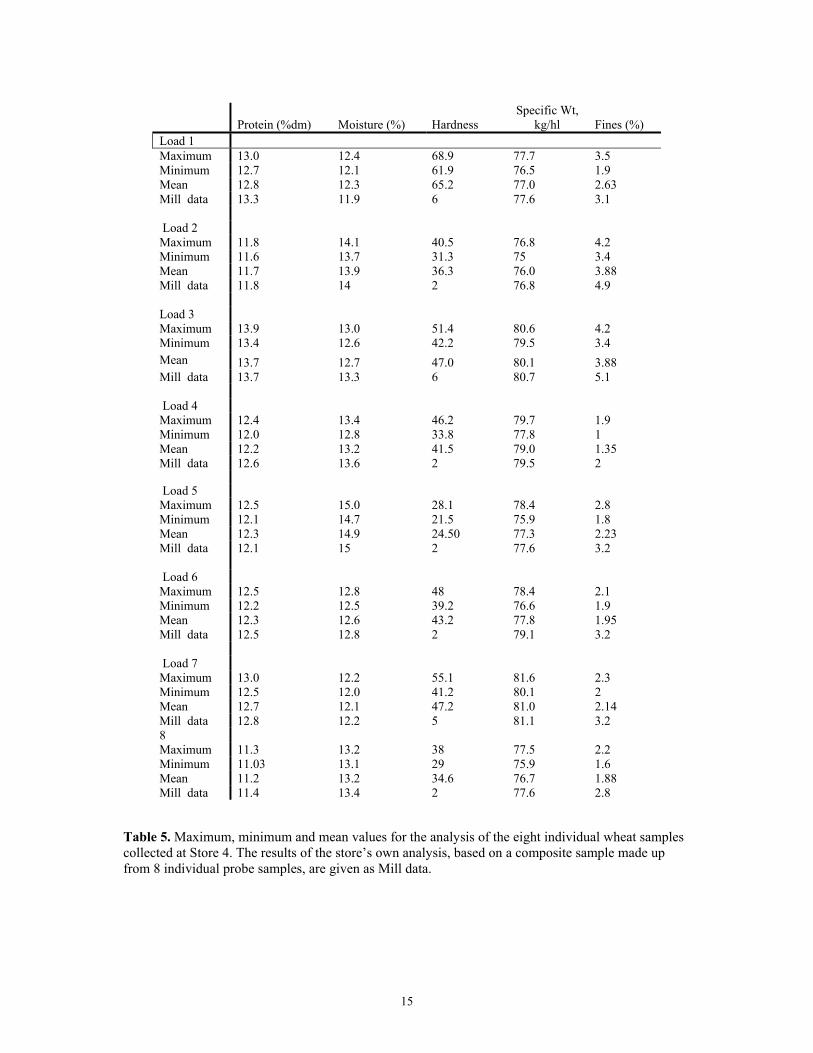
15
Protein (%dm) Moisture (%) Hardness
Specific Wt, kg/hl Fines (%)
Load 1 Maximum 13.0 12.4 68.9 77.7 3.5 Minimum 12.7 12.1 61.9 76.5 1.9 Mean 12.8 12.3 65.2 77.0 2.63 Mill data 13.3 11.9 6 77.6 3.1 Load 2 Maximum 11.8 14.1 40.5 76.8 4.2 Minimum 11.6 13.7 31.3 75 3.4 Mean 11.7 13.9 36.3 76.0 3.88 Mill data 11.8 14 2 76.8 4.9 Load 3 Maximum 13.9 13.0 51.4 80.6 4.2 Minimum 13.4 12.6 42.2 79.5 3.4 Mean 13.7 12.7 47.0 80.1 3.88 Mill data 13.7 13.3 6 80.7 5.1 Load 4 Maximum 12.4 13.4 46.2 79.7 1.9 Minimum 12.0 12.8 33.8 77.8 1 Mean 12.2 13.2 41.5 79.0 1.35 Mill data 12.6 13.6 2 79.5 2
Load 5 Maximum 12.5 15.0 28.1 78.4 2.8 Minimum 12.1 14.7 21.5 75.9 1.8 Mean 12.3 14.9 24.50 77.3 2.23 Mill data 12.1 15 2 77.6 3.2 Load 6 Maximum 12.5 12.8 48 78.4 2.1 Minimum 12.2 12.5 39.2 76.6 1.9 Mean 12.3 12.6 43.2 77.8 1.95 Mill data 12.5 12.8 2 79.1 3.2 Load 7 Maximum 13.0 12.2 55.1 81.6 2.3 Minimum 12.5 12.0 41.2 80.1 2 Mean 12.7 12.1 47.2 81.0 2.14 Mill data 12.8 12.2 5 81.1 3.2 8 Maximum 11.3 13.2 38 77.5 2.2 Minimum 11.03 13.1 29 75.9 1.6 Mean 11.2 13.2 34.6 76.7 1.88 Mill data 11.4 13.4 2 77.6 2.8
Table 5. Maximum, minimum and mean values for the analysis of the eight individual wheat samples collected at Store 4. The results of the store’s own analysis, based on a composite sample made up from 8 individual probe samples, are given as Mill data.
16
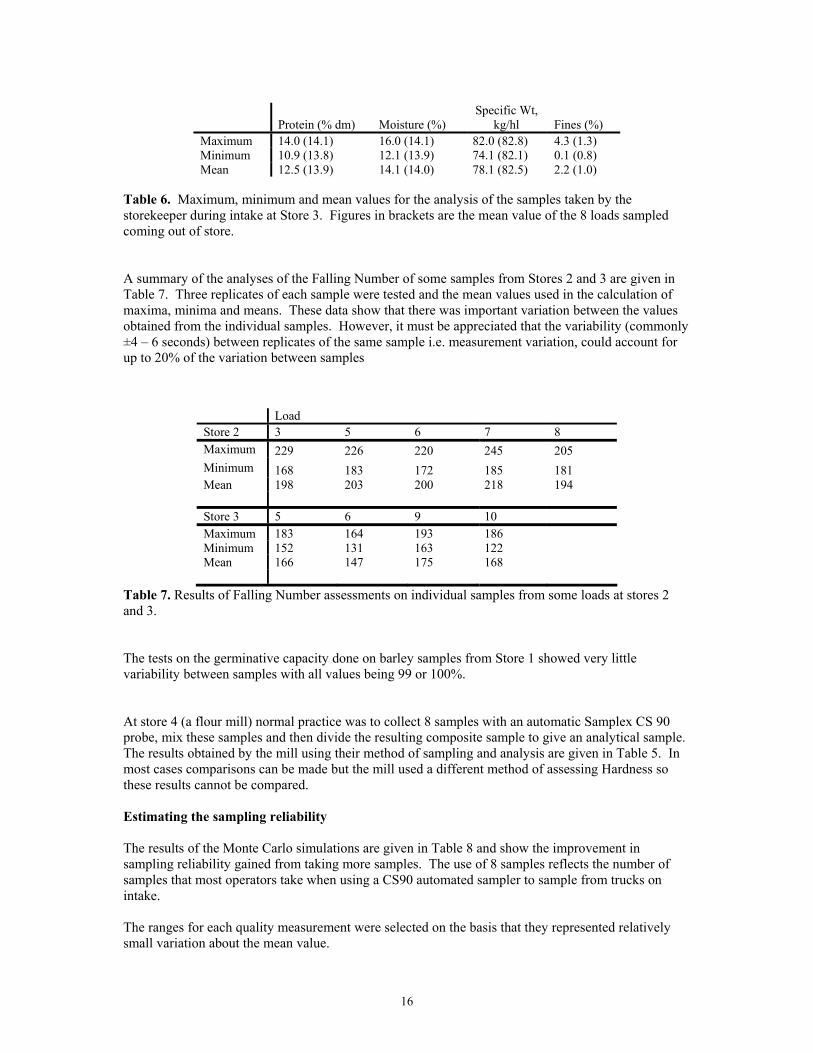
Protein (% dm) Moisture (%) Specific Wt,
kg/hl Fines (%) Maximum 14.0 (14.1) 16.0 (14.1) 82.0 (82.8) 4.3 (1.3) Minimum 10.9 (13.8) 12.1 (13.9) 74.1 (82.1) 0.1 (0.8) Mean 12.5 (13.9) 14.1 (14.0) 78.1 (82.5) 2.2 (1.0)
Table 6. Maximum, minimum and mean values for the analysis of the samples taken by the storekeeper during intake at Store 3. Figures in brackets are the mean value of the 8 loads sampled coming out of store. A summary of the analyses of the Falling Number of some samples from Stores 2 and 3 are given in Table 7. Three replicates of each sample were tested and the mean values used in the calculation of maxima, minima and means. These data show that there was important variation between the values obtained from the individual samples. However, it must be appreciated that the variability (commonly ±4 – 6 seconds) between replicates of the same sample i.e. measurement variation, could account for up to 20% of the variation between samples
Load Store 2 3 5 6 7 8 Maximum 229 226 220 245 205 Minimum 168 183 172 185 181 Mean 198 203 200 218 194
Store 3 5 6 9 10 Maximum 183 164 193 186 Minimum 152 131 163 122 Mean 166 147 175 168
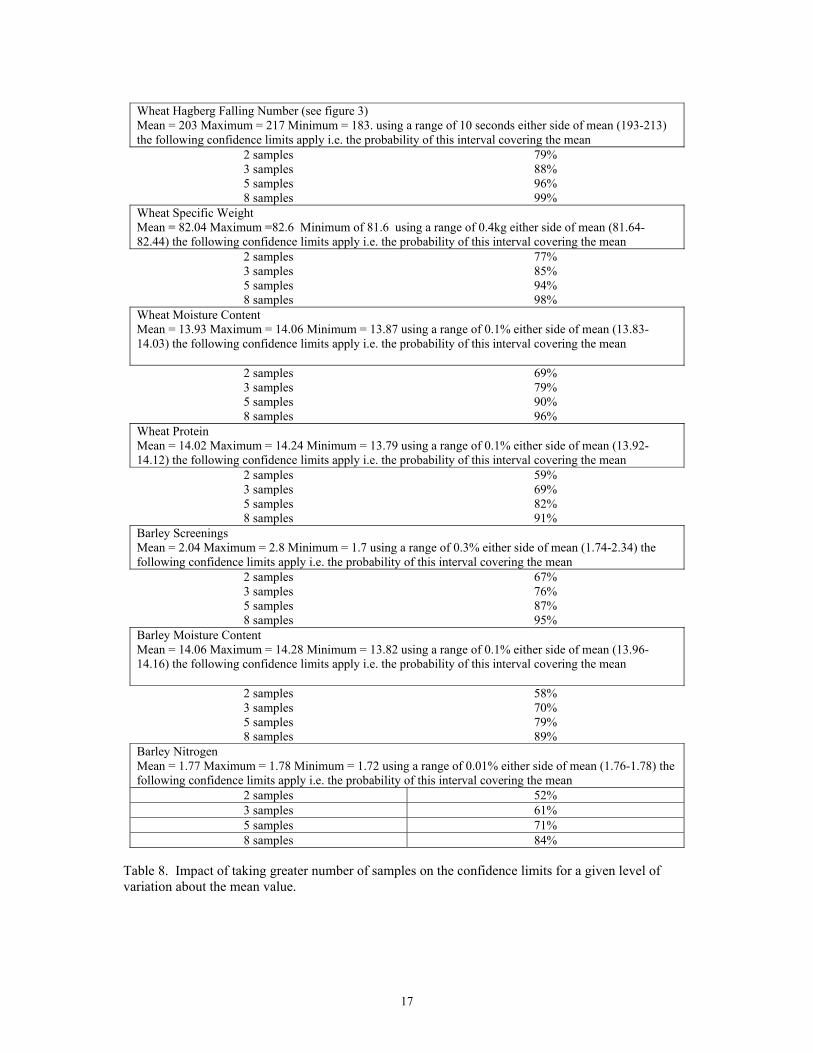
Table 7. Results of Falling Number assessments on individual samples from some loads at stores 2 and 3. The tests on the germinative capacity done on barley samples from Store 1 showed very little variability between samples with all values being 99 or 100%. At store 4 (a flour mill) normal practice was to collect 8 samples with an automatic Samplex CS 90 probe, mix these samples and then divide the resulting composite sample to give an analytical sample. The results obtained by the mill using their method of sampling and analysis are given in Table 5. In most cases comparisons can be made but the mill used a different method of assessing Hardness so these results cannot be compared. Estimating the sampling reliability The results of the Monte Carlo simulations are given in Table 8 and show the improvement in sampling reliability gained from taking more samples. The use of 8 samples reflects the number of samples that most operators take when using a CS90 automated sampler to sample from trucks on intake. The ranges for each quality measurement were selected on the basis that they represented relatively small variation about the mean value.
17
Wheat Hagberg Falling Number (see figure 3) Mean = 203 Maximum = 217 Minimum = 183. using a range of 10 seconds either side of mean (193-213) the following confidence limits apply i.e. the probability of this interval covering the mean
2 samples 79% 3 samples 88% 5 samples 96% 8 samples 99%
Wheat Specific Weight Mean = 82.04 Maximum =82.6 Minimum of 81.6 using a range of 0.4kg either side of mean (81.64-82.44) the following confidence limits apply i.e. the probability of this interval covering the mean
2 samples 77% 3 samples 85% 5 samples 94% 8 samples 98%
Wheat Moisture Content Mean = 13.93 Maximum = 14.06 Minimum = 13.87 using a range of 0.1% either side of mean (13.83-14.03) the following confidence limits apply i.e. the probability of this interval covering the mean
2 samples 69% 3 samples 79% 5 samples 90% 8 samples 96%
Wheat Protein Mean = 14.02 Maximum = 14.24 Minimum = 13.79 using a range of 0.1% either side of mean (13.92-14.12) the following confidence limits apply i.e. the probability of this interval covering the mean
2 samples 59% 3 samples 69% 5 samples 82% 8 samples 91%
Barley Screenings Mean = 2.04 Maximum = 2.8 Minimum = 1.7 using a range of 0.3% either side of mean (1.74-2.34) the following confidence limits apply i.e. the probability of this interval covering the mean
2 samples 67% 3 samples 76% 5 samples 87% 8 samples 95%
Barley Moisture Content Mean = 14.06 Maximum = 14.28 Minimum = 13.82 using a range of 0.1% either side of mean (13.96-14.16) the following confidence limits apply i.e. the probability of this interval covering the mean
2 samples 58% 3 samples 70% 5 samples 79% 8 samples 89%
Barley Nitrogen Mean = 1.77 Maximum = 1.78 Minimum = 1.72 using a range of 0.01% either side of mean (1.76-1.78) the following confidence limits apply i.e. the probability of this interval covering the mean
2 samples 52% 3 samples 61% 5 samples 71% 8 samples 84%
Table 8. Impact of taking greater number of samples on the confidence limits for a given level of variation about the mean value.

18
Figures 3 and 4 show two graphical representations of the results of the Monte Carlo simulations on reliability of results from using differing numbers of samples.
Wheat Load 5 Hagberg falling numberMean 203 Max 217 Min 183
-1000
0
1000
2000
3000
4000
5000
6000
7000
8000
9000
160 180 200 220 240
Hagberg falling number
Freq
uenc
y 2 samples3 samples5 samples8 samples
Figure 3 Graphical representation of the impact of sampling intensity on reliability of result for Hagberg falling number in a lorry load of wheat.
Barley Load 5 Moisture contentMean 14.06 Max 14.28 Min 13.82
-1000
0
1000
2000
3000
4000
5000
6000
7000
8000
13.4 13.6 13.8 14 14.2 14.4 14.6 14.8
Moisture content
Freq
uenc
y 2 samples3 samples5 samples8 samples
Figure 4 Graphical representation of the impact of sampling intensity on reliability of result for moisture content in a lorry load of barley.
19
When the differences between the results of using a mean of individual sample measurements, a mean from a series of samples from a composite or the mean from a series of samples taken from a single large bulk sample were compared there were no statistically significant difference between them. On some occasions the difference was positive whilst in others the difference was negative. The types of samples that showed the least difference (analysed by eye) were the mean of the eight individual samples and the mean of the 5 samples from the composite sample.
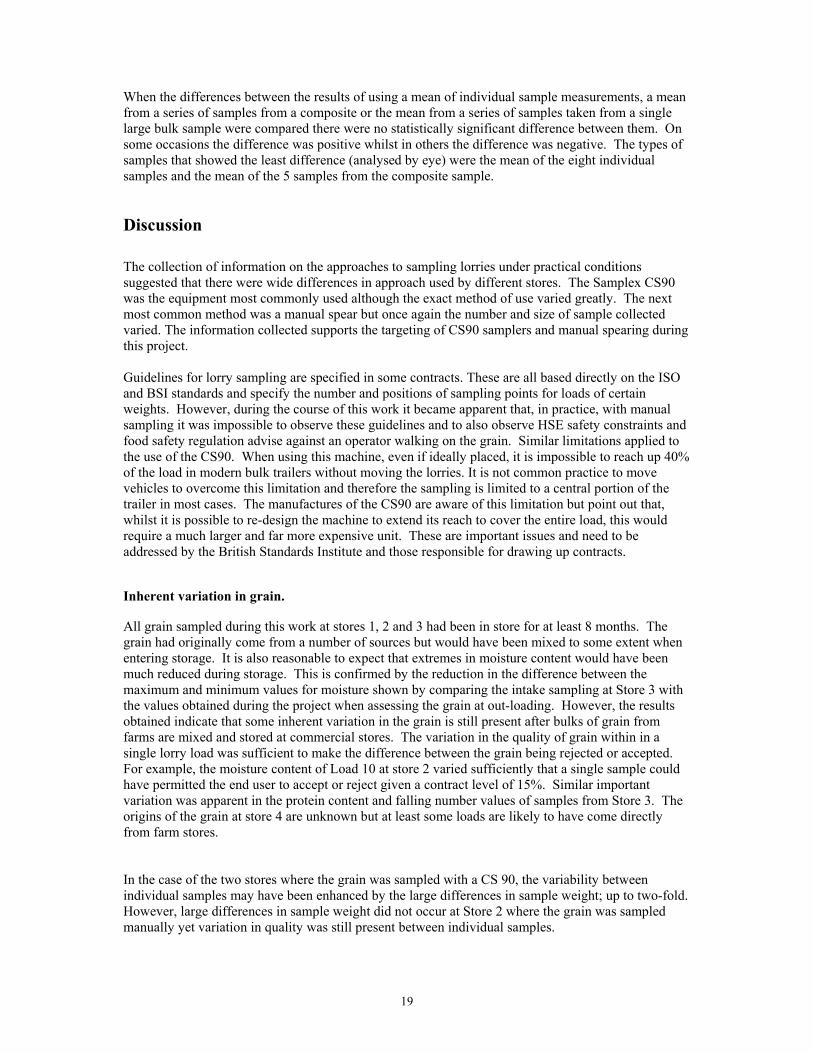
Discussion The collection of information on the approaches to sampling lorries under practical conditions suggested that there were wide differences in approach used by different stores. The Samplex CS90 was the equipment most commonly used although the exact method of use varied greatly. The next most common method was a manual spear but once again the number and size of sample collected varied. The information collected supports the targeting of CS90 samplers and manual spearing during this project. Guidelines for lorry sampling are specified in some contracts. These are all based directly on the ISO and BSI standards and specify the number and positions of sampling points for loads of certain weights. However, during the course of this work it became apparent that, in practice, with manual sampling it was impossible to observe these guidelines and to also observe HSE safety constraints and food safety regulation advise against an operator walking on the grain. Similar limitations applied to the use of the CS90. When using this machine, even if ideally placed, it is impossible to reach up 40% of the load in modern bulk trailers without moving the lorries. It is not common practice to move vehicles to overcome this limitation and therefore the sampling is limited to a central portion of the trailer in most cases. The manufactures of the CS90 are aware of this limitation but point out that, whilst it is possible to re-design the machine to extend its reach to cover the entire load, this would require a much larger and far more expensive unit. These are important issues and need to be addressed by the British Standards Institute and those responsible for drawing up contracts. Inherent variation in grain. All grain sampled during this work at stores 1, 2 and 3 had been in store for at least 8 months. The grain had originally come from a number of sources but would have been mixed to some extent when entering storage. It is also reasonable to expect that extremes in moisture content would have been much reduced during storage. This is confirmed by the reduction in the difference between the maximum and minimum values for moisture shown by comparing the intake sampling at Store 3 with the values obtained during the project when assessing the grain at out-loading. However, the results obtained indicate that some inherent variation in the grain is still present after bulks of grain from farms are mixed and stored at commercial stores. The variation in the quality of grain within in a single lorry load was sufficient to make the difference between the grain being rejected or accepted. For example, the moisture content of Load 10 at store 2 varied sufficiently that a single sample could have permitted the end user to accept or reject given a contract level of 15%. Similar important variation was apparent in the protein content and falling number values of samples from Store 3. The origins of the grain at store 4 are unknown but at least some loads are likely to have come directly from farm stores. In the case of the two stores where the grain was sampled with a CS 90, the variability between individual samples may have been enhanced by the large differences in sample weight; up to two-fold. However, large differences in sample weight did not occur at Store 2 where the grain was sampled manually yet variation in quality was still present between individual samples.

20
Another factor that could influence the apparent variation between samples is any change to the method of measurement. The assessment of this factor was not a direct part of this project. However, some observations on the effects of changes in the method of measurement on the results were obtained. Large difference in screenings were found in the same samples of barley (Store 1) depending on whether they were tested by the store staff or project staff (Table 2). The mechanical shaker used at the store always produced a higher assessment of fine material (+ about 30%) than the manual sieving used by the project staff. However, this is not an indication of variability in the grain because the difference between the 2 methods remained about the same. These findings are not surprising as the model and setting of the shaker and the age of the sieves can influence the results (C. Finch, Pneumac, pers. com.). In addition, the results from all samples of both wheat and barley collected from lorries and those from other parts of the Grain Sampling and Analysis (GSA) project, indicate that the distribution of fine material or screenings within a bulk or lorry-load of grain is variable and, as far as can be judged from results, random. As a result, the measurement of screenings is very likely to be subject to larger errors of prediction than other quality parameters. This may be worthy of more detailed research and perhaps should be born in mind when considering contractual obligations. Tests done on other quality parameters throughout the GSA project on the Foss Infratec machines suggest that this instrument is relatively consistent. Where the same sample was put through the machine multiple times there was almost no variation in the results. The results obtained at Store 4 suggest that the values obtained by the project analysis were in general lower than those obtained by the mill analysis although the differences were mostly relatively small. It is possible that this trend was more a factor of analytical methods than sampling error. The largest difference between the two assessments was always in the estimation of screenings. In general, the variation between samples taken from the same lorry-load was not of statistical significance. However, in many cases these differences were of great commercial importance. For example, with barley from Store 1 the screenings could vary by 1.5% and the moisture by 1.4% between samples from the same load. With milling wheat from store 3 the protein could vary by 0.5% and the screenings by 1% within a load. These data clearly demonstrate the dangers of basing a quality assessment of a lorry-load of grain on a single discrete sample irrespective of the method of collection. Statistical analysis of the data provided useful information. The amount of variability for each quality parameter within a load or a group of loads was calculated and the ability to predict this variability was assessed. Obviously, each quality parameter behaved differently but most was broadly similar except screenings where the variation was much greater. Once the variability was calculated, limits could be set for the accuracy of prediction (for example: ± 0.05% for protein in wheat). The numbers of samples used has a fundamental influence on the ability to approach these limits. A single sample may only offer a 50% chance that the result will be close to such limits. In practical terms this means that when lorries are sampled with a single sample, in the event of a dispute, there is a 50/50 chance that re-sampling will give a different result. The confidence of prediction rises as the number of samples used in the assessment rises and 8 samples/load would appear to give a good compromise between confidence in the results and workload. There was no relationship between quality prediction and the position from which a sample was collected: the variability appeared random. Therefore, the exact siting of the sample points is of much less importance than the number of sample points, although spreading the points evenly over the entire load should be preferred. Collecting multiple samples (preferably 8/load), mixing these thoroughly and then using a sub-sample for quality assessment would appear to be an effective approach to sampling lorry-loads of grain. The results from this work confirm the earlier limited work on sampling lorries (HGCA Project Report 79) but it does not appear possible to implement the use of the methodology suggested in ISO or BSI Standards because of limitations in the current equipment. However, they provide the basis for a new approach to standards with a sound technical base and may allow some general codes of practice to be constructed.

21
Protocol for lorry sampling A protocol for lorry sampling has been developed on the basis of this research and is presented in Annex 1.
Recommendations Screenings: Throughout the sampling component of the GSA Project the error of prediction of screenings has been greater than other quality parameters. This difficulty does not seem to be reflected in commercial contracts. It is recommended that more work be done to establish better limits of assessment that could be used that would provide a fairer approach for both buyers and sellers of grain. National and International Standards: The results of this work should be discussed with the appropriate Standards organisations with a view to producing revised standards that correctly reflect the limitations of equipment and safety concerns. Code of Practice: Consideration should be given, in cooperation with appropriate organisations, to the drawing up of guidelines for the effective sampling of loads of grain. Influence of method of measurement: Consider the interchange of samples between the project and commercial laboratories to investigate the effects of different methods of measuring quality parameters of grain.
Acknowledgements The authors of this report wish to thank Banks-Cargill Agriculture John Derybishire, Greencore Malting Group, Alan Johnston, and Rank Hovis Limited for allowing this work to take place at their premises. We also wish to thank Mark Charlton and Allied Technical Centre for assistance with analytical equipment. These guidelines are intended to offer advice to any organisation that sample grain in lorries. They are not intended as dogmatic instructions that can be applied at every site and there may be a need for some flexibility in approach. However, if used, the guidelines will help to minimise sampling error and provide a consistent method of collecting samples from lorry-loads of grain.

22
Annex 1
Protocol for collecting samples from lorry-loads of grain: General:
• All equipment should be clean and in good working condition. • Operators should be familiar with the equipment and have an understanding of the problems
of sampling grain. • Safety should always be the first consideration in any sampling operation.
Taking manual samples:
• Use a manual spear that is at least 1.5m long. • Use a spear that will collect multiple sub-samples from different depths. • Collect about 500g/sample point. This may require 2 insertions/sample point. • Collect samples from at least 5 (preferably 8) sample points/load. These points should be
spread as widely as possible across the load without risk to the operator. In some case, it may be appropriate to move the lorry to give better access.
• Add the samples together to form a composite sample representing the load. • Mix the composite sample thoroughly. • Divide the composite sample with a sample divider. If this is not available the sample should
be divided by coning and quartering to give a working sample. Failure to use a sample divider or to cone and quarter the sample is likely to increase the error in the measurements (particularly screenings).
• It may be appropriate to retain part of the composite sample in case of any dispute over the grain quality.
Taking samples with a remote sampling probe:
• Where the amount of grain collected per insertion can be adjusted, it may be appropriate to set this to maximum. This will help to overcome the collection of small samples when the spear is inserted into troughs in the load.
• Try to ensure that the lorry is positioned with the sampler about half way along the trailer so that it can access as much of the load as possible.
• If the sampler has an automatic programme, choose the option that collects 8 samples from different points.
• If the probe is controlled manually, collect 8 samples/load from different points spread as far apart as possible over the load.
• Mix the composite sample thoroughly and then divide using a sample divider or by coning and quartering. Failure to use a sample divider or to cone and quarter the sample is likely to increase the error in the measurements (particularly screening).
• It may be appropriate to retain part of the composite sample in case of any dispute over the grain quality.