turkey grain and feed annual 2014 turkey grain and … gain publications/grain and feed...the most...
TRANSCRIPT
THIS REPORT CONTAINS ASSESSMENTS OF COMMODITY AND TRADE ISSUES MADE BY
USDA STAFF AND NOT NECESSARILY STATEMENTS OF OFFICIAL U.S. GOVERNMENT
POLICY
Date:
GAIN Report Number:
Approved By:
Prepared By:
Report Highlights:
Post forecasts Turkey’s production of wheat at 15.8 million metric tons (MMT), durum wheat at 1.9
MMT, barley at 5.8 MMT, corn at 4.9 MMT and rice at 740,000 metric tons (MT).
Drought is still a big concern and has already affected wheat and barley in Central Anatolia and the
Cukurova region in the South. Traders are optimistic due to recent rainfalls in March, but Post has
observed problems with crop growth. The Turkish wheat market is still practically closed for U.S
wheat due to genetically engineered (GE) testing requirements applied to U.S wheat only. Russian
traders are hesitant to offer wheat prices to Turkey due to an expected price increase.
Samet Serttas, Agricultural Specialist
Jess K. Paulson, Agricultural Attaché
2014 Turkey Grain and Feed Annual
Grain and Feed Annual
Turkey
TR4009
3/28/2014
Required Report - public distribution
Commodities:
Production:
Wheat
Wheat production is forecasted at 15.8 million metric tons (MMT). Central Anatolia, the Cukurova
region, parts of the Black Sea and Eastern Anatolia are suffering from dry weather conditions. Durum
wheat production is forecasted at 1.9 MMT.
Cukurova region
Much of the region suffered from dry weather conditions after sowing. Wheat area remained the same
compared to the previous year, but has decreased from the long term average. Wheat area has been
declining in the region due to an increase in citrus and deciduous fruit area. Moreover, second crop corn
production in the region has decreased dramatically for the last five years and is expected to disappear
in the next five years. New irrigation projects to the North of Adana (Imamoglu) will open 75,000 ha
for irrigation. This area will shift from wheat to first crop corn and cotton starting from 2015.
Wheat germination was late and a delayed harvest of 20 days is expected. The major problem in the
region is high temperatures in March, which resulted in early head formation. The stem height is still
short. Irregular germination also will cause low yields in the region. In some regions farmers have
already replanted corn to replace lost wheat. Post estimates that there will be a loss of at least 20
percent of yield in the region, which may increase with the continuation of abnormal high temperatures.
Regions MY
2011
Long
term
Harves
t Time MY 2012 MY 2013 MY 2014
Rice, Milled
Corn
Barley
Wheat, Durum
Wheat
Avg.
yield
(MT/H
A)
Avg.
yield
(MT/H
A)
Harveste
d Area Productio
n (MT)
Harveste
d Area Productio
n (MT)
Harveste
d Area Productio
n (MT)
(ha) (ha) (ha)
Cukurov
a region 4.7 4.5-5.5
May
10-
June
10
260,000 1,250,000 250,000 1,300,000 250,000 1,100,000
Hatay
region 4.7 5-5.5
May
25-
June
25
85,000 250,000 85,000 280,000 85,000 230,000
Southea
st region 2.9 3-3.5
May
15-
June
25
900,000 2,250,000 930,000 2,500,000 920,000 2,350,000
Central
Anatolia 2.38 1.5-2
June
25-
July
25
2,990,00
0 4,500,000
2,905,00
0 6,200,000
2,900,00
0 4,750,000
Polatli 3.4 3.3
June
15-
July
20
130,000 300,000 130,000 450,000 130,000 300,000
Aegean
region 3 3
May
25-
June
25
550,000 1,500,000 500,000 1,650,000 500,000 1,600,000
Aydin
region 4 4
May
20-
June
10
6,000 45,000 6,000 45,000 6,000 45,000
Thrace 4.1 4.1
June
15-
July
15
600,000 2,450,000 600,000 2,500,000 600,000 2,350,000
Other
regions 1.4 1.5
June
15-
July
15
2,300,00
0 3,200,000
2,300,00
0 3,075,000
2,320,00
0 3,075,000
Total 2.3 2.3
My
15-
July15
7,821,00
0
15,745,00
0 7,706,00
0
18,000,00
0
7,711,00
0
15,800,00
0
Central Anatolia
Central Anatolia is also experiencing dry conditions. The most affected regions are Ankara, Eskisehir,
Aksaray Nevsehir, and part of Konya. Wheat area, and especially durum wheat area, decreased in the
region. Barley area increased due to attractive prices. Wheat area in the region will decrease, especially
land with access to irrigation and corn and sunflower area will increase. The region has attracted a lot
of dairy and feed lot investments. The demand to forage crops are high in the region and will continue
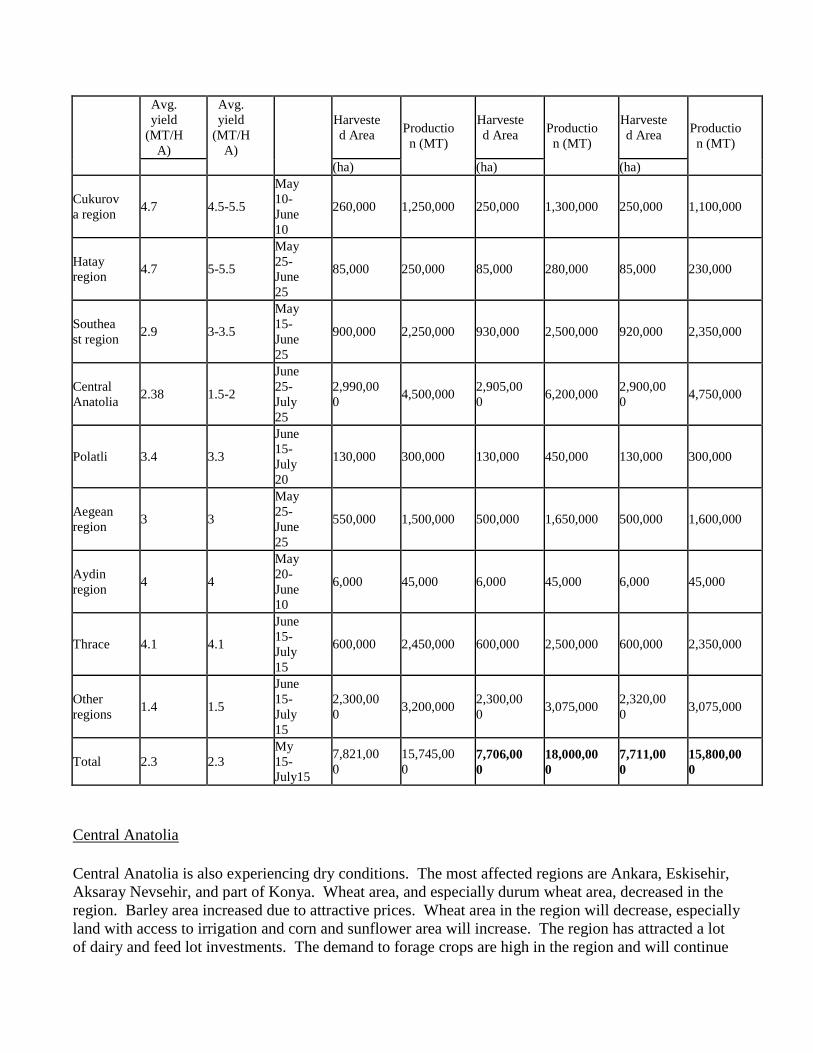
to be higher. New big dairy plants
established in Konya and Aksaray, and
a big dairy and beef processing plant in
Konya are under construction.
This picture was taken in Cihanbeyli,
Konya, on March 19, 2014. Most of
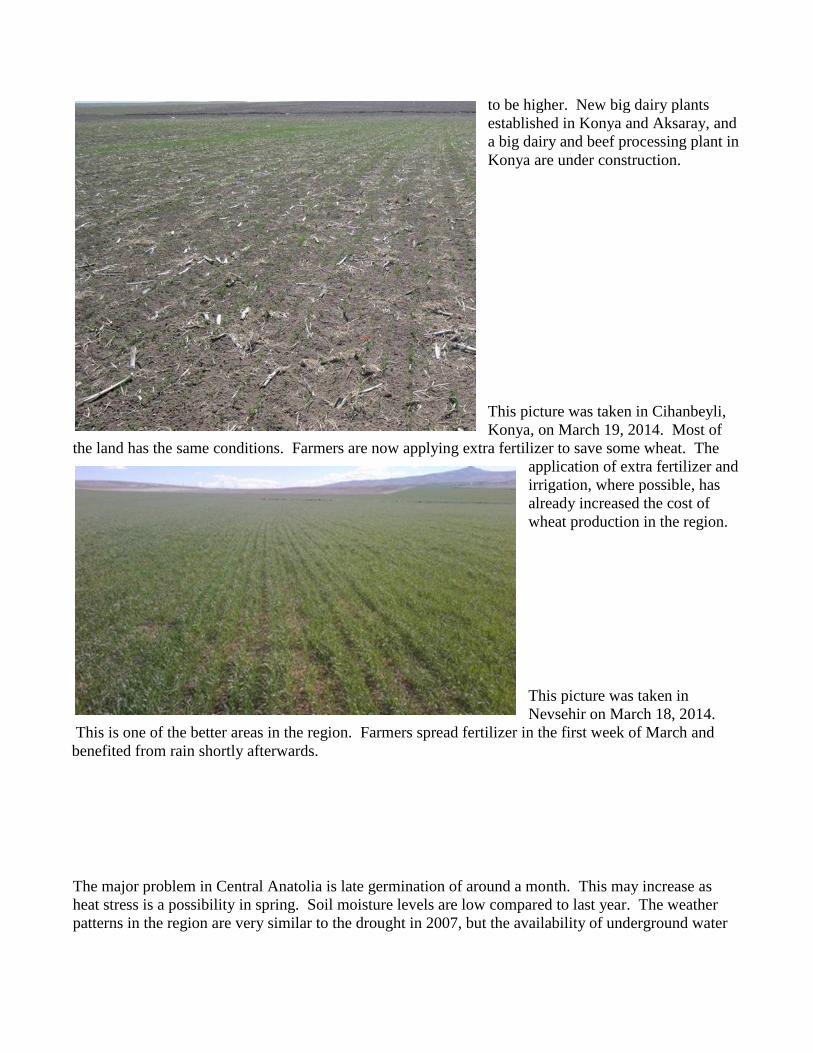
the land has the same conditions. Farmers are now applying extra fertilizer to save some wheat. The
application of extra fertilizer and
irrigation, where possible, has
already increased the cost of
wheat production in the region.
This picture was taken in
Nevsehir on March 18, 2014.
This is one of the better areas in the region. Farmers spread fertilizer in the first week of March and
benefited from rain shortly afterwards.
The major problem in Central Anatolia is late germination of around a month. This may increase as
heat stress is a possibility in spring. Soil moisture levels are low compared to last year. The weather
patterns in the region are very similar to the drought in 2007, but the availability of underground water
is higher than it was then. The first week of March saved most of the wheat in the region, but there will
still be a loss of around 25 percent compared to last year.
Another problem is the durum wheat area and yield. Durum wheat area decreased dramatically in the
region and durum wheat was affected more than other wheat varieties.
Thrace region
The Thrace region and South East of Turkey have the best conditions at the moment for wheat growth.
The major problem in these regions is weak root development, but high stem height. This is already
causing lodging. The picture below was taken in Tekirdag on March 18, 2014. It shows a fair amount
of growth, but the plants are very susceptible to rust disease.
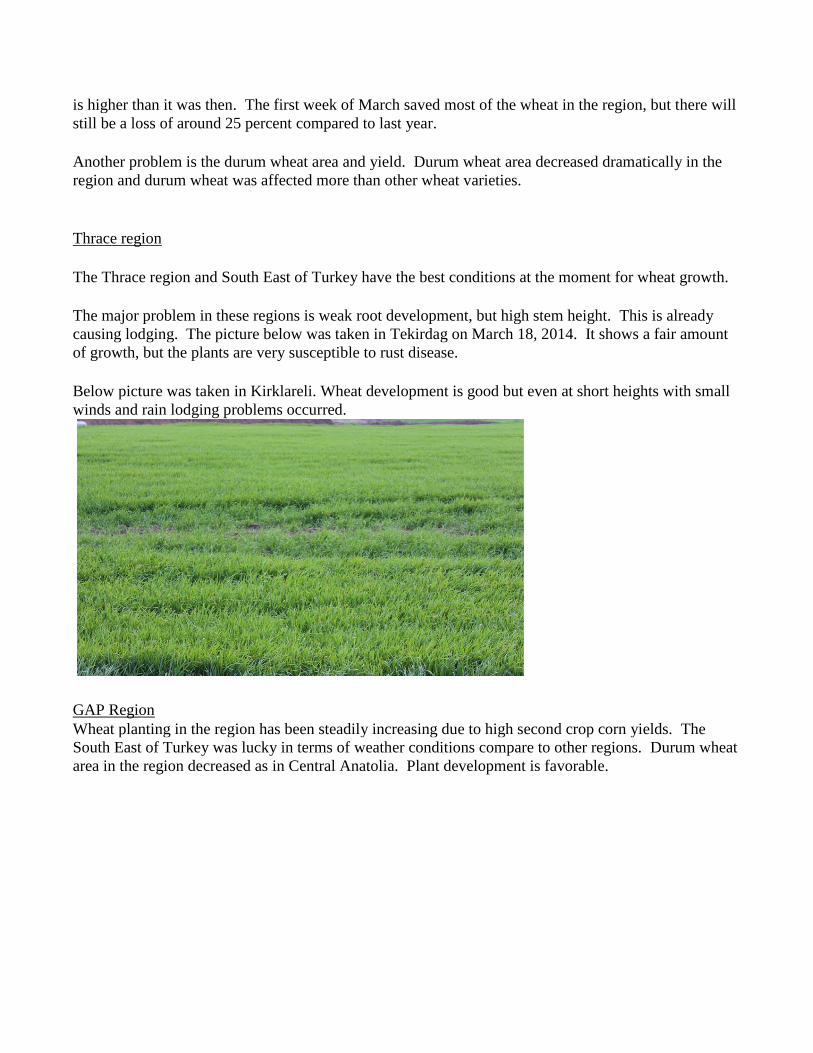
Below picture was taken in Kirklareli. Wheat development is good but even at short heights with small
winds and rain lodging problems occurred.
GAP Region
Wheat planting in the region has been steadily increasing due to high second crop corn yields. The
South East of Turkey was lucky in terms of weather conditions compare to other regions. Durum wheat
area in the region decreased as in Central Anatolia. Plant development is favorable.
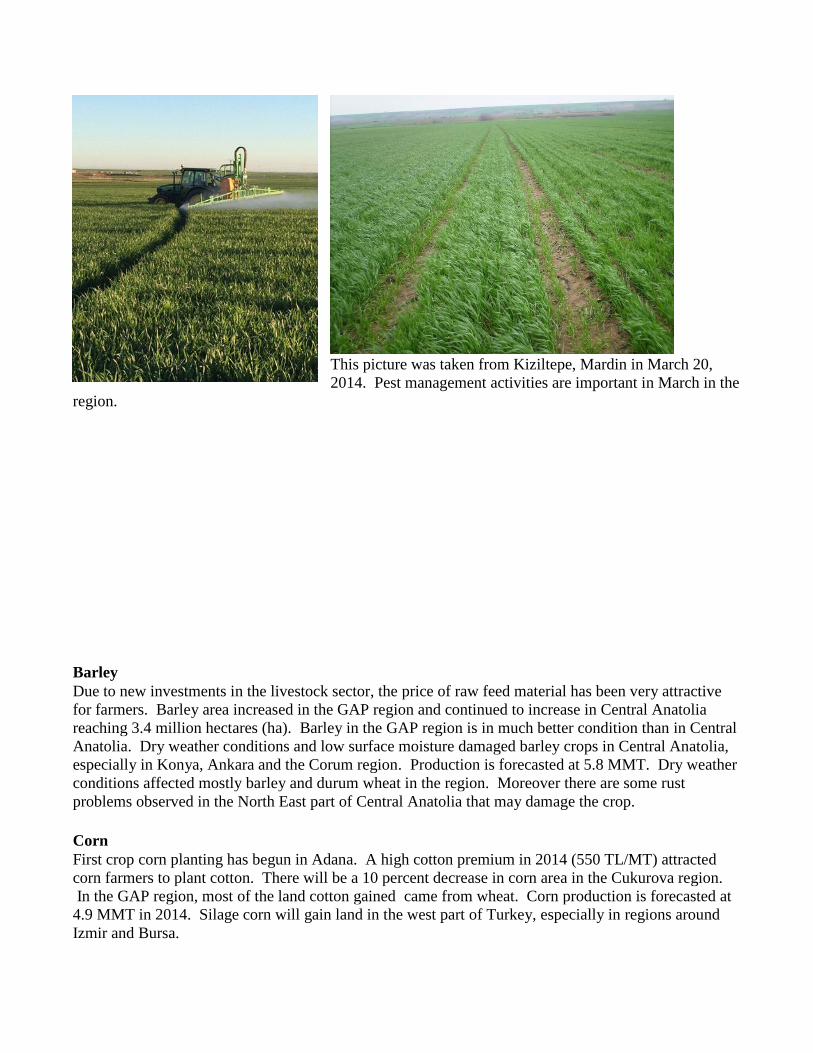
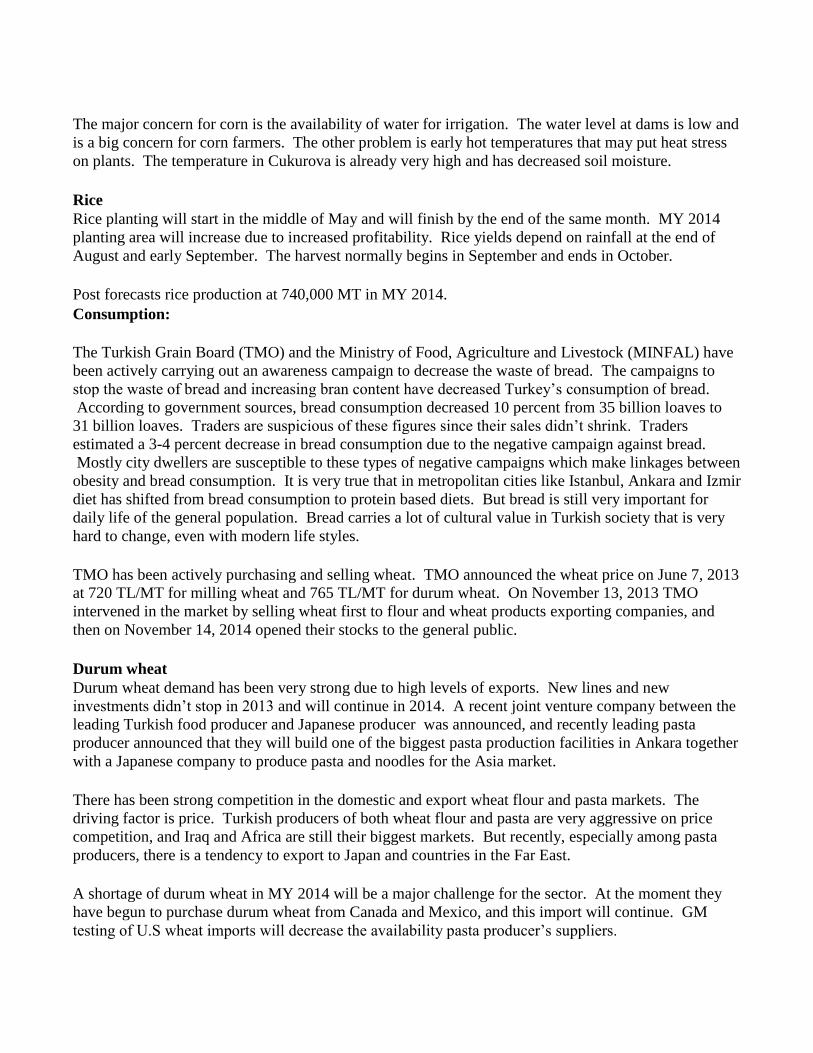
This picture was taken from Kiziltepe, Mardin in March 20,
2014. Pest management activities are important in March in the
region.
Barley
Due to new investments in the livestock sector, the price of raw feed material has been very attractive
for farmers. Barley area increased in the GAP region and continued to increase in Central Anatolia
reaching 3.4 million hectares (ha). Barley in the GAP region is in much better condition than in Central
Anatolia. Dry weather conditions and low surface moisture damaged barley crops in Central Anatolia,
especially in Konya, Ankara and the Corum region. Production is forecasted at 5.8 MMT. Dry weather
conditions affected mostly barley and durum wheat in the region. Moreover there are some rust
problems observed in the North East part of Central Anatolia that may damage the crop.
Corn
First crop corn planting has begun in Adana. A high cotton premium in 2014 (550 TL/MT) attracted
corn farmers to plant cotton. There will be a 10 percent decrease in corn area in the Cukurova region.
In the GAP region, most of the land cotton gained came from wheat. Corn production is forecasted at
4.9 MMT in 2014. Silage corn will gain land in the west part of Turkey, especially in regions around
Izmir and Bursa.
The major concern for corn is the availability of water for irrigation. The water level at dams is low and
is a big concern for corn farmers. The other problem is early hot temperatures that may put heat stress
on plants. The temperature in Cukurova is already very high and has decreased soil moisture.
Rice
Rice planting will start in the middle of May and will finish by the end of the same month. MY 2014
planting area will increase due to increased profitability. Rice yields depend on rainfall at the end of
August and early September. The harvest normally begins in September and ends in October.
Post forecasts rice production at 740,000 MT in MY 2014.
Consumption:
The Turkish Grain Board (TMO) and the Ministry of Food, Agriculture and Livestock (MINFAL) have
been actively carrying out an awareness campaign to decrease the waste of bread. The campaigns to
stop the waste of bread and increasing bran content have decreased Turkey’s consumption of bread.
According to government sources, bread consumption decreased 10 percent from 35 billion loaves to
31 billion loaves. Traders are suspicious of these figures since their sales didn’t shrink. Traders
estimated a 3-4 percent decrease in bread consumption due to the negative campaign against bread.
Mostly city dwellers are susceptible to these types of negative campaigns which make linkages between
obesity and bread consumption. It is very true that in metropolitan cities like Istanbul, Ankara and Izmir
diet has shifted from bread consumption to protein based diets. But bread is still very important for
daily life of the general population. Bread carries a lot of cultural value in Turkish society that is very
hard to change, even with modern life styles.
TMO has been actively purchasing and selling wheat. TMO announced the wheat price on June 7, 2013
at 720 TL/MT for milling wheat and 765 TL/MT for durum wheat. On November 13, 2013 TMO
intervened in the market by selling wheat first to flour and wheat products exporting companies, and
then on November 14, 2014 opened their stocks to the general public.
Durum wheat
Durum wheat demand has been very strong due to high levels of exports. New lines and new
investments didn’t stop in 2013 and will continue in 2014. A recent joint venture company between the
leading Turkish food producer and Japanese producer was announced, and recently leading pasta
producer announced that they will build one of the biggest pasta production facilities in Ankara together
with a Japanese company to produce pasta and noodles for the Asia market.
There has been strong competition in the domestic and export wheat flour and pasta markets. The
driving factor is price. Turkish producers of both wheat flour and pasta are very aggressive on price
competition, and Iraq and Africa are still their biggest markets. But recently, especially among pasta
producers, there is a tendency to export to Japan and countries in the Far East.
A shortage of durum wheat in MY 2014 will be a major challenge for the sector. At the moment they
have begun to purchase durum wheat from Canada and Mexico, and this import will continue. GM
testing of U.S wheat imports will decrease the availability pasta producer’s suppliers.
Barley
Barley demand will again be very strong. New live animal farm establishments are still receiving
government support and the GOT will continue to provide subsidized credit to them. Another important
factor will be new supports to establish beef breed farms in Central Anatolia and East Anatolia.
Moreover, wheat plant height is short and will likely be short at harvest, which will decrease the
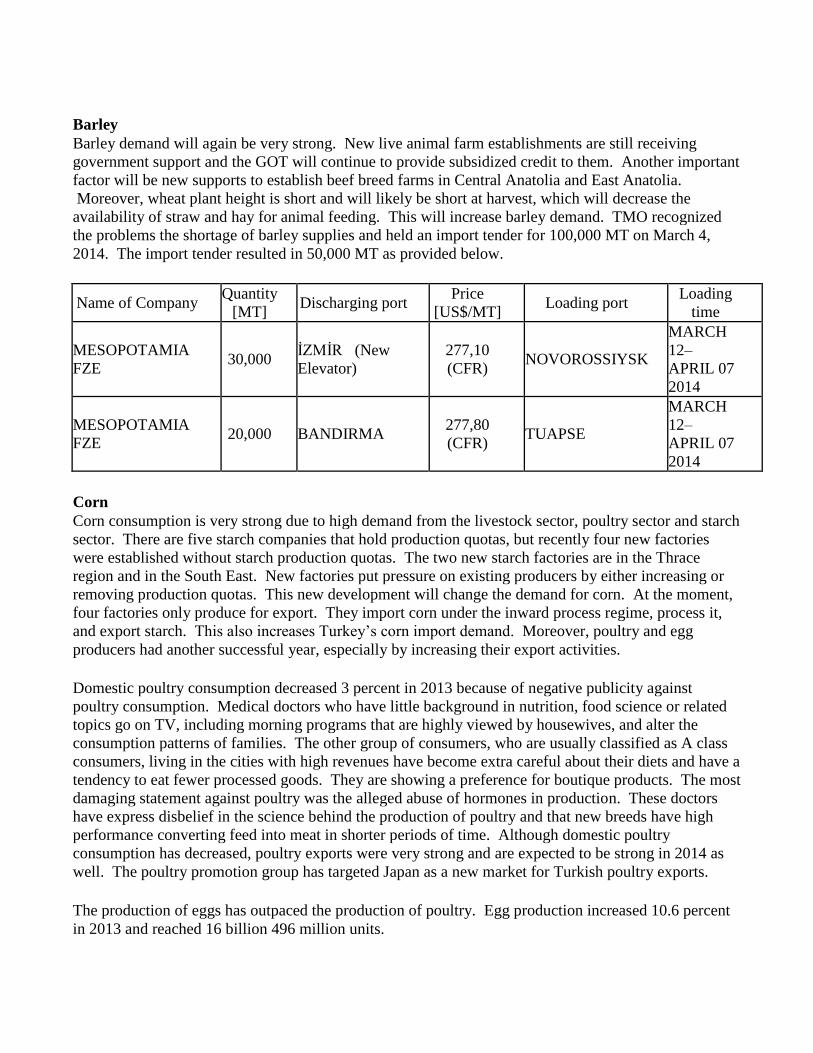
availability of straw and hay for animal feeding. This will increase barley demand. TMO recognized
the problems the shortage of barley supplies and held an import tender for 100,000 MT on March 4,
2014. The import tender resulted in 50,000 MT as provided below.
Name of Company Quantity
[MT] Discharging port
Price
[US$/MT] Loading port
Loading
time
MESOPOTAMIA
FZE 30,000
İZMİR (New
Elevator)
277,10
(CFR) NOVOROSSIYSK
MARCH
12–
APRIL 07
2014
MESOPOTAMIA
FZE 20,000 BANDIRMA
277,80
(CFR) TUAPSE
MARCH
12–
APRIL 07
2014
Corn
Corn consumption is very strong due to high demand from the livestock sector, poultry sector and starch
sector. There are five starch companies that hold production quotas, but recently four new factories
were established without starch production quotas. The two new starch factories are in the Thrace
region and in the South East. New factories put pressure on existing producers by either increasing or
removing production quotas. This new development will change the demand for corn. At the moment,
four factories only produce for export. They import corn under the inward process regime, process it,
and export starch. This also increases Turkey’s corn import demand. Moreover, poultry and egg
producers had another successful year, especially by increasing their export activities.
Domestic poultry consumption decreased 3 percent in 2013 because of negative publicity against
poultry consumption. Medical doctors who have little background in nutrition, food science or related
topics go on TV, including morning programs that are highly viewed by housewives, and alter the
consumption patterns of families. The other group of consumers, who are usually classified as A class
consumers, living in the cities with high revenues have become extra careful about their diets and have a
tendency to eat fewer processed goods. They are showing a preference for boutique products. The most
damaging statement against poultry was the alleged abuse of hormones in production. These doctors
have express disbelief in the science behind the production of poultry and that new breeds have high
performance converting feed into meat in shorter periods of time. Although domestic poultry
consumption has decreased, poultry exports were very strong and are expected to be strong in 2014 as
well. The poultry promotion group has targeted Japan as a new market for Turkish poultry exports.
The production of eggs has outpaced the production of poultry. Egg production increased 10.6 percent
in 2013 and reached 16 billion 496 million units.
Total poultry production increased to 1.9 MMT in 2014 and is expected to increase to 2 MMT in 2014.
In 2014, poultry exporters target 1.2 MMT in exports. Domestic poultry consumption was 20 kg in
2014 and is expected to increase to 25 kg by 2023.
Rice
Rice consumption is very sensitive to price fluctuations. With the U.S. dollar’s recent gains against the
Turkish Lira (TL), rice consumption in the last four months declined and consumers switched to wheat.
Rice is commonly used to make either pilaf or stuffed vegetables. Rice has not been Turkish
consumers’ first choice for meals and very quick to switch to other commodities.
The price of Osmancik rice increased from 2 TL in December, 2013 to 3.5 TL in March 2014.
Trade:
In general, all commodity trade has been very slow since the beginning of 2014, and traders hope to
have better trade opportunities in April and later on. The major problem is the drop in value of the TL
against other currencies. Moreover, local elections in March and Presidential Elections in August have
created concerns about the business environment. At the moment, traders would at least like to wait
until the results of local elections before they begin to purchase commodities.
Wheat trade is slow at the moment. There are two major problems in front of wheat trade. One is the
major supplier, Russia, is reluctant to offer prices to buyers. The second problem is that buyers are also
reluctant to purchase wheat if prices are less favorable. Russian traders are also waiting to see the
impact of drought conditions in Turkey.
Russian wheat prices offered to Turkey at the moment are 310 USD/MT for 14.5 percent protein and
295 USD/MT 13.5 percent and 285 USD for 13 percent protein.
Import permit licenses under the inward processing regime are 75 USD at the moment. They were sold
at 90 USD 4 months ago.
Wheat stocks at the ports are not very strong at the moment, and more trade is expected in April.
The domestic wheat price is very high at the moment. The price of Anatolian red wheat is between 910-
935 TL/MT, and the price of feed type wheat was 750 TL/MT at the Polatli Commodity Exchange on
March 27, 2014. Prices are not only high for wheat, but also for bran which is at 670 TL/MT.
The price of barley is at 670 TL/MT, and the price of corn is at 700 TL/MT. Surprisingly, most traders
expect prices to increase on grain. Traders believe that there is still a price margin, especially for raw
feed materials.
The grain trade in Turkey mostly depends on keeping stocks until the end of price margins. Farmers
have already sold their stocks and most stocks are in the hands of either TMO or traders.
TMO has been very active constructing new elevators. TMO has almost already completed the
construction of 300,000 MT of new grain elevators, started 120,000 MT of new elevator construction,
and projected 150,000 MT of elevator construction in 2014. Grain elevator construction has been very
active within the last 4 years. More than 1.5 MMT of new grain elevator capacity was constructed
during this term and there are still a lot new projects. This will increase the trading capacity of Turkey
domestically and internationally.
Policy:
The GOT continues to support the livestock sector through subsidized credit and premium supports.
The livestock sector’s high growth rate is due to subsidized credit. The government decreased interest
rates from 59 percent in 2003 to 8.25 percent in 2014. The government gave 7.5 billion TL at zero
interest rate credit to the livestock sector between2010 and 2014.
The main problem facing the livestock sector is the low farm gate milk price. Most milk is sold at 0.7-
0.8 TL/liter (LT) and the retail UHT milk price is 2.5 TL/LT.
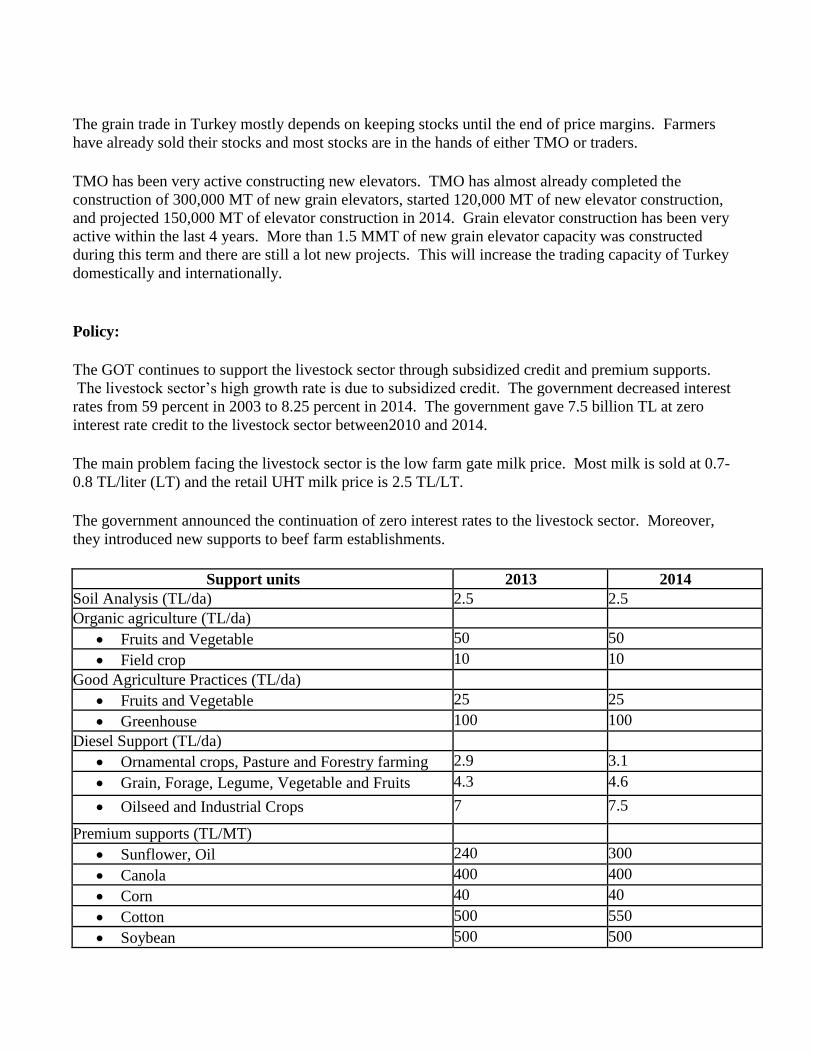
The government announced the continuation of zero interest rates to the livestock sector. Moreover,
they introduced new supports to beef farm establishments.
Support units 2013 2014
Soil Analysis (TL/da) 2.5 2.5
Organic agriculture (TL/da)
Fruits and Vegetable 50 50
Field crop 10 10
Good Agriculture Practices (TL/da)
Fruits and Vegetable 25 25
Greenhouse 100 100
Diesel Support (TL/da)
Ornamental crops, Pasture and Forestry farming 2.9 3.1
Grain, Forage, Legume, Vegetable and Fruits 4.3 4.6
Oilseed and Industrial Crops 7 7.5
Premium supports (TL/MT)
Sunflower, Oil 240 300
Canola 400 400
Corn 40 40
Cotton 500 550
Soybean 500 500

Wheat, Barley, Oat, Rye 50 50
Safflower 450 450
Olive Oil 700 700
Paddy rice, dry bean, chick pea, lentil 100 100
Tea 120 120
Livestock supports
Feed crop supports (TL/da)
Alfa Alfa 50 50
Sainfoin 40 40
Silage crops 50 50
Silage corn (irrigated) 75 75
Silage corn (dry land) 35 35
Artificial pasture and meadows 100 100
Milk premium (TL/LT)
Big animals (cattle etc) MINFAL will
determine
MINFAL will
determine
Small animals (sheep etc) 0.2 0.2
Water Buffalo 0.2 0.2
Live animal premiums (per head)
Cattle 225 225
Water Buffalo 350 400
Cattle (registered to herdbook, additional
premium)
60 60
Beef breeds 350 350
Disease free ranches 300 375
Approved milk producer ranches (additional premium)
(TL/head)
50 50
Feeder cattle 300 300
Sheep and Goat 20 20
Feeder cattle production in development program
regions (TL/head
Cattle Brood stock 350
Calf 150
Ranch Manager 8,000
Certified seed use (TL/ha)
Wheat 75 75
Alfa Alfa 75 80
Barley 80 80
Paddy rice, Peanut 100 100
Chick pea, Lentil, Dry bean 40 40
Potato 400 400
Soybean 200 200
Sainfoin 50 50
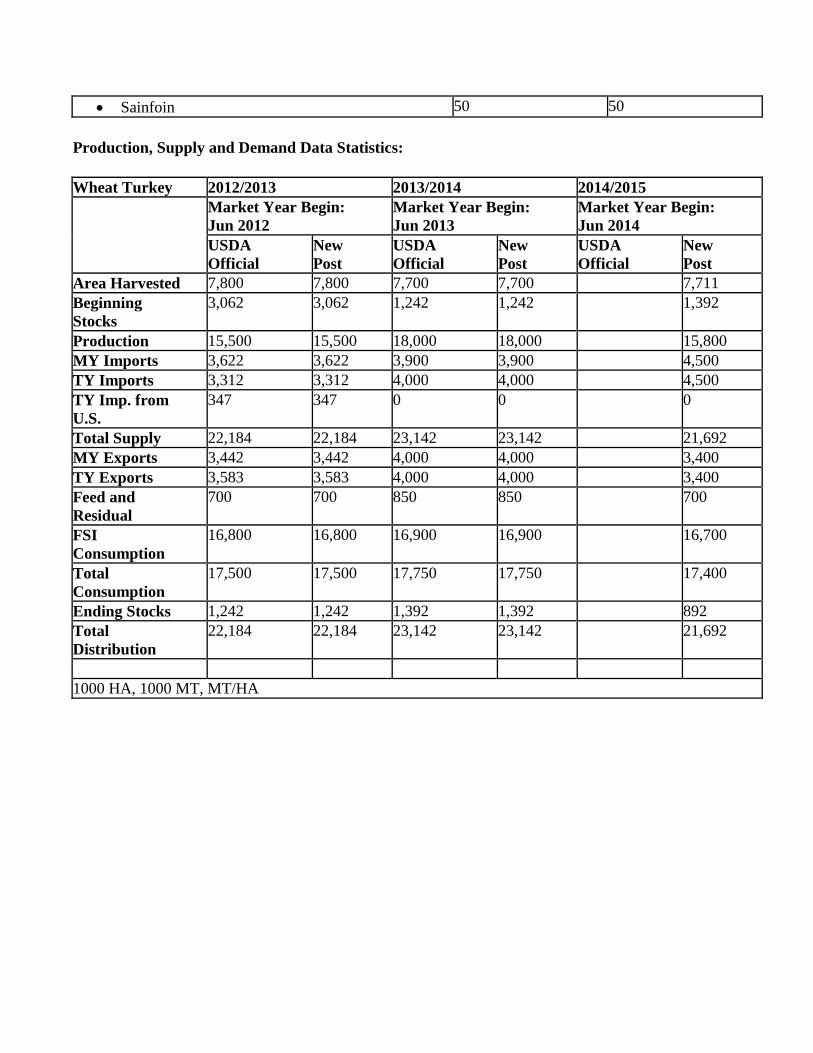
Production, Supply and Demand Data Statistics:
Wheat Turkey 2012/2013 2013/2014 2014/2015
Market Year Begin:
Jun 2012
Market Year Begin:
Jun 2013
Market Year Begin:
Jun 2014
USDA
Official
New
Post
USDA
Official
New
Post
USDA
Official
New
Post
Area Harvested 7,800 7,800 7,700 7,700 7,711
Beginning
Stocks
3,062 3,062 1,242 1,242 1,392
Production 15,500 15,500 18,000 18,000 15,800
MY Imports 3,622 3,622 3,900 3,900 4,500
TY Imports 3,312 3,312 4,000 4,000 4,500
TY Imp. from
U.S.
347 347 0 0 0
Total Supply 22,184 22,184 23,142 23,142 21,692
MY Exports 3,442 3,442 4,000 4,000 3,400
TY Exports 3,583 3,583 4,000 4,000 3,400
Feed and
Residual
700 700 850 850 700
FSI
Consumption
16,800 16,800 16,900 16,900 16,700
Total
Consumption
17,500 17,500 17,750 17,750 17,400
Ending Stocks 1,242 1,242 1,392 1,392 892
Total
Distribution
22,184 22,184 23,142 23,142 21,692
1000 HA, 1000 MT, MT/HA
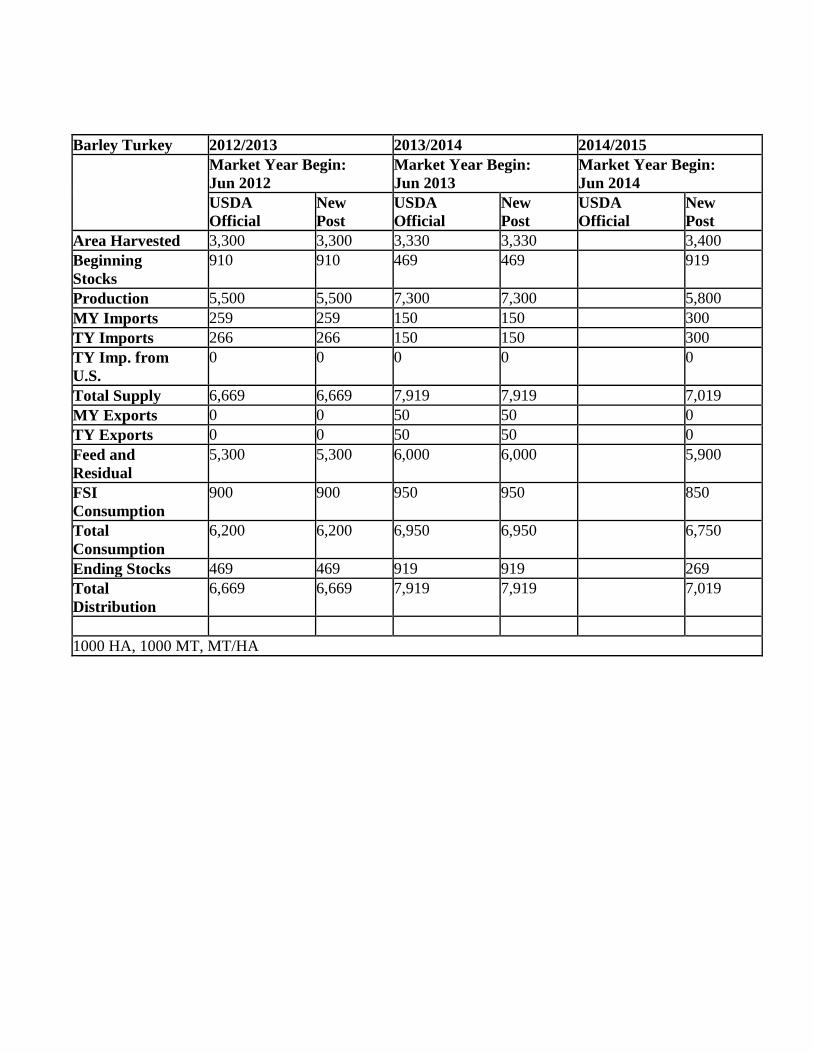
Barley Turkey 2012/2013 2013/2014 2014/2015
Market Year Begin:
Jun 2012
Market Year Begin:
Jun 2013
Market Year Begin:
Jun 2014
USDA
Official
New
Post
USDA
Official
New
Post
USDA
Official
New
Post
Area Harvested 3,300 3,300 3,330 3,330 3,400
Beginning
Stocks
910 910 469 469 919
Production 5,500 5,500 7,300 7,300 5,800
MY Imports 259 259 150 150 300
TY Imports 266 266 150 150 300
TY Imp. from
U.S.
0 0 0 0 0
Total Supply 6,669 6,669 7,919 7,919 7,019
MY Exports 0 0 50 50 0
TY Exports 0 0 50 50 0
Feed and
Residual
5,300 5,300 6,000 6,000 5,900
FSI
Consumption
900 900 950 950 850
Total
Consumption
6,200 6,200 6,950 6,950 6,750
Ending Stocks 469 469 919 919 269
Total
Distribution
6,669 6,669 7,919 7,919 7,019
1000 HA, 1000 MT, MT/HA
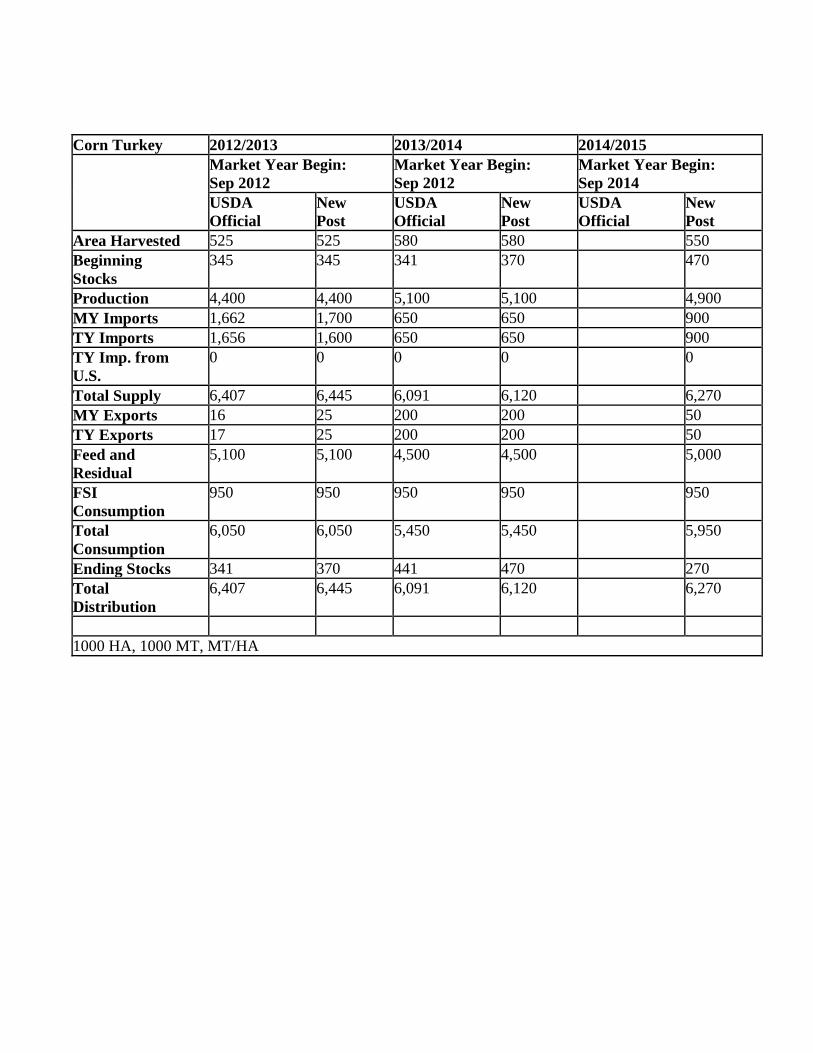
Corn Turkey 2012/2013 2013/2014 2014/2015
Market Year Begin:
Sep 2012
Market Year Begin:
Sep 2012
Market Year Begin:
Sep 2014
USDA
Official
New
Post
USDA
Official
New
Post
USDA
Official
New
Post
Area Harvested 525 525 580 580 550
Beginning
Stocks
345 345 341 370 470
Production 4,400 4,400 5,100 5,100 4,900
MY Imports 1,662 1,700 650 650 900
TY Imports 1,656 1,600 650 650 900
TY Imp. from
U.S.
0 0 0 0 0
Total Supply 6,407 6,445 6,091 6,120 6,270
MY Exports 16 25 200 200 50
TY Exports 17 25 200 200 50
Feed and
Residual
5,100 5,100 4,500 4,500 5,000
FSI
Consumption
950 950 950 950 950
Total
Consumption
6,050 6,050 5,450 5,450 5,950
Ending Stocks 341 370 441 470 270
Total
Distribution
6,407 6,445 6,091 6,120 6,270
1000 HA, 1000 MT, MT/HA
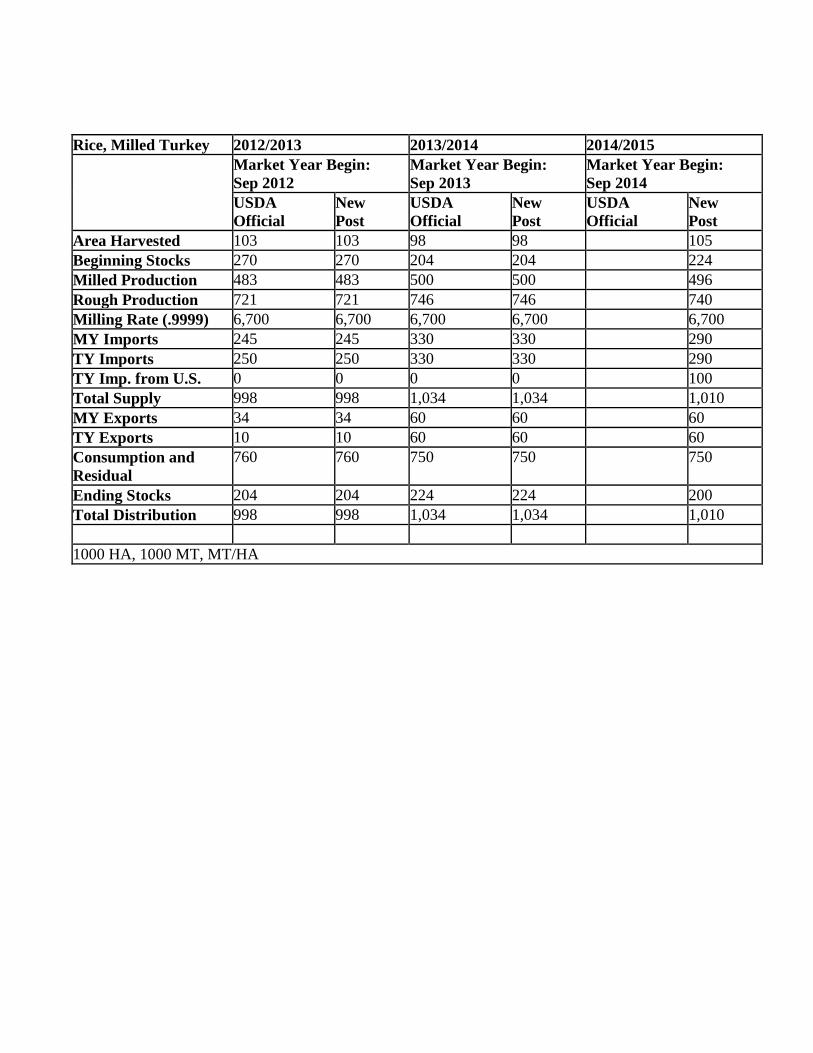
Rice, Milled Turkey 2012/2013 2013/2014 2014/2015
Market Year Begin:
Sep 2012
Market Year Begin:
Sep 2013
Market Year Begin:
Sep 2014
USDA
Official
New
Post
USDA
Official
New
Post
USDA
Official
New
Post
Area Harvested 103 103 98 98 105
Beginning Stocks 270 270 204 204 224
Milled Production 483 483 500 500 496
Rough Production 721 721 746 746 740
Milling Rate (.9999) 6,700 6,700 6,700 6,700 6,700
MY Imports 245 245 330 330 290
TY Imports 250 250 330 330 290
TY Imp. from U.S. 0 0 0 0 100
Total Supply 998 998 1,034 1,034 1,010
MY Exports 34 34 60 60 60
TY Exports 10 10 60 60 60
Consumption and
Residual
760 760 750 750 750
Ending Stocks 204 204 224 224 200
Total Distribution 998 998 1,034 1,034 1,010
1000 HA, 1000 MT, MT/HA